Abstract
Moderately thermophilic (Tmax, ~55 °C) methanogens are identified after extended enrichments from temperate, tropical and low-temperature environments. However, thermophilic methanogens with higher growth temperatures (Topt ≥ 60 °C) are only reported from high-temperature environments. A microcosm-based approach was used to measure the rate of methane production and methanogen community structure over a range of temperatures and salinities in sediment from a temperate estuary. We report short-term incubations (<48 h) revealing methanogens with optimal activity reaching 70 °C in a temperate estuary sediment (in situ temperature 4–5 °C). While 30 °C enrichments amended with acetate, H2 or methanol selected for corresponding mesophilic trophic groups, at 60 °C, only hydrogenotrophs (genus Methanothermobacter) were observed. Since these methanogens are not known to be active under in situ temperatures, we conclude constant dispersal from high temperature habitats. The likely provenance of the thermophilic methanogens was studied by enrichments covering a range of temperatures and salinities. These enrichments indicated that the estuarine sediment hosted methanogens encompassing the global activity envelope of most cultured species. We suggest that estuaries are fascinating sink and source environments for microbial function study.
1. Introduction
Methane (CH4) is an important greenhouse gas, with a global warming potential over 100 years (GWP100) between 28 and 36 times that of carbon dioxide (CO2). It also contributes to global biogeochemical cycles [1,2] and is an important energy resource [3]. Methane is mainly produced biogenically [1], by methanogens, which provide a terminal process in the anaerobic degradation of organic matter.
In temperate, tropical and high-latitude environments at low in situ temperatures, methane production is generally dominated by mesophilic methanogens, carrying out acetate fermentation (acetoclastic methanogenesis). When acetoclastic methanogenesis is inhibited, or in situ temperatures are increased, carbon dioxide reduction coupled to hydrogen oxidation plays an increasingly important role (hydrogenotrophic methanogenesis) [4].
Although thermophilic methanogens are found in extreme environments such as hot undersea mud volcanoes, hydrothermal vent sediments, or deeply buried in the Earth’s sub-surface (Topt ranging from 50 to 98 °C) [5], they are not ubiquitous [6,7,8,9]. Many enrichment studies of flooded soils, wetlands and sediments have shown that above in situ temperatures, distinct populations of moderately thermophilic methanogens (hydrogenotrophic methanogens: Topt ~40–50 °C, Tmax ~55 °C) become active after long lag phases (i.e., of weeks to months) [4,10,11,12,13,14,15,16], implying that these moderately thermophilic methanogens are minor inactive components of the in situ communities, potentially recruited by passive dispersal [17].
Estuaries play a unique interconnecting role between the terrestrial and marine environment [18]. They have been used to study the influence of environmental perturbation on in situ microbial community diversity, and function for specific microbial processes, including methanogenesis [19,20,21] and methanotrophy [18]. Interest is often primarily because, along with fjords and shallow coastal areas, estuaries are thought to contribute up to 75% of the marine global flux of methane to the atmosphere [22], despite making up only 16% of the total ocean surface area [23]. Therefore, in the future, estuaries may become more important methane source environments due to climatic and land use change enhancing nutrient and organic matter flow to them [24]. Many studies of methanogenesis indicate that the limits of methanogenic activity reach beyond those encountered under, or predicted for, in situ conditions [6,7,8,9,10,11,12,13]. Having previously identified aerobic methanotrophs with environmental tolerances for growth far beyond those encountered in situ in temperate estuarine sediments [18], we hypothesised that the methanogenic community may encompass a wide range of environmental tolerance (related to, but not necessarily limited by, environmental conditions and inputs from source environments). On this basis, we investigated the range and upper limits of methanogenesis in a temperate estuary.
2. Materials and Methods
Sediment samples were taken from the Scotswood site, Tyne estuary, UK (54°58′47″ N 1°44′35″ W), using a 1 m length, 20 cm diameter perspex core. Membrane Inlet Mass Spectroscopy (MIMS) was used to qualitatively identify the in situ depth of the CH4 maximum. A quadrapole mass spectrometer (HAL3F-RC, HPR20, Hiden, Warrington, UK) was attached to an 8-way HPR40 inlet manifold, linked to 1 m stainless-steel gas inlet capillary tubes (Probe: 1.6 mm o.d, 0.5 mm i.d). The final centimetre of each probe was enclosed in a 100 μm thick silicone rubber sleeve (gas permeable membrane) overlying 4 rows of 1 mm diameter, pre-drilled holes. The gas permeability of this membrane enabled the (non-selective) diffusion of gases from the sample to the quadrapole mass spectrometer under a vacuum (created by a rotary vacuum pump, E2MI.5; Boc Edwards, UK). The mass to charge ratios of characteristic positive ions of the gases of interest (i.e., CH4 and Ar) were measured simultaneously and the output presented as a proportion of the total gas pressure (Torr) using the MA soft 5.8 software package (Hiden, Warrington, UK). The probe was positioned at the lowest part of the intact sediment core, a stable gas reading was taken and the probe was moved upwards by 5 cm. This process was repeated until the probe reached the upper region of the sediment, at this point 1–2 cm increments were made. For the simple purpose of identifying methane maxima, mass selective measurements (Torr) were corrected for matrix effects using conservative gas readings, i.e., Ar, by converting the raw gas readings into a ratio of CH4/Ar. The core was then sectioned under anoxic conditions (extruded into a glove box under a positive pressure of oxygen-free nitrogen). Sediment from the CH4 maximum (10–14 cm) was homogenised and refrigerated (4–5 °C) under anoxic conditions until microcosm set-up.
Triplicate microcosms (12 mL volume) were set up as in reference [6], with sulfate-free anaerobic enrichment medium (1 mL), homogenised sediment (0.5–1.0 g), and amended with methanogenic substrates, i.e., acetate (final concentration 10 mM), methanol (final concentration 10 mM), or H2/CO2 (4:1 in headspace 10 mL), alongside triplicate unamended controls. Multiple sets of these microcosms were set up and incubated for 50 days at temperatures of 5, 20, 30, 40, 50, 60 and 70 °C Additional control microcosms were treated with 2-bromoethane sulphonate (BES; 10 mM final concentration) and incubated at 30 °C. Additional sets of microcosms were similarly set up at 30 and 60 °C amended with NaCl medium (1, 15, 28, 46, 82, 114 and 137 NaCl g/L). Headspace methane was measured periodically using a Carlo ERBA HRGC 5160 GC-FID fitted with a Chrompak PLOT fused silica capillary column (30 m × 0.32 mm) using helium as a carrier gas. CH4 was quantified on the basis of peak area and calibrated using CH4 standards (Scientific and Technical Gases Ltd., Newcastle-under-Lyme, UK). Please note that methane production in the BES (2-bromoethane sulphonate; 10 mM final concentration) controls was not measurable. After 50 days, triplicate sets of microcosms were sacrificed for microbial community analysis. Rates of methanogenesis were calculated from the linear accumulation of methane per gram of sediment dry mass (DM). For the temperature experiment rates were calculated from the initial 7 day period of incubation. and for the salinity experiment were based on the maximum rate of accumulation. Rates of amended and unamended microcosms were compared statistically by one-way analysis of variance (ANOVA; Minitab 17, Minitab Ltd., Coventry, UK).
Triplicate microcosms sacrificed for molecular analysis were stored at −20 °C prior to DNA extraction. Extractions were carried out on each of the triplicate microcosm slurries (~0.25 mL) using a FastPrep Ribolyser (Hybaid Ltd., Hampshire, UK) and a BIO 101 FastDNA Spin Kit (for soil; Q-BioGene, Cambridge, UK), according to the manufacturer’s instructions. DNA was quantified using a Qubit® dsDNA HS Assay Kit (Life Technologies, Carlsbad, CA, USA). The procedure stated in reference [25] was followed for microbial community structure analysis. Specifically, primer set F515/R926 [26] was used to PCR amplify the variable V4/V5 region of the archaeal and bacterial 16S rRNA gene. Primer F515 in addition to the target sequence also contained a PGM™ (Personal Genome Machine) linker primer/adapter, a Golay barcode (unique for each sample amplification) and a barcode spacer. R926 contained a truncated P1 (TrP1) adapter at the 5′ end [27]. Reactions were carried out using Bioline’s TaqMan DNA amplification kit (Bioline, UK) with conditions of 95 °C for 3 min followed by 30 cycles (1 min at 95 °C, 45 s at 55 °C, 1 min at 72 °C) and finally, 10 min at 72 °C. Amplicons were purified using an Agencourt Ampure XP purification Kit (Beckman Coulter Ltd., High Wycombe, UK) and quantified using a Qubit® dsDNA HS Assay Kit (Life Technologies, USA). Amplicons were then pooled into an equimolar library of 500 pM DNA. Sequencing templates were generated by attaching the DNA samples to ion sphere particles using the Ion PGM™ Template OT2 400 kit (Life Technologies, USA), based on the manufacturer’s instruction, and using the Ion OneTouch™ 2 Instrument and the Ion OneTouch™ ES (Enrichment System). Sequencing was performed using the PGM™ sequencing Platform with the Ion PGM™ sequencing 400 kit followed by filtering to remove low-quality and polyclonal sequences. Data was analysed by the Qiime2 (Quantitative Insights into Microbial Ecology 2) pipeline (https://qiime2.org/) [28] to trim and cluster sequences into amplicon sequence variants (ASVs), assign taxonomies and generate representative sequence and ASV frequency outputs. Sequences have been deposited in the NCBI’s Sequence Read Archive (SRA) available under Bio Project PRJNA577052. Statistical Analysis of taxonoMic and functional Profiles (STAMP v2) [29] was used to compare taxonomic profiles between treatment groups and carry out Principle Component Analysis (PCA). Phylogenetic distance analysis was conducted using the Jukes–Cantor correction for multiple substitutions at a single site and the neighbour joining method using MEGA version 7.0 [30].
3. Results and Discussion
Methane production was measured in both low- (5–30 °C) and high (40–70 °C)-temperature River Tyne incubations after 48 h. In this time period, methane accumulation in unamended microcosms was low (e.g., reaching 0.74 ± 0.15 μmol CH4 g sediment (DM) at 20 °C, and 0.01 ± 0.005 μmol CH4 g sediment (DM) at 60 °C). Addition of methanogenic substrates resulted in increased methane accumulation (compared to unamended microcosms) at both these temperatures. This increase was particularly pronounced in H2/CO2 amended microcosms incubated at high temperatures (where in the first 48 h, methane accumulated to 32.38 ± 13.29 μmol CH4 g sediment (DM) at 60 °C). This response is in contrast with previous studies [10,11,12,13,14,15,16,31,32] where incubation of sediment/soil for an extended period of time, i.e., weeks to months, was required for the measurement of high-temperature methane production.
When methane production rates were calculated (days 2–7), clear broad (potentially bimodal) optima (Topt) at these low- (5–40 °C for acetate and methanol amended microcosms and 30–40 °C for H2/CO2 amended microcosms) and high (50–70 °C for acetate and methanol amended microcosms and 50–70 °C for H2/CO2 amended microcosms)-temperature ranges existed (Figure 1). At high temperatures (≥50 °C), methanogenesis rates were greatest with H2/CO2 relative to unamended controls (pairwise comparisons, p < 0.05 at 50–70 °C).
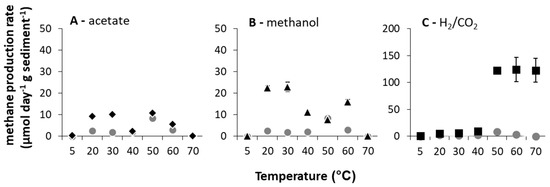
Figure 1.
Methane production rates calculated between days 2 and 7 of incubation (μmol CH4 g−1 d−1 sediment (DM) ± SE (standard error), n = 3) over the incubation temperature range of 5 to 70 °C with methanogenic substrate addition ((A) acetate = black diamonds, (B) methanol = black triangles, (C) H2/CO2 = black squares), and without substrate amendment = grey circles).
This response is partially consistent with studies of lake sediment [4,10,16] and rice paddy field samples [11,13,32,33,34] incubated at elevated temperatures (i.e., ≤50 °C). In such studies, hydrogenotrophic methanogenesis was most enhanced in incubations above 40 °C and often found exclusively responsible for methane production [34], consistent with predictions for the influence of temperature [35]. In the River Tyne, though, the upper limit of methanogenesis was above 70 °C, the Topt spanned 50–70 °C and the maximum rates of methanogenesis were the highest reported from any temperate enrichment (i.e., 121 ± 1.88 μmol CH4 g−1 sediment (DM) d−1 at 50 °C and 123 ± 22.32 μmol CH4 g−1 sediment (DM) d−1 at 70 °C when amended with H2/CO2). In fact, only one other study of methane production from a low-temperature natural environment (Lake Baldegger, in situ temperature 4–5 °C) has reported any methane production at 70 °C [16], after 30 days of incubation.
At 30 °C, different substrates ammendmentsselected for the different methanogenic archaeal communities. At 60 °C, this was not the case (Figure 2).
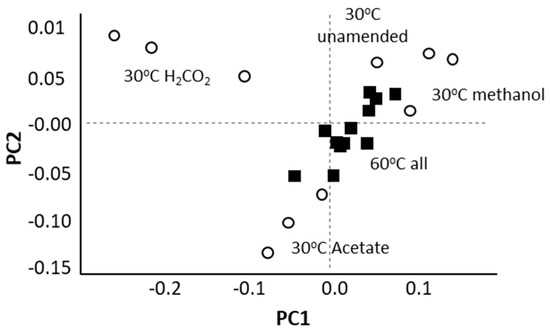
Figure 2.
A Principal Component Analysis (PCA) based on an analysis of archaeal ASV (amplicon sequence variants) frequencies within 16S rRNA sequence libraries constructed from methanogenic enrichments indicates that archaeal communities were distinct based on substrate amendment at 30 °C (white circles) but not at 60 °C (black squares).
At 30 °C, methanol and H2/CO2 enriched for the methylotrophic (Methanolobus) and hydrogenotrophic (Methanobrevibacter) genera respectively (Figure 3 and Figure 4), and acetate enriched Methanosarcina. Consistent with the metabolic flexibility of this genus, Methanosarcina sequences were recovered from all incubations irrespective of substrate amendment (Figure 3). In contrast, hydrogenotrophic Methanothermobacter [36] were enriched in all 60 °C microcosms but were absent at 30 °C (Figure 3 and Figure 4). However, Methanothermobacter must have been present and viable initially in appreciable numbers to explain the short lag phases observed prior to detection of methanogenesis (<48 h in all high-temperature microcosms). Close relatives of the Methanothermobacter, not surprisingly, have been identified in, or have been isolated from, high-temperature environments (temperature range 50–70 °C), including sewage sludge, thermophilic anaerobic digesters, high-temperature oil field production waters (Figure 4), hot springs and solfatara [37]. However, close matches were also found with sequences recovered from moderately low-temperature systems (temperature range 5–40 °C), including lake sediments, temperate and tropical soils and sediments, mesophilic anaerobic digesters, cattle manures, composts and sediment from an artificial lake (Figure 4). Critically, studies of cold environments had not explicitly targeted or mentioned these thermophilic methanogens or their activities.
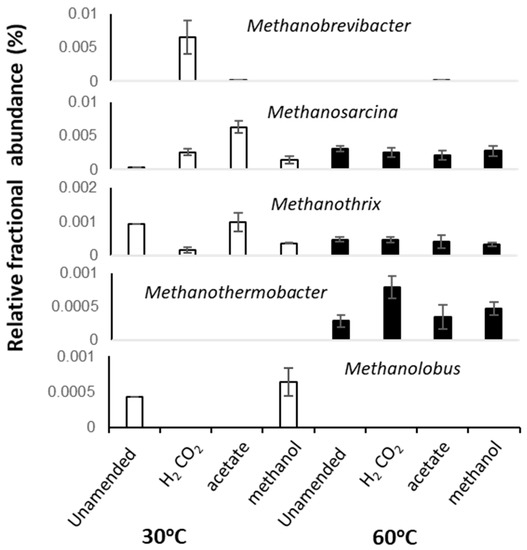
Figure 3.
Average fractional abundances of selected dominant archaeal taxa identified in 16S rRNA sequence libraries from replicated 30 and 60 °C methanogenic enrichment microcosm. Error bars represent 1 × SE (n = 3).
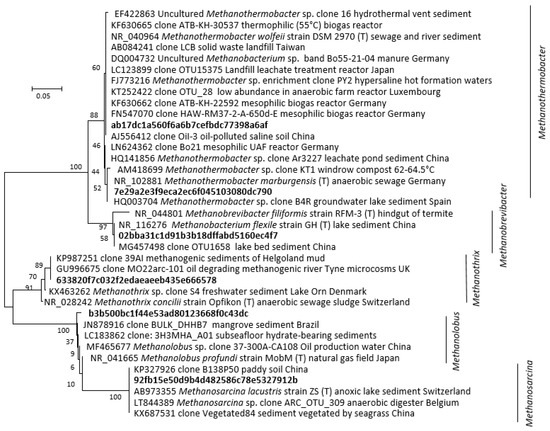
Figure 4.
Phylogenetic distance tree (Neighbour-Joining) of key archaeal 16S rRNA amplicon sequence variants (ASVs) identified in the methanogenic microcosm and their close relatives. The tree was inferred from 248 positions. Individual codes for ASVs were assigned during pipeline analysis. The percentage of replicate trees in which the associated taxa clustered together in bootstrap analysis (1000 replicates) are shown next to the branches.
It has been proposed that the viability of such ‘extreme thermophilic species’ in low-temperature environments may result from low minimum growth temperatures (22 °C) [38]. Certainly, a Methanothermobacter sp. that dominated an enrichment culture from a high-temperature oil field water production [39] (Figure 4) after transport and 4 °C storage for months demonstrated that at least some remain viable following inactivity at low temperatures. Regardless, the short lag phases observed in the current study (<48 h) suggest constant replenishment of Methanothermobacter into the Tyne estuary sediment, from terrestrial or marine sources, e.g., landfill, hot geological, industrial, or agricultural habitats [40]. Given the likely passive dispersal from these sources [41,42], we attempted to resolve their mesophilic and thermophilic origins by determining salinity tolerances as a secondary niche dimension (Figure 5A). These tolerances were then compared with those of cultured methanogens for which both temperature and salinity ranges have been reported (Figure 5B) [5].
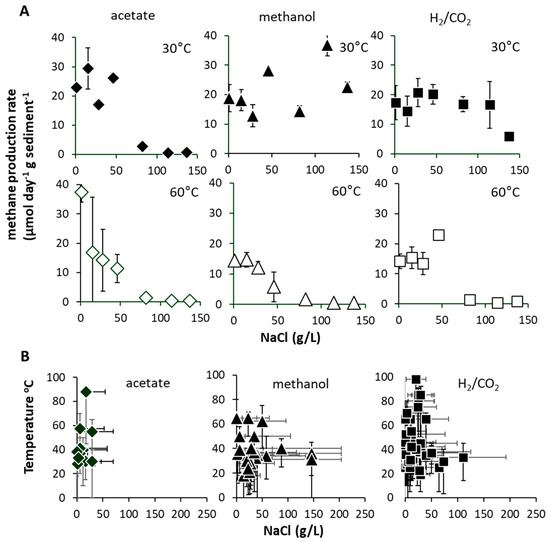
Figure 5.
(A) Maximum methane production rates (μmol CH4 g−1 d−1 sediment (DM) ± SE, n = 3) at 30 and 60 °C (with substrate addition, acetate = white diamonds, methanol = white triangles, H2/CO2 = white squares) when incubated with 1 to 137 g/L NaCl. (B) Summary of global cultured methanogen temperature vs. NaCl optimum and range (indicated by acetate = black diamonds, methanol = black triangles, H2/CO2 = black squares). Data in (B) sourced from reference [5].
We found no strong evidence for low-salinity source environments, and surprisingly, found that the Tyne estuary methanogens actually exhibited tolerances and optima similar to those determined collectively for all cultured methanogens. Specifically, 30 °C mesophilic hydrogenotrophic and methylotrophic methanogens showed high-salinity tolerances (≤137 gL NaCl), but acetoclastic methanogens did not (≤50 gL NaCl, Figure 5A) [43]. In contrast, 60 °C Thermophilic hydrogenotrophic, methylotrophic and acetoclastic methanogens were all limited to <50 gL NaCl. This pattern aligns with the global inventory of thermophilic methanogens (Topt > 40 °C), which generally show moderate salinity tolerances (e.g., average NaClopt 14.6 gL, average NaClmax 45 gL) (Figure 5B) [5], and suggests that the Tyne estuary mesophilic and thermophilic methanogen communities encompass close to the full global range of salinity tolerance for this group of organisms.
In the face of global challenges such as climate change, energy production and food security, there are increasing calls for ”coordinated, cross-disciplinary efforts to understand, predict and harness microbiome function” [44]. However, harnessing the potential of the global microbiome requires understanding of the range of function the microbiome can offer and the most interesting and useful sites for investigation. Exploration of extreme environments has been pivotal in uncovering microorganisms with exploitable function, but fewer studies have focused on understanding the full microbial potential of more accessible environments. This enrichment study, when considered alongside a recent meta-analysis of DNA-based global estuarine archaeal biodiversity studies [45], builds a picture of estuarine sediments holding unexpectedly broad, demonstrably viable archaeal function, and unexpectedly rich archaeal biodiversity (spanning the rare to the ubiquitous) [45]. Estuaries, therefore, are potentially useful microbial sink and source environments of microbial function.
Author Contributions
Conceptualization, L.I.B., N.D.G., A.S. and I.M.H.; methodology, L.I.B., N.D.G., O.K.M., A.S., H.C. and P.L.; formal analysis, L.I.B., N.D.G., O.K.M., A.S., H.C. and P.L.; resources, I.M.H., N.D.G. and L.I.B.; writing—original draft preparation, L.I.B. and N.D.G.; writing—review and editing, A.S., W.S., I.M.H., L.I.B. and N.D.G.; visualization, N.D.G., P.L., H.C., A.S., W.S. and L.I.B. All authors have read and agreed to the published version of the manuscript.
Funding
This research was funded by an Engineering and Physical Sciences Research Council Ph.D. scholarship (EP/P502624/1) awarded to L.I.B. and Newcastle University, and by a Daphne Jackson Fellowship awarded to L.I.B. by Durham University, and a Natural and Environmental Research Council grant (NE/E01657X/1) awarded to I.M.H.
Acknowledgments
The authors gratefully acknowledge Ian Harrison, Paul Donohoe and Bernard Bowler for their technical assistance.
Conflicts of Interest
The authors declare no conflict of interest. The funders had no role in the design of the study; in the collection, analyses, or interpretation of data; in the writing of the manuscript, or in the decision to publish the results.
References
- IPCC. Climate Change 2013–The Physical Science Basis; Intergovernmental Panel on Climate Change, Ed.; Cambridge University Press: Cambridge, UK, 2014; p. 509. [Google Scholar] [CrossRef]
- Cicerone, R.J.; Oremland, R.S. Biogeochemical aspects of atmospheric methane. Glob. Biogeochem. Cycles 1988, 2, 299–327. [Google Scholar] [CrossRef]
- Kan, S.Y.; Chen, B.; Wu, X.F.; Chen, Z.M.; Chen, G.Q. Natural gas overview for world economy: From primary supply to final demand via global supply chains. Energy Policy 2019, 124, 215–225. [Google Scholar] [CrossRef]
- Conrad, R. Importance of hydrogenotrophic, aceticlastic and methylotrophic methanogenesis for methane production in terrestrial, aquatic and other anoxic environments: A mini review. Pedosphere 2020, 30, 25–39. [Google Scholar] [CrossRef]
- Jabłońsk, S.; Rodowicz, P.; Lukaszewicz, M. Methanogenic archaea database containing physiological and biochemical characteristics. Int. J. Syst. Evol. Microbiol. 2015, 65, 1360–1368. [Google Scholar] [CrossRef] [PubMed]
- Blake, L.I.; Tveit, A.; Ovreas, L.; Head, I.M.; Gray, N.D. Response of methanogens in Arctic sediments to temperature and methanogenic substrate availability. PLoS ONE 2015, 10, e0129733. [Google Scholar]
- Jerman, V.; Metje, M.; Mandic-Mulec, I.; Frenzel, P. Wetland restoration and methanogenesis: The activity of microbial populations and competition for substrate at different temperatures. Biogeosciences 2009, 6, 1127–1138. [Google Scholar] [CrossRef]
- Metje, M.; Frenzel, P. Effect of Temperature on Anaerobic Ethanol Oxidation and Methanogenesis in Acidic Peat from a Northern Wetland. Appl. Environ. Microbiol. 2005, 71, 8191–8200. [Google Scholar] [CrossRef]
- Metje, M.; Frenzel, P. Methanogenesis and methanogenic pathways in a peat from subarctic permafrost. Environ. Microbiol. 2007, 9, 954–964. [Google Scholar] [CrossRef]
- Zeikus, J.G.; Winfrey, M.R. Temperature limitation of methanogenesis in aquatic sediments. Appl. Environ. Microbiol. 1976, 1, 99–107. [Google Scholar] [CrossRef]
- Fey, A.; Conrad, R. Effect of temperature on carbon and electron flow and on the archaeal community in methanogenic rice field soil. Appl. Environ. Microbiol. 2000, 11, 4790–4797. [Google Scholar]
- Wu, X.-L.; Friedrich, M.W.; Conrad, R. Diversity and ubiquity of thermophilic methanogenic archaea in temperate anoxic soils. Environ. Microbiol. 2006, 8, 394–404. [Google Scholar] [CrossRef]
- Fey, A.; Chin, K.J.; Conrad, R. Thermophilic methanogens in rice field soil. Environ. Microbiol. 2001, 3, 295–303. [Google Scholar] [CrossRef] [PubMed]
- Kotsyurbenko, O.R.; Friedrich, M.W.; Simankova, M.V.; Nozhevnikova, A.N.; Golyshin, P.N.; Timmis, K.N.; Conrad, R. Shift from Acetoclastic to H2-dependant Methanogenesis in a West Siberian Peat Bog at low pH Values and Isolation of an Acidophilic Methanobacterium Strain. Appl. Environ. Microbiol. 2007, 73, 2344–2348. [Google Scholar] [CrossRef]
- Ganzert, L.; Jurgens, G.; Munster, U.; Wagner, D. Methanogenic communities in permafrost-affected soils of the Laptev Sea coast, Siberian Arctic, characterized by 16S rRNA gene fingerprints. FEMS Microbiol. Ecol. 2007, 59, 476–488. [Google Scholar] [CrossRef] [PubMed][Green Version]
- Nozhevnikova, A.N.; Holliger, C.; Ammann, A.; Zehnder, A.J.B. Methanogenesis in sediments from deep lakes at different temperatures (2–70 °C). Water Sci. Technol. 1997, 36, 57–64. [Google Scholar] [CrossRef]
- Angel, R.; Claus, P.; Conrad, R. Methanogenic archaea are globally ubiquitous in aerated soils and become active under wet anoxic conditions. ISME J. 2012, 6, 847–862. [Google Scholar] [CrossRef]
- Sherry, A.; Osborne, K.A.; Sidgwick, F.R.; Gray, N.D.; Talbot, H.M. A temperate river estuary is a sink for methanotrophs adapted to extremes of pH, temperature and salinity. Environ. Microbiol. Rep. 2015, 8, 122–131. [Google Scholar] [CrossRef] [PubMed]
- Carbonero, F.; Oakley, B.B.; Hawkins, R.J.; Purdy, K.J. Genotypic Distribution of a Specialist Model Microorganism, Methanosaeta, along an Estuarine Gradient: Does Metabolic Restriction Limit Niche Differentiation Potential? Environ. Microbiol. 2012, 63, 856–864. [Google Scholar] [CrossRef]
- Torres-Alvarado, M.; Fernandez, J.F.; Vives, F.R.; Varona-Cordero, F. Dynamics of the Methanogenic Archaea in Tropical Estuarine Sediments. Archaea 2013, 2013, 582646. [Google Scholar] [CrossRef] [PubMed]
- Wen, X.; Yang, S.; Horn, F.; Winkel, M.; Wagner, D.; Liebner, S. Global Biogeographic Analysis of Methanogenic Archaea Identifies Community-Shaping Environmental Factors of Natural Environments. Front. Microbiol. 2017, 8, 1339. [Google Scholar] [CrossRef]
- Bange, H.W. Nitrous oxide and methane in European coastal waters. Estuar. Coast. Shelf Sci. 2006, 70, 361–374. [Google Scholar] [CrossRef]
- Bange, H.W.; Bartell, U.H.; Rapsomaniks, S.; Andrae, M.O. Methane in the Baltic and North Seas and a reassessment of the marine emissions of methane. Glob. Biogeochem. Cycles 1994, 8, 465–480. [Google Scholar]
- Myllykangas, J.-P.; Hietanen, S.; Jilbert, T. Legacy Effects of Eutrophication on Modern Methane Dynamics in a Boreal Estuary. Estuar. Coasts 2020, 43, 189–206. [Google Scholar]
- Mejeha, O.K.; Head, I.M.; Sherry, A.; McCann, C.M.; Leary, P.; Jones, M.D.; Gray, N.D. Beyond N and P: The impact of Ni on crude oil biodegradation. Chemosphere 2019, 237, 124545. [Google Scholar] [CrossRef] [PubMed]
- Quince, C.; Lanzen, A.; Davenport, R.J.; Turnhaugh, P.J. Removing noise from pyrosequenced amplicons. BMC Bioinform. 2011, 12, 38. [Google Scholar] [CrossRef] [PubMed]
- Hamady, M.; Walker, J.J.; Harris, J.K.; Gold, N.J.; Knight, R. Error-correcting barcoded primers for pyrosequencing hundreds of samples in multiplex. Nat. Methods 2008, 5, 235–237. [Google Scholar] [PubMed]
- Bolyen, E.; Rideout, J.R.; Dillon, M.R.; Bokulich, N.A.; Abnet, C.C.; Al-Ghalith, G.A.; Alexander, H.; Alm, E.J.; Arumugam, M.; Asnicar, F.; et al. Reproducible, interactive, scalable and extensible microbiome data science using QIIME 2. Nat. Biotechnol. 2019, 37, 852–857. [Google Scholar] [CrossRef]
- Parks, D.H.; Tyson, G.W.; Hugenholtz, P.; Beiko, R.G. STAMP: Statistical analysis of taxanomic and functional profiles. Bioinformatics 2014, 30, 3123–3124. [Google Scholar]
- Shamurad, B.; Gray, N.D.; Petropoulos, E.; Tabriaz, S.; Acharya, K.; Quintela Baluja, M.; Sallis, P. Co-digestion of organic and mineral wastes for enhanced biogas production: Reactor performance and evolution of microbial community and function. Waste Manag. 2019, 87, 313–325. [Google Scholar] [CrossRef]
- Nozhevnikova, A.N.; Nekrasova, V.; Ammann, A.; Zehnder, A.J.B.; Wehrli, B.; Holliger, C. Influence of temperature and high acetate concentrations on methanogenesis in lake sediment slurries. FEMS Microbiol. Ecol. 2007, 62, 336–344. [Google Scholar] [CrossRef]
- Conrad, R.; Klose, M.; Noll, M. Functional and structural response of the methanogenic microbial community in rice field soil to temperature change. Environ. Microbiol. 2009, 11, 1844–1853. [Google Scholar] [CrossRef] [PubMed]
- Noll, M.; Klose, M.; Conrad, R. Effect of temperature change on the composition of the bacterial and archaeal community potentially involved in the turnover of acetate and propionate in methanogenic rice field soil. FEMS Microbiol. Ecol. 2010, 73, 215–225. [Google Scholar] [CrossRef] [PubMed]
- Lui, P.; Klose, M.; Conrad, R. Temperature effects on structure and function of the methanogenic microbial communities in two paddy soils and one desert soil. Soil Biol. Biochem. 2018, 124, 236–244. [Google Scholar]
- Schink, B. Energetics of Syntrophic Cooperation in Methanogenic Degradation. Microbiol. Mol. Biol. Rev. 1997, 61, 262–280. [Google Scholar] [CrossRef] [PubMed]
- Wasserfallen, A.; Nolling, J.; Pfister, P.; Reeve, J.; Conway de Macario, E. Phylogenetic analysis of 18 thermophilic Methanobacterium isolates supports the proposals to create a new genus, Methanothermobacter gen. nov., and to reclassify several isolates in three species, Methanothermobacter thermoautotrophicus comb. nov., Methanothermobacter wolfeii comb. nov., and Methanothermobacter marburgensis sp. nov. Int. J. Syst. Evol. Microbiol. 2000, 50, 43–53. [Google Scholar]
- Ding, X.; Yang, W.-J.; Min, H.; Peng, X.-T.; Zhou, H.-Y.; Lu, Z.-M. Isolation and characterization of a new strain of Methanothermobacter marburgensis DX01 from hot springs in China. Anaerobe 2010, 16, 54–59. [Google Scholar] [CrossRef]
- Wiegel, J. Temperature spans for growth: Hypothesis and discussion. FEMS Microbiol. Rev. 1990, 6, 155–169. [Google Scholar] [CrossRef]
- Gray, N.D.; Sherry, A.; Larter, S.R.; Erdmann, M.; Leyris, J.; Liengen, T.; Beeder, J.; Head, I.M. Biogenic methane production in formation waters from a large gas field in the North Sea. Extremophiles 2009, 13, 511–519. [Google Scholar] [CrossRef]
- Bell, E.; Blake, L.I.; Sherry, A.; Head, I.M.; Hubert, C.R.J. Distribution of thermophilic endospores in a temperate estuary indicate that dispersal history structures sediment microbial communities. Environ. Microbiol. 2018, 20, 1134–1147. [Google Scholar] [CrossRef]
- Peters, V.; Conrad, R. Methanogenic and other strictly anaerobic bacteria in desert soil and other oxic soils. Appl. Environ. Microbiol. 1995, 61, 1673–1676. [Google Scholar] [CrossRef]
- Gray, N.D.; Miskin, I.P.; Kornilova, O.; Curtis, T.P.; Head, I.M. Occurrence and activity of Archaea in aerated activated sludge wastewater treatment plants. Environl. Microbiol. 2002, 3, 158–168. [Google Scholar]
- Oren, A. Thermodynamic limits to life at high salt concentrations. Environ. Microbiol. 2011, 13, 1908–1923. [Google Scholar] [PubMed]
- Blaser, M.J.; Cardon, Z.G.; Cho, M.K.; Dang, J.L.; Donohue, T.J.; Green, J.L.; Knight, R.; Maxon, M.E.; Northen, T.R.; Pollard, K.S.; et al. Towards a Predictive Understanding of Earth’s Microbiomes to Address 21st Century Challenges. mBio 2016, 7. [Google Scholar] [CrossRef] [PubMed]
- Liu, X.; Pan, J.; Lui, Y.; Li, M.; Gu, J.D. Diversity and distribution of Archaea in global estuarine ecosystems. Sci. Total Environ. 2018, 637, 349–358. [Google Scholar]


© 2020 by the authors. Licensee MDPI, Basel, Switzerland. This article is an open access article distributed under the terms and conditions of the Creative Commons Attribution (CC BY) license (http://creativecommons.org/licenses/by/4.0/).