Microbial Origin of Aquaponic Water Suppressiveness against Pythium aphanidermatum Lettuce Root Rot Disease

Abstract
:1. Introduction
2. Materials and Methods
2.1. In Vitro Tests
2.1.1. Methodology
2.1.2. Statistical Analysis
2.2. In Vivo Tests
2.2.1. Lettuce Cultivation
2.2.2. Composition, Formulation, and Management of AP, CAP, and HP Waters
2.2.3. Lettuce Inoculation by P. aphanidermatum
2.2.4. Suppressiveness Measures
- 0 = 100% of healthy white roots, no discoloration;
- 1 = less than 50% of healthy light brown roots or white roots with brown apex;
- 2 = more than 50% of healthy light brown roots or white roots with brown apex;
- 3 = less than 50% of unhealthy medium brown roots with a possible decaying part;
- 4 = more than 50% of unhealthy medium brown roots with a possible decaying part;
- 5 = less than 50% of brown-black decaying or dead roots;
- 6 = more than 50% of brown-black decaying or dead roots.
2.2.5. Statistical Analysis of Suppressiveness Indexes
2.2.6. Microbiota Analysis of the First Test
Microbiota Sampling
Samples Preparation and DNA Extraction
Amplification and Sequencing
Bioinformatics and Statistical Analyses
3. Results
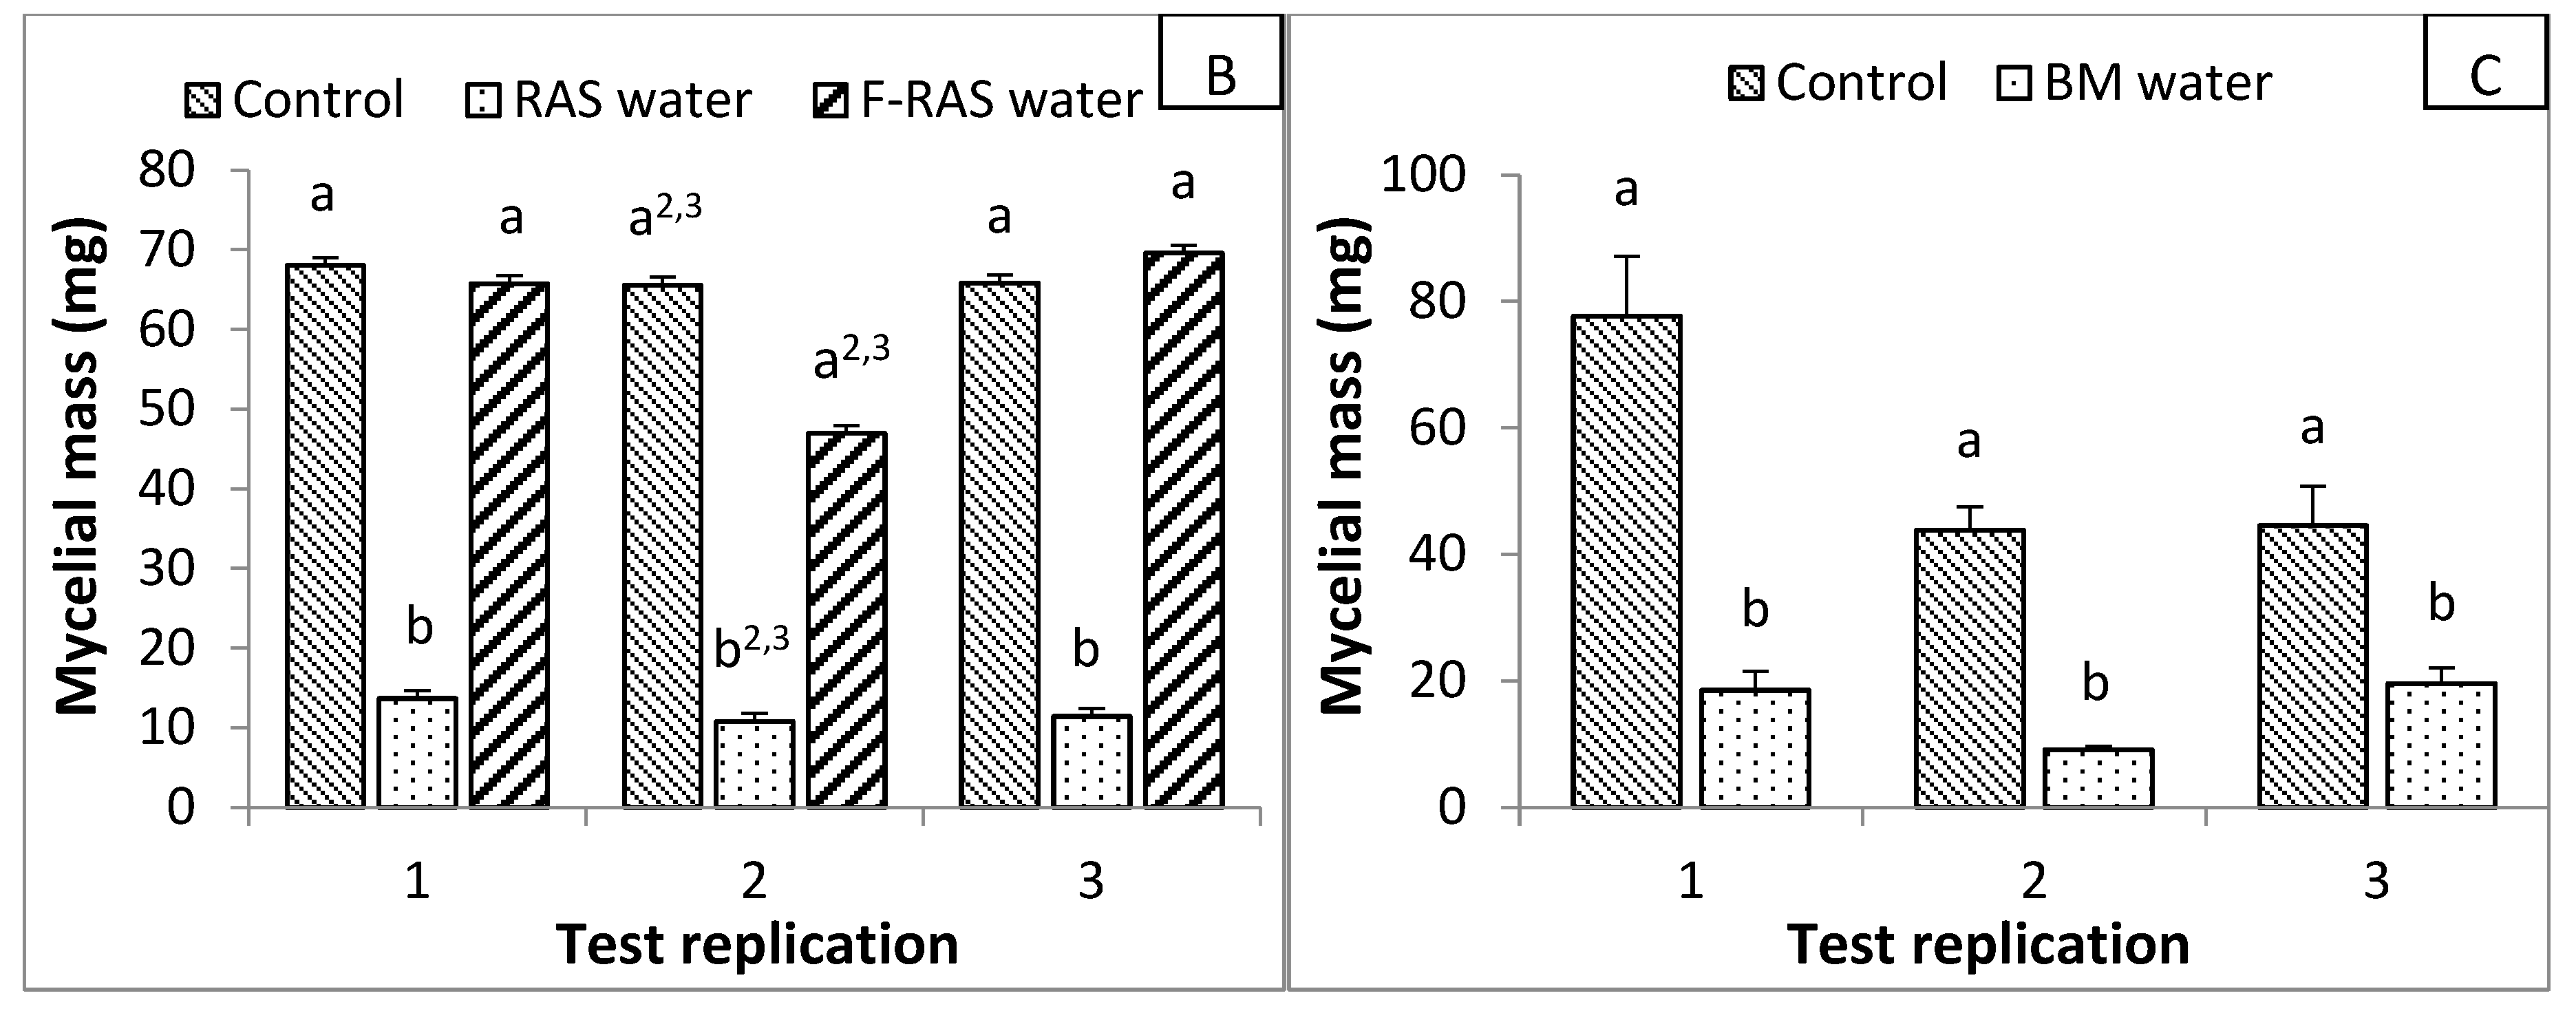
3.1. In Vitro Test
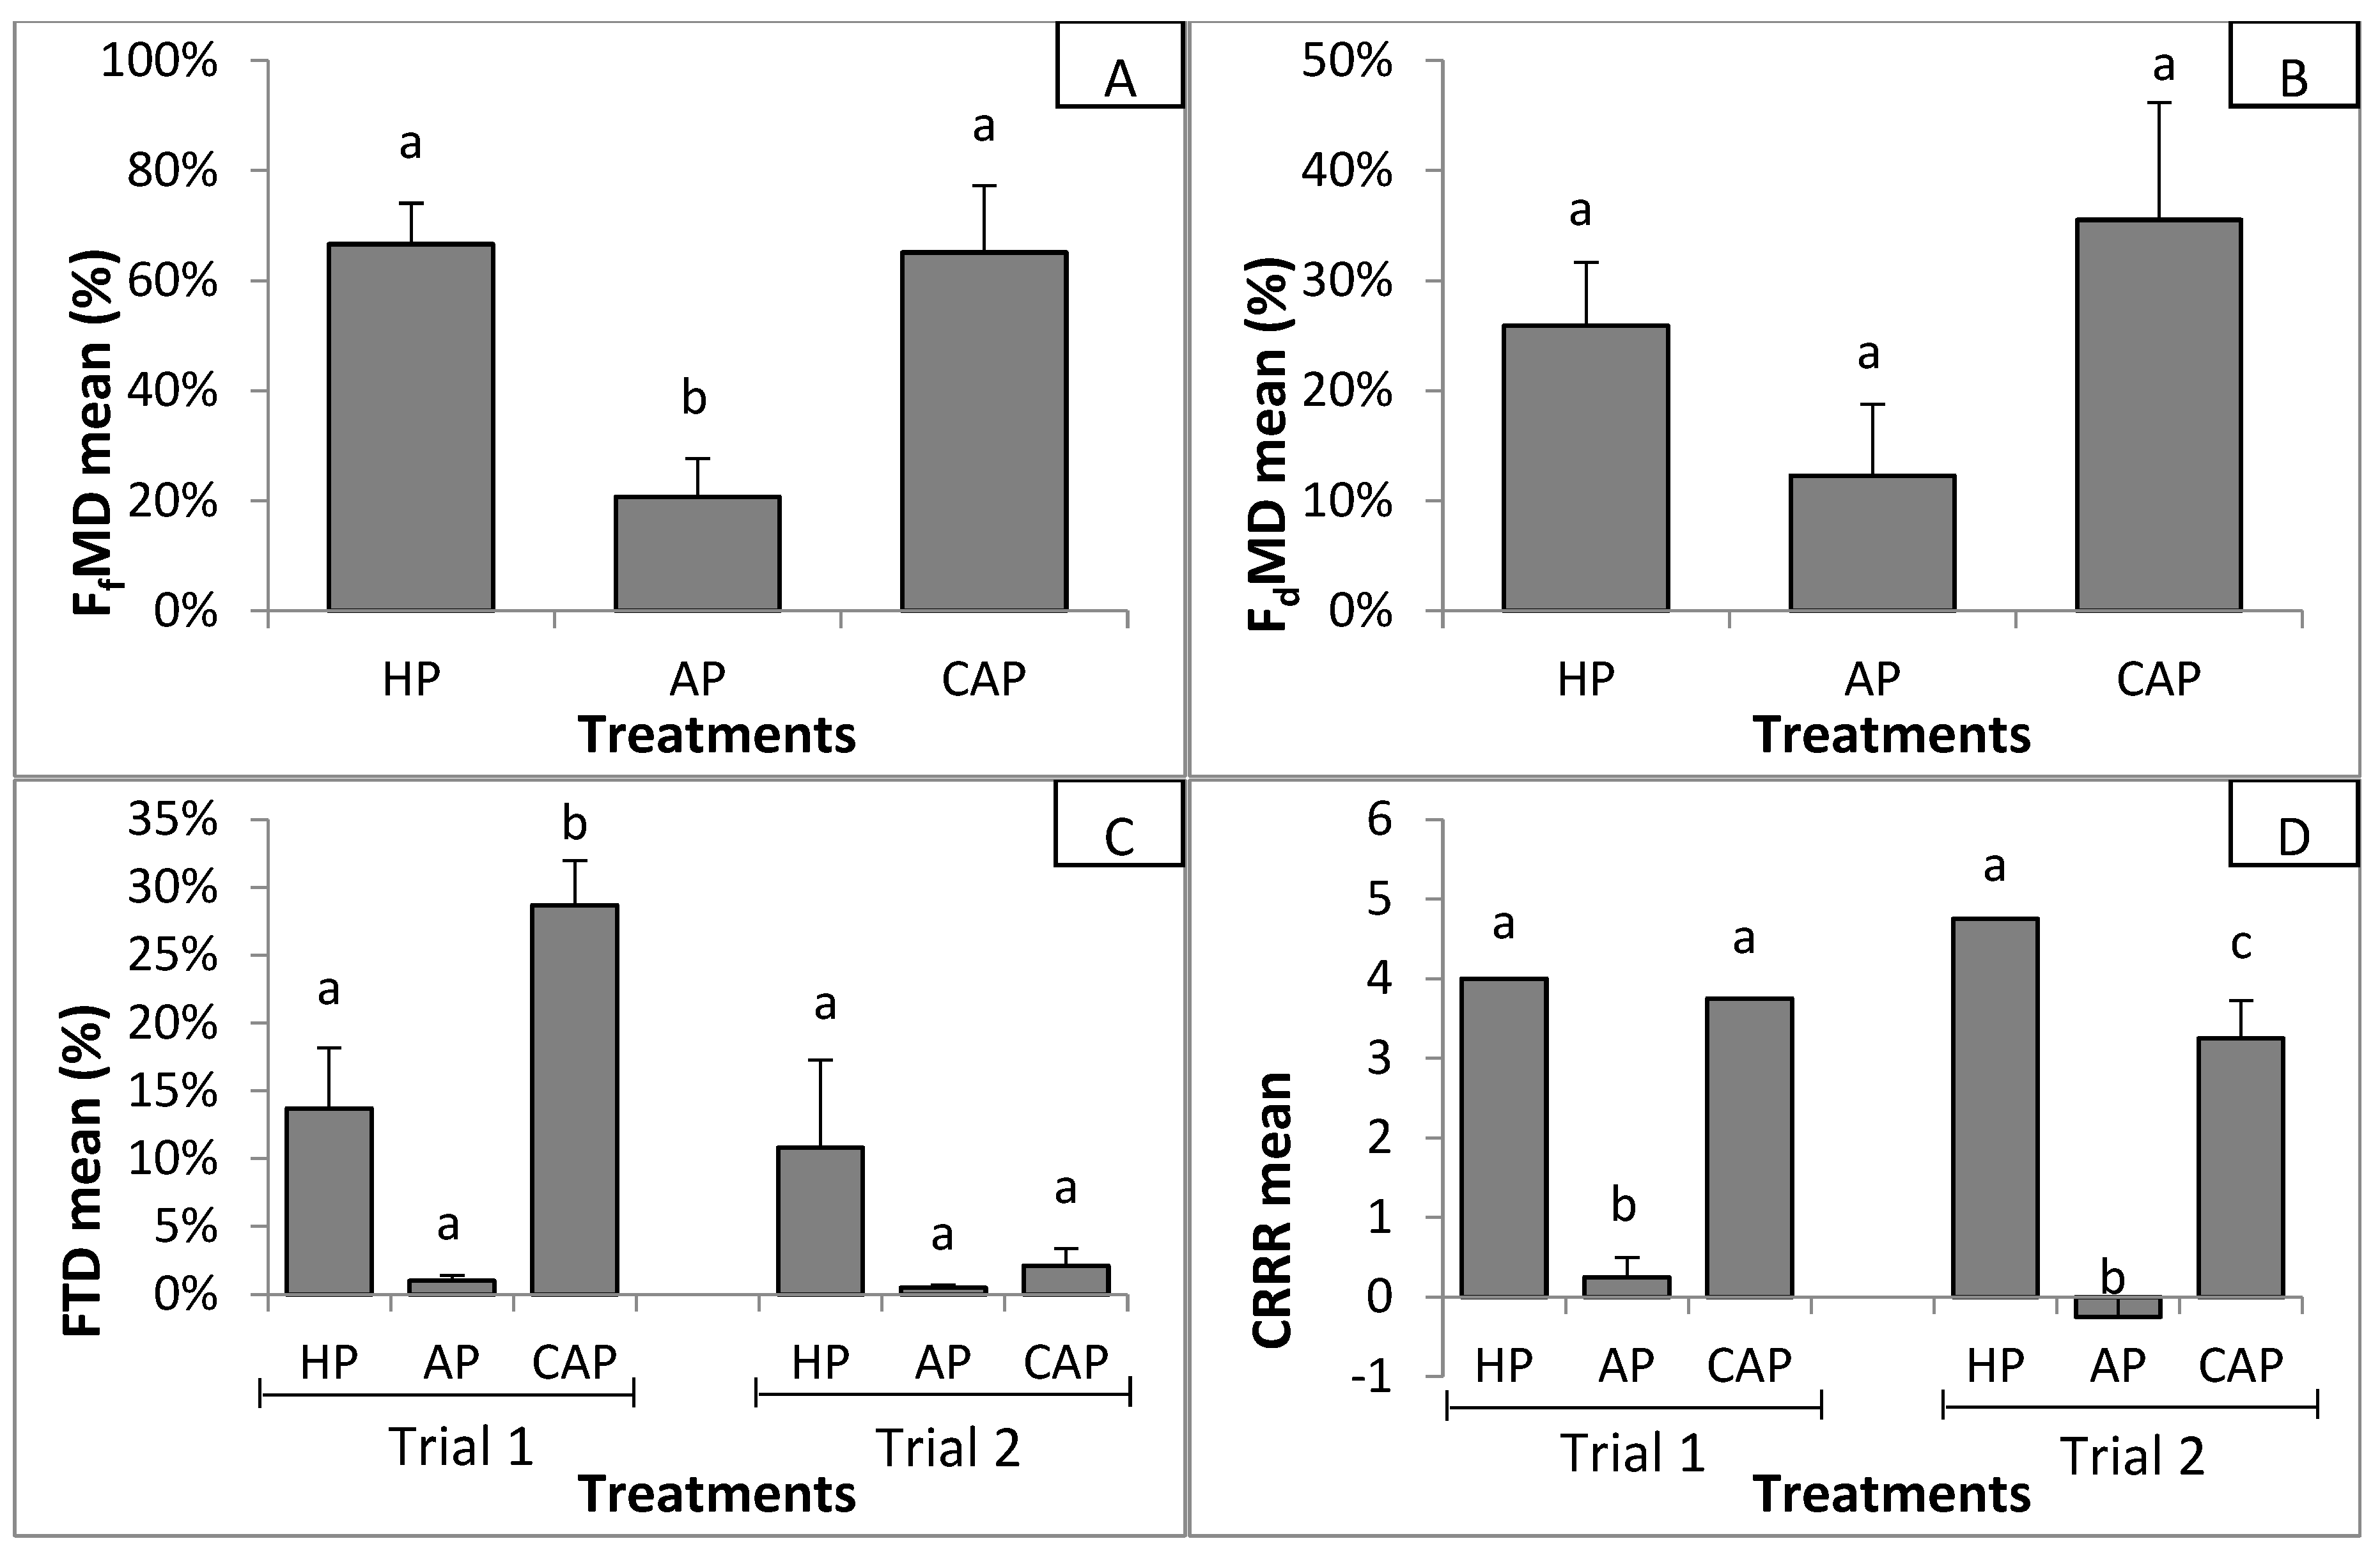
3.2. In Vivo Test
3.2.1. Suppressiveness
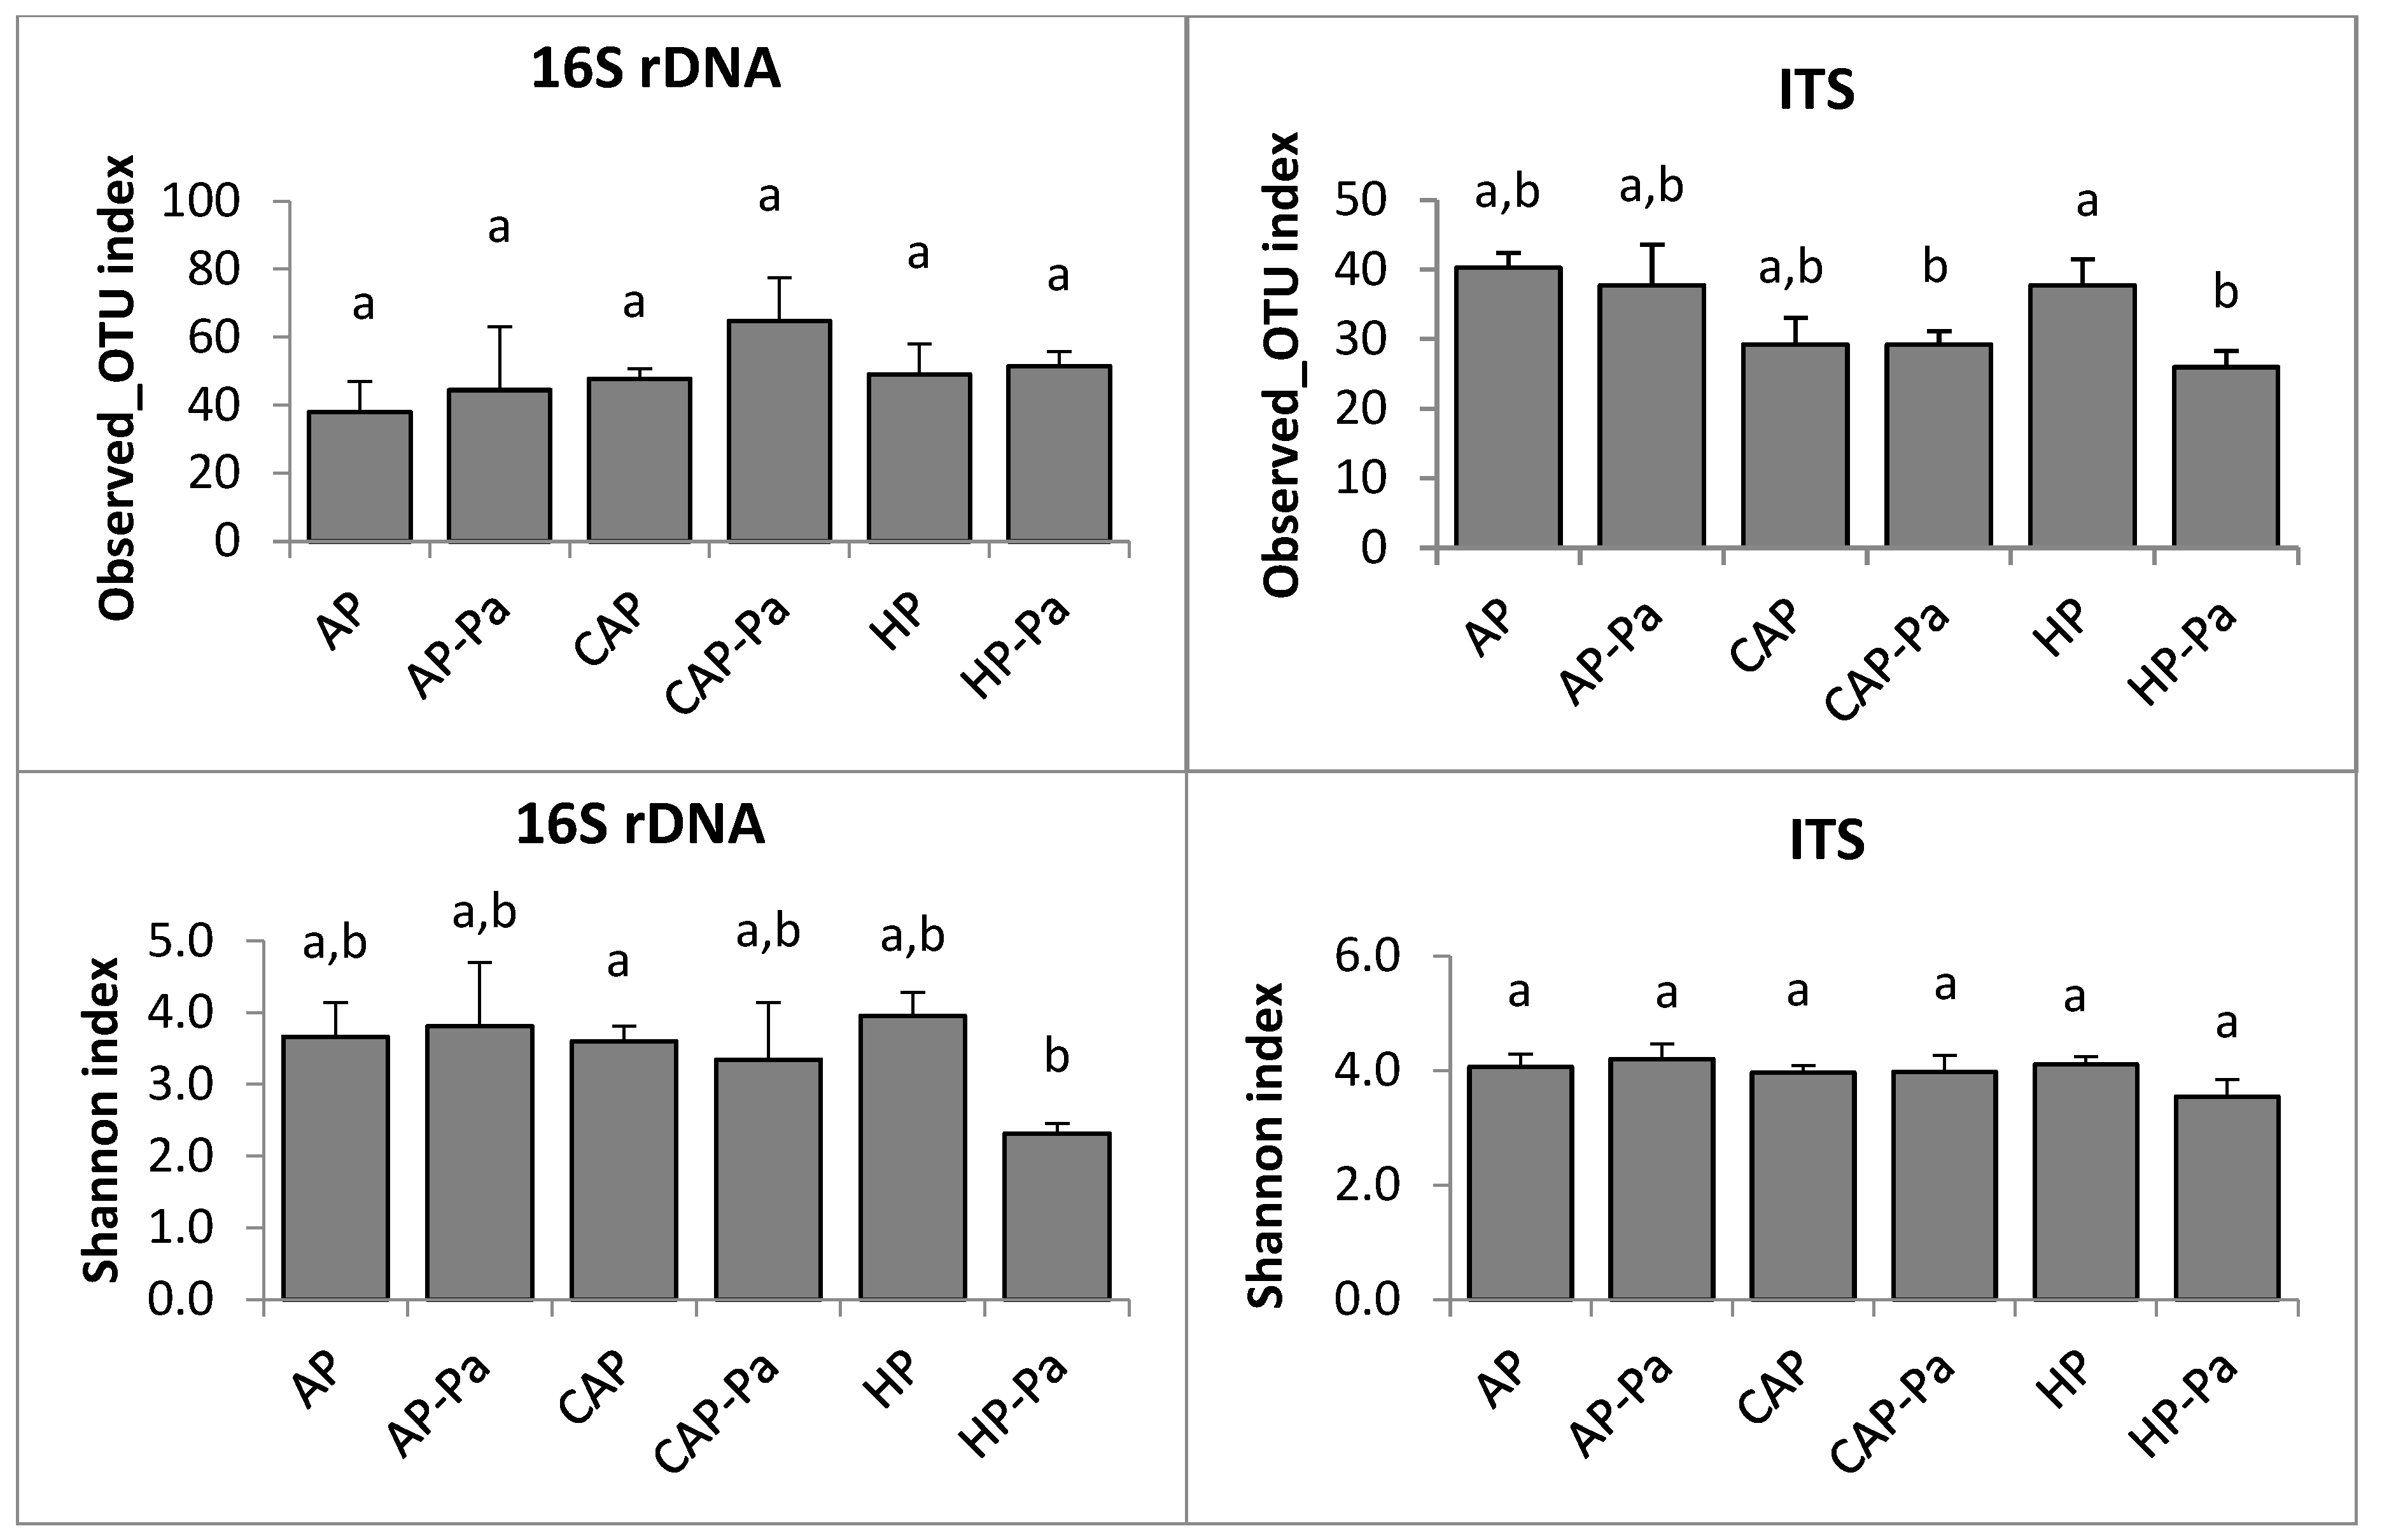
3.2.2. Microbiota Composition and Diversity
Microbiota Composition
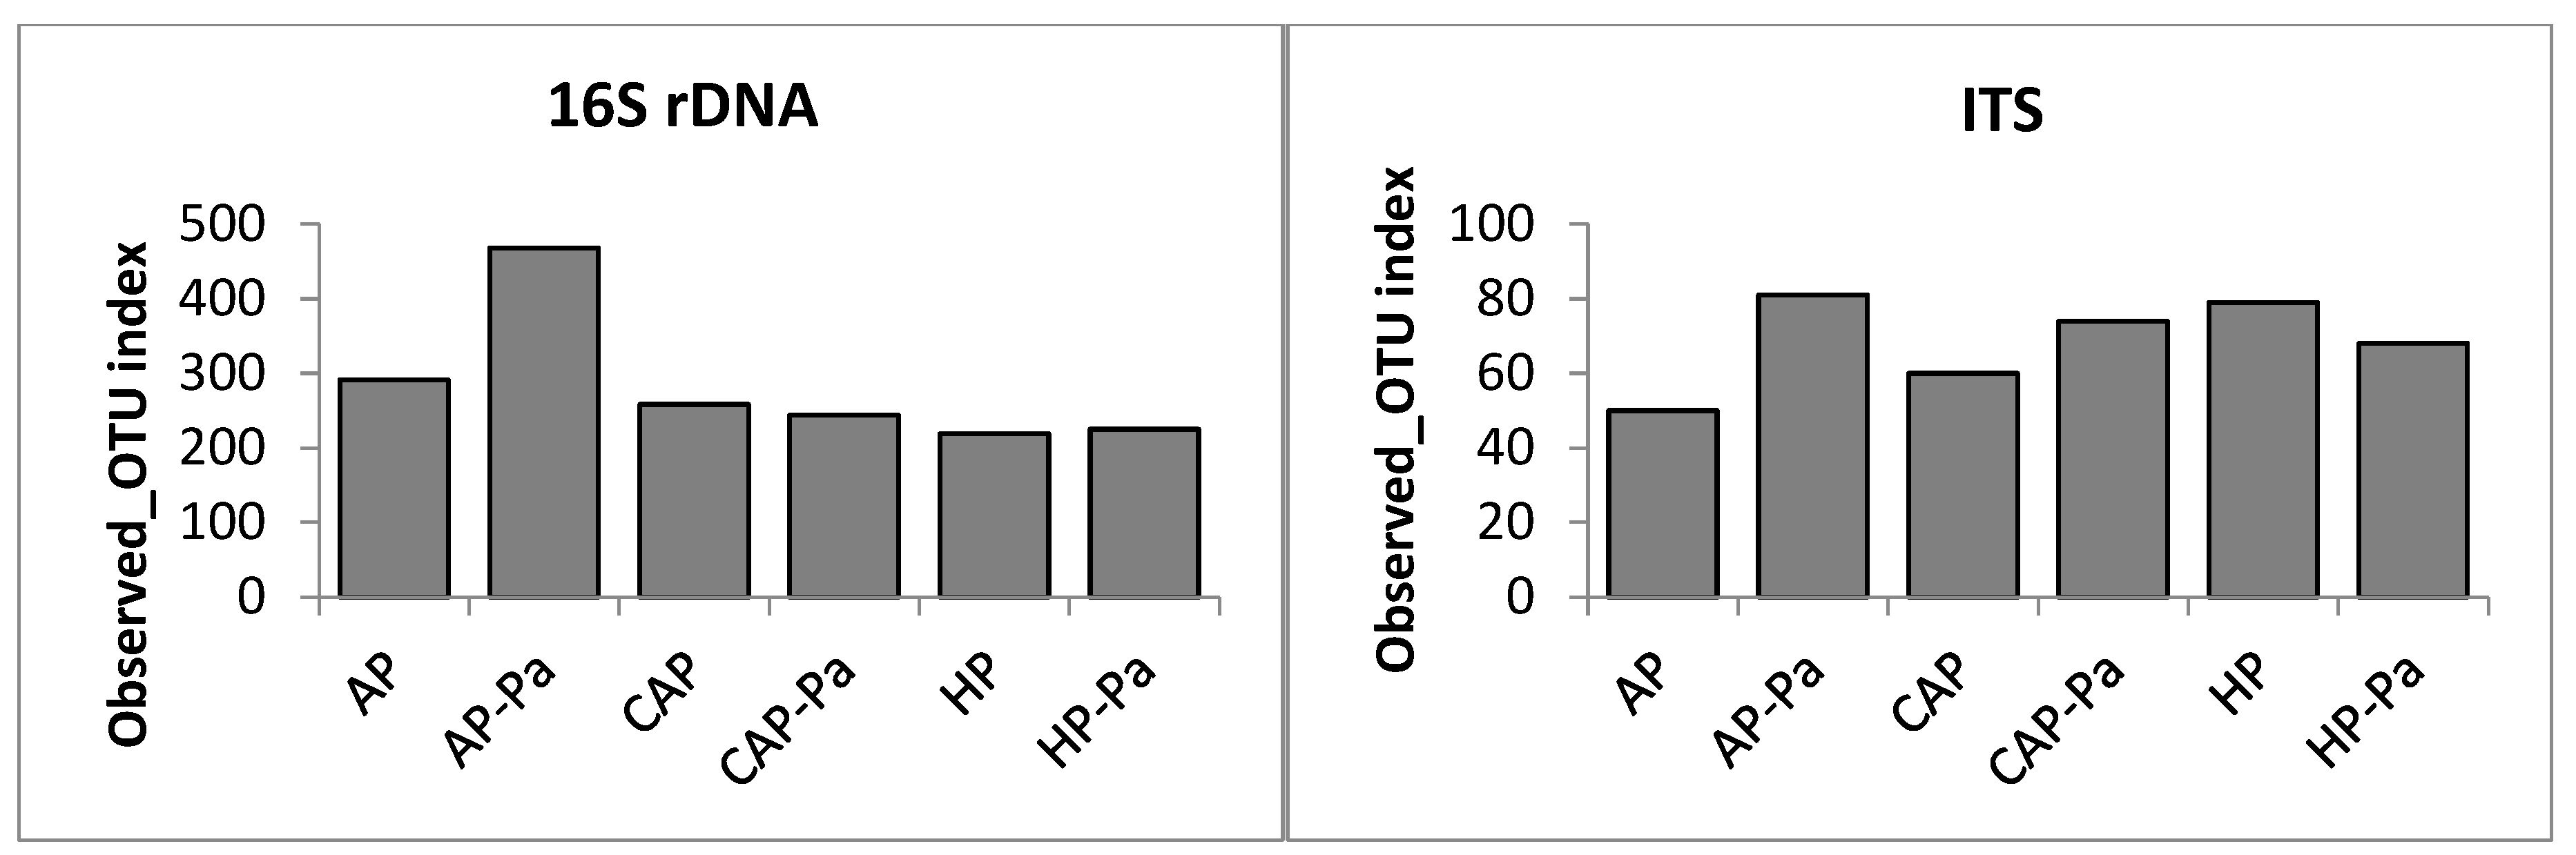
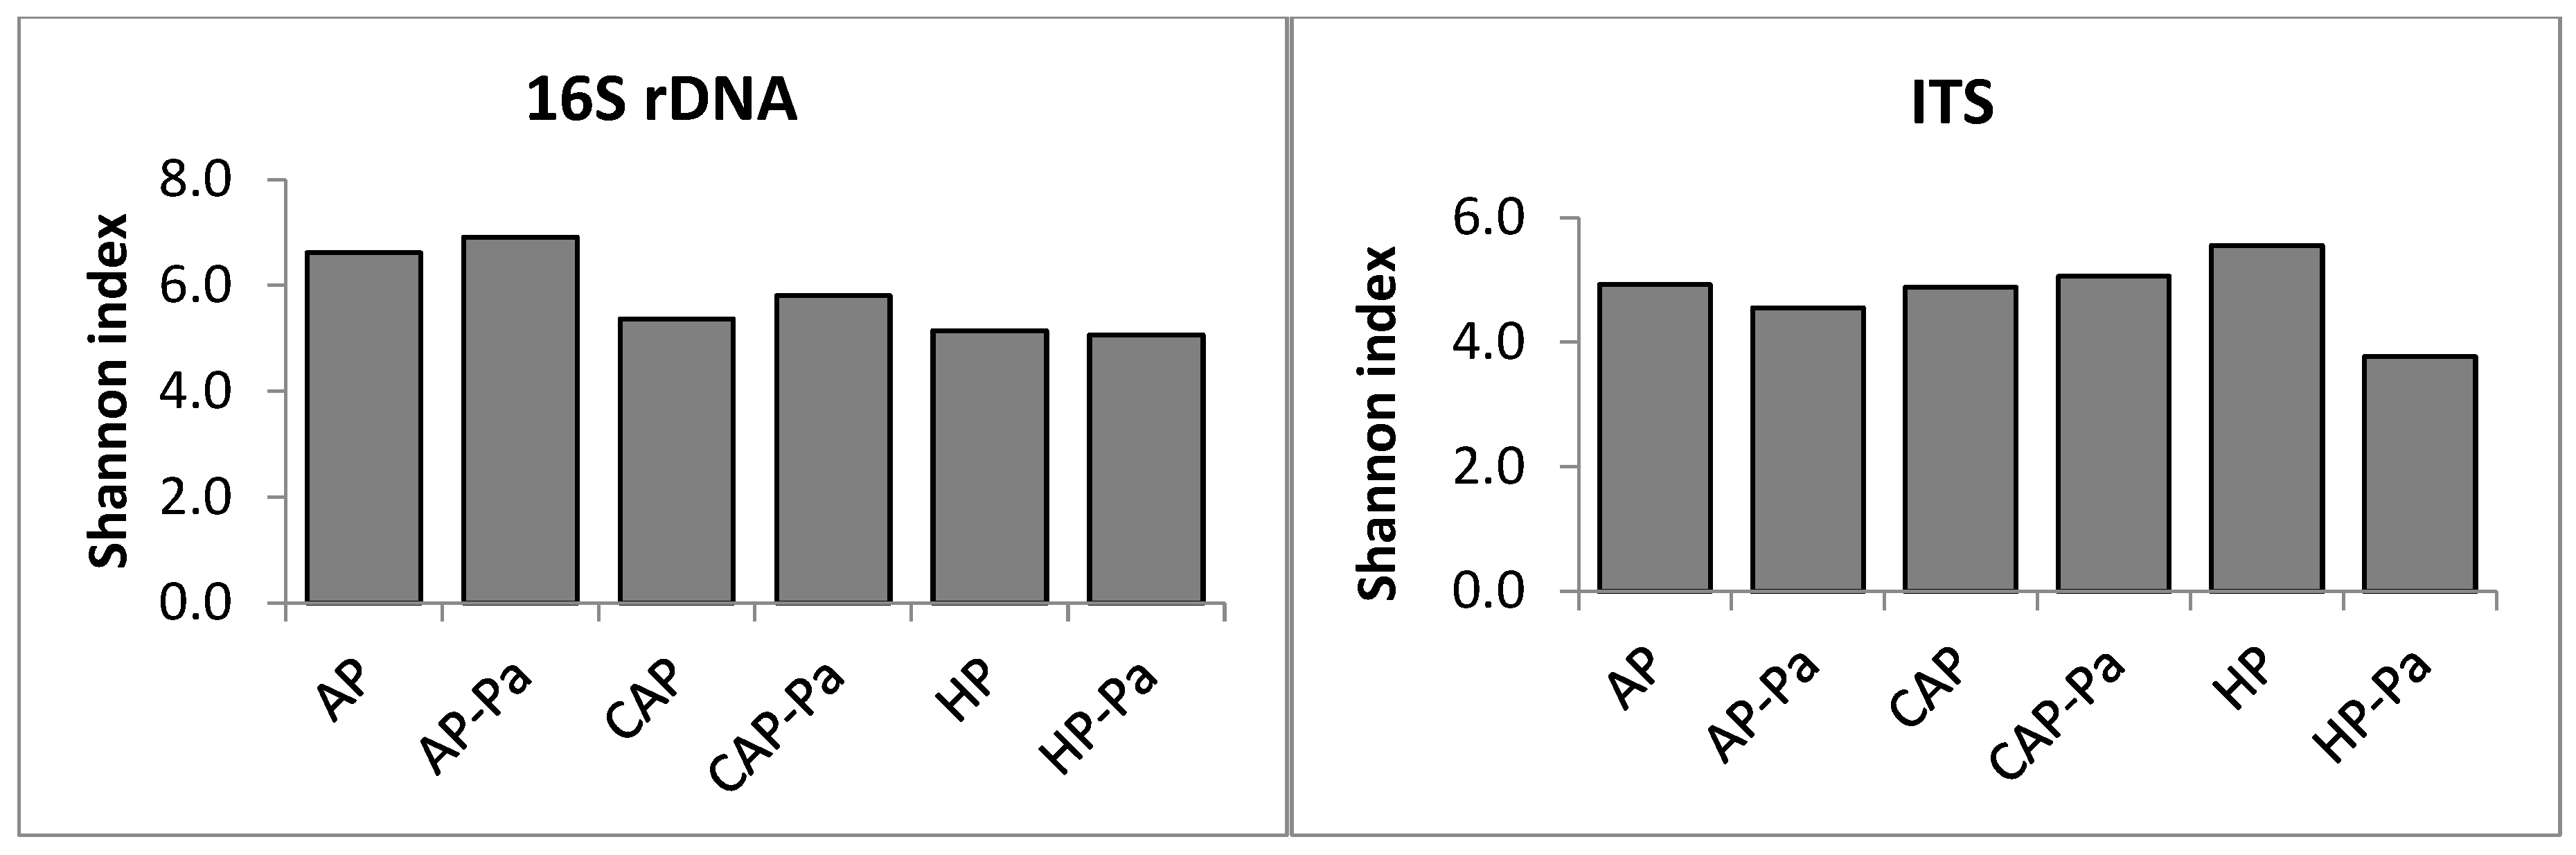
Microbiota α-Diversity
a. Endosphere
b. Rhizoplane
c. Rhizosphere
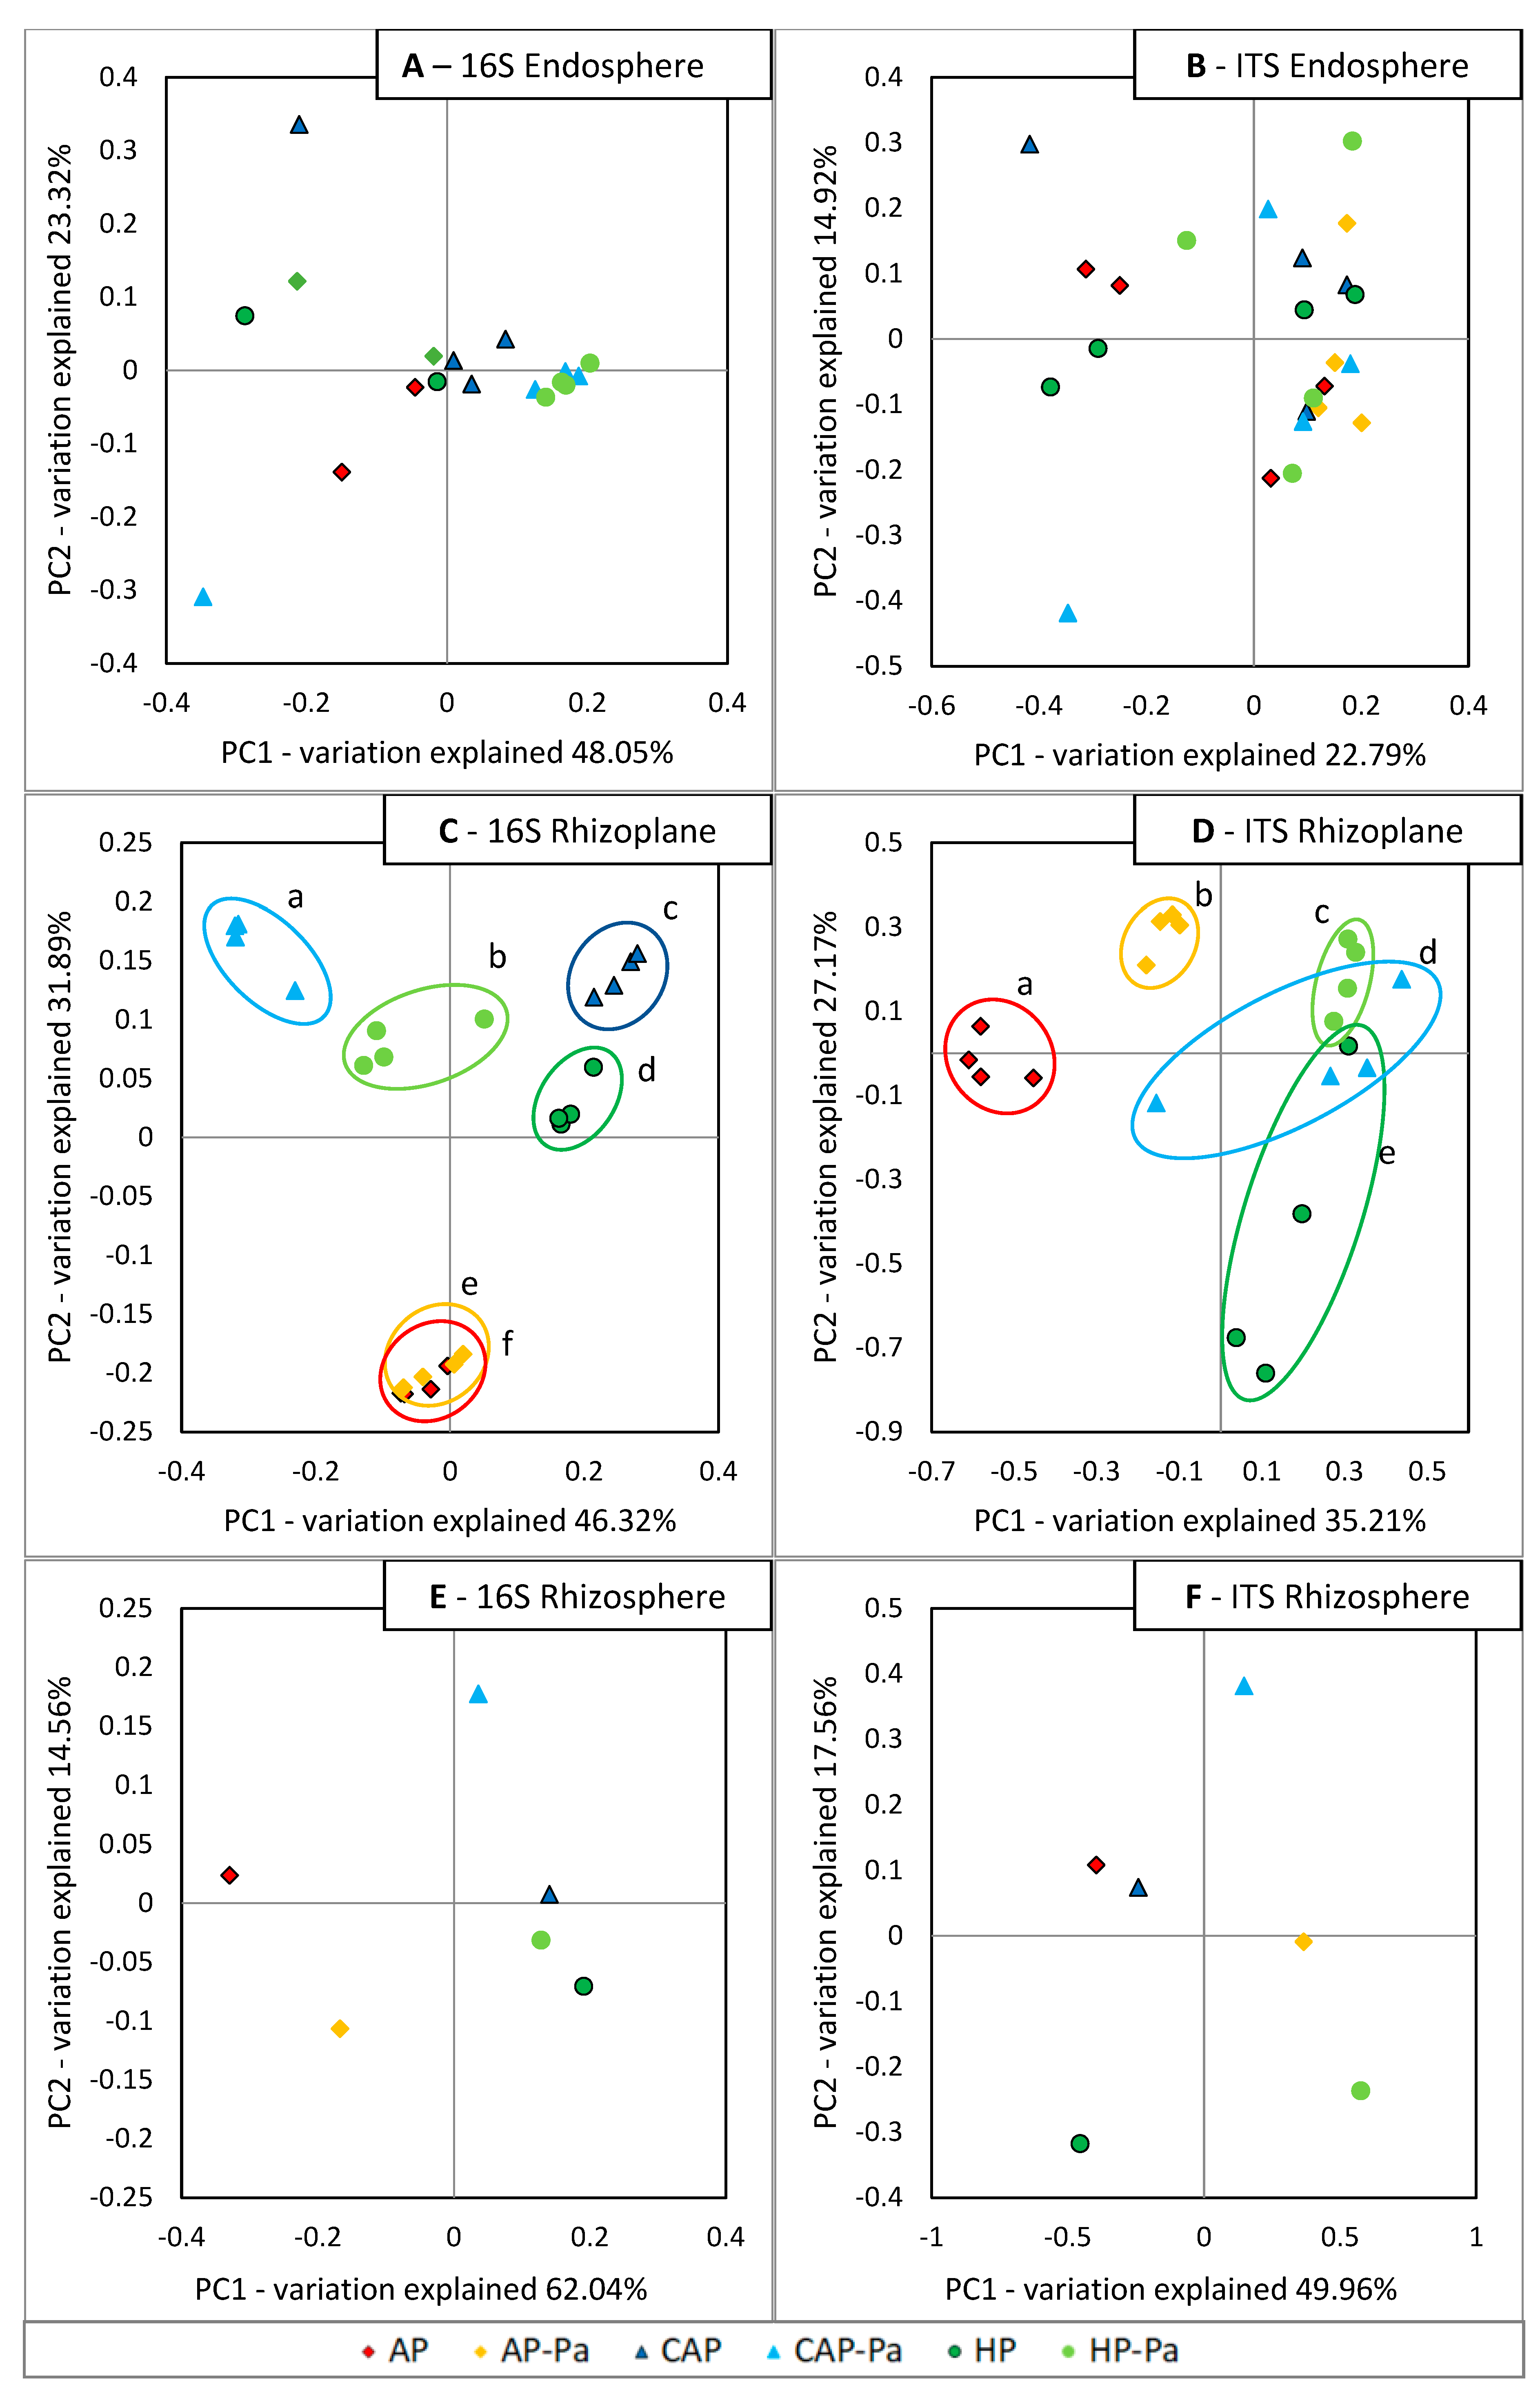
Microbiota β-diversity
3.2.3. Link between Suppressiveness and Microbiota
4. Discussion
5. Conclusions
Supplementary Materials
Author Contributions
Funding
Acknowledgments
Conflicts of Interest
Abbreviations
| ANOVA | analysis of variance |
| AP | aquaponic |
| AP-Pa | aquaponic plus P. aphanidermatum |
| BM | biofilter media |
| BOD5 | biological oxygen demand in 5 days |
| CAP | complemented aquaponic |
| CAP-Pa | complemented aquaponic plus P. aphanidermatum |
| CFU | colony forming unit |
| CRRR | corrected root rot rating |
| DS-FDR | discrete false - discovery rate |
| Ec | electroconductivity |
| F-AP | filtrated aquaponic water |
| FdM | foliar dry mass |
| FdMD | foliar dry mass decrease |
| FfM | foliar fresh mass |
| FfMD | foliar fresh mass decrease |
| F-RAS | filtrated recirculated aquaculture water |
| FTD | relative foliar turgidity decrease |
| FWC | foliar water content |
| HC | healthy control |
| HP | hydroponic |
| HP-Pa | hydroponic plus P. aphanidermatum |
| IL | inoculated |
| ITS | internal transcript spacer |
| KPBT | kalium phosphate buffer and tween |
| LB | Luria-Bertani |
| OTU | operational taxonomic unit |
| PAR | photosynthetically active radiation |
| PC1/2/3 | principal coordinates 1/2/3 |
| PCoA | principal coordinates analysis |
| PDA | potatoes dextrose agar |
| PERMANOVA | permutational multivariate analysis of variance |
| q2 | Qiime 2 |
| RAS | recirculated aquaculture system |
| rDNA | ribosomal DNA |
| RRR | root rot rating |
References
- Stouvenakers, G.; Dapprich, P.; Massart, S.; Jijakli, M.H. Ch 14: Plant Pathogens and Control Strategies in Aquaponics. In Aquaponics Food Production Systems; Springer: Cham, Switzerland, 2019; pp. 353–378. ISBN 9783030159436. [Google Scholar]
- Hatzilazarou, S.P.; Charizopoulos, E.T.; Papadopoulou-Mourkidou, E.; Economou, A.S. Dissipation of three organochlorine and four pyrethroid pesticides sprayed in a greenhouse environment during hydroponic cultivation of gerbera. Pest Manag. Sci. 2004, 60, 1197–1204. [Google Scholar] [CrossRef] [PubMed]
- Reinhardt, T.; Hoevenaars, K.; Joyce, A. Ch 20: Regulatory Frameworks for Aquaponics in the European Union. In Aquaponics Food Production Systems: Combined Aquaculture and Hydroponic Production Technologies for the Future; Goddek, S., Joyce, A., Kotzen, B., Burnell, G.M., Eds.; Springer International Publishing: Cham, Switzerland, 2019; pp. 501–522. ISBN 978-3-030-15943-6. [Google Scholar]
- Sutton, J.C.; Sopher, C.R.; Owen-Going, T.N.; Liu, W.; Grodzinski, B.; Hall, J.C.; Benchimol, R.L. Etiology and epidemiology of Pythium root rot in hydroponic crops: Current knowledge and perspectives. Summa Phytopathol. 2006, 32, 307–321. [Google Scholar] [CrossRef] [Green Version]
- Gravel, V.; Dorais, M.; Dey, D.; Vandenberg, G. Fish effluents promote root growth and suppress fungal diseases in tomato transplants. Can. J. Plant Sci. 2015, 95, 427–436. [Google Scholar] [CrossRef] [Green Version]
- Sirakov, I.; Lutz, M.; Graber, A.; Mathis, A.; Staykov, Y. Potential for combined biocontrol activity against fungal fish and plant pathogens by bacterial isolates from a model aquaponic system. Water 2016, 8, 518. [Google Scholar] [CrossRef]
- Postma, J.; van Os, E.; Bonants, P.J.M. Ch 10—Pathogen detection and management strategies in soilless plant growing system. In Soilless Culture: Theory and Practice; Elsevier: Amsterdam, The Netherlands, 2008; pp. 425–457. [Google Scholar]
- Campbell, R. Biological Control of Microbial Plant Pathogens; Cambridge University Press: Cambridge, UK, 1989; Volume 1, ISBN 0521340888. [Google Scholar]
- Whipps, J.M. Microbial interactions and biocontrol in the rhizosphere. J. Exp. Bot. 2001, 52, 487–511. [Google Scholar] [CrossRef] [PubMed]
- Narayanasamy, P. Biological Management of Diseases of Crops: Volume 1: Characteristics of Biological Control Agents; Springer: Berlin/Heidelberg, Germany, 2013; Volume 1, ISBN 978-94-007-6376-0. [Google Scholar]
- Kilany, M.; Ibrahim, E.H.; Al Amry, S.; Roman, S. Al Ch9—Microbial suppressiveness of Pythium damping-off diseases. In Organic Amendments and Soil Suppressiveness in Plant Disease Management; Meghvansi, M.K., Varma, A., Eds.; Springer International Publishing: Cham, Switzerland, 2015; pp. 187–205. ISBN 9783319230757. [Google Scholar]
- Garbeva, P.; Van Veen, J.A.; Van Elsas, J.D. MICROBIAL DIVERSITY IN SOIL: Selection of Microbial Populations by Plant and Soil Type and Implications for Disease Suppressiveness. Annu. Rev. Phytopathol. 2004, 42, 243–270. [Google Scholar] [CrossRef] [PubMed]
- Bonanomi, G.; Lorito, M.; Vinale, F.; Woo, S.L. Organic Amendments, Beneficial Microbes, and Soil Microbiota: Toward a Unified Framework for Disease Suppression. Annu. Rev. Phytopathol. 2018, 56, 1–20. [Google Scholar] [CrossRef]
- Resh, H.M. Hydroponic Food Production: A Definitive Guidebook for the Advanced Home Gardener and the Commercial Hydroponic Grower, 7th ed.; CRC Press: Boca Raton, FL, USA, 2013. [Google Scholar]
- Utkhede, R.S.; Lévesque, C.A.; Dinh, D. Root Rot in Hydroponically Grown Lettuce and the Effect of Chemical and Biological Agents on Its Control. Can. J. Plant Pathol. 2000, 22, 138–144. [Google Scholar] [CrossRef]
- Sare, A.R.; Stouvenakers, G.; Eck, M.; Lampens, A.; Goormachtig, S.; Jijakli, M.H.; Massart, S. Standardization of plant microbiome studies: Which proportion of the microbiota is really harvested? Microorganisms 2020, 8, 342. [Google Scholar] [CrossRef] [Green Version]
- Eck, M.; Sare, A.R.; Massart, S.; Schmautz, Z.; Junge, R.; Smits, T.H.M.; Jijakli, M.H. Exploring Bacterial Communities in Aquaponic Systems. Water 2019, 11, 260. [Google Scholar] [CrossRef] [Green Version]
- Toju, H.; Tanabe, A.S.; Yamamoto, S.; Sato, H. High-coverage ITS primers for the DNA-based identification of ascomycetes and basidiomycetes in environmental samples. PLoS ONE 2012, 7, e40863. [Google Scholar] [CrossRef] [Green Version]
- Bolyen, E.; Ram Rideout, J.; Dillon, M.R.; Bokulich, N.A.; Abnet, C.C.; Al-Ghalith, G.A.; Alexander, H.; Alm, E.J.; Arumugam, M.; Asnicar, F.; et al. Reproducible, interactive, scalable and extensible microbiome data science using QIIME 2. Nat. Biotechnol. 2019, 37, 852–857. [Google Scholar] [CrossRef] [PubMed]
- Martin, F.N.; Loper, J.E. Soilborne Plant Diseases Caused by Pythium spp.: Ecology, Epidemiology, and Prospects for Biological Control Soilborne Plant Diseases Caused by Pythium spp.: Ecology, Epidemiology, and Prospects for Biological Cont. CRC. Crit. Rev. Plant Sci. 1999, 18, 11–181. [Google Scholar] [CrossRef]
- Hirayama, K.; Mizuma, H.; Mizue, Y. The accumulation of dissolved organic substances in closed recirculation culture systems. Aquac. Eng. 1988, 7, 73–87. [Google Scholar] [CrossRef]
- Takeda, S.; Kiyono, M. The characterisation of yellow substances accumulated in a closed recirculating system for fish culture. Proc. Second Asian Fish. Forum 1990, 7, 129–132. [Google Scholar]
- Leonard, N.; Guiraud, J.P.; Gasset, E.; Cailleres, J.P.; Blancheton, J.P. Bacteria and nutrients—Nitrogen and carbon—In a recirculating system for sea bass production. Aquac. Eng. 2002, 26, 111–127. [Google Scholar] [CrossRef]
- Adani, F.; Genevini, P.; Zaccheo, P.; Zocchi, G. The effect of commercial humic acid on tomato plant growth and mineral nutrition. J. Plant Nutr. 1998, 21, 561–575. [Google Scholar] [CrossRef]
- Bohme, M. Effects of Lactate, Humate and Bacillus subtilis on the growth of tomato plants in hydroponic systems. Acta Hortic. 1999, 481, 231–239. [Google Scholar] [CrossRef]
- du Jardin, P. Plant biostimulants: Definition, concept, main categories and regulation. Sci. Hortic. 2015, 196, 3–14. [Google Scholar] [CrossRef] [Green Version]
- Elsherif, M.; Grossmann, F. Comparative investigations on the antagonistic activity of fluorescent pseudomonads against Gaeumannomyces graminis var. tritici in vitro and in vivo. Microbiol. Res. 1994, 149, 371–377. [Google Scholar] [CrossRef]
- Schmautz, Z.; Graber, A.; Jaenicke, S.; Goesmann, A.; Junge, R.; Smits, T.H.M. Microbial diversity in different compartments of an aquaponics system. Arch. Microbiol. 2017, 613–620. [Google Scholar] [CrossRef]
- Bartelme, R.P.; Smith, M.C.; Sepulveda-Villet, O.J.; Newton, R.J. Component Microenvironments and System Biogeography Structure Microorganism Distributions in Recirculating Aquaculture and Aquaponic Systems. mSphere 2019, 4, e00143-19. [Google Scholar] [CrossRef] [Green Version]
- Cardinale, M.; Grube, M.; Erlacher, A.; Quehenberger, J.; Berg, G. Bacterial networks and co-occurrence relationships in the lettuce root microbiota. Environ. Microbiol. 2015, 17, 239–252. [Google Scholar] [CrossRef]
- Expósito, R.G.; de Bruijn, I.; Postma, J.; Raaijmakers, J.M. Current insights into the role of Rhizosphere bacteria in disease suppressive soils. Front. Microbiol. 2017, 8, 2529. [Google Scholar] [CrossRef]
- Begerow, D.; Nilsson, H.; Unterseher, M.; Maier, W. Current state and perspectives of fungal DNA barcoding and rapid identification procedures. Appl. Microbiol. Biotechnol. 2010, 87, 99–108. [Google Scholar] [CrossRef]
- Schoch, C.L.; Seifert, K.A.; Huhndorf, S.; Robert, V.; Spouge, J.L.; Levesque, C.A.; Chen, W. Nuclear ribosomal internal transcribed spacer (ITS) region as a universal DNA barcode marker for Fungi. Proc. Natl. Acad. Sci. USA 2012, 109, 6241–6246. [Google Scholar] [CrossRef] [Green Version]
- Calvo-Bado, L.A.; Petch, G.; Parsons, N.R.; Morgan, J.A.W.; Pettitt, T.R.; Whipps, J.M. Microbial community responses associated with the development of oomycete plant pathogens on tomato roots in soilless growing systems. J. Appl. Microbiol. 2006, 100, 1194–1207. [Google Scholar] [CrossRef]
- Kyselková, M.; Kopeck, J.; Frapolli, M.; Défago, G.; Ságová-Mareková, M.; Grundmann, G.L.; Moënne-Loccoz, Y. Comparison of rhizobacterial community composition in soil suppressive or conducive to tobacco black root rot disease. ISME J. 2009, 3, 1127–1138. [Google Scholar] [CrossRef] [Green Version]
- Vallance, J.; Déniel, F.; Barbier, G.; Guerin-Dubrana, L.; Benhamou, N.; Rey, P. Influence of Pythium oligandrum on the bacterial communities that colonize the nutrient solutions and the rhizosphere of tomato plants. Can. J. Microbiol. 2012, 58, 1124–1134. [Google Scholar] [CrossRef]
- Kusstatscher, P.; Cernava, T.; Harms, K.; Maier, J.; Eigner, H.; Berg, G.; Zachow, C. Disease incidence in sugar beet fields is correlated with microbial diversity and distinct biological markers. Phytobiomes J. 2019, 3, 22–30. [Google Scholar] [CrossRef] [Green Version]
- Funck-Jensen, D.; Hockenhull, J. The influence of some factors on the severity of pythium root rot of lettuce in soilless (hydroponic) growing systems. Acta Hortic. 1983, 133, 129–136. [Google Scholar] [CrossRef]
- Endo, R.M.; Colt, W.M. Anatomy, cytology and physiology of infection by Pythium. Proc. Am. Phytopathol. Soc. 1974, 1, 215–223. [Google Scholar]
- Mandelbaum, R.; Hadar, Y. Effects of available carbon source on microbial activity and suppression of Pythium aphanidermatum in compost and peat container media. Phytopathology 1990, 80, 794–804. [Google Scholar] [CrossRef]
- Khalil, S.; Alsanius, B.W. Utilisation of carbon sources by pythium, phytophthora and fusarium species as determined by biolog® microplate assay. Open Microbiol. J. 2009, 3, 9–14. [Google Scholar] [CrossRef]
- Dordas, C. Role of nutrients in controlling plant diseases in sustainable agriculture. A review. Agron. Sustain. Dev. 2008, 28, 33–46. [Google Scholar] [CrossRef] [Green Version]
- Veresoglou, S.D.; Barto, E.K.; Menexes, G.; Rillig, M.C. Fertilization affects severity of disease caused by fungal plant pathogens. Plant Pathol. 2013, 62, 961–969. [Google Scholar] [CrossRef]
- Geary, B.; Clark, J.; Hopkins, B.G.; Jolley, V.D. Deficient, Adequate and Excess Nitrogen Levels Established in Hydroponics for Biotic and Abiotic Stress-Interaction Studies in Potato. J. Plant Nutr. 2015, 38, 41–50. [Google Scholar] [CrossRef]
- Ros, M.; Almagro, M.; Antonio, J.; Egea-gilabert, C.; Faz, Á.; Antonio, J. Approaches for the discrimination of suppressive soils for Pythium irregulare disease. Appl. Soil Ecol. 2019, 147, 103439. [Google Scholar] [CrossRef]
- De Corato, U.; Patruno, L.; Avella, N.; Lacolla, G.; Cucci, G. Composts from green sources show an increased suppressiveness to soilborne plant pathogenic fungi: Relationships between physicochemical properties, disease suppression, and the microbiome. Crop Prot. 2019, 124, 104870. [Google Scholar] [CrossRef]
- Bonanomi, G.; Cesarano, G.; Antignani, V.; Di Maio, C.; De Filippis, F.; Scala, F. Conventional farming impairs Rhizoctonia solani disease suppression by disrupting soil food web. J. Phytopathol. 2018, 166, 663–673. [Google Scholar] [CrossRef]
- Laitila, A.; Alakomi, H.L.; Raaska, L.; Mattila-Sandholm, T.; Haikara, A. Antifungal activities of two Lactobacillus plantarum strains against Fusarium moulds in vitro and in malting of barley. J. Appl. Microbiol. 2002, 93, 566–576. [Google Scholar] [CrossRef]
- Wang, H.K.; Yan, Y.H.; Wang, J.M.; Zhang, H.P.; Qi, W. Production and characterization of antifungal compounds produced by Lactobacillus plantarum IMAU10014. PLoS ONE 2012, 7, e29452. [Google Scholar] [CrossRef] [Green Version]
- Burgos-Garay, M.L.; Hong, C.; Moorman, G.W. Interactions of heterotrophic bacteria from recycled greenhouse irrigation water with plant pathogenic Pythium. HortScience 2014, 49, 961–967. [Google Scholar] [CrossRef] [Green Version]
- Birchfield, W. A new species of catenaria parasitic on nematodes of sugarcane. Mycopathol. Mycol. Appl. Vol. 1960, 13, 331–338. [Google Scholar] [CrossRef]
- Singh, K.P.; Stephen, R.A.; Vaish, S.S. Pathogenicity and development of Catenaria anguillulae on some nematodes. Mycol. Res. 1996, 100, 1204–1206. [Google Scholar] [CrossRef]
- Daft, G.C.; Tsao, P.H. Parasitism of Phytophthora cinnamomi and P. parasitica spores by Catenaria anguillulae in a soil environment. Trans. Br. Mycol. Soc. 1984, 82, 485–490. [Google Scholar] [CrossRef]
- Sykes, E.E.; Porter, D. Infection and Development of the Obligate Parasite Catenaria allomycis on Allomyces arbuscula. Mycologia 1980, 72, 288–300. [Google Scholar] [CrossRef]
- Sparrow, F.K. Aquatic Phycomycetes; University of Michigan Press: Ann Arbor, MI, USA, 1960. [Google Scholar]
- Peter, M.; Letcher, M.J.P. A Taxonomic Summary and Revision of Rhizophydium (Rhizophydiales, Chytridiomycota); University Printing, The University of Alabama: Tuscaloosa, AL, USA, 2012; ISBN 9780615662794. [Google Scholar]
- Rosenberd, E. The Prokaryotes—Alphaproteobacteria and Betaproteobacteria, 4th ed.; DeLong, E., Lory, S., Stackebrandt, E., Thompson, F., Eds.; Springer: Berlin/Heidelberg, Germany, 2014; ISBN 9783642301964. [Google Scholar]
- Smalley, N.E.; Taipale, S.; De Marco, P.; Doronina, N.V.; Kyrpides, N.; Shapiro, N.; Woyke, T.; Kalyuzhnaya, M.G. Functional and genomic diversity of methylotrophic Rhodocyclaceae: Description of Methyloversatilis discipulorum sp. nov. Int. J. Syst. Evol. Microbiol. 2015, 65, 2227–2233. [Google Scholar] [CrossRef]
- Benítez, M.S.; McSpadden Gardener, B.B. Linking sequence to function in soil bacteria: Sequence-directed isolation of novel bacteria contributing to soilborne plant disease suppression. Appl. Environ. Microbiol. 2009, 75, 915–924. [Google Scholar] [CrossRef] [Green Version]
- Coenye, T. The Familly Burkholderiaceae. In The Prokaryotes: Alphaproteobacteria and Betaproteobacteria; Rosenberg, E., Ed.; Springer: Berlin/Heidelberg, Germany, 2014; pp. 759–776. ISBN 9783642301971. [Google Scholar]
- Brenner, D.J.; Krieg, N.R.; Staley, J.T. Volume 2: The Proteobacteria. In Bergey’s Manual of Systematic Bacteriology; Garrity, G., Ed.; Springer Nature: New York, NY, USA, 2005. [Google Scholar]
- Chanway, C.P.; Holl, F.B. First year field performance of spruce seedlings inoculated with plant growth promoting rhizobacteria. Can. J. Microbiol. 1993, 39, 1084–1088. [Google Scholar] [CrossRef]
- McPherson, G.M.; Harriman, M.R.; Pattison, D. The potential for spread of root diseases in recirculating hydroponic systems and their control with disinfection. Med. Fac. Landbouww. Univ. Gent 1995, 60, 371–379. [Google Scholar]
- Tu, J.C.; Papadopoulos, A.P.; Hao, X.; Zheng, J. The relationship of Pythium root rot and rhizosphere microorganisms in a closed circulating and an open system in rockwool culture of tomato. In Proceedings of the Acta Horticulturae; International Society for Horticultural Science (ISHS), Leuven, Belgium, 19 May 1999; pp. 577–586. [Google Scholar]
- Pantanella, E.; Cardarelli, M.; Colla, G.; Rea, E.; Marcucci, A. Aquaponics vs. hydroponics: Production and quality of lettuce Crop. Acta Hortic. 2012, 927, 887–893. [Google Scholar] [CrossRef]
- Delaide, B.; Goddek, S.; Gott, J.; Soyeurt, H.; Jijakli, H.M. Lettuce (Lactuca sativa L. var. Sucrine) growth performance in complemented aquaponic solution outperforms hydroponics. Water 2016, 8, 467. [Google Scholar] [CrossRef]
- Alcarraz, E.; Flores, M.; Tapia, M.L.; Bustamante, A.; Wacyk, J.; Escalona, V. Quality of lettuce (Lactuca sativa L.) grown in aquaponic and hydroponic systems. Acta Hortic. 2018, 1194, 31–38. [Google Scholar] [CrossRef] [Green Version]
- Goddek, S.; Vermeulen, T. Comparison of Lactuca sativa growth performance in rainwater and RAS-water-based hydroponic nutrient solutions. Aquac. Int. 2018, 26, 1377–1386. [Google Scholar] [CrossRef] [Green Version]
- Lennard, W.; Ward, J. A Comparison of Plant Growth Rates between an NFT Hydroponic System and an NFT Aquaponic System. Horticulturae 2019, 5, 27. [Google Scholar] [CrossRef] [Green Version]
- Monsees, H.; Suhl, J.; Paul, M.; Kloas, W.; Dannehl, D.; Würtz, S. Lettuce (Lactuca sativa, variety Salanova) production in decoupled aquaponic systems: Same yield and similar quality as in conventional hydroponic systems but drastically reduced greenhouse gas emissions by saving inorganic fertilizer. PLoS ONE 2019, 14, e0218368. [Google Scholar] [CrossRef] [Green Version]
- Bartelme, R.P.; Oyserman, B.O.; Blom, J.E.; Sepulveda-Villet, O.J.; Newton, R.J. Stripping Away the Soil: Plant Growth Promoting Microbiology Opportunities in Aquaponics. Front. Microbiol. 2018, 9, 8. [Google Scholar] [CrossRef] [Green Version]
- Sanchez, F.A.; Vivian, V.R.; Hidetoshi, R. Tilapia recirculating aquaculture systems as a source of plant growth promoting bacteria. Aquac. Res. 2019, 50, 2054–2065. [Google Scholar] [CrossRef]

 CAP treatment in the ITS rhizoplane was removed by the rarefaction process during bioinformatic analysis.
CAP treatment in the ITS rhizoplane was removed by the rarefaction process during bioinformatic analysis.
CAP treatment in the ITS rhizoplane was removed by the rarefaction process during bioinformatic analysis.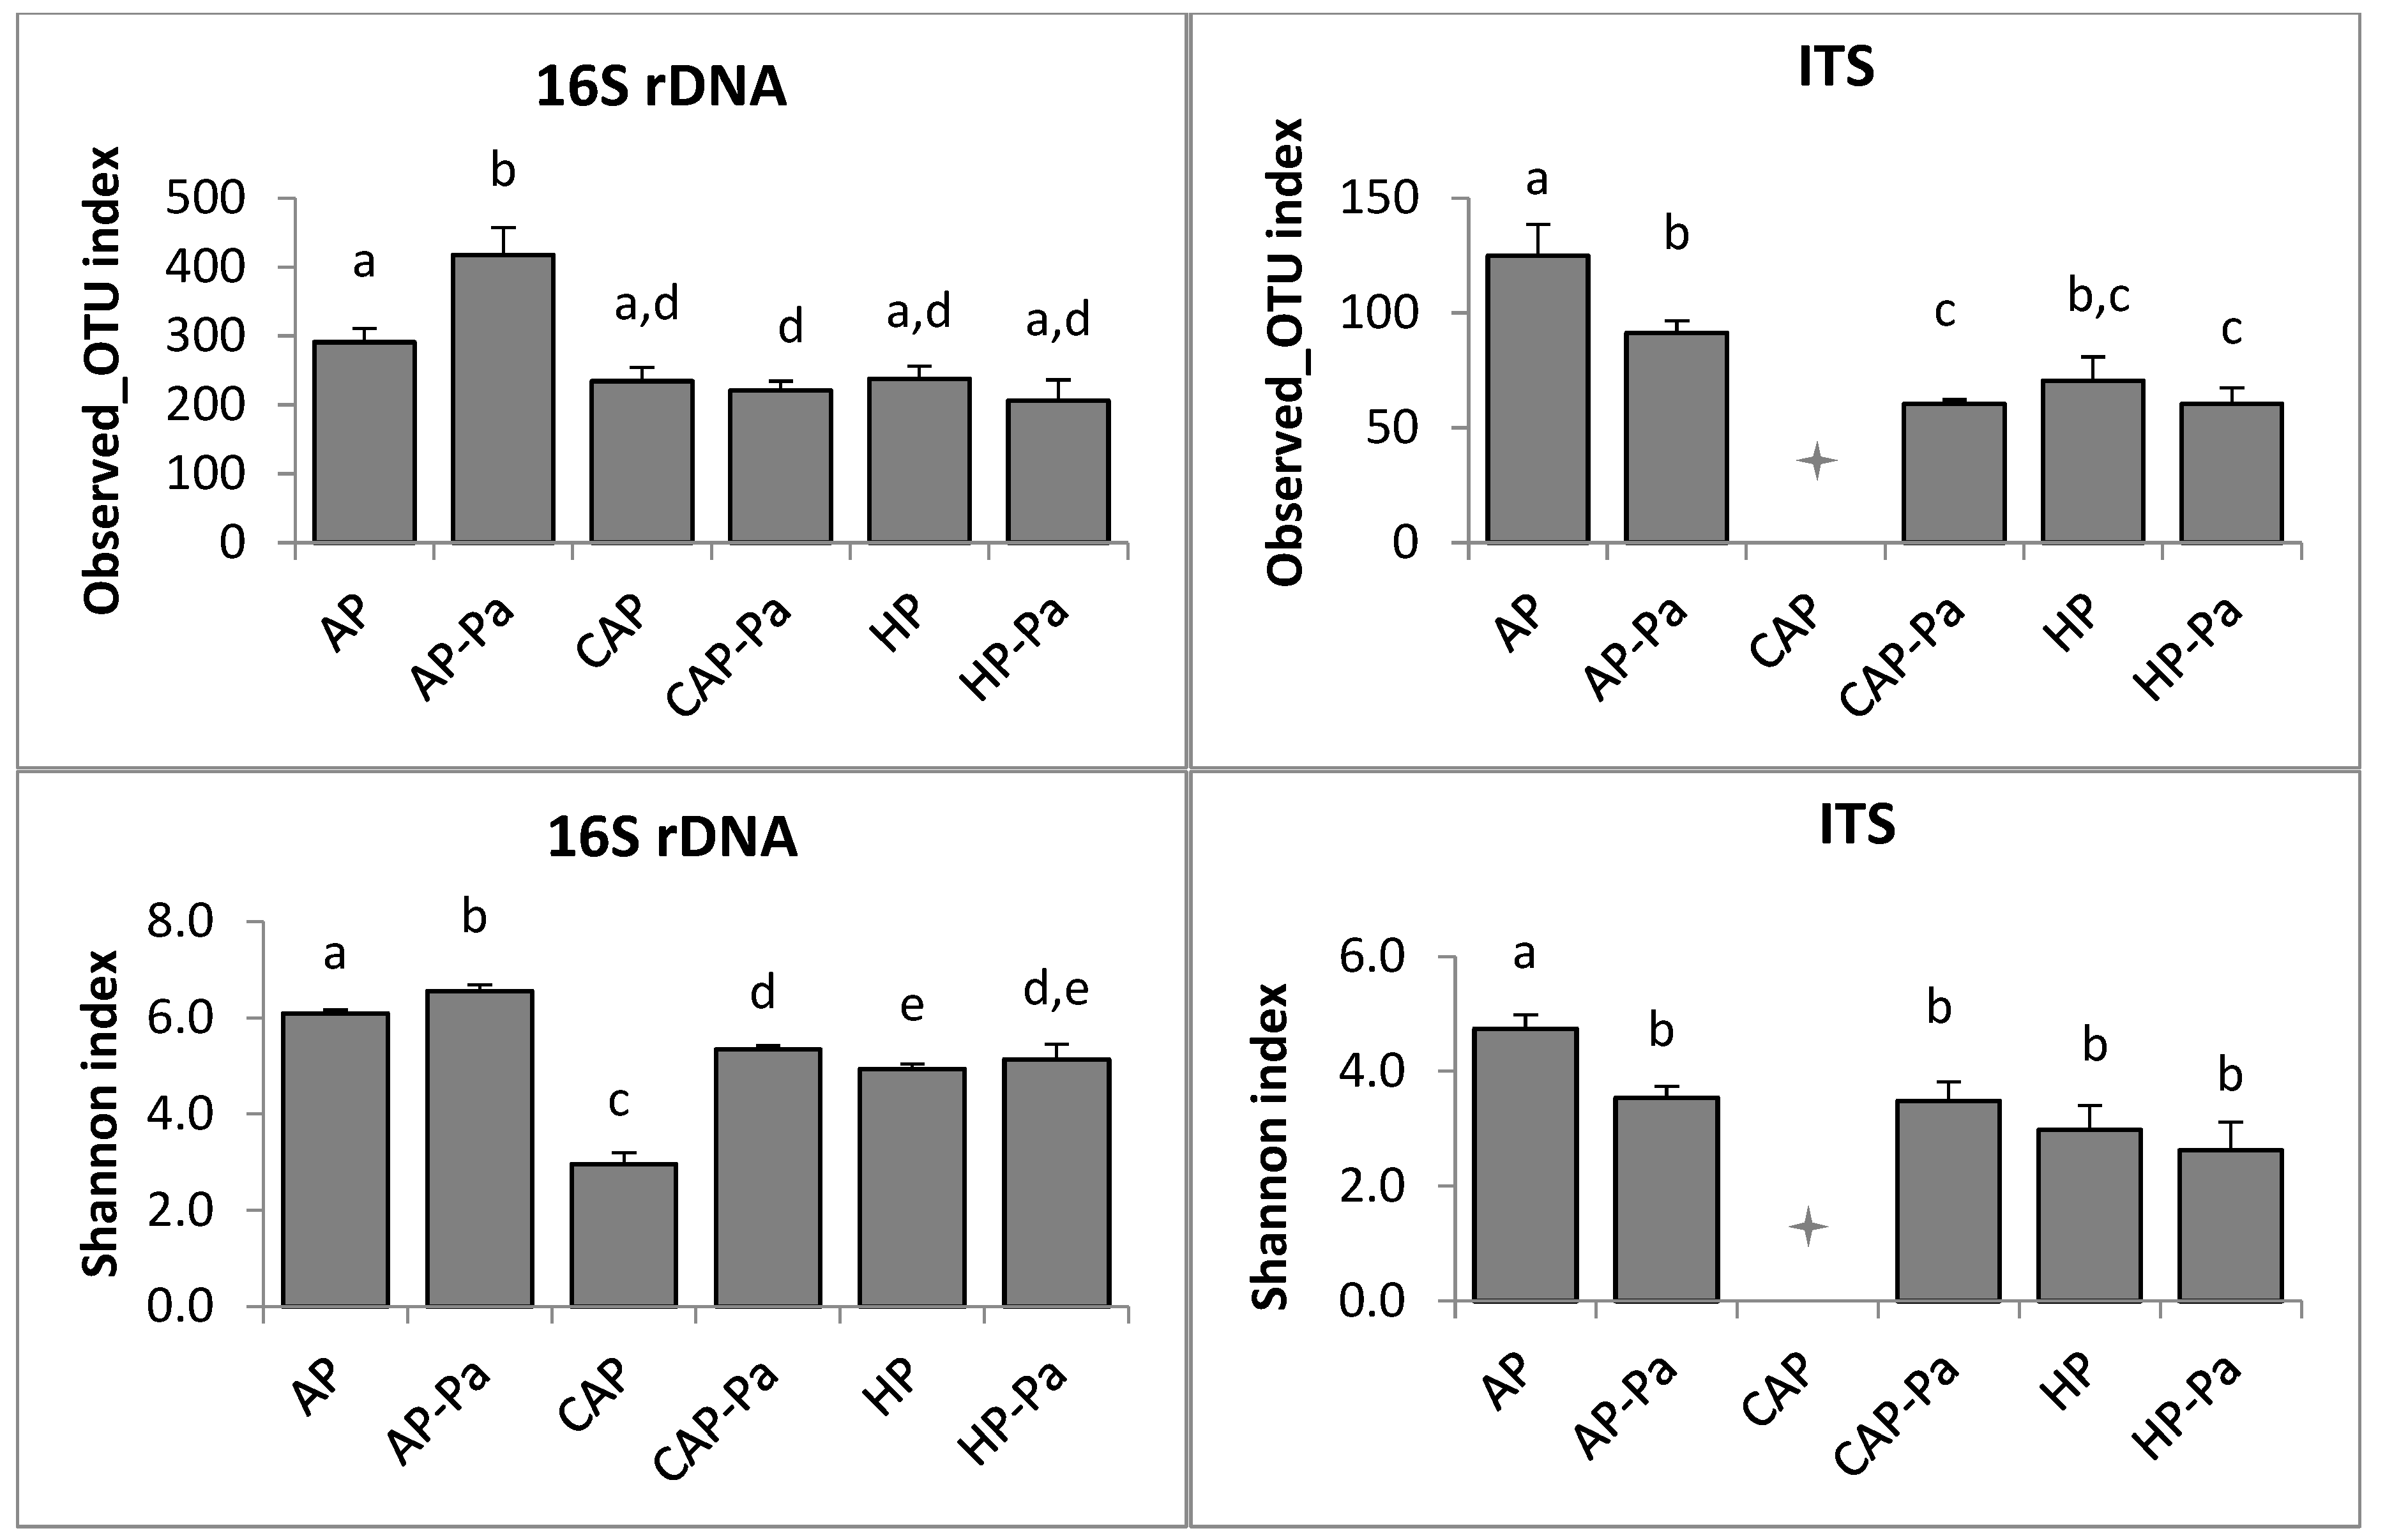

| Modalities | ||||
|---|---|---|---|---|
| Test Name | Broth Composition with 25% of the Water Tested | Broth Composition with 25% of the Filtrated Water Tested | Positive Control Broth Composition | |
| RAS * | 15 mL of V8-75% + 5 mL of RAS water | 15 mL of V8-75% + 5 mL of F-RAS water | V8 | |
| AP * | 15 mL of V8-75% + 5 mL of AP water | 15 mL of V8-75% + 5 mL of F-AP water | V8 | |
| BM * | 15 mL of V8-75% + 5 mL of BM water | 15 mL of V8-75% + 5 mL of KPBT | ||
| Correlation Coefficients with Suppressiveness Indexes | ||||
|---|---|---|---|---|
| FfMD | FdMD | FTD | CRRR | |
| 16S rDNA analysis | ||||
| Species richness (Observed_OTU number) | −0.40 | −0.24 | −0.37 | −0.55 |
| Species diversity (Shannon index) | −0.83 * | −0.77 * | −0.83 * | −0.71 * |
| ITS analysis | ||||
| Species richness (Observed_OTU number) | −0.82 * | −0.57 | −0.65 | −0.78 * |
| Species diversity (Shannon index) | −0.86 * | −0.75 * | −0.84 * | −0.79 * |
| Bacterial Taxa of Corresponding OTU and Their Mean Abundance in AP | Correlation Coefficients with Suppressiveness Indexes | |||
|---|---|---|---|---|
| FfMD | FdMD | FTD | CRRR | |
| f_Rhodocyclaceae; g_Methyloversatilis: 8.02% * | −0.88 * | −0.62 * | −0.79 * | −0.95 * |
| f_Burkholderiaceae: 7.30% * | −0.89 * | −0.61 * | −0.75 * | −0.98 * |
| f_Sphingomonadaceae; g_Sphingobium: 5.61% * | −0.87 * | −0.61 * | −0.73 * | −0.95 * |
| f_Microscillaceae; g_uncultured: 5.01% * | −0.88 * | −0.61 * | −0.74 * | −0.97 * |
| f_Streptococcaceae; g_Streptococcus; s_unculturedbact: 3.97% * | −0.78 * | −0.43 | −0.58 * | −0.89 * |
| f_Lactobacillaceae; g_Lactobacillus; s_unculturedbact: 3.87% * | −0.77 * | −0.45 | −0.60 * | −0.86 * |
| f_Pedosphaeraceae; g_unculturedbact: 3.62% * | −0.88 * | −0.60 * | −0.73 * | −0.98 * |
| f_Burkholderiaceae: 3.51% * | −0.81 * | −0.55 | −0.63 * | −0.84 * |
| f_Sphingomonadaceae; g_Sphingobium: 3.46% * | −0.79 * | −0.49 | −0.65 * | −0.92 * |
| c_Blastocatellia(Subgroup4); o_11–24; f_unculturedbact: 2.62% * | −0.90 * | −0.60 * | −0.75 * | −1.00 * |
| f_Burkholderiaceae: 2.62% * | −0.89 * | −0.62 * | −0.74 * | −0.97 * |
| f_Burkholderiaceae; g_Hydrogenophaga; s_unculturedbact: 2.46% * | −0.89 * | −0.61 * | −0.74 * | −0.97 * |
| f_Burkholderiaceae; g_Hydrogenophaga; s_unculturedbact: 2.17% * | −0.89 * | −0.61 * | −0.75 * | −0.98 * |
| c_Gammaproteobacteria; o_CCD24: 2.11% * | −0.88 * | −0.61 * | −0.74 * | −0.97 * |
| f_Burkholderiaceae: 1.77% * | −0.89 * | −0.61 * | −0.75 * | −0.98 * |
| f_Lactobacillaceae; g_Lactobacillus: 1.43% * | −0.87 * | −0.55 | −0.66 * | −0.94 * |
| f_Hyphomicrobiaceae; g_Hyphomicrobium: 1.36% * | −0.82 * | −0.53 | −0.67 * | −0.94 * |
| f_Nitrosomonadaceae: 1.19% * | −0.87 * | −0.59 * | −0.75 * | −0.97 * |
| f_Nitrosomonadaceae; g_MND1; s_unculturedbact: 1.17% * | −0.85 * | −0.58 * | −0.73 * | −0.94 * |
| f_Saprospiraceae; g_uncultured; s_unculturedbact: 1.17% * | −0.82 * | −0.56 | −0.71 * | −0.93 * |
| f_Chromobacteriaceae; g_Vogesella; s.unculturedbact: 1.06% * | −0.81 * | −0.58 * | −0.65 * | −0.87 * |
| f_Fimbriimonadaceae: 0.99% * | −0.85 * | −0.54 | −0.73 * | −0.96 * |
| f_Propionibacteriaceae; g_Propionibacterium: 0.89% * | −0.75 * | −0.48 | −0.61 * | −0.81 * |
| f_Gemmataceae; g_uncultured; s_unculturedbact: 0.89% * | −0.81 * | −0.53 | −0.71 * | −0.93 * |
| f_Methylophilaceae; g_Methylophilus; s_unculturedbact: 0.82% | −0.56 | −0.52 | −0.51 | −0.46 |
| f_Reyranellaceae; g_Reyranella: 0.79% * | −0.84 * | −0.57 | −0.72 * | −0.95 * |
| f_Lactobacillaceae; g_Lactobacillus: 0.79% * | −0.82 * | −0.52 | −0.63 * | −0.86 * |
| f_Burkholderiaceae: 0.71% * | −0.90 * | −0.62 * | −0.75 * | −0.98 * |
| f_Sphingomonadaceae: 0.71% * | −0.86 * | −0.57 | −0.74 * | −0.96 * |
| f_Nocardiaceae; g_Rhodococcus; Ambiguous_taxa: 0.71% * | −0.28 | −0.53 | −0.48 | 0.08 |
| Bacterial Taxa of Corresponding OTU and Their Mean Abundance in AP | Correlation Coefficients with Suppressiveness Indexes | |||
|---|---|---|---|---|
| FfMD | FdMD | FTD | CRRR | |
| k_Fungi; uncultured: 13.91% | −0.50 | −0.11 | −0.45 | −0.64 |
| k_Fungi; f_Debaryomycetaceae;g_Meyerozyma: 13.16% | 0.54 | 0.78 * | 0.80 * | 0.27 |
| k_Fungi: 9.30% | −0.50 | −0.33 | −0.42 | −0.50 |
| k_Fungi; f_Catenariaceae;g_Catenaria;s_unidentified: 4.70% * | −0.77 * | −0.36 | −0.68 | −0.90 * |
| k_Fungi; uncultured: 4.30% * | −0.67 | −0.32 | −0.63 | −0.78 * |
| k_Fungi; uncultured: 4.09% * | −0.82 * | −0.44 | −0.70 | −0.90 * |
| k_Fungi; f_Catenariaceae;g_Catenaria;s_unidentified: 3.79% * | −0.79 * | −0.33 | −0.71 * | −0.94 * |
| k_Protista; c_Kinetoplastida: 3.70% * | −0.70 | −0.26 | −0.63 | −0.85 * |
| k_Protista; c_Kinetoplastida: 2.98% * | −0.68 | −0.30 | −0.60 | −0.82 * |
| k_Fungi o_Rhizophydiales: 2.76% * | −0.76 * | −0.41 | −0.69 | −0.85 * |
| k_Fungi; uncultured: 2.64% | −0.16 | −0.11 | −0.23 | −0.22 |
| k_Protista; g_Trypanosoma: 1.79% | −0.76 * | −0.51 | −0.75 * | −0.73 * |
| k_Protista; g_Trypanosoma: 1.52% | −0.73 * | −0.40 | −0.68 | −0.75 * |
| k_Fungi; uncultured: 1.47% * | −0.65 | −0.20 | −0.63 | −0.83 * |
| k_Fungi; o_Dothideales: 1.38% | −0.43 | −0.29 | −0.34 | −0.36 |
| k_Fungi; uncultured: 1.08% * | −0.81 * | −0.37 | −0.73 * | −0.95 * |
| k_Fungi; uncultured: 1.05% * | −0.81 * | −0.40 | −0.72 * | −0.92 * |
| k_Fungi; g_Cladosporium: 1.01% | −0.44 | −0.31 | −0.34 | −0.37 |
| k_Fungi;uncultured : 0.95% | −0.05 | −0.45 | −0.15 | 0.13 |
| k_Protista; g_Trypanosoma: 0.93% * | −0.71 | −0.40 | −0.66 | −0.77 * |
| k_Viridiplantae; Embryophyta: 0.89% * | −0.80 * | −0.41 | −0.67 | −0.86 * |
| k_Protista; g_Trypanosoma: 0.82% * | −0.76 * | −0.51 | −0.68 | −0.73 * |
| k_Fungi; o_Ustilaginales: 0.77% | −0.35 | −0.22 | −0.27 | −0.32 |
| k_Fungi; f_Ustilaginaceae: 0.75% | −0.49 | −0.32 | −0.31 | −0.42 |
| k_Fungi; o_Pleosporales: 0.64% | −0.26 | −0.15 | −0.29 | −0.26 |
| k_Fungi; g_Cladosporium: 0.62% | −0.14 | −0.11 | −0.17 | −0.07 |
| f_Fungi; p_Ascomycota; Pezizomycotina: 0.52% | −0.40 | −0.16 | −0.45 | −0.53 |
| k_Fungus: 0.51% | −0.68 | −0.34 | −0.72 * | −0.74 * |
| k_Fungi; f_Aspergillaceae: 0.48% | −0.57 | −0.05 | −0.26 | −0.72 * |
| k_Fungi; f_Hypocreales_fam_Incertae_sedis: 0.46% * | −0.85 * | −0.49 | −0.74 * | −0.92 * |
Publisher’s Note: MDPI stays neutral with regard to jurisdictional claims in published maps and institutional affiliations. |
© 2020 by the authors. Licensee MDPI, Basel, Switzerland. This article is an open access article distributed under the terms and conditions of the Creative Commons Attribution (CC BY) license (http://creativecommons.org/licenses/by/4.0/).
Share and Cite
Stouvenakers, G.; Massart, S.; Depireux, P.; Jijakli, M.H. Microbial Origin of Aquaponic Water Suppressiveness against Pythium aphanidermatum Lettuce Root Rot Disease. Microorganisms 2020, 8, 1683. https://doi.org/10.3390/microorganisms8111683
Stouvenakers G, Massart S, Depireux P, Jijakli MH. Microbial Origin of Aquaponic Water Suppressiveness against Pythium aphanidermatum Lettuce Root Rot Disease. Microorganisms. 2020; 8(11):1683. https://doi.org/10.3390/microorganisms8111683
Chicago/Turabian StyleStouvenakers, Gilles, Sébastien Massart, Pierre Depireux, and M. Haïssam Jijakli. 2020. "Microbial Origin of Aquaponic Water Suppressiveness against Pythium aphanidermatum Lettuce Root Rot Disease" Microorganisms 8, no. 11: 1683. https://doi.org/10.3390/microorganisms8111683