Article

Characterization of the Microbiome of Corals with Stony Coral Tissue Loss Disease along Florida’s Coral Reef

1
Elizabeth Moore International Center for Coral Reef Research and Restoration, Mote Marine Laboratory, Summerland Key, FL 33042, USA
2
Mote Marine Laboratory, Sarasota, FL 34236, USA
3
South Florida Regional Laboratory, Fish & Wildlife Research Institute, Florida Fish & Wildlife Conservation Commission, Marathon, FL 33050, USA
4
Cooperative Institute for Marine and Atmospheric Studies, University of Miami, Miami, FL 33149, USA
5
Atlantic Oceanographic and Meteorological Laboratory, National Oceanic and Atmospheric Administration, Miami, FL 33149, USA
6
Fish & Wildlife Research Institute, Florida Fish & Wildlife Conservation Commission, Saint Petersburg, FL 33701, USA
*
Author to whom correspondence should be addressed.
Microorganisms 2021, 9(11), 2181; https://doi.org/10.3390/microorganisms9112181
Submission received: 31 August 2021 / Revised: 5 October 2021 / Accepted: 12 October 2021 / Published: 20 October 2021

Abstract

:
Stony coral tissue loss disease (SCTLD) is an emergent and often lethal coral disease that was first reported near Miami, FL (USA) in 2014. Our objective was to determine if coral colonies showing signs of SCTLD possess a specific microbial signature across five susceptible species sampled in Florida’s Coral Reef. Three sample types were collected: lesion tissue and apparently unaffected tissue of diseased colonies, and tissue of apparently healthy colonies. Using 16S rRNA high-throughput gene sequencing, our results show that, for every species, the microbial community composition of lesion tissue was significantly different from healthy colony tissue and from the unaffected tissue of diseased colonies. The lesion tissue of all but one species (Siderastrea siderea) had higher relative abundances of the order Rhodobacterales compared with other types of tissue samples, which may partly explain why S. siderea lesions often differed in appearance compared to other species. The order Clostridiales was also present at relatively high abundances in the lesion tissue of three species compared to healthy and unaffected tissues. Stress often leads to the dysbiosis of coral microbiomes and increases the abundance of opportunistic pathogens. The present study suggests that Rhodobacterales and Clostridiales likely play an important role in SCTLD.

1. Introduction

Corals host a diversity of microorganisms composed of viruses, fungi, archaea, endolithic algae, protozoa, bacteria, and algal symbionts [1,2,3,4,5]. Microbes living in or on a coral can be beneficial to the coral host by playing important roles in the cycling and recycling of nutrients [6,7,8], the production of amino acids [8,9], protection against pathogens [10,11], and enhancing larval settlement and metamorphosis [12]. Disturbances, such as those caused by climate change, can alter coral–microbe interactions and lead to bleaching, disease, and the mortality of the coral host [13,14,15].
Climate change, overfishing, and pollution are among the many stressors contributing to the decline of coral reef health worldwide [16,17]. As a result of these stressors and others (e.g., sedimentation), there has been an increase in widespread bleaching events, disease incidence, and subsequent mortality among coral communities in recent decades [18,19,20,21,22]. In 2014, a novel coral disease was documented off Southeast Florida, USA, and has since spread through Florida’s Coral Reef (FCR) and across much of the Caribbean region [23,24]. Stony coral tissue loss disease (SCTLD) is believed to affect more than 23 species of scleractinian corals [25]. Signs of active SCTLD include focal or multifocal lesions moving at chronic to acute rates, followed by partial or whole colony tissue loss, often resulting in complete mortality of coral colonies [23,26,27,28,29].
While much remains unknown about SCTLD, advances in our understanding of the etiology [30], spatial epidemiology [31,32,33,34], diagnostics [35], and treatment [29,36,37] of SCTLD have been achieved. Corals, especially many of the major Caribbean reef-building species, exposed to SCTLD experience high mortality [23,38]. For example, >97% of Meandrina meandrites and Dichocoenia stokesii colonies monitored off Miami-Dade County, FL, USA, died in the year following the onset of the SCTLD outbreak [23]. SCTLD is presumed to spread through waterborne transmission and by direct contact [26], and barotropic oceanic currents correlate with the spatio-temporal progress of the disease throughout FCR [31]. The spatio-temporal dynamics indicate that SCTLD follows a contagion model over both large [32] and small [34] spatial scales, again potentially indicating a novel pathogen driving disease dynamics. A causative agent of SCTLD has not yet been identified, making it challenging to identify possible vectors or intermediate hosts. However, a recent study isolated Vibrio coralliilyticus from some active SCTLD lesions and revealed that V. coralliilyticus may play an opportunistic role in exacerbating the disease [35]. Thus, bacteria play an important, possibly secondary, role in lesion advancement in SCTLD [30], and identifying the microbes associated with SCTLD lesions is critical for identifying the key microbiota likely involved in disease progression.
Recent studies have used high-throughput 16S rRNA sequencing to describe the microbiomes of active SCTLD lesions. Meyer et al. [39] compared the microbial community compositions of four species of coral, each displaying signs of active SCTLD: Montastraea cavernosa, Orbicella faveolata, Diploria labyrinthiformis, and Dichocoenia stokesii. The following bacterial orders were enriched in SCTLD lesions of all but one coral species (O. faveolata): Flavobacteriales, Clostridiales, Rhodobacterales, Alteromonadales, and Vibrionales. Rosales et al. [40] identified two bacterial orders, Rhodobacterales and Rhizobiales, in the active lesions of Stephanocoenia intersepta, Diploria labyrinthiformis, Dichocoenia stokesii, and Meandrina meandrites that were more prevalent compared to the microbiomes of the tissue of apparently healthy colonies and the unaffected tissues of diseased colonies. Water samples collected at sites with SCTLD also had relatively high abundances of Rhodobacterales compared to sites with no signs of SCTLD, and both water and sediments shared sequences with lesions of diseased corals [40].
The objectives of the present study were to determine if a specific microbial signature exists in the lesions of corals experiencing SCTLD by characterizing the microbial community (1) between disease outbreak zones (epidemic and vulnerable zones), (2) among sites within each zone, and (3) among coral sample tissue types (lesion and unaffected tissues from diseased colonies, and tissue from apparently healthy colonies). To evaluate the microbial diversity and composition of corals affected by SCTLD, tissues were collected from five coral species; Colpophyllia natans, Pseudodiploria strigosa, Montastraea cavernosa, O. faveolata, and Siderastrea siderea. Samples were collected from sites in the Middle Florida Keys (the epidemic zone) and the Lower Florida Keys (the vulnerable zone). The SCTLD microbial signatures of M. cavernosa and O. faveolata have been characterized previously for samples collected from the endemic zone in Southeast Florida [39], allowing for species-specific comparisons across FCR. Additionally, we collected water samples from our study sites, allowing for a comparison of our results to a previous study which examined the SCTLD microbial signatures in water [40].

2. Materials and Methods

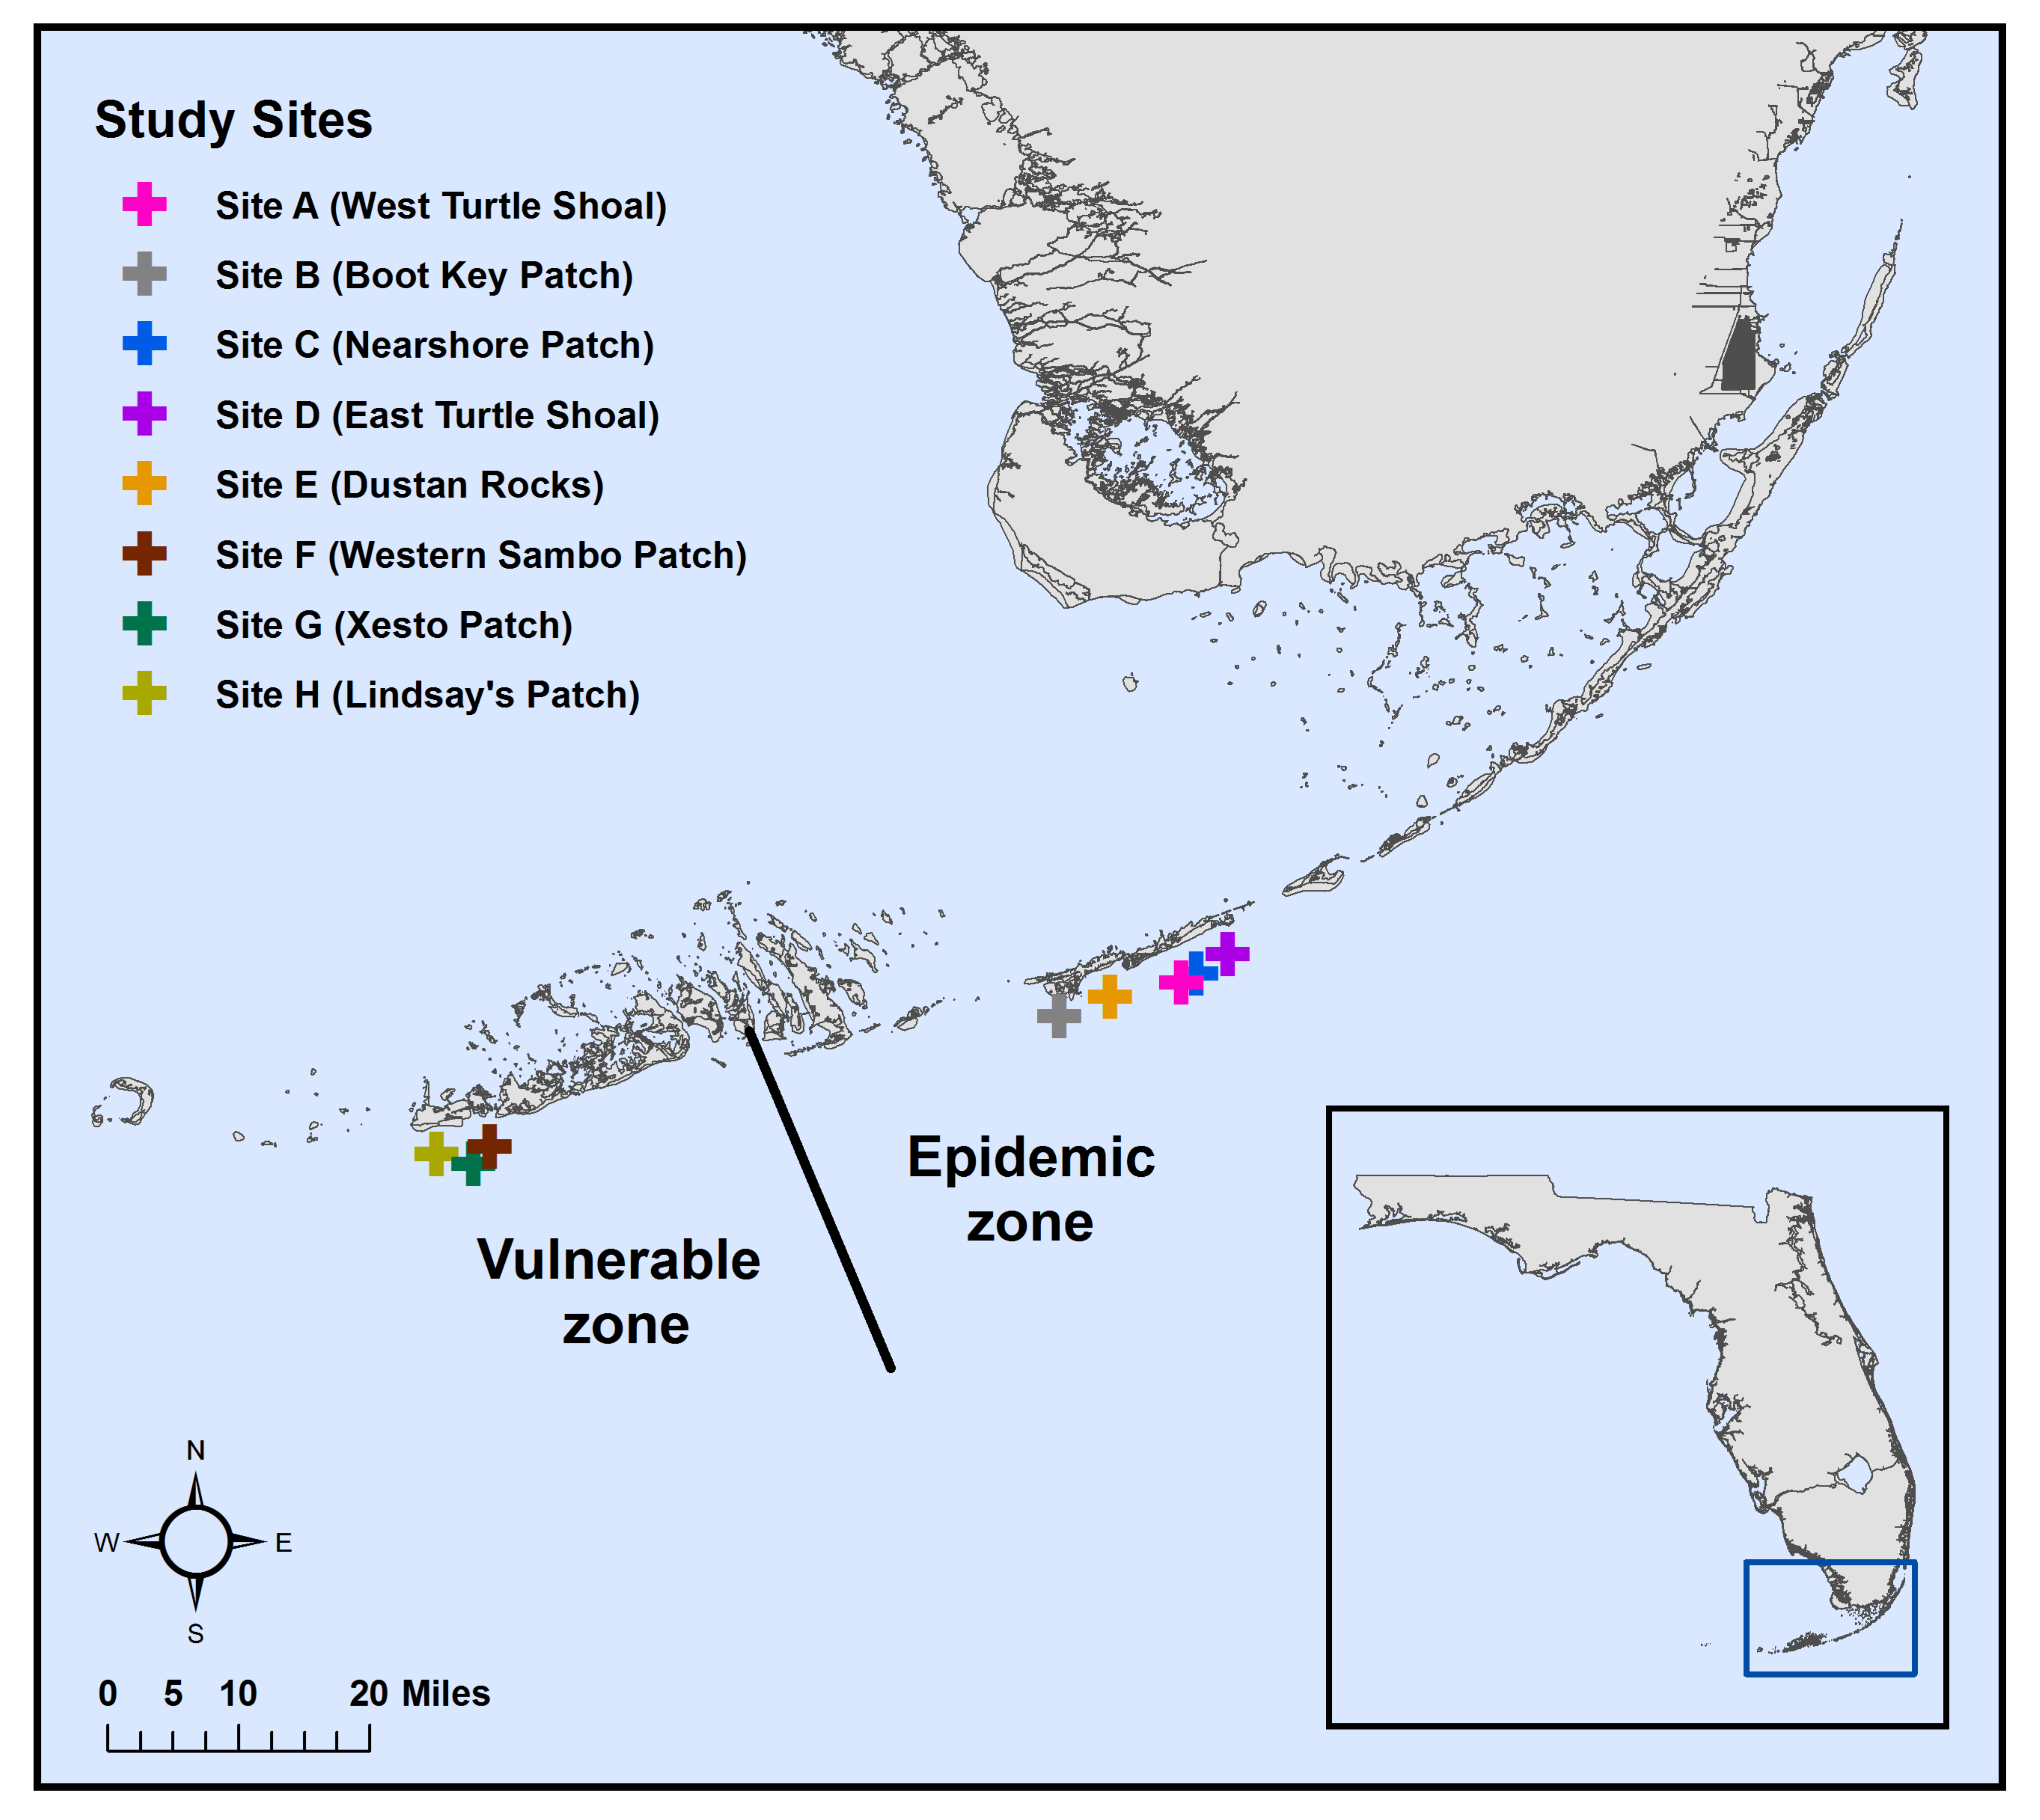
2.1. Sample Collection

From April to June 2018, coral tissue (n = 363) and water samples (n = 24) were collected along Florida’s Coral Reef (FCR) in the Florida Keys, USA (Figure 1; Table 1). Samples were collected at eight sites: five sites in the epidemic zone (Sites A–E), the area of FCR with an active stony coral tissue loss disease (SCTLD) outbreak, and three sites in the vulnerable zone (Sites F–H), the area of FCR located ahead of the epidemic zone. Five coral species susceptible to SCTLD [25] were sampled: Colpophyllia natans, Pseudodiploria strigosa, Montastraea cavernosa, Orbicella faveolata, and Siderastrea siderea. The colonies sampled here were also sampled for histopathological analysis using light microscopy and transmission electron microscopy [30,41].
Techniques and methods developed previously [40] were used to collect coral tissue/mucus and water samples at each of the sites by divers on SCUBA. Divers used a sterile, 10 mL syringe to scrape and remove tissue from most colonies, except S. siderea. Because syringe tips would frequently break when attempting to sample S. siderea colonies, divers used a sterile corer to scrape off the tissue while simultaneously using a syringe to capture the scrapings and mucus. In the epidemic zone, three types of coral samples were collected per species: lesion tissue of diseased colonies (DL; along the disease margin of active lesions; Figure 2), unaffected tissue of diseased colonies (DU; the areas not showing obvious external signs of SCTLD on visibly diseased colonies), and tissue of apparently healthy colonies (AH; colonies with no external signs of SCTLD). For each diseased colony, the DU tissue sample was collected before the DL tissue sample to minimize the risk of contamination from sampling the lesion tissue. At every epidemic site, divers collected DL and DU tissue samples from three to five colonies per species and AH tissue samples from three colonies per species (Table 1). At the three sites in the vulnerable zone, AH tissue samples were collected from two to three colonies per species. Additionally, at each site in each zone, three water samples were collected by inverting sterile, 1 L bottles approximately 0.5 m above the benthos, in proximity of the coral colony sampling area.
On the boat, coral tissue samples were transferred from syringes into plastic tubes before being transported, along with the water sample bottles, on ice directly from the sampling sites to the South Florida Regional Laboratory of the Florida Fish & Wildlife Conservation Commission’s Fish and Wildlife Research Institute (FWC-FWRI, Marathon, FL, USA). At FWRI, water samples were filtered through 0.2 µm filters. All water filters and coral tissue samples were flash-frozen using liquid nitrogen before being immediately transferred to −80 °C for storage.

2.2. Sample Processing

DNA was isolated from all samples using DNeasy PowerSoil Kits (QIAGEN, Germantown, MD, USA) and modifications to the manufacturer’s protocol. The protocol optimized and used previously [40] was employed to isolate DNA from all samples in the present study. However, to standardize concentrations of DNA isolated from the five coral species, the amount of starting material processed for DNA varied depending on the coral species. For S. siderea, DNA was isolated from 6 mL of the coral tissue/mucus slurries, but 2 mL of samples were used for the other four species. Each slurry was then centrifuged and the supernatant was discarded so that only a pellet remained in each tube. For the water samples, half of every 0.2 µm filter was cut into small pieces, which were then transferred to their respective tubes. Next, phenol: chloroform: isoamyl alcohol (pH 7–8; Fisher Scientific Company LLC, Hanover Park, IL, USA) and Solution C1 of the DNeasy PowerSoil Kit were added to every tube, vortexed for 10 min, and centrifuged. The supernatants were then transferred to new tubes to which Solutions C2 and C3 of the DNeasy PowerSoil Kit were added. The process of adding reagents and centrifuging samples continued, as described previously [40], until left with 60 µL of isolated DNA. DNA concentrations and quality were measured with a NanoDrop OneTM Microvolume UV-Vis Spectrophotometer (Thermo Fisher Scientific, Waltham, MA, USA).
DNA was then processed using high-throughput 16S rRNA sequencing (www.mrdnalab.com (accessed on 12 October 2021), Shallowater, TX, USA). The 16S rRNA gene variable region (V4) was amplified using PCR primers 515F (GTGCCAGCMGCCGCGGTAA; Original Earth Microbiome Project) [42] and 806R (GGACTACVSGGGTATCTAAT; Archaea 806R) [43], 1 µL of DNA, and the HotStarTaq Plus Kit (QIAGEN, Germantown, MD, USA). The following thermocycler conditions were used: 94 °C for 3 min, 30 cycles of 94 °C each for 30 s, 53 °C for 40 s, 72 °C for 1 min, and a final elongation step at 72 °C for 5 min. After PCR products were visualized on a 2% agarose gel, samples were pooled and, subsequently, purified using AMPure XP beads (Beckman Coulter Life Sciences, Indianapolis, IL, USA). The pooled sample was processed with a MiSeq Reagent Kit v3 and paired-end sequenced using two lanes of a MiSeq (Illumina, San Diego, CA, USA).

2.3. Data Analysis

Sequences were demultiplexed using the MR DNA free software application, FASTqProcessor (version 20.03.02; www.mrdnalab.com (accessed on 12 October 2021), Shallowater, TX, USA). All other data analyses were completed in the program R (version 4.0.5; R Foundation for Statistical Computing, Vienna, Austria) [44]. The DADA2 pipeline [45] was used to determine amplicon sequence variants (ASVs) by checking read quality, filtering and trimming sequences, dereplicating, merging sequences, and removing chimeras. Since samples were sequenced on two lanes of an Illumina MiSeq, each lane was processed through the DADA2 pipeline individually. Taxonomy was assigned using the Silva (version 132; European Organization for Nuclear Research, Geneva, Switzerland) [46] reference database. Taxonomy tables, ASV tables, and sample data from the two sequencing lanes were then merged and further analysis and processing was completed using the phyloseq package [47]. Following taxonomic assignment, sequences from the coral host, algal symbionts, and eukaryotes were removed. The resulting ASV count data were filtered so that only ASVs present in a minimum of four samples were included in the analysis (similar to Rosales et al. [40]). ASV count data were then normalized using a centered log-ratio (CLR) transformation.
Differences in microbial communities were assessed between zone (epidemic vs. vulnerable), sites within each zone, and tissue sample type (DL, DU, and AH) for each coral species. All tissue sample types (DL, DU, and AH) collected in the epidemic zone were combined for each coral species when comparing sites within the epidemic zone. To measure beta diversity differences, the vegdist function of the R package ‘vegan’ [48] and the CLR-transformed data were used to calculate dissimilarity indices. These indices were then tested for the homogeneity of groups dispersion using the betadisper function and were, subsequently, tested for significance using a permutation test (Permutest) and a Tukey’s honest significant difference (HSD) test. Next, permutational multivariate analysis of variance (PERMANOVA) and pairwise PERMANOVA tests were used to measure differences in bacterial communities among zones, sites, and sample types for each coral species. All PERMANOVA tests were performed using the adonis function in the R package ‘vegan’ with a Euclidean distance. Next, a pairwise comparison was conducted and the p-values generated from this comparison were adjusted using a Bonferroni correction [49]. Non-metric multidimensional scaling (NMDS) with a Euclidean distance was used to generate ordination plots and further evaluate the bacterial community differences among samples.
Alpha diversity metrics (species richness and Shannon diversity) were analyzed using the ‘vegan’ package. Shapiro–Wilks tests were used to test for normality conditions. If the data met normality assumptions, a one-way analysis of variance (ANOVA) and Tukey’s post-hoc test were used. If the data did not meet normality assumptions, then a Kruskal–Wallis rank sum test was used. When significant differences were detected, a post-hoc Wilcoxon signed rank test was then used to determine which groups were significantly different.
An analysis of composition of microbiomes (ANCOM) was used to identify significant ASVs that were differentially abundant among the tissue sample types for each coral species. To perform the ANCOM, a phyloseq object containing the ASV count data and taxonomy was used [50]. The ANCOM results were considered significant if the calculated W-statistic exceeded a detection threshold of 0.7. For each coral species, ANCOM was run with tissue sample type as the independent variable tested and, for water samples, disease outbreak zone was the independent variable. Bar plots displaying the mean relative abundance of bacterial classes present in each species were generated.

3. Results

After data filtration, 16,876 ASVs remained and were included in the analysis. A permutational multivariate analysis of variance (PERMANOVA) test found that bacterial communities of tissue sampled from apparently healthy (AH) colonies in the vulnerable zone were significantly different from the bacterial communities associated with AH tissue in the epidemic zone for each species: Colpophyllia natans (Figure 3A; F1,16 = 1.6007, R2 = 0.06298, p = 0.0053), Pseudodiploria strigosa (Figure 3B; F1,15 = 2.6, R2 = 0.1044, p < 0.0001), Montastraea cavernosa (Figure 3C; F1,15 = 1.7394, R2 = 0.07, p = 0.0002), Orbicella faveolata (Figure 3D; F1,15 = 2.4137, R2 = 0.09132, p < 0.0001), and Siderastrea siderea (Figure 3E; F1,15 = 1.935, R2 = 0.07603, p < 0.0001). Furthermore, there were also significant differences in the bacterial community of the coral species among sites within the zones: C. natans (F6,16 = 1.3024, R2 = 0.3075, p < 0.0001), P. strigosa (F6,15 = 1.2162, R2 = 0.2931, p = 0.0093), M. cavernosa (F6,16 = 1.1849, R2 = 0.2861, p = 0.0003), O. faveolata (F6,16 = 1.3363, R2 = 0.3034, p = 0.0002), and S. siderea (F6,16 = 1.2528, R2 = 0.2953, p < 0.0001). As a result of the differences across zones and among sites, the ASVs generated from colonies in the vulnerable zone were analyzed independently of ASVs associated with the epidemic zone.

3.1. Microbial Community Analysis

3.1.1. Microbial Communities among Sample Types

There were significant differences in the bacterial communities of lesion tissue (DL) from diseased colonies compared with unaffected tissue (DU) from diseased colonies and AH tissues for every species in the epidemic zone: C. natans (Figure 4A; F2,50 = 1.797, R2 = 0.05, p = 0.0002), P. strigosa (Figure 4B; F2,48 = 2.0253, R2 = 0.061, p < 0.00001), M. cavernosa (Figure 4C; F2,50 = 1.6764, R2 = 0.05, p = 0.0005), O. faveolata (Figure 4D; F2,46 = 1.5014, R2 = 0.048, p = 0.0018), and S. siderea (Figure 4E; F2,50 = 1.7955, R2 = 0.05, p < 0.00001). A pairwise comparison of the three tissue sample types revealed that DL tissue was significantly different compared to DU and AH tissues of C. natans, P. strigosa, S. siderea (adjusted p-value (p_adj) = 0.0030 for both comparisons for all three coral species), O. faveolata (p_adj = 0.0060 and p_adj = 0.012 for DU and AH tissues, respectively), and M. cavernosa (p_adj = 0.0030 and p_adj = 0.015 for DU and AH tissues, respectively).

3.1.2. Microbial Communities among Sites within Zones

Among sites in the epidemic zone, there were significant differences in the microbial communities of all three tissue sample types (DL, DU, and AH) pooled (Table S1). However, there were no significant differences in the microbial communities of AH tissues among sites in the vulnerable zone. There were significant differences in the bacterial communities of water collected in the vulnerable zone compared to the epidemic zone (Figure 4F; F1,16 = 3.3523, R2 = 0.11, p = 0.001).

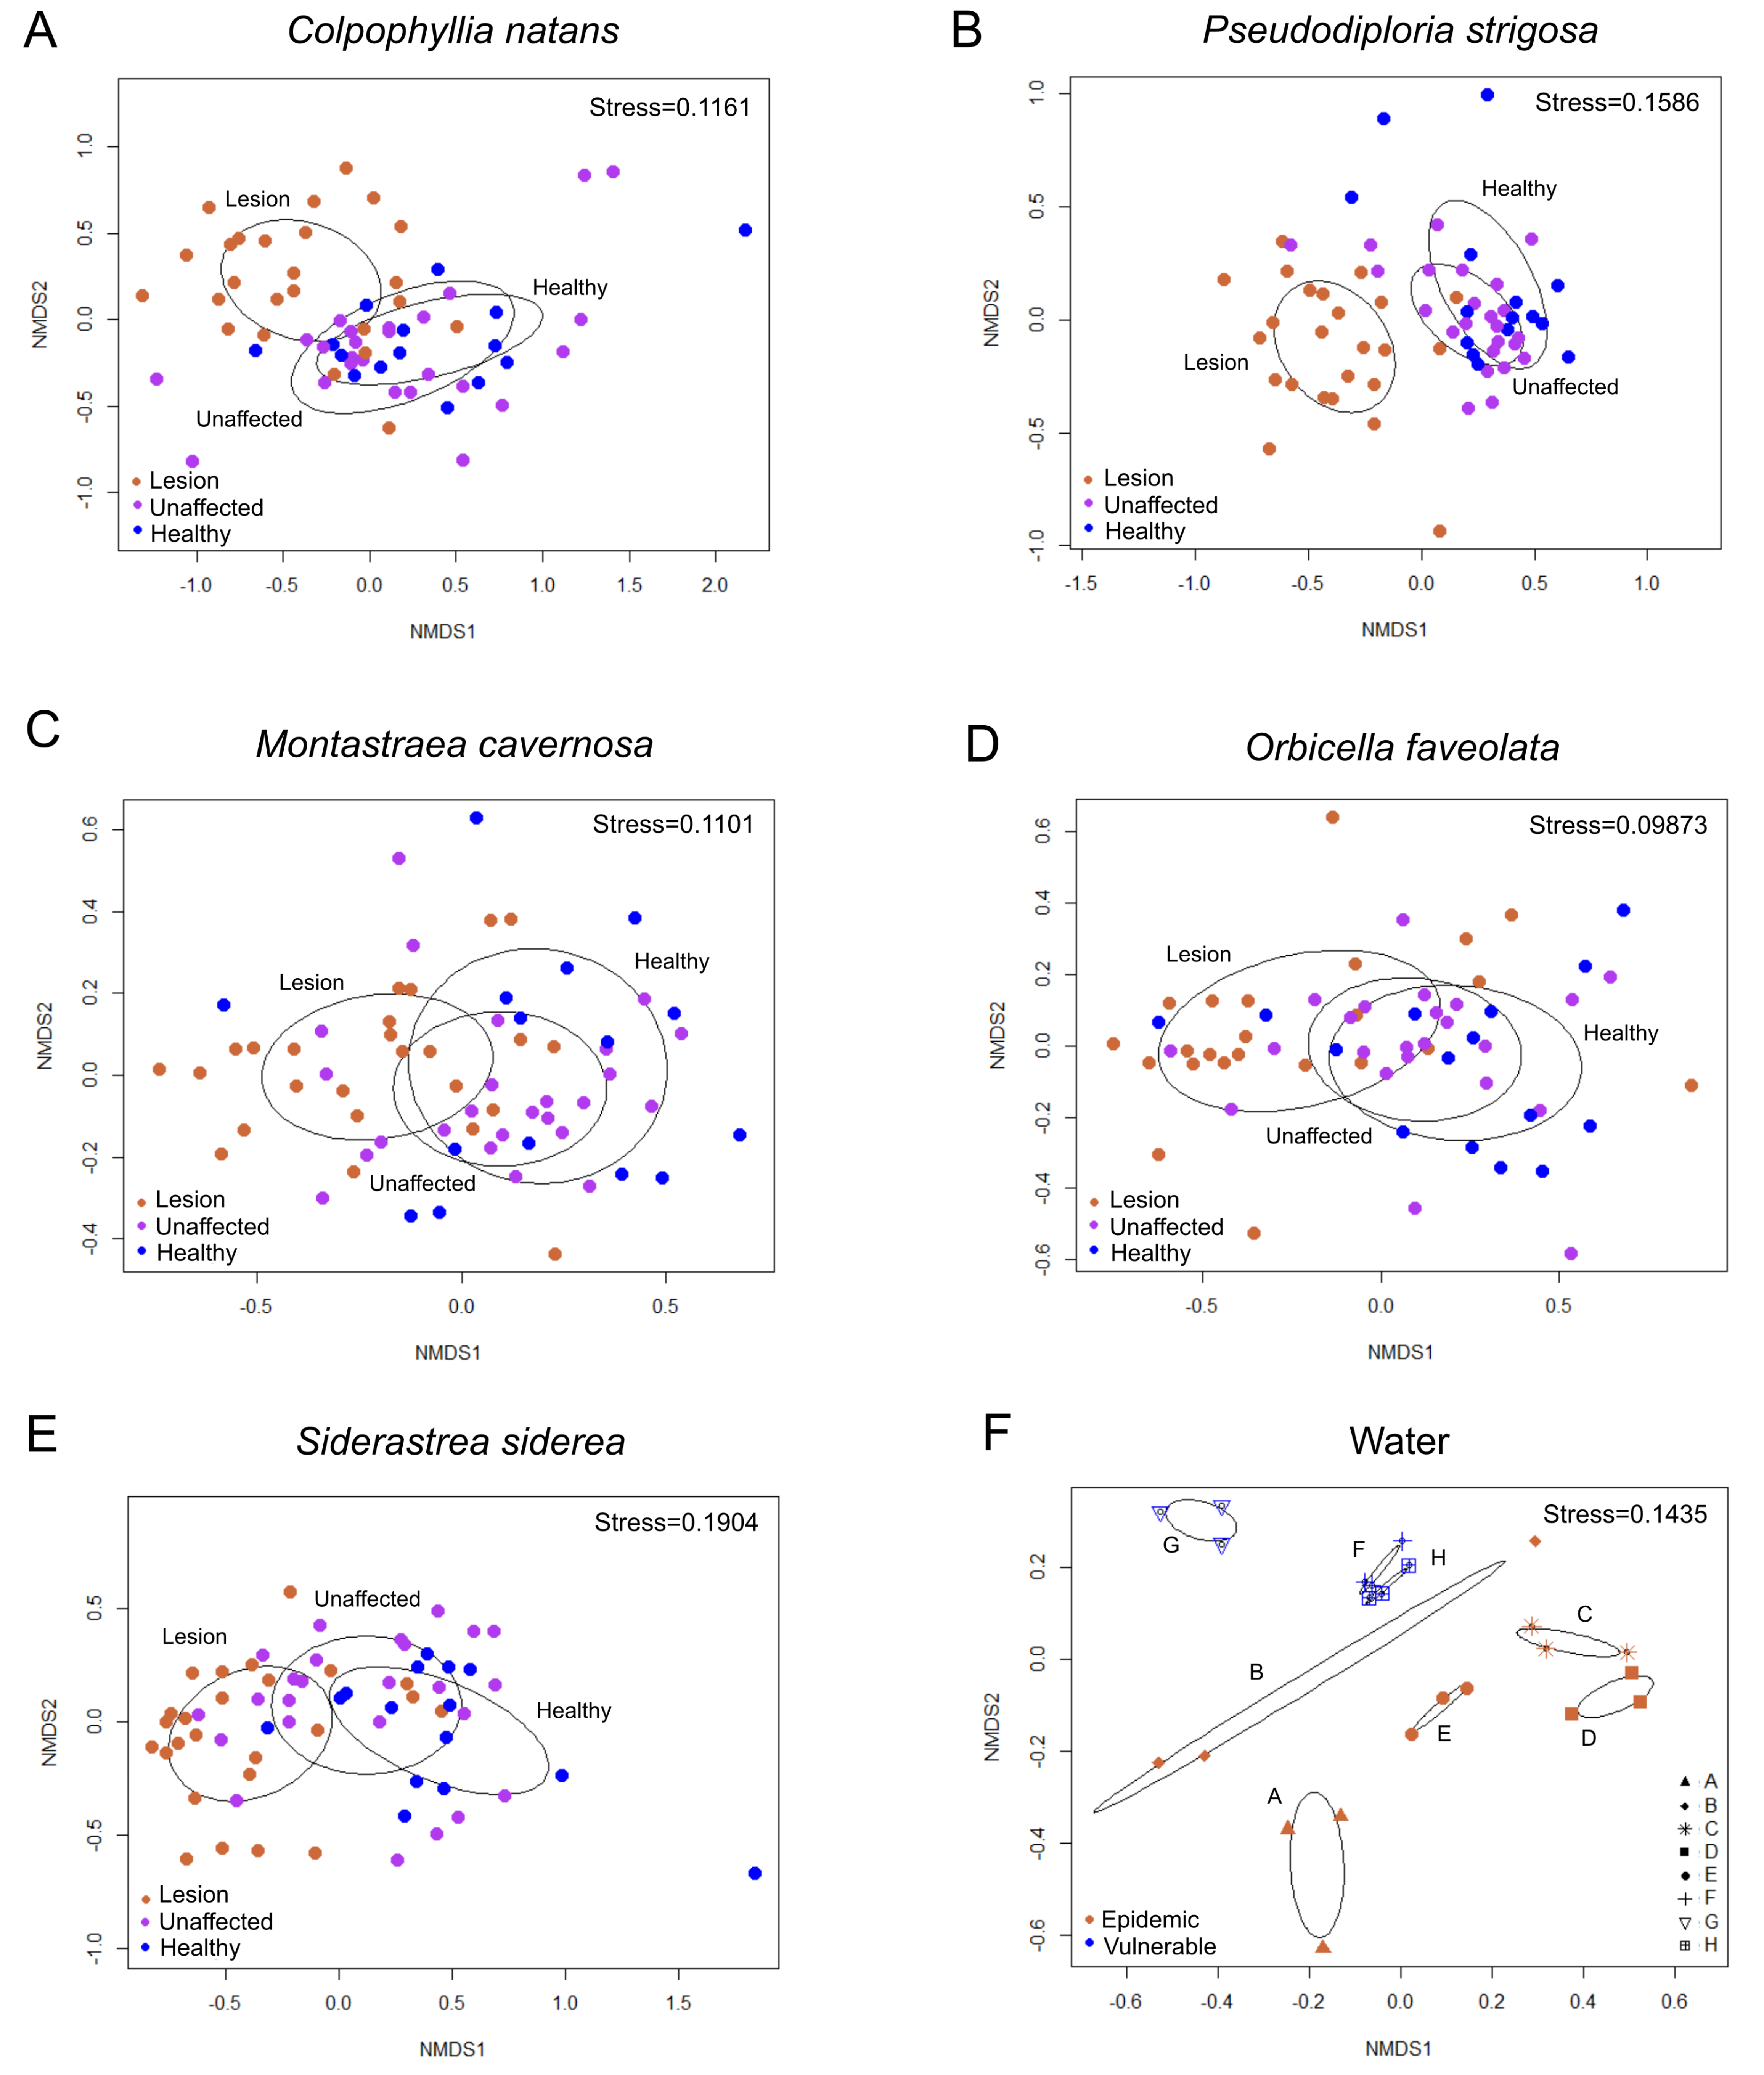
3.2. Beta Diversity Analysis

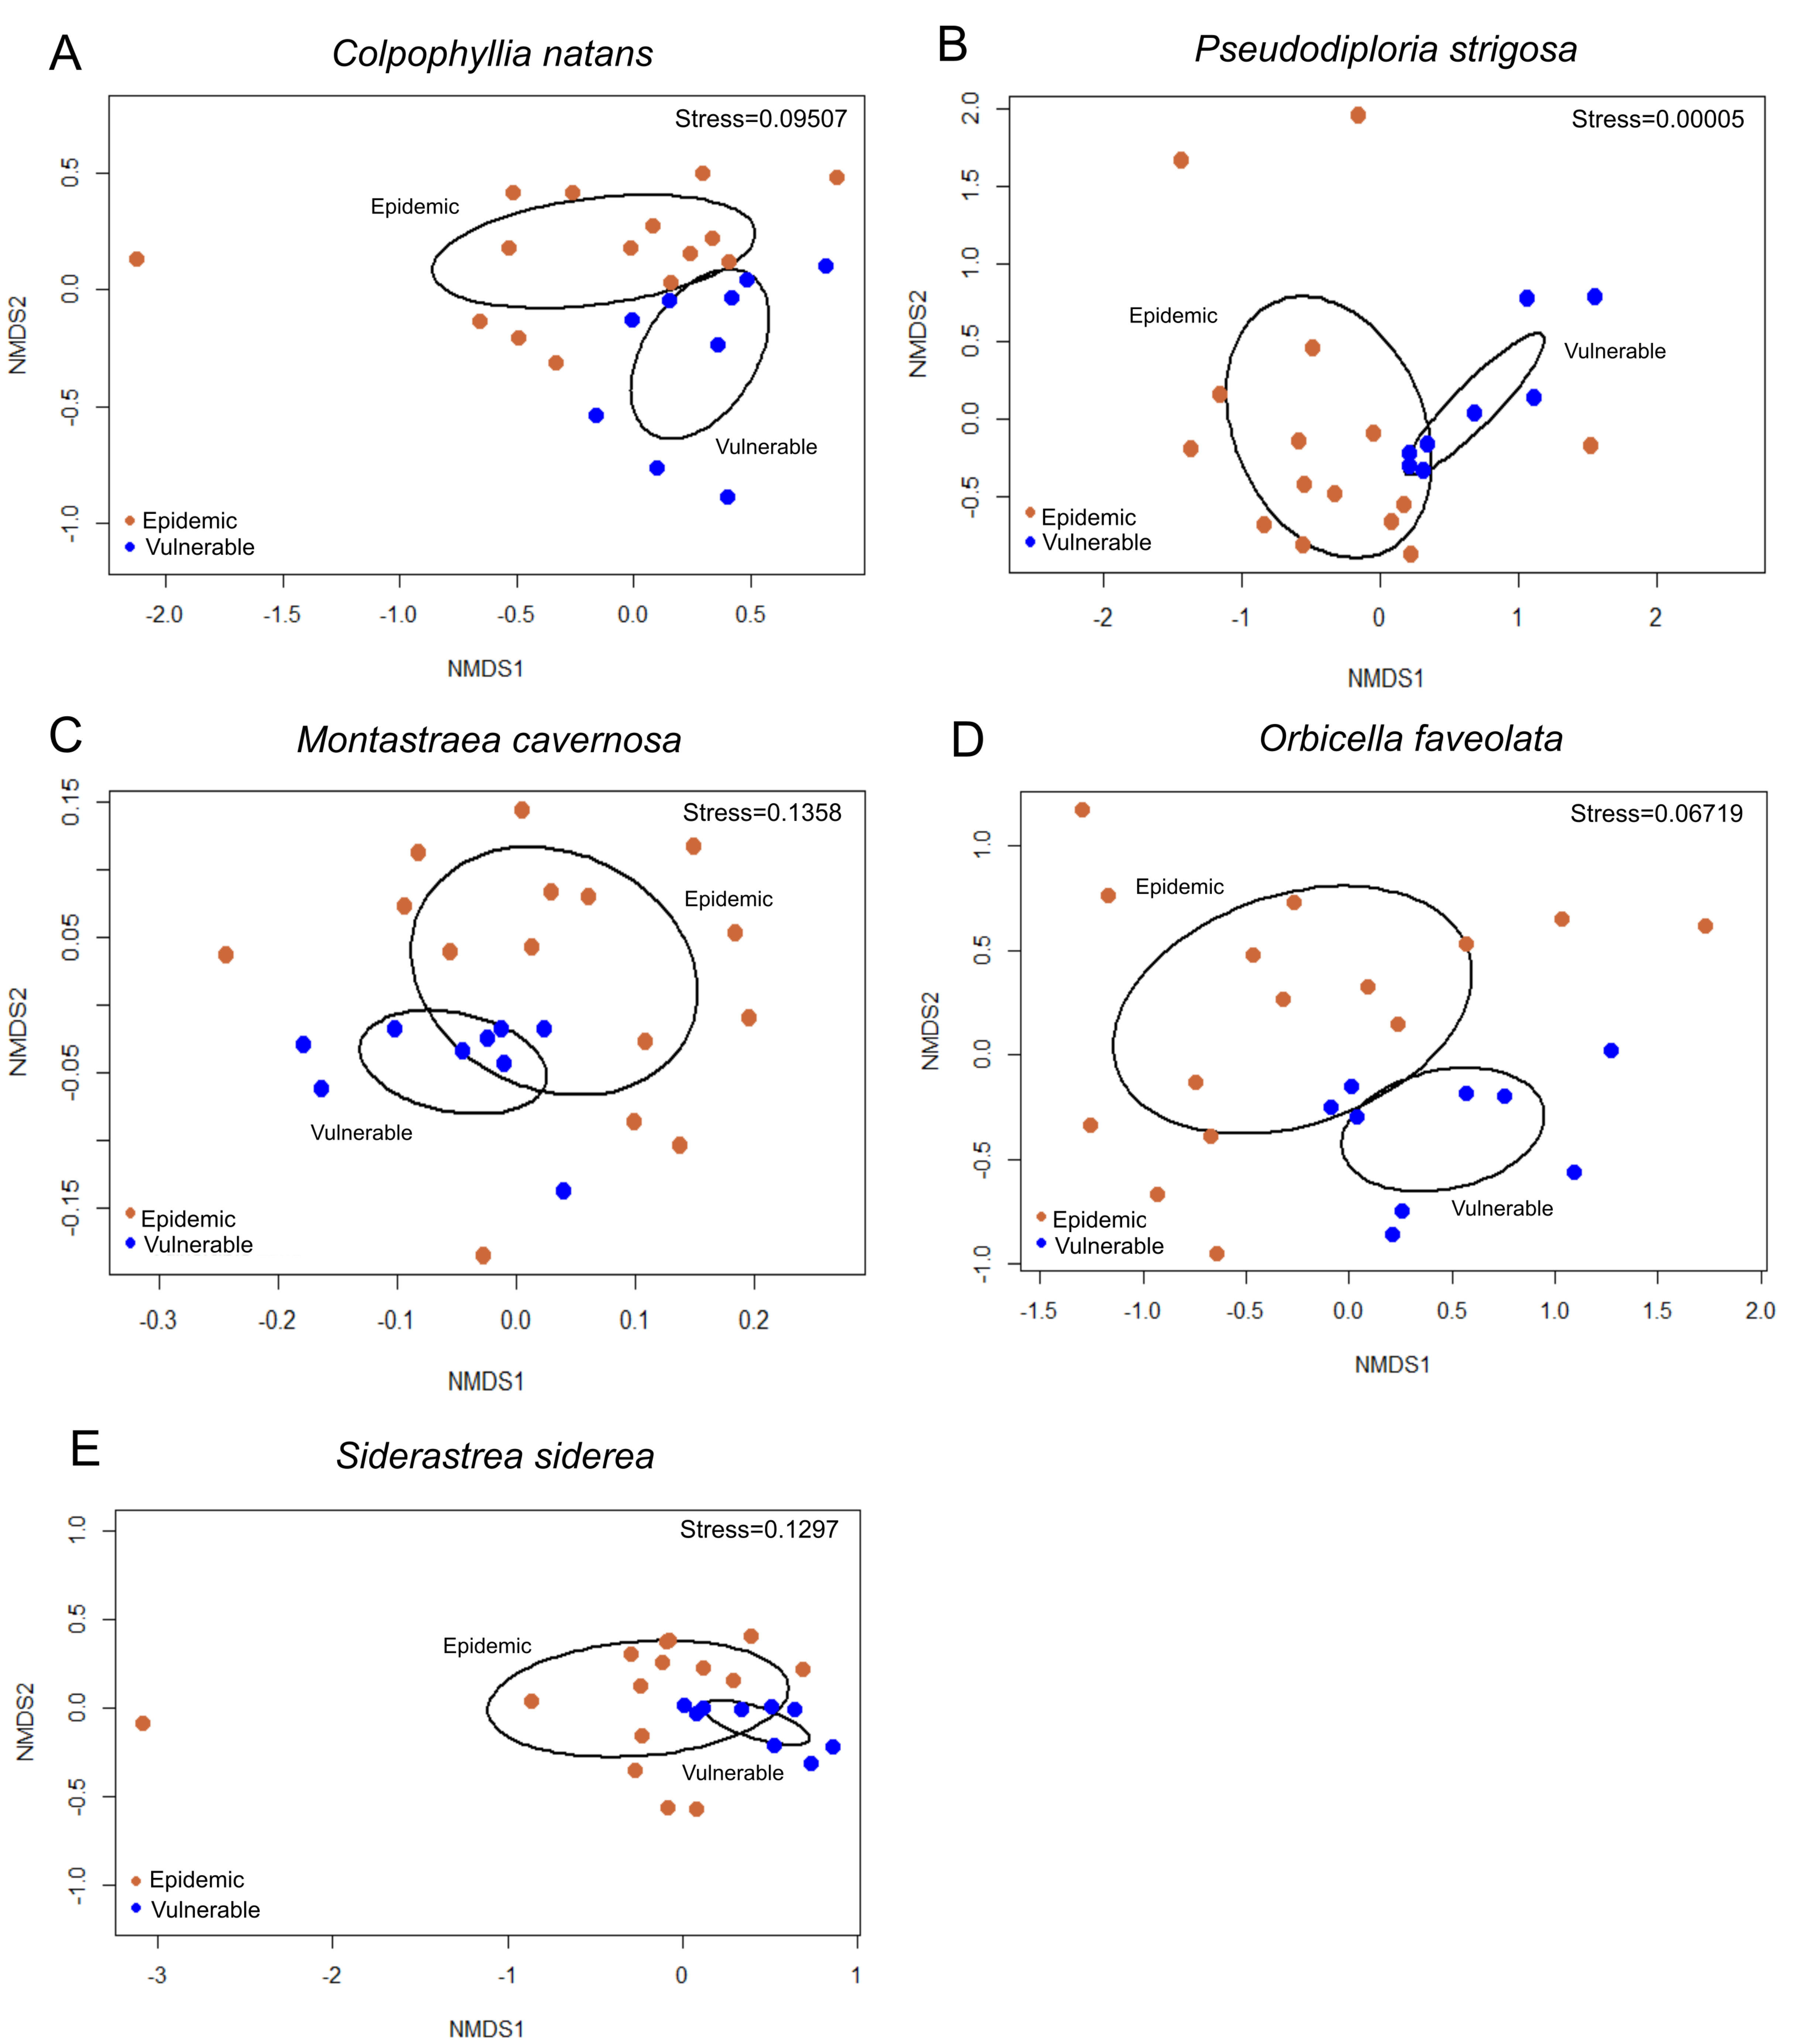
3.2.1. Beta Diversity between Vulnerable and Epidemic Zones

Microbial beta diversity as measured by the betadisper analysis did not significantly differ between the epidemic zone (all three tissue sample types pooled) and the vulnerable zone (AH tissue only) for each coral species: C. natans (F1,72 = 1.6604, p = 0.21), P. strigosa (F1,69 = 2.7863, p = 0.11), M. cavernosa (F1,72 = 0.5917, p = 0.46), and O. faveolata (F1,68 = 0.2523, p = 0.62), except for S. siderea (F1,72 = 4.0684, p = 0.038). Specifically, S. siderea in the epidemic zone was more diverse compared with the vulnerable zone (p_adj = 0.047). There were also no significant differences in the beta diversity of water collected in the epidemic zone compared to the vulnerable zone (F1,22 = 3.0978, p = 0.091).

3.2.2. Beta Diversity among Sites within Zones

There were no significant differences in dispersion among sites within the epidemic zone or within the vulnerable zone for each species: C. natans (epidemic: F4,60 = 1.9158, p = 0.11; vulnerable: F2,6 = 0.2108, p = 0.74), P. strigosa (epidemic: F4,58 = 1.1991, p = 0.32; vulnerable: F2,5 = 0.1423, p = 0.93), M. cavernosa (epidemic: F4,60 = 2.0625, p = 0.10; vulnerable: F2,6 = 0.4821, p = 0.65), O. faveolata (epidemic: F4,56 = 0.4489, p = 0.77; vulnerable: F2,6 = 4.653, p = 0.089), and S. siderea (epidemic: F4,60 = 0.4481, p = 0.76; vulnerable: F2,6 = 0.1885, p = 0.92). There were no significant differences in the beta diversity of water samples among sites in the epidemic zone (F4,10 = 3.2959, p = 0.066) nor the vulnerable zone (F2,6 = 2.8082, p = 0.14).

3.2.3. Beta Diversity among Coral Tissue Sample Types in the Epidemic Zone

There were significant differences in the dispersion of microbial communities (i.e., beta diversity) among coral tissue sample types (DL, DU, and AH) in the epidemic zone for four species: C. natans (F2,62 = 4.7286, p = 0.0070), M. cavernosa (F2,62 = 9.1288, p = 0.0010), O. faveolata (F2,58 = 5.793, p = 0.0030), and S. siderea (F2,62 = 14.051, p = 0.0010; Figure 4A,C–E). Pairwise comparisons revealed that DL tissue of C. natans was more dispersed in only AH tissue (p_adj = 0.013) but not DU tissue. However, DL tissue was more dispersed than both DU and AH tissues for M. cavernosa (p_adj = 0.0011 and p_adj = 0.0029, respectively), O. faveolata (p_adj = 0.027 and 0.0087, respectively), and S. siderea (p_adj = 0.00095 and p_adj = 0.00002, respectively). There were no significant differences in dispersion among P. strigosa tissue sample types (F2,60 = 1.6297, p = 0.20; Figure 4B).

3.2.4. Beta Diversity of Apparently Healthy Colony Tissue in Vulnerable and Epidemic Zones

There were no significant differences in the dispersion of microbial communities (i.e., beta diversity) of AH tissue between the vulnerable zone and the epidemic zone for four species: C. natans (F1,22 = 0.0543, p = 0.80), M. cavernosa (F1,22 = 0.2821, p = 0.63), O. faveolata (F1,22 = 0.5641, p = 0.47), and S. siderea (F1,22 = 0.306, p = 0.55). However, the AH tissue of P. strigosa colonies in the vulnerable zone had a greater dispersion of microbial communities than of those in the epidemic zone (F1,21 = 5.5737, p_adj = 0.028).

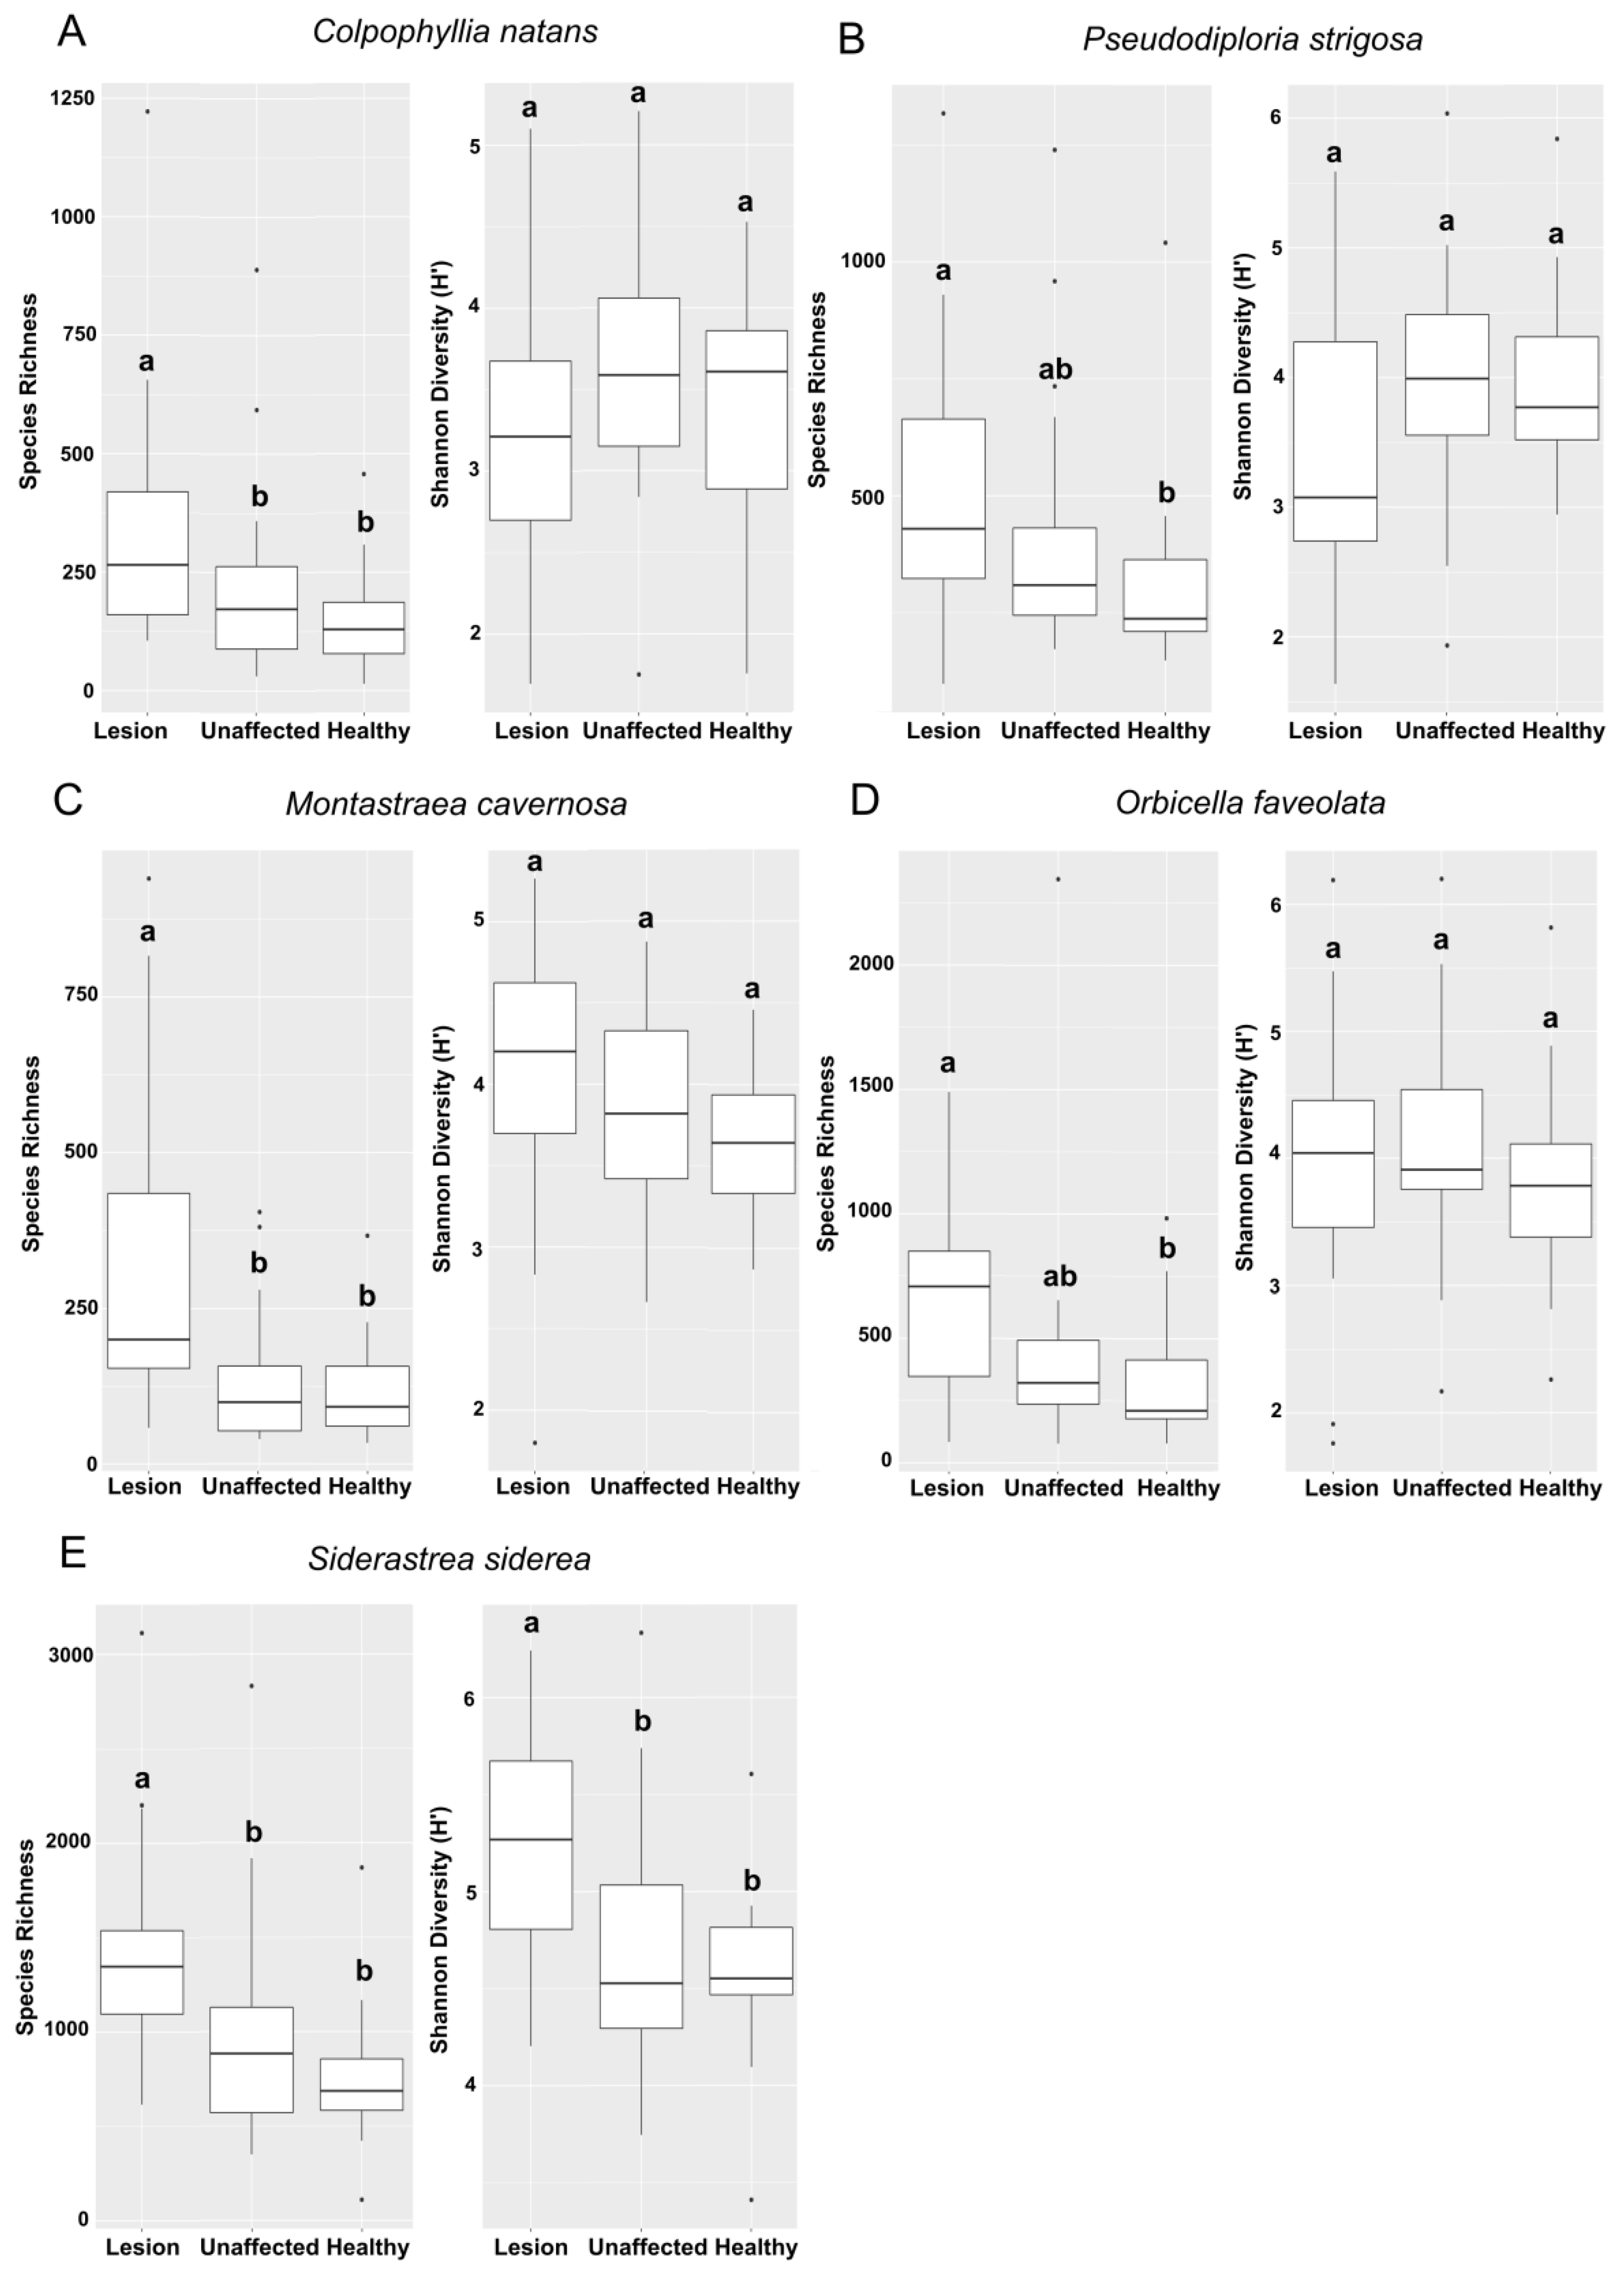
3.3. Alpha Diversity Analysis

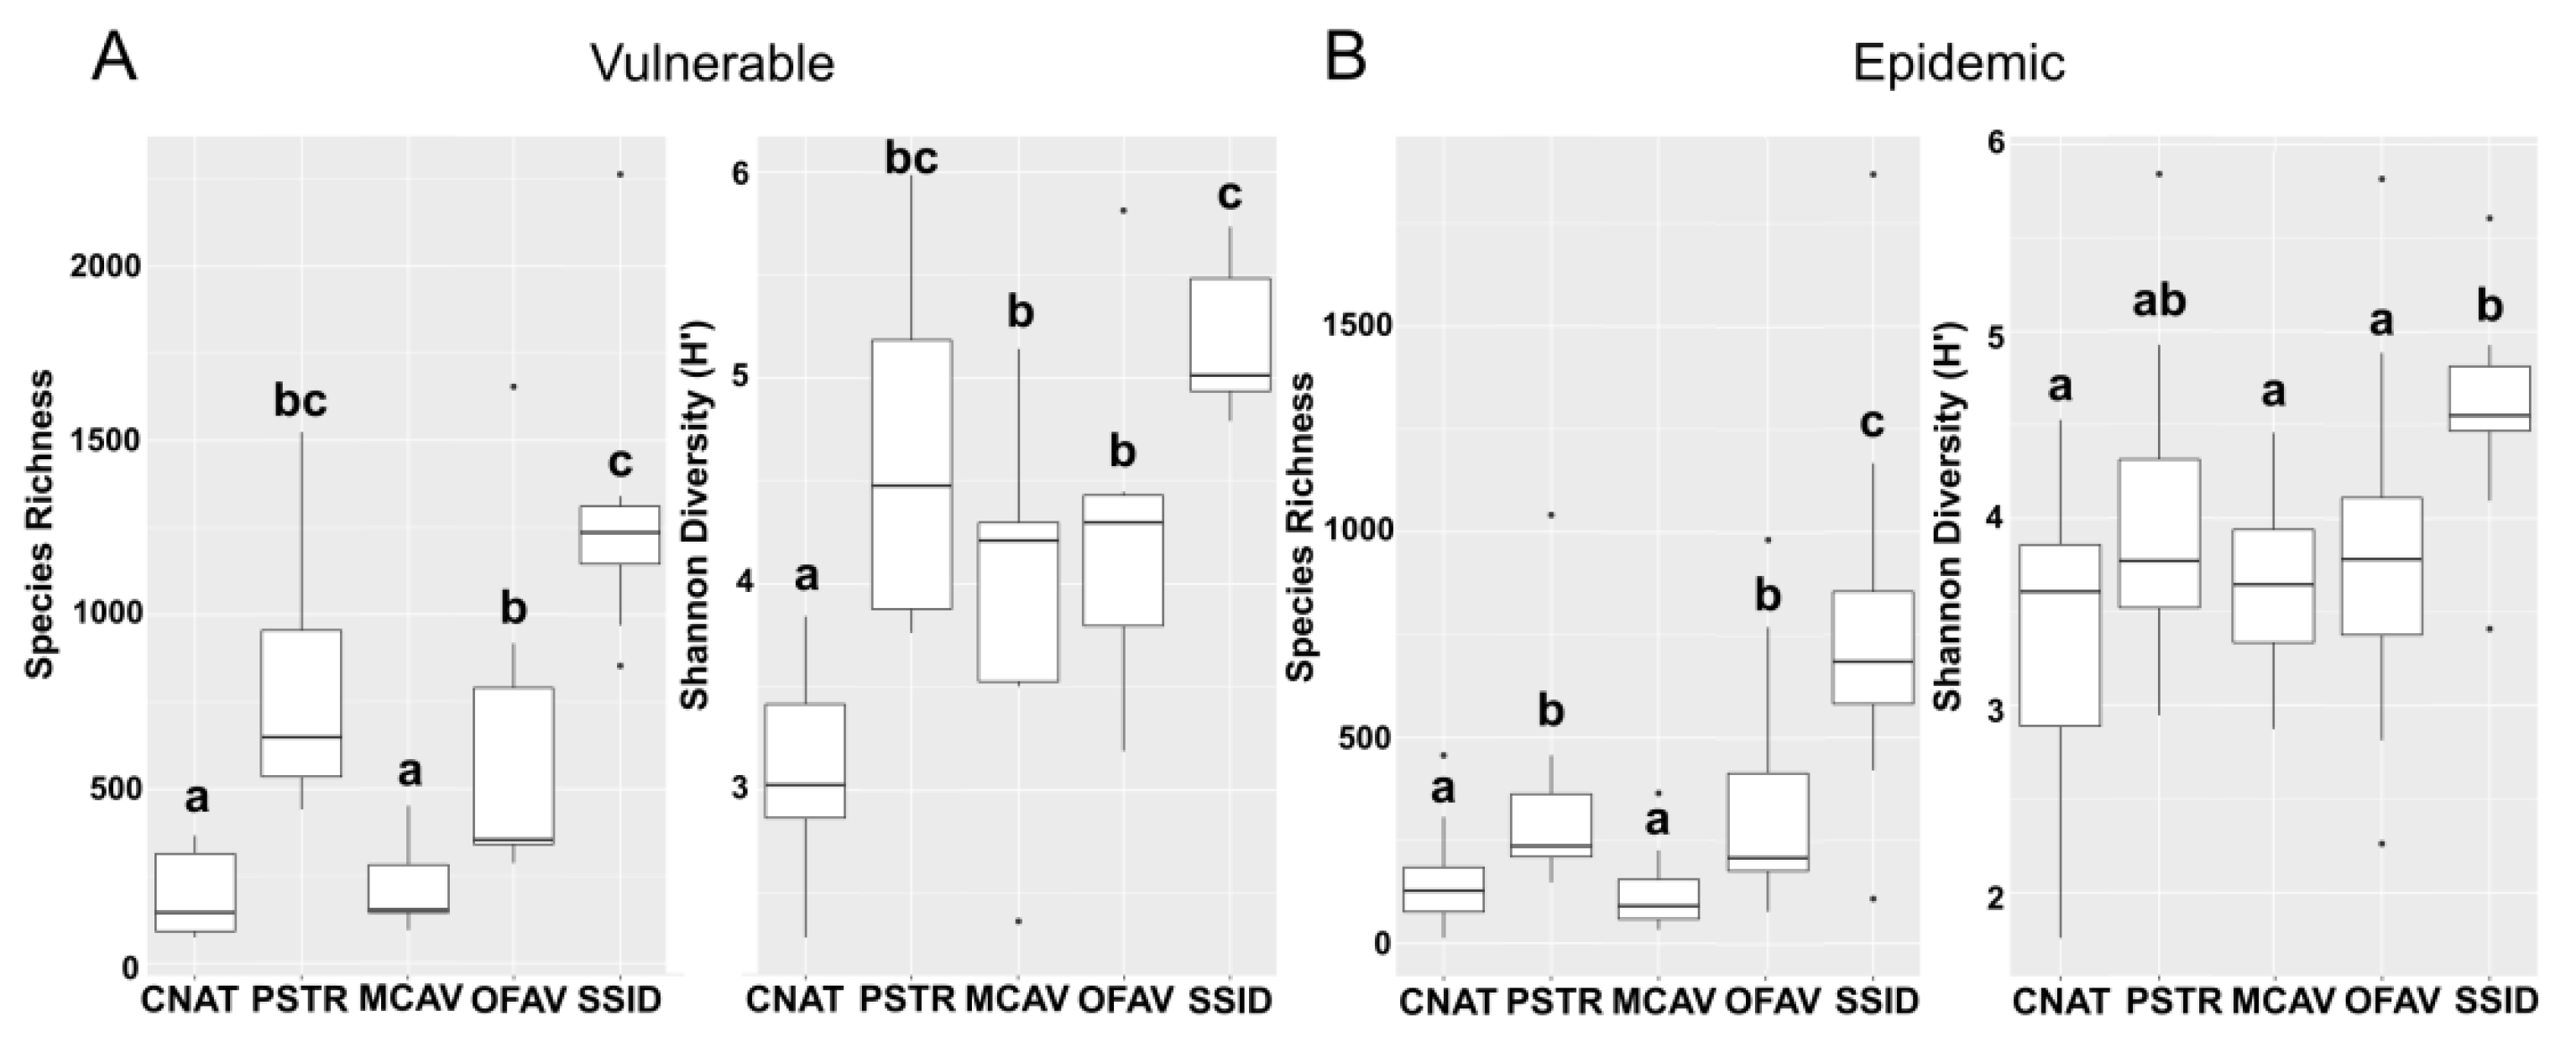
3.3.1. Alpha Diversity between Vulnerable and Epidemic Zones

There were no significant differences in alpha diversity of the bacterial community between the epidemic zone (all three tissue sample types pooled) and the vulnerable zone (AH tissue only) for each coral species: C. natans (species richness: F1,72 = 0.063, p = 0.80; Shannon diversity: F1,68 = 1.477, p = 0.23; Figure S1A), M. cavernosa (species richness: F1,72 = 0.936, p = 0.34; Shannon diversity: F1,72 = 0.398, p = 0.53; Figure S1C), O. faveolata (species richness: F1,68 = 1.821, p = 0.18; Shannon diversity: F1,68 = 0.504, p = 0.48; Figure S1D), and S. siderea (species richness: F1,72 = 1.83, p = 0.18; Shannon diversity: F1,72 = 1.316, p = 0.26; Figure S1E), except for P. strigosa (species richness: F1,69 = 11.79, p = 0.0010; Shannon diversity: F1,69 = 6.589, p = 0.012; Figure S1B). Pseudodiploria strigosa samples collected in the vulnerable zone had a higher species richness and diversity than the epidemic zone. There were no differences in the species richness of water between zones (F1,22 = 3.093, p = 0.093; Figure S1F). However, significant differences were detected in the Shannon diversity (F1,22 = 8.337; p = 0.0086). Specifically, water samples collected in the vulnerable zone had a higher diversity than the epidemic zone.

3.3.2. Alpha Diversity among Sites within Zones

There was only a significant difference in alpha diversity metrics among sites within the epidemic and vulnerable zones each for C. natans and O. faveolata. The species richness of C. natans was not significantly different among sites in the epidemic zone (F4,60 = 2.093, p = 0.093; Figure S2A), but there were differences in the Shannon diversity (F4,60 = 5.5, p = 0.0008). Dustan Rocks (Site E) was less diverse than Nearshore Patch (Site C) and East Turtle Shoal (Site D) (p_adj = 0.0032 and p_adj = 0.0069, respectively), and Nearshore Patch (Site C) had a higher diversity than West Turtle Shoal (Site A) (p_adj = 0.032). There were no significant differences in the alpha diversity of C. natans among sites in the vulnerable zone (species richness: F2,6 = 0.255, p = 0.78; Shannon diversity: F2,6 = 1.161, p = 0.37; Figure S3A). The species richness and diversity of O. faveolata were not significantly different among sites in the epidemic zone (species richness: F4,56 = 1.14, p = 0.35; Shannon diversity: F4,56 = 2.319, p = 0.068; Figure S2D). Furthermore, there were no differences in the Shannon diversity of O. faveolata among sites in the vulnerable zone (F2,6 = 1.185, p = 0.37; Figure S3D). However, there were significant differences among sites in the species richness of O. faveolata in the vulnerable zone (F2,6 = 5.978, p = 0.037). Species richness was higher in Western Sambo Patch (Site F) than Xesto Patch (Site G; p_adj = 0.039). For all other species, significant differences were not detected among sites in the vulnerable zone: P. strigosa (species richness: F2,5 = 0.61, p = 0.58; Shannon diversity: F2,5 = 0.146, p = 0.87; Figure S3B), M. cavernosa (species richness: F2,6 = 0.434, p = 0.67; Shannon diversity: F2,6 = 0.858, p = 0.47; Figure S3C), and S. siderea (species richness: F2,6 = 0.503, p = 0.63; Shannon diversity: F2,6 = 0.733, p = 0.52; Figure S3E). There were also no significant differences among sites in the epidemic zone for these species (p ≥ 0.1 for all comparisons, range: 0.10–96; Figure S2B,C,E).
There were no differences in the alpha diversity of water samples among sites in the epidemic zone (species richness: F4,10 = 0.854, p = 0.52; Shannon diversity: F4,10 = 2.816, p = 0.084), or for the species richness among sites in the vulnerable zone (F2,6 = 5.065, p = 0.052). However, there were Shannon diversity differences among sites in the vulnerable zone (F2,6 = 17.07, p = 0.0033). Xesto Patch (Site G) was more diverse than Western Sambo Patch (Site F) and Lindsay’s Patch (Site H) (p_adj = 0.011 and p_adj = 0.0035, respectively).

3.3.3. Alpha Diversity among Coral Tissue Sample Types in the Epidemic Zone

There were significant differences in the microbial species richness among the tissue sample types (DL, DU, and AH) of every coral species: C. natans (F6,62 = 6.605, p = 0.0025; Figure 5A), P. strigosa (X2 = 9.5497, df = 2, p = 0.0084; Figure 5B), M. cavernosa (F2,62 = 9.986, p = 0.00017; Figure 5C), O. faveolata (F2,58 = 5.435, p = 0.0069; Figure 5D), and S. siderea (F2,62 = 10.75, p < 0.00001; Figure 5E). DL tissue had a higher species richness than DU and AH tissues in C. natans (p_adj = 0.026 and p_adj = 0.0036, respectively), M. cavernosa (p_adj = 0.00058 and p_adj = 0.0019, respectively), and S. siderea (p_adj = 0.0046 and p_adj = 0.00014, respectively). DL tissue of O. faveolata and P. strigosa had a higher species richness than AH tissues only (p_adj = 0.0076 and p_adj = 0.018, respectively).
There were no significant differences in the Shannon species diversity among tissue sample types from C. natans (F2,62 = 1.311, p = 0.28; Figure 5A), P. strigosa (F2,60 = 3.065, p = 0.054; Figure 5B), M. cavernosa (F2,62 = 2.212, p = 0.12; Figure 5C), and O. faveolata (F2,58 = 0.488, p = 0.62; Figure 5D). However, there were significant differences in the Shannon species diversity of S. siderea tissues (F2,62 = 8.098, p = 0.00075; Figure 5E), with DL tissues more diverse than both DU and AH tissues for this species (p_adj = 0.0057 and p_adj = 0.0020, respectively).

3.3.4. Alpha Diversity of Apparently Healthy Colony Tissue in Vulnerable and Epidemic Zones

For each coral species, there were significant differences in both microbial alpha diversity metrics of AH tissue in the vulnerable zone (species richness: F4,39 = 25.34, p < 0.00001; Shannon diversity: X2 = 11.92, df = 4, p < 0.00001; Figure 6A) and in the epidemic zone (species richness: X2 = 18.3, df = 4, p < 0.00001; Shannon diversity: X2 = 6.295, df = 4, p = 0.0002; Figure 6B). In the vulnerable zone, a pairwise comparison of microbial species richness between each coral species showed that C. natans and M. cavernosa each had a lower species richness compared to O. faveolata, P. strigosa, and S. siderea (p_adj < 0.001 for all comparisons, range: < 0.00001–0.0002). Siderastrea siderea had a higher species richness than O. faveolata (p_adj = 0.010). Colpophyllia natans had a lower Shannon diversity than the other four species: M. cavernosa (p_adj = 0.039), O. faveolata (p_adj = 0.0083), P. strigosa (p_adj = 0.00030), and S. siderea (p_adj < 0.00001). Siderastrea siderea was more diverse than M. cavernosa and O. faveolata (p_adj = 0.0065 and p_adj = 0.031, respectively).
As in the vulnerable zone, pairwise comparisons of AH tissue in the epidemic zone showed that C. natans and M. cavernosa had a lower species richness than O. faveolata, P. strigosa, and S. siderea (p_adj < 0.05 for all comparisons, range: < 0.00001–0.011; Figure 6B). Dissimilar to the vulnerable zone, S. siderea in the epidemic zone had a higher species richness than P. strigosa (p_adj = 0.0082) as well as O. faveolata (p_adj = 0.0029). Siderastrea siderea also had a higher Shannon diversity than C. natans (p_adj = 0.00010), M. cavernosa (p_adj = 0.0038), and O. faveolata (p_adj = 0.022). All other comparisons among AH tissue collected in the epidemic zone were not significant.

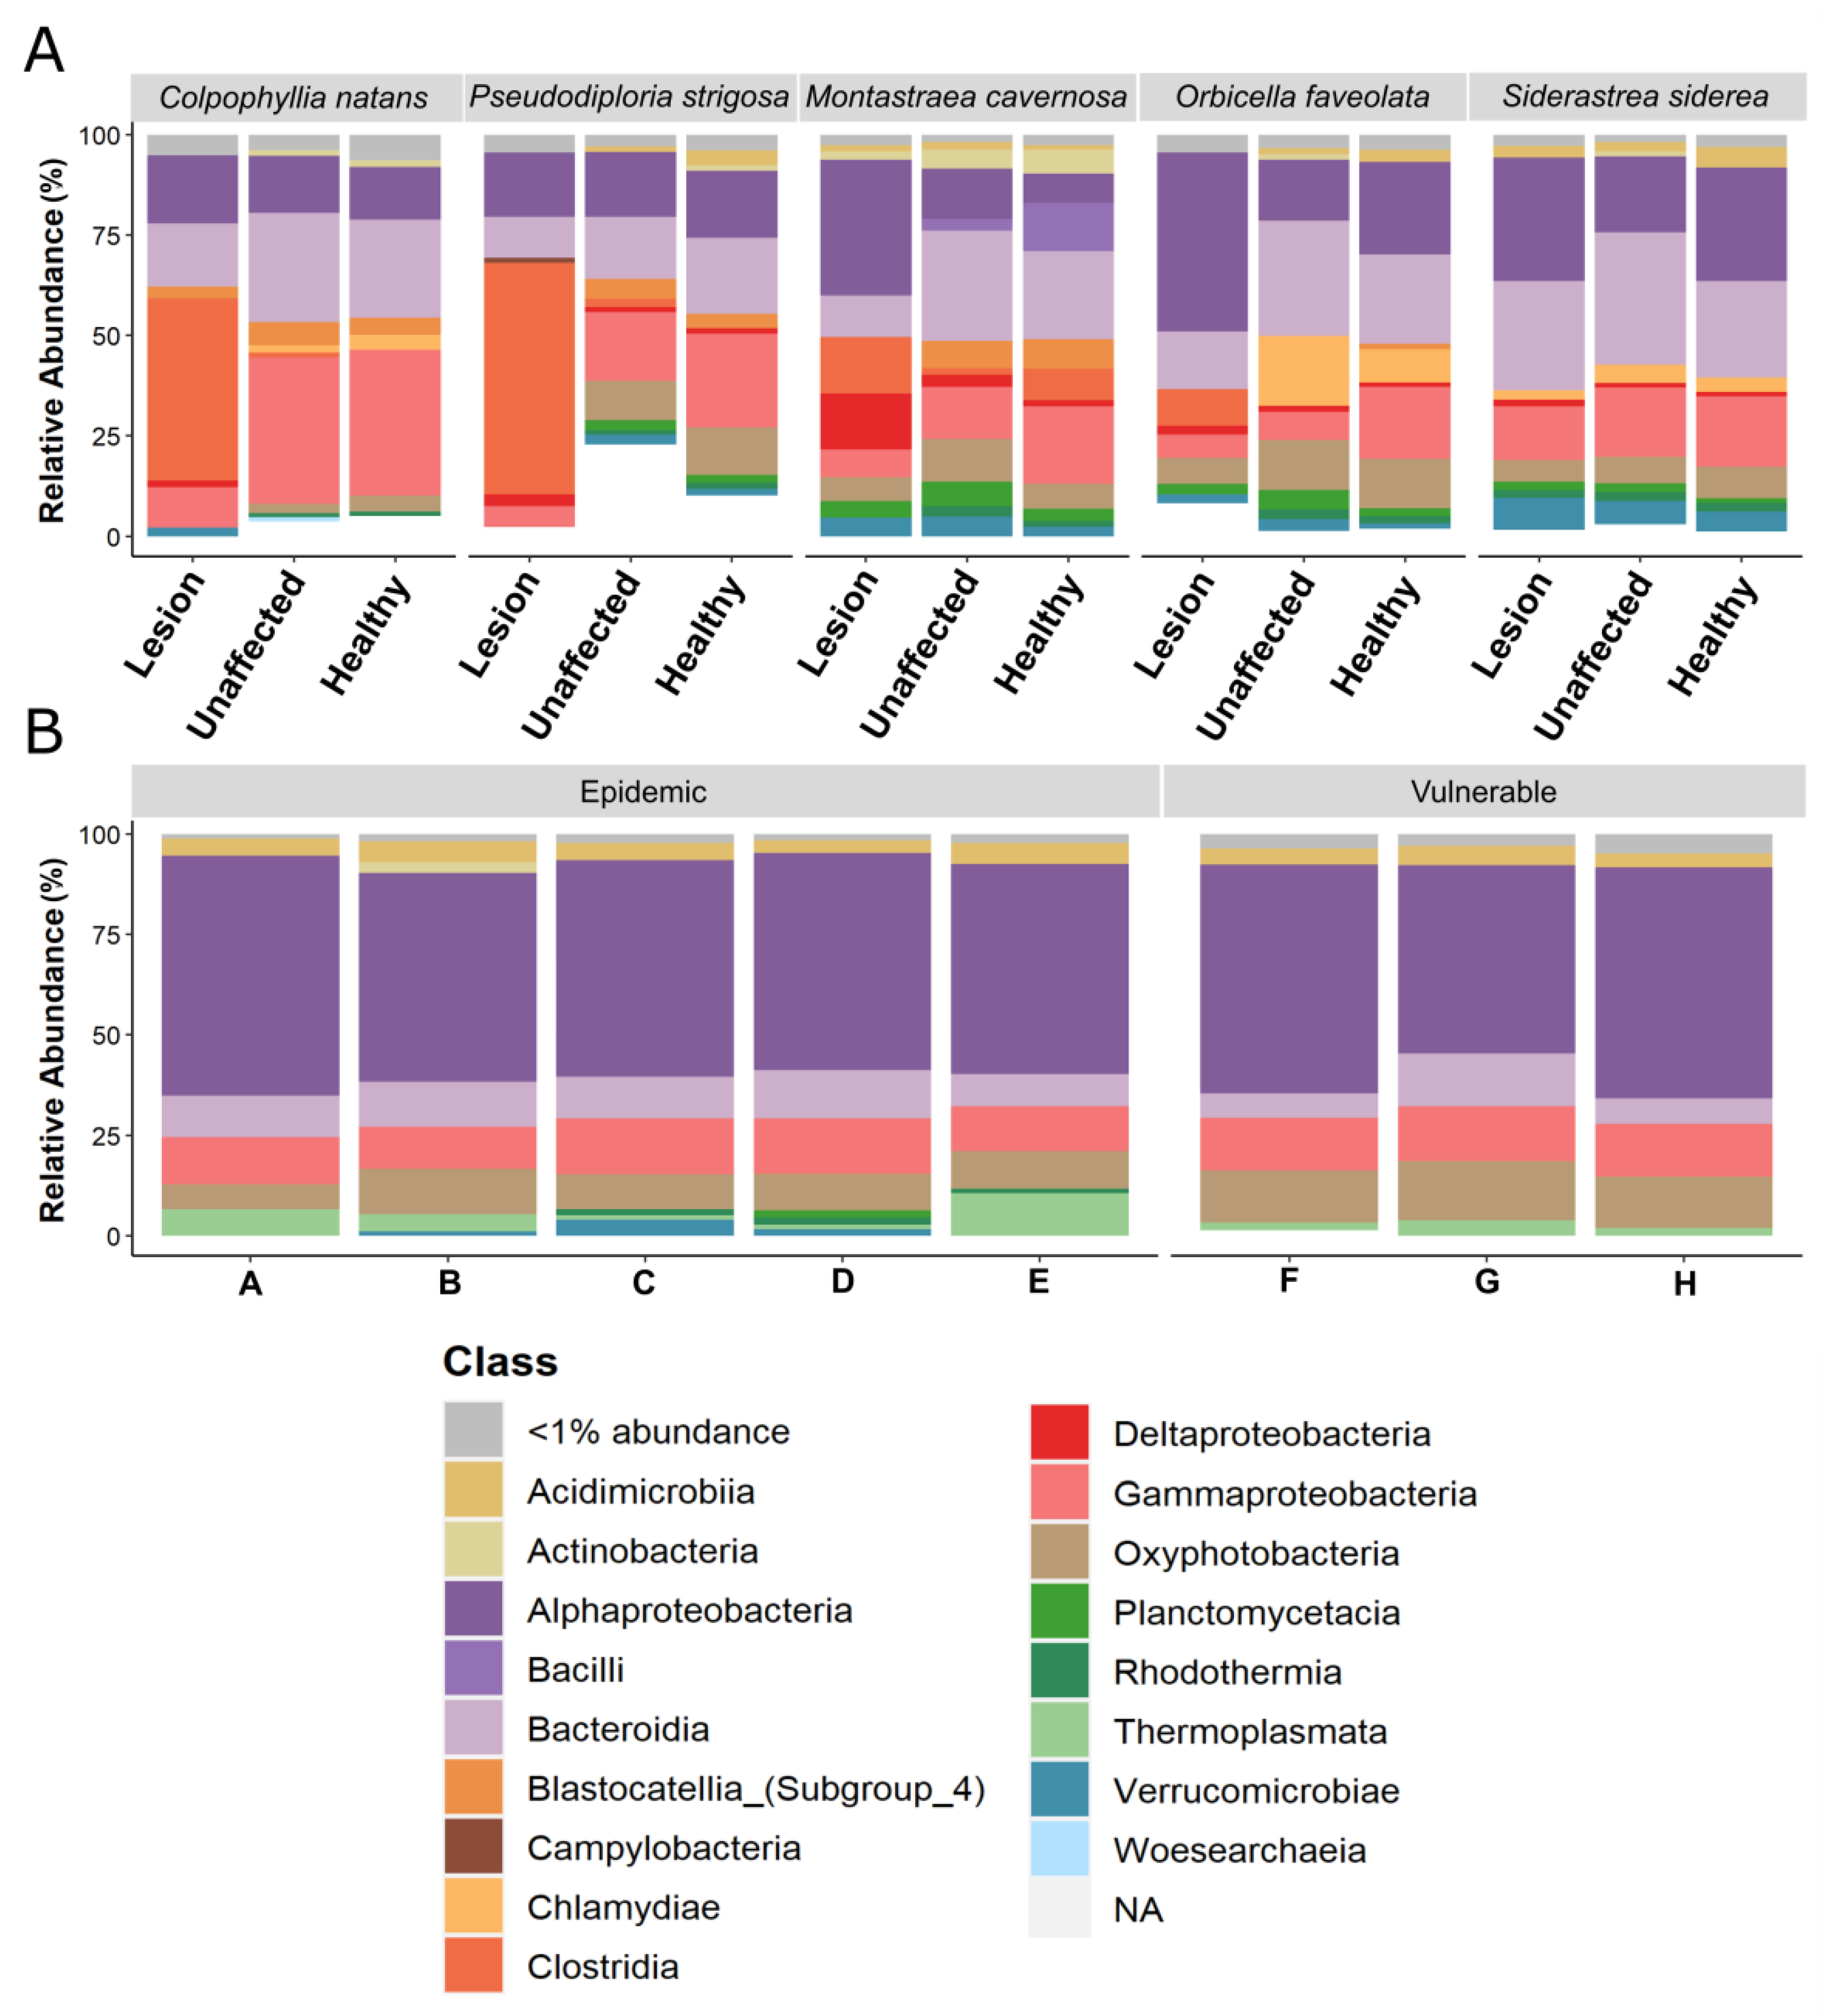
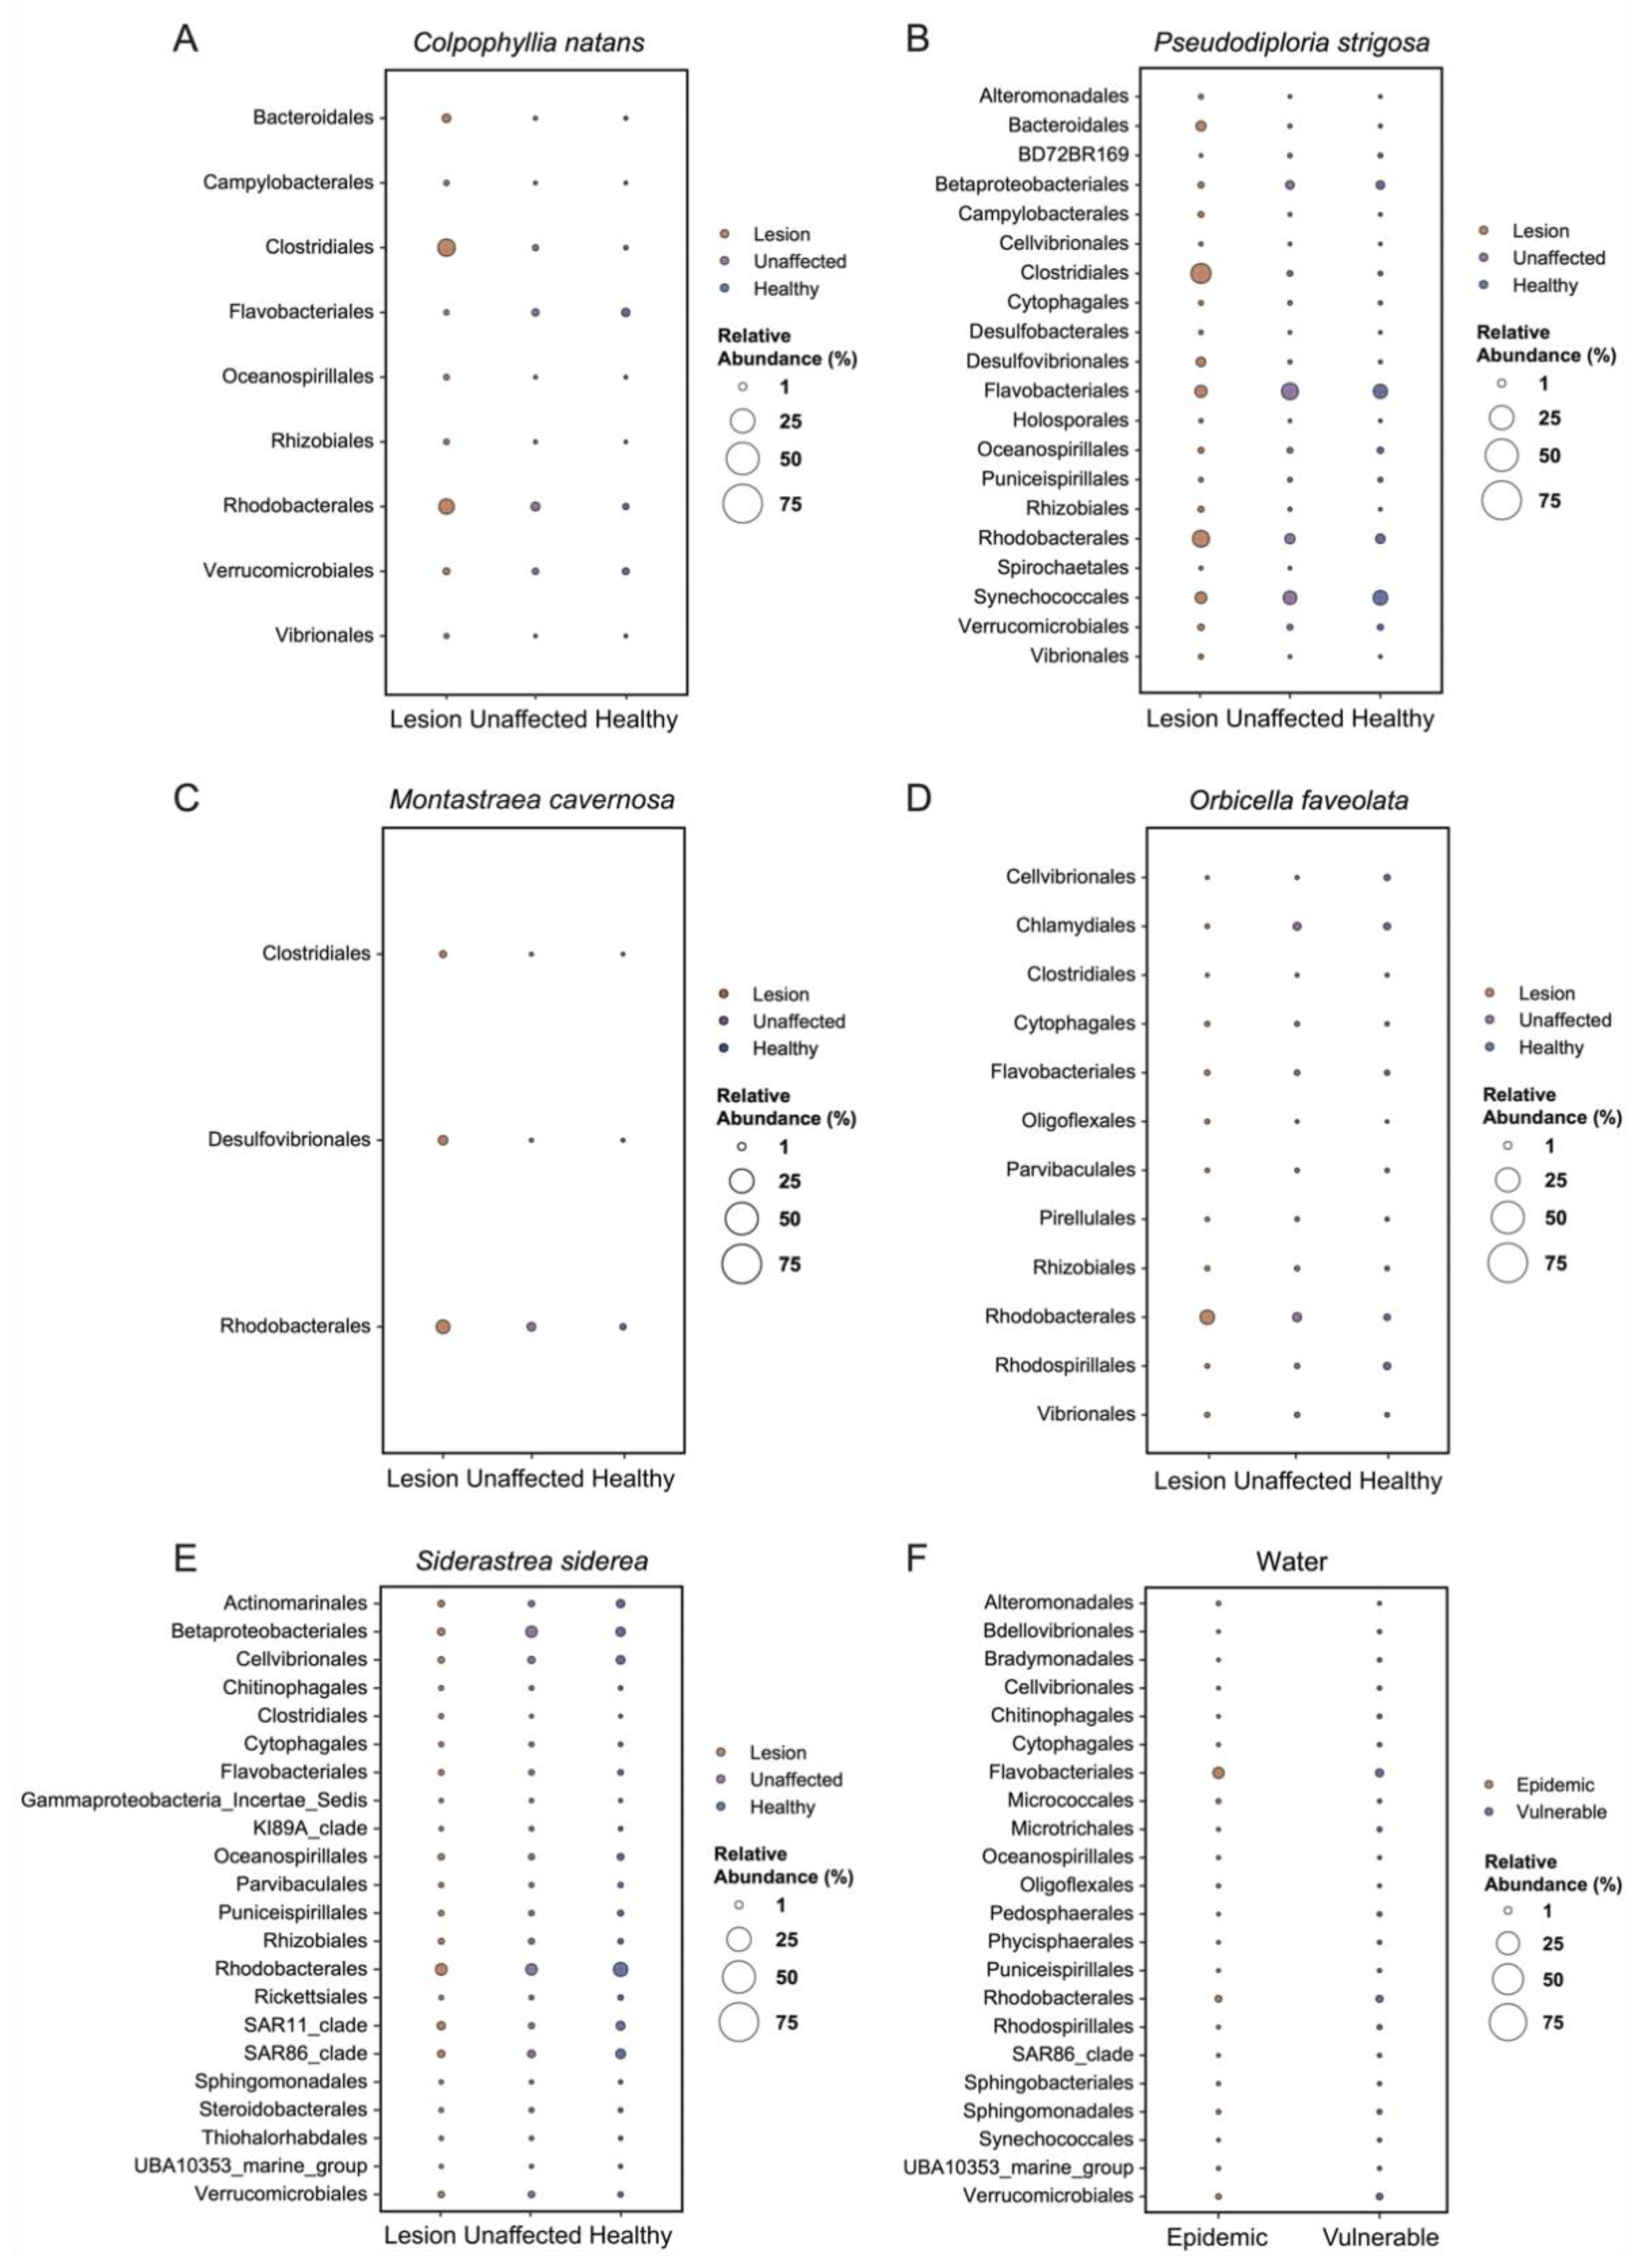
3.4. Relative Abundance Analysis of Bacterial Class

The relative abundance of bacterial classes revealed interesting patterns with coral species. Of the highly susceptible species C. natans and P. strigosa, Clostridia was the most dominant bacterial class in the DL tissue (45.11% and 56.22%, respectively; Figure 7A). Following Clostridia, Alphaproteobacteria (16.57%) and Bacteroidia (16.36%) were most abundant for C. natans DL tissue. Gammaproteobacteria constituted the highest relative abundance in DU (34.18%) and AH (33.26%) tissues of C. natans. In the DU and AH tissues of P. strigosa, however, Alphaproteobacteria, Bacteroidia, and Gammaproteobacteria were similarly abundant.
Among the moderately susceptible species, Alphaproteobacteria was generally more dominant in DL tissues. Alphaproteobacteria was the dominant member (31.08%) of DL tissue of M. cavernosa even though they were also present, albeit at lower abundances (<13.86%), in AH and DU tissues. These two tissue sample types of M. cavernosa had relatively high levels of Bacteroidia (19.02% and 23.28%, respectively) compared to DL tissue (10.49%). In all three O. faveolata tissue sample types, Alphaproteobacteria, Bacteroidia, and Oxyphotobacteria were among the highest relatively abundant taxa. While Alphaproteobacteria was ubiquitous across all tissue sample types of O. faveolata, this class was more abundant in DL tissue (42.56%) compared to AH and DU tissues (27.17% and 15.32%, respectively). Conversely in O. faveolata, AH and DU tissues had higher levels of Bacteroidia (30.54% and 29.09%, respectively) than DL tissue (13.21%). Relatively high abundances of Chlamydia were also present in AH and DU tissues (17.63% and 11.1%, respectively) but not in DL tissue (<1%) of O. faveolata. Though not at the same relative abundance levels as in C. natans and P. strigosa, Clostridia was more abundant (8.6%) in DL tissue than AH and DU tissues (<1%) of O. faveolata. Finally, for S. siderea, Alphaproteobacteria, Bacteroidia, and Gammaproteobacteria were the most abundant groups of bacteria across all tissue sample types.
At every site in the epidemic and vulnerable zones, the bacterial community of the water column was dominated by Alphaproteobacteria, followed by Gammaproteobacteria, Bacteroidia, and Oxyphotobacteria (Figure 7B).

3.5. Analysis of Composition of Microbiomes

Significantly differentially abundant ASVs were detected among the three tissue sample types in each coral species: C. natans (33 ASVs with W ≥ 300), P. strigosa (88 ASVs with W ≥ 530), M. cavernosa (10 ASVs with W ≥ 239), O. faveolata (32 ASVs with W ≥ 599), and S. siderea (81 ASVs with W ≥ 1524). Sixty-seven significantly differentially abundant ASVs (with W ≥ 557) were detected in the water samples when comparing vulnerable and epidemic zones.
The order Rhodobacterales was consistently present at high relative abundances in DL tissue compared to AH and DU tissues for all coral species except S. siderea (Figure 8A–E). Eight significantly differentiated Rhodobacterales ASVs were detected in the DL tissue of at least two of the five species of coral: ASV6, ASV21, ASV22, ASV57, ASV116, ASV124, ASV148, and ASV208 (Table 2); all eight of these sequences have been reported in previous studies of SCTLD [39,40,51,52]. ASV148, an unclassified Rhodobacteraceae, was the only ASV detected in the lesions of all five coral species examined here.
The order Clostridiales was also consistently found in the bacterial community of disease tissues. The DL tissues of C. natans, P. strigosa, and M. cavernosa had higher abundances of significantly differentiated Clostridiales compared to AH and DU tissues. ASV50, a Tepidibacter belonging to the order Clostridiales, was enriched in the DL tissues of these three coral species. In addition, the abundance of ASV11, a Halodesulfovibrio belonging to order Desulfovibrionales, was more abundant in the DL tissue of M. cavernosa and P. strigosa compared to AH and DU tissues. Water samples collected in the epidemic zone were enriched in Flavobacteriales compared to the vulnerable zone (Figure 8F).

4. Discussion

The stony coral tissue loss disease (SCTLD) outbreak has caused the widespread mortality of important reef-building species in Florida and in the Caribbean Region. To date, the identity of the presumed pathogen(s) responsible for SCTLD remains unknown, despite many studies on microbial communities associated with SCTLD [39,40,51,52]. In the present study, the microbiomes of five coral species (Colpophyllia natans, Pseudodiploria strigosa, Montastraea cavernosa, Orbicella faveolata, and Siderastrea siderea) were analyzed to determine if a specific microbial signature exists across different species of corals with active SCTLD lesions. The lesions of four of these five coral species (except S. siderea) had significantly higher abundances of Rhodobacterales, a finding that is consistent with studies of other susceptible coral species (Table 2). In addition to Rhodobacterales, Clostridiales was also a significant and ubiquitous member of the lesion microbial community, especially for C. natans, M. cavernosa, and P. strigosa.

4.1. Diversity Indices

In general, the microbial beta diversity dispersion between zones (i.e., vulnerable and epidemic) and within zones was not significant in either water or apparently healthy (AH) coral samples, except for those from P. strigosa, which were more dispersed in the vulnerable zone than the epidemic zone. These results, with the exception of P. strigosa, are similar to Rosales et al. [40], who found no difference in the AH coral microbial beta diversity dispersion between the vulnerable and epidemic zones. Coral microbiomes are sensitive to environmental perturbations (e.g., thermal stress, nutrient pollution), which can cause an increase in the microbial beta diversity dispersion [53]. It is possible that AH P. strigosa colonies in the vulnerable zone had recently been exposed to an environmental stressor, which caused an increase in the beta diversity dispersion. However, longitudinal studies are needed to parse out the influence of environmental conditions on beta diversity dispersion through time.
The present study did not find a difference in the dispersion of microbial communities in the water column between zones. In Rosales et al. [40], the microbial beta diversity dispersion of water samples was significantly different between zones, with greater dispersion observed within the epidemic zone compared to the vulnerable zone. Even though the beta diversity dispersion of environmental samples (i.e., water samples) did not differ between zones in the present study, differences in environmental conditions between zones should not be ruled out as a possible factor in driving these differences. Additionally, the water sample sizes in the present study were lower than those used in Rosales et al. [40], potentially limiting the ability to observe meaningful differences between the zones in this study. This discrepancy between findings may also be attributed to differences in how the water samples were gathered: in the present study, water sample bottles were held approximately 0.5 m above the benthos and were not specifically gathered above coral colonies. In Rosales et al. [40], water sample bottles were held directly over the benthos, gathering water approximately 20 cm or less from the bottom, and in the epidemic zone, water samples were collected directly over colonies with SCTLD. The distance at which water samples are collected above the bottom influences the microbial signature of the water samples, as illustrated by Weber et al. [54]. Water samples collected within the coral ecosphere, or the environment immediately surrounding an individual coral colony (e.g., water < 30 cm above the colony), can have a different microbial signature compared to water collected >1 m above the reef. Therefore, bacterial beta diversity dispersion may be related to the sampling location (i.e., distance above the benthos or individual coral colonies) in the water column.
Among the tissue sample types of most coral species, the epidemic zone had a dispersed microbial community. While dispersion was not significantly different among the three tissue sample types in P. strigosa, as previously identified in Diploria labyrinthiformis, Dichocoenia stokesii, and Meandrina meandrites [40], the lesion (DL) tissue of the other coral species in this study were more dispersed than AH (in four coral species) and unaffected (DU) tissue (in three coral species, except C. natans) tissues. In Meyer et al. [39], microbial dispersion was similar between the DL tissue and DU tissue of diseased colonies from three susceptible species, Montastraea cavernosa, Diploria labyrinthiformis, and Dichocoenia stokesii. However, in M. cavernosa, the DL and DU tissues did have a higher dispersion compared to AH tissue. Similarly, in the present study, there were no significant differences between the DL tissue and the DU tissue of C. natans. Therefore, colonies showing signs of SCTLD may have a disrupted microbiome even far away from the lesion, suggesting a systemic effect [55]. It has been reported in other studies that stress, such as heat stress, often has a stochastic effect on the microbial community composition that can result in an increase in the beta diversity [56]. In Rosales et al. [57], for example, Acropora cervicornis exposed to diseased ramets had a higher beta diversity compared to control corals not exposed to disease. Eaton et al. [55] also showed that visibly unaffected areas (DU tissue) on diseased corals later showed signs of tissue loss after coral fragments were separated and isolated from the active disease border on the parent colony, and Landsberg et al. [30] found lytic necrosis characteristic of SCTLD lesions within some samples of DU tissue, again suggesting that SCTLD may be systemic within coral colonies.
In the epidemic zone, there were also significant differences in the species richness among tissue sample types, with DL tissues having a higher species richness compared to both DU and AH tissues in three species (C. natans, M. cavernosa, and S. siderea) and compared to the AH tissue of two species (O. faveolata and P. strigosa). This difference in alpha diversity may be a result of microbial dysbiosis, or an imbalance in the natural microbiome that can disrupt coral–microbe interactions and lead to disease [8,58]. The microbiomes of corals exposed to stressful environmental conditions (e.g., acidification, and increased temperature) often experience a shift in microbial community composition and, consequently, an increase in the species richness [8,59]. Microbial shifts may be attributed to a loss in beneficial bacteria; thus, freeing up niche space for putative pathogens to inhabit [13,60]. In a study conducted by MacKnight et al. [58], disease-resistant corals exposed to white plague disease (WPD) had a higher dysbiosis threshold compared to corals that developed WPD lesions. The authors hypothesized that certain bacteria may be helping to prevent pathogens from colonizing disease-resistant corals; thus, also preventing dysbiosis and the onset of WPD. In the present study, the higher microbial alpha diversity of coral DL tissues was potentially due to the decreased stability of the coral microbiomes and the hosts’ inability to prevent pathogenic infection [59], or due to an increased propensity for diseased tissues and surface mucus to become colonized by diverse opportunistic bacteria, including Rhodobacteraceae [61,62].

4.2. Differences Were Detected among Sites and Tissue Sample Types

Bacterial communities of all but one species (O. faveolata) were different among at least three sites of the epidemic zone (Table S1). Even though sites within the epidemic zone were similarly dispersed, there were significant groupings among sites, suggesting a site-level effect on the bacterial signature of corals within the epidemic zone. There are likely several factors driving these site-wide differences. In a previous study, Williams et al. [34] showed that the coral species diversity, coral cover, and size of coral colonies affect SCTLD prevalence and severity. Sites with higher abundances of M. cavernosa and O. faveolata compared to four other susceptible species (C. natans, P. strigosa, Diploria labyrinthiformis, and Dichocoenia stokesii) had a greater disease prevalence. In addition, colonies that ultimately became diseased were significantly larger than colonies that did not display signs of SCTLD over the course of the study. This finding was also observed by Sharp et al. [63]. Both studies [34,63] observed that the coral density did not likely play a role in the spatio-temporal dynamics of SCTLD. While coral density may not be a factor, differences in the coral species diversity and size of colonies among sites in the present study may explain the site-level differences observed in microbial communities. Even though the microbial communities of these corals are site-specific (Table S1), there were consistent signatures within the DL tissues of corals among sites.

4.3. Rhodobacterales and Clostridiales in SCTLD Lesions

The DL tissues of four species in this study (C. natans, P. strigosa, O. faveolata, and M. cavernosa) had significantly higher relative abundances of Rhodobacterales compared to both DU and AH tissues. In previous studies, Rhodobacterales was also differentiated in the lesions of Stephanocoenia intersepta, Diploria labyrinthiformis, Dichocoenia stokesii, Meandrina meandrites, and Montastraea cavernosa in Florida [39,40], and, although not significant, Rhodobacteraceae was enriched in the lesion tissues of Meandrina meandrites and O. franksi in the U.S. Virgin Islands [52]. Other studies have reported high abundances of Rhodobacterales, specifically Rhodobacter, in disease tissue of black band disease, white plague, and white band disease [64,65,66,67,68,69]. This group of bacteria play an important role in colonizing submerged marine surfaces and is often considered the primary and most common colonizer [70,71]. The fast-growing nature of Rhodobacterales allows members of this group to thrive in areas that are rich in amino acids and other nutrients [72]. These bacteria also have the ability to produce antibiotic compounds [73]. Under stressful conditions, Rhodobacterales appear to be typical and abundant opportunistic bacteria associated with corals [61,62,74].
In this study, an exception to the pattern of higher relative abundance of Rhodobacterales in DL compared to both DU and AH tissues was the coral S. siderea. The DU tissues of S. siderea had a lower abundance of Rhodobacterales compared to both DL and AH tissues, but the latter tissue sample types had statistically similar abundances. Siderastrea siderea often shows signs of SCTLD that are distinct from other susceptible species, including areas of pinkish tissue discoloration and mucus strands [30], leading to some speculation about whether this species has the same disease or a generalized stress response [25]. However, the characteristic hallmark lytic necrosis of SCTLD as described in the lesion tissues of other susceptible species has been reported in S. siderea tissue [30], so differences in how the tissue loss progresses through the colony in S. siderea (generally originating in polyp mouths instead of moving across the colony [30]) or its species-specific holobiont response may affect the gross presentation of the disease and the relative abundances of bacteria across tissue sample types compared with other species. However, it should be noted that the method of sampling for S. siderea (predominantly coring and scraping versus scraping only) may have influenced the composition of the microbial community in the samples examined, especially if less tissue and mucus were potentially sampled. Surface mucus on corals has a diverse microbial community, the composition of which changes during the course of disease [61]. Scraping with a coring device may have obtained slightly deeper tissue samples which may have a different microbial composition. Studies to evaluate the vertical and horizontal distribution and abundances of the microbial flora in SCTLD-affected colonies over time in relation to lesion progression, coral species, sampling method, and mucus quantity may resolve this question.
In the present study, Clostridiales was another significantly differentiated group of bacteria in lesion tissue. ASV50 specifically was enriched in the lesion tissue of C. natans, M. cavernosa, and P. strigosa. Of these corals, C. natans and P. strigosa are highly susceptible to SCTLD, and exhibit acute to subacute tissue loss [25,30]; M. cavernosa is considered moderately susceptible, but the rate of lesion progression varies widely by colony, and most of the diseased colonies sampled in this study were experiencing subacute tissue loss (authors’ pers. obs.). It is possible that Clostridiales is a signature of faster lesion progression, given that this order has been documented in other studies in M. cavernosa and C. natans [39,52] in addition to two other highly susceptible species: Dichocoenia stokesii and Diploria labyrinthiformis [39]. However, Rosales et al. [40] did not observe significantly differentiated Clostridiales in DL tissue of Dichocoenia stokesii or Diploria labyrinthiformis, but only within DL tissues of Stephanocoenia intersepta, another moderately susceptible species [25]. Similar to Rhodobacterales, Clostridiales is commonly found in the lesion tissue of other coral diseases, such as black band disease, white plague disease, and white syndrome [67,68,75]. When colonizing, these opportunistic anaerobic bacteria can necrotize host tissue. For example, humans and animals exposed to clostridial spores (e.g., through contaminated drinking water) can contract clostridial myonecrosis (gas gangrene) which is a lethal infection that causes severe necrosis of muscle and soft tissue [76]. The initial appearance of SCTLD lesions in deeper basal body wall tissues may indicate a role for anaerobic bacterial pathogenesis, although thus far, no histological evidence has been found for co-occurring bacteria in lesion initiation [30]. However, the exact role, if any, of Clostridiales in lesion progression and tissue necrosis of coral colonies with SCTLD, should be examined among highly susceptible species.

5. Conclusions

The goal of this study was to determine if the lesions of coral colonies showing signs of stony coral tissue loss disease (SCTLD) had a consistent microbial signature across five different coral species: Colpophyllia natans, Pseudodiploria strigosa, Montastraea cavernosa, Orbicella faveolata, and Siderastrea siderea. Diversity indices revealed that the lesion (DL) tissue of all but one species (P. strigosa) had a higher microbial beta diversity dispersion than apparently healthy (AH) tissue. In three species (M. cavernosa, O. faveolata, and S. siderea), DL tissue had a higher beta diversity dispersion than both AH tissue and unaffected (DU) tissue. Furthermore, DL tissue of every species had a higher species richness compared to AH tissue. In three species (C. natans, M. cavernosa, and S. siderea), the species richness of DL tissue was also higher than DU tissue. DL tissue consistently had higher relative abundances of the order Rhodobacterales compared to AH and DU tissues, except for S. siderea, a finding that has been observed in other coral species [39,40,51,52]. In addition, order Clostridiales was enriched in the DL tissue of three of the five species investigated in the present study, suggesting that Clostridiales may also play an important role in SCTLD. The beta diversity dispersion and species richness of water samples did not differ between the vulnerable and epidemic zones, suggesting that a bacterial signature of SCTLD was not detected in the water column, potentially due to sampling location within the sites. The results presented herein expand our understanding of SCTLD as it relates to the coral microbiome of critical reef-building species along Florida’s Coral Reef. Understanding how SCTLD, coupled with changing environmental conditions, can affect host-microbe interactions is an important step towards developing practical and effective disease mitigation strategies.

Supplementary Materials

The following are available online at https://www.mdpi.com/article/10.3390/microorganisms9112181/s1, Table S1: results of permutational multivariate analysis of variance (PERMANOVA) and pairwise PERMANOVA tests comparing microbial communities among sites in the epidemic zone and vulnerable zone, Figure S1: microbial alpha diversity metrics (species richness and Shannon diversity) comparing five corals species between the epidemic zone and vulnerable zone, Figure S2: microbial alpha diversity metrics (species richness and Shannon diversity) comparing five corals species among sites (Sites A–E) in the epidemic zone, Figure S3: microbial alpha diversity metrics (species richness and Shannon diversity) comparing five corals species among sites (Sites F–H) in the vulnerable zone.

Author Contributions

Conceptualization: J.H.L. and L.K.H.; methodology: L.K.H. and A.S.C.; resources: K.M., L.K.H., A.S.C. and E.M.M.; investigation: K.M. and A.S.C.; formal analysis: A.S.C., with assistance from E.M.M., S.D.W. and S.M.R.; data curation: A.S.C.; writing—original draft preparation: A.S.C.; writing—review and editing: E.M.M., S.D.W., L.K.H., S.M.R., K.M., J.H.L. and A.S.C.; visualization: A.S.C.; supervision: J.H.L. and E.M.M.; project administration: E.M.M., J.H.L. and K.M.; funding acquisition: J.H.L., E.M.M. and J.H.H. All authors have read and agreed to the published version of the manuscript.

Funding

This research was supported by the U.S. Fish and Wildlife Service Funds for State Wildlife Grant Award FL-T-F18AF00492, awarded to the Florida Fish and Wildlife Conservation Commission (FWC), with a subcontract to the Mote Marine Laboratory (FWC grant agreement number 18099) for laboratory assays, sequencing, and data analysis. Field collections were supplemented by funding to FWC from the Florida Coastal Office, Florida Department of Environmental Protection Coral Reef Conservation Program (order number B25636).

Institutional Review Board Statement

Not applicable.

Informed Consent Statement

Not applicable.

Data Availability Statement

The 16S rRNA sequence data presented in this study are available through NCBI’s Sequence Read Archive under BioProject number PRJNA772194. The taxa table and amplicon sequence variant (ASV) counts table are publicly available on GitHub at https://github.com/abigailclark1987/sctldmicrobiome.git (accessed on 12 October 2021).

Acknowledgments

The authors would like to thank the following individuals for assisting with sample collection: Paul Barbera, Nate Berkebile, Michael Bollinger, Ananda Ellis, Kristine Fisher, John Hart, Brian Reckenbeil, and Jennifer Stein. They would like to also acknowledge Allyson DeMerlis, Lygia Lostal-Bolden, and Marina Villoch Diaz-Maurino for providing laboratory assistance, Courtney Klepac and Samara Zinman for assisting with figure preparations, Grace Klinges for guidance during the sequence data submission process, and William Sharp and Rob Ruzicka for the project operational support. Collections were authorized under Florida Keys National Marine Sanctuary permit FKNMS-2018-006 (26 January 2018).

Conflicts of Interest

The authors declare no conflict of interest.

References

  1. Rohwer, F.; Seguritan, V.; Azam, F.; Knowlton, N. Diversity and Distribution of Coral-Associated Bacteria. Mar. Ecol. Prog. Ser. 2002, 243, 1–10. [Google Scholar] [CrossRef] [Green Version]
  2. Wegley, L.; Yu, Y.; Breitbart, M.; Casas, V.; Kline, D.; Rohwer, F. Coral-Associated Archaea. Mar. Ecol. Prog. Ser. 2004, 273, 89–96. [Google Scholar] [CrossRef]
  3. Bourne, D.G.; Morrow, K.M.; Webster, N.S. Insights into the Coral Microbiome: Underpinning the Health and Resilience of Reef Ecosystems. Annu. Rev. Microbiol. 2016, 70, 317–340. [Google Scholar] [CrossRef]
  4. Ainsworth, T.D.; Fordyce, A.J.; Camp, E.F. The Other Microeukaryotes of the Coral Reef Microbiome. Trends Microbiol. 2017, 25, 980–991. [Google Scholar] [CrossRef] [PubMed]
  5. Clerissi, C.; Brunet, S.; Vidal-Dupiol, J.; Adjeroud, M.; Lepage, P.; Guillou, L.; Escoubas, J.-M.; Toulza, E. Protists Within Corals: The Hidden Diversity. Front. Microbiol. 2018, 9, 2043. [Google Scholar] [CrossRef] [PubMed]
  6. Rädecker, N.; Pogoreutz, C.; Voolstra, C.R.; Wiedenmann, J.; Wild, C. Nitrogen Cycling in Corals: The Key to Understanding Holobiont Functioning? Trends Microbiol. 2015, 23, 490–497. [Google Scholar] [CrossRef] [PubMed] [Green Version]
  7. Benavides, M.; Bednarz, V.N.; Ferrier-Pagès, C. Diazotrophs: Overlooked Key Players within the Coral Symbiosis and Tropical Reef Ecosystems? Front. Mar. Sci. 2017, 4, 10. [Google Scholar] [CrossRef] [Green Version]
  8. Vanwonterghem, I.; Webster, N.S. Coral Reef Microorganisms in a Changing Climate. iScience 2020, 23, 100972. [Google Scholar] [CrossRef]
  9. Matthews, J.L.; Raina, J.; Kahlke, T.; Seymour, J.R.; Oppen, M.J.H.; Suggett, D.J. Symbiodiniaceae-bacteria Interactions: Rethinking Metabolite Exchange in Reef-building Corals as Multi-partner Metabolic Networks. Env. Microbiol. 2020, 22, 1675–1687. [Google Scholar] [CrossRef] [Green Version]
  10. Ritchie, K. Regulation of Microbial Populations by Coral Surface Mucus and Mucus-Associated Bacteria. Mar. Ecol. Prog. Ser. 2006, 322, 1–14. [Google Scholar] [CrossRef]
  11. Peixoto, R.S.; Rosado, P.M.; de Assis Leite, D.C.; Rosado, A.S.; Bourne, D.G. Beneficial Microorganisms for Corals (BMC): Proposed Mechanisms for Coral Health and Resilience. Front. Microbiol. 2017, 8, 341. [Google Scholar] [CrossRef] [Green Version]
  12. Thompson, J.R.; Rivera, H.E.; Closek, C.J.; Medina, M. Microbes in the Coral Holobiont: Partners through Evolution, Development, and Ecological Interactions. Front. Cell. Infect. Microbiol. 2015, 4, 176. [Google Scholar] [CrossRef]
  13. Littman, R.; Willis, B.L.; Bourne, D.G. Metagenomic Analysis of the Coral Holobiont during a Natural Bleaching Event on the Great Barrier Reef. Environ. Microbiol. Rep. 2011, 3, 651–660. [Google Scholar] [CrossRef]
  14. van Oppen, M.J.H.; Blackall, L.L. Coral Microbiome Dynamics, Functions and Design in a Changing World. Nat. Rev. Microbiol. 2019, 17, 557–567. [Google Scholar] [CrossRef] [PubMed]
  15. Boilard, A.; Dubé, C.E.; Gruet, C.; Mercière, A.; Hernandez-Agreda, A.; Derome, N. Defining Coral Bleaching as a Microbial Dysbiosis within the Coral Holobiont. Microorganisms 2020, 8, 1682. [Google Scholar] [CrossRef]
  16. Hoegh-Guldberg, O.; Mumby, P.J.; Hooten, A.J.; Steneck, R.S.; Greenfield, P.; Gomez, E.; Harvell, C.D.; Sale, P.F.; Edwards, A.J.; Caldeira, K.; et al. Coral Reefs under Rapid Climate Change and Ocean Acidification. Science 2007, 14, 1737–1742. [Google Scholar] [CrossRef] [PubMed] [Green Version]
  17. Hughes, T.P.; Barnes, M.L.; Bellwood, D.R.; Cinner, J.E.; Cumming, G.S.; Jackson, J.B.C.; Kleypas, J.; van de Leemput, I.A.; Lough, J.M.; Morrison, T.H.; et al. Coral Reefs in the Anthropocene. Nature 2017, 546, 82–90. [Google Scholar] [CrossRef] [PubMed]
  18. Epstein, P.R.; Sherman, K.; Spanger-Siegfried, E.; Langston, A.; Prasad, S.; McKay, B. Marine Ecosystems: Emerging Diseases as Indicators of Change. In Health Ecological and Economic Dimensions (HEED), NOAA Global Change Program; Center for Health and the Global Environment: Boston, MA, USA, 1998; 85p. [Google Scholar]
  19. Green, E.P.; Bruckner, A.W. The Significance of Coral Disease Epizootiology for Coral Reef Conservation. Biol. Conserv. 2000, 96, 347–361. [Google Scholar] [CrossRef]
  20. Weil, E.; Urreiztieta, I.; Garzôn-Ferreira, J. Geographic Variability in the Incidence of Coral and Octocoral Disease in the Wider Caribbean. In Proceedings of the 9th International Coral Reef Symposium, Bali, Indonesia, 23–27 October 2000; Volume 2, pp. 1231–1238. [Google Scholar]
  21. Willis, B.L.; Page, C.A.; Dinsdale, E.A. Coral Disease on the Great Barrier Reef. In Coral Health and Disease; Rosenberg, E., Loya, Y., Eds.; Springer: Berlin/Heidelberg, Germany, 2004; pp. 69–104. [Google Scholar] [CrossRef]
  22. Pollock, F.J.; Lamb, J.B.; Field, S.N.; Heron, S.F.; Schaffelke, B.; Shedrawi, G.; Bourne, D.G.; Willis, B.L. Sediment and Turbidity Associated with Offshore Dredging Increase Coral Disease Prevalence on Nearby Reefs. PLoS ONE 2014, 9, e102498. [Google Scholar] [CrossRef] [Green Version]
  23. Precht, W.F.; Gintert, B.E.; Robbart, M.L.; Fura, R.; van Woesik, R. Unprecedented Disease-Related Coral Mortality in Southeastern Florida. Sci. Rep. 2016, 6, 31374. [Google Scholar] [CrossRef]
  24. Atlantic and Gulf Rapid Reef Assessment. Available online: https://www.agrra.org/coral-disease-outbreak/ (accessed on 7 July 2021).
  25. Florida Department of Environmental Protection. Available online: https://floridadep.gov/sites/default/files/Copy%20of%20StonyCoralTissueLossDisease_CaseDefinition%20final%2010022018.pdf (accessed on 7 July 2021).
  26. Aeby, G.S.; Ushijima, B.; Campbell, J.E.; Jones, S.; Williams, G.J.; Meyer, J.L.; Häse, C.; Paul, V.J. Pathogenesis of a Tissue Loss Disease Affecting Multiple Species of Corals Along the Florida Reef Tract. Front. Mar. Sci. 2019, 6, 678. [Google Scholar] [CrossRef]
  27. Estrada-Saldívar, N.; Molina-Hernández, A.; Pérez-Cervantes, E.; Medellín-Maldonado, F.; González-Barrios, F.J.; Alvarez-Filip, L. Reef-Scale Impacts of the Stony Coral Tissue Loss Disease Outbreak. Coral Reefs 2020, 39, 861–866. [Google Scholar] [CrossRef]
  28. Estrada-Saldívar, N.; Quiroga-García, B.A.; Pérez-Cervantes, E.; Rivera-Garibay, O.O.; Alvarez-Filip, L. Effects of the Stony Coral Tissue Loss Disease Outbreak on Coral Communities and the Benthic Composition of Cozumel Reefs. Front. Mar. Sci. 2021, 8, 632777. [Google Scholar] [CrossRef]
  29. Neely, K.L.; Macaulay, K.A.; Hower, E.K.; Dobler, M.A. Effectiveness of Topical Antibiotics in Treating Corals Affected by Stony Coral Tissue Loss Disease. PeerJ 2020, 8, e9289. [Google Scholar] [CrossRef] [PubMed]
  30. Landsberg, J.H.; Kiryu, Y.; Peters, E.C.; Wilson, P.W.; Perry, N.; Waters, Y.; Maxwell, K.E.; Huebner, L.K.; Work, T.M. Stony Coral Tissue Loss Disease in Florida Is Associated With Disruption of Host–Zooxanthellae Physiology. Front. Mar. Sci. 2020, 7, 576013. [Google Scholar] [CrossRef]
  31. Dobbelaere, T.; Muller, E.M.; Gramer, L.J.; Holstein, D.M.; Hanert, E. Coupled Epidemio-Hydrodynamic Modeling to Understand the Spread of a Deadly Coral Disease in Florida. Front. Mar. Sci. 2020, 7, 591881. [Google Scholar] [CrossRef]
  32. Muller, E.M.; Sartor, C.; Alcaraz, N.I.; van Woesik, R. Spatial Epidemiology of the Stony-Coral-Tissue-Loss Disease in Florida. Front. Mar. Sci. 2020, 7, 163. [Google Scholar] [CrossRef] [Green Version]
  33. Dahlgren, C.; Pizarro, V.; Sherman, K.; Greene, W.; Oliver, J. Spatial and Temporal Patterns of Stony Coral Tissue Loss Disease Outbreaks in The Bahamas. Front. Mar. Sci. 2021, 8, 682114. [Google Scholar] [CrossRef]
  34. Williams, S.D.; Walter, C.S.; Muller, E.M. Fine Scale Temporal and Spatial Dynamics of the Stony Coral Tissue Loss Disease Outbreak Within the Lower Florida Keys. Front. Mar. Sci. 2021, 8, 631776. [Google Scholar] [CrossRef]
  35. Ushijima, B.; Meyer, J.L.; Thompson, S.; Pitts, K.; Marusich, M.F.; Tittl, J.; Weatherup, E.; Reu, J.; Wetzell, R.; Aeby, G.S.; et al. Disease Diagnostics and Potential Coinfections by Vibrio coralliilyticus During an Ongoing Coral Disease Outbreak in Florida. Front. Microbiol. 2020, 11, 569354. [Google Scholar] [CrossRef]
  36. Walker, B.K.; Turner, N.R.; Noren, H.K.G.; Buckley, S.F.; Pitts, K.A. Optimizing Stony Coral Tissue Loss Disease (SCTLD) Intervention Treatments on Montastraea cavernosa in an Endemic Zone. Front. Mar. Sci. 2021, 8, 666224. [Google Scholar] [CrossRef]
  37. Neely, K.L.; Shea, C.P.; Macaulay, K.A.; Hower, E.K.; Dobler, M.A. Short- and Long-Term Effectiveness of Coral Disease Treatments. Front. Mar. Sci. 2021, 8, 675349. [Google Scholar] [CrossRef]
  38. Walton, C.J.; Hayes, N.K.; Gilliam, D.S. Impacts of a Regional, Multi-Year, Multi-Species Coral Disease Outbreak in Southeast Florida. Front. Mar. Sci. 2018, 5, 323. [Google Scholar] [CrossRef]
  39. Meyer, J.L.; Castellanos-Gell, J.; Aeby, G.S.; Häse, C.C.; Ushijima, B.; Paul, V.J. Microbial Community Shifts Associated With the Ongoing Stony Coral Tissue Loss Disease Outbreak on the Florida Reef Tract. Front. Microbiol. 2019, 10, 2244. [Google Scholar] [CrossRef] [PubMed]
  40. Rosales, S.M.; Clark, A.S.; Huebner, L.K.; Ruzicka, R.R.; Muller, E.M. Rhodobacterales and Rhizobiales Are Associated With Stony Coral Tissue Loss Disease and Its Suspected Sources of Transmission. Front. Microbiol. 2020, 11, 681. [Google Scholar] [CrossRef] [PubMed]
  41. Work, T.M. Final Report on Electron Microscopy of Florida Corals Affected with Stony Coral Tissue Loss Disease (SCTLD). U.S. Geological Survey Diagnostic Case Report 2021. Available online: https://www.caymancompass.com/wp-content/uploads/2021/08/USGS-SCTLD-research-report.pdf?__cf_chl_captcha_tk__=pmd_h_fJ47Hee45Ys_Bx2Wealj_1yVhP3i3zSz3My_PvQ_Y-1634709587-0-gqNtZGzNAyWjcnBszQil (accessed on 31 August 2021).
  42. Caporaso, J.G.; Lauber, C.L.; Walters, W.A.; Berg-Lyons, D.; Lozupone, C.A.; Turnbaugh, P.J.; Fierer, N.; Knight, R. Global Patterns of 16S rRNA Diversity at a Depth of Millions of Sequences per Sample. Proc. Natl. Acad. Sci. USA 2011, 108 (Suppl. 1), 4516–4522. [Google Scholar] [CrossRef] [PubMed] [Green Version]
  43. Takai, K.; Horikoshi, K. Rapid Detection and Quantification of Members of the Archaeal Community by Quantitative PCR using Fluorogenic Probes. Appl Environ. Microbiol. 2000, 66, 5066–5072. [Google Scholar] [CrossRef] [PubMed] [Green Version]
  44. R Core Team. R: A Language and Environment for Statistical Computing. R Foundation for Statistical Computing. Available online: https://www.R-project.org/ (accessed on 29 August 2021).
  45. Callahan, B.J.; McMurdie, P.J.; Rosen, M.J.; Han, A.W.; Johnson, A.J.A.; Holmes, S.P. DADA2: High-Resolution Sample Inference from Illumina Amplicon Data. Nat. Methods 2016, 13, 581–583. [Google Scholar] [CrossRef] [PubMed] [Green Version]
  46. Callahan, B. Silva Taxonomic Training Data Formatted for DADA2 (Silva Version 132). Zenodo 2018. [Google Scholar] [CrossRef]
  47. McMurdie, P.J.; Holmes, S. phyloseq: An R Package for Reproducible Interactive Analysis and Graphics of Microbiome Census Data. PLoS ONE 2013, 8, e61217. [Google Scholar] [CrossRef] [PubMed] [Green Version]
  48. Oksanen, J.; Blanchet, F.G.; Friendly, M.; Kindt, R.; Legendre, P.; McGlinn, D.; Minchin, P.R.; O’Hara, R.B.; Simpson, G.L.; Solymos, P.; et al. Vegan: Community Ecology Package. R Package Version 2.5-7. 2020. Available online: https://CRAN.R-project.org/package=vegan (accessed on 16 October 2021).
  49. Martinez, A. PairwiseAdonis: Pairwise Multilevel Comparison Using Adonis R Package Version 0.3. 2019. Available online: https://github.com/pmartinezarbizu/pairwiseAdonis (accessed on 16 October 2021).
  50. Mandal, S.; Van Treuren, W.; White, R.A.; Eggesbø, M.; Knight, R.; Peddada, S.D. Analysis of Composition of Microbiomes: A Novel Method for Studying Microbial Composition. Microb. Ecol. Health Dis. 2015, 26. [Google Scholar] [CrossRef] [PubMed] [Green Version]
  51. Iwanowicz, D.D.; Schill, W.B.; Woodley, C.M.; Bruckner, A.; Neely, K.; Briggs, K.M. Exploring the Stony Coral Tissue Loss Disease Bacterial Pathobiome. Microbiology 2020. preprint. [Google Scholar] [CrossRef]
  52. Becker, C.C.; Brandt, M.; Miller, C.A.; Apprill, A. Stony Coral Tissue Loss Disease Biomarker Bacteria Identified in Corals and Overlying Waters Using a Rapid Field-Based Sequencing Approach; preprint. Microbiology 2021. [Google Scholar] [CrossRef]
  53. Zaneveld, J.R.; Burkepile, D.E.; Shantz, A.A.; Pritchard, C.E.; McMinds, R.; Payet, J.P.; Welsh, R.; Correa, A.M.S.; Lemoine, N.P.; Rosales, S.; et al. Overfishing and Nutrient Pollution Interact with Temperature to Disrupt Coral Reefs down to Microbial Scales. Nat. Commun. 2016, 7, 11833. [Google Scholar] [CrossRef]
  54. Weber, L.; Gonzalez-Díaz, P.; Armenteros, M.; Apprill, A. The Coral Ecosphere: A Unique Coral Reef Habitat That Fosters Coral–Microbial Interactions. Limnol. Oceanogr. 2019, 64, 2373–2388. [Google Scholar] [CrossRef] [Green Version]
  55. Eaton, K.R.; Landsberg, J.H.; Kiryu, Y.; Peters, E.C.; Muller, E.M. Measuring Stony Coral Tissue Loss Disease Induction and Lesion Progression Within Two Intermediately Susceptible Species, Montastraea cavernosa and Orbicella faveolata. Front. Mar. Sci. 2021, 8, 717265. [Google Scholar] [CrossRef]
  56. Zaneveld, J.; McMinds, R.; Vega Thurber, R. Stress and stability: Applying the Anna Karenina principle to animal microbiomes. Nat. Microbiol. 2017, 2, 17121. [Google Scholar] [CrossRef]
  57. Rosales, S.M.; Miller, M.W.; Williams, D.E.; Traylor-Knowles, N.; Young, B.; Serrano, X.M. Microbiome Differences in Disease-Resistant vs. Susceptible Acropora Corals Subjected to Disease Challenge Assays. Sci. Rep. 2019, 9, 18279. [Google Scholar] [CrossRef] [Green Version]
  58. MacKnight, N.J.; Cobleigh, K.; Lasseigne, D.; Chaves-Fonnegra, A.; Gutting, A.; Dimos, B.; Antoine, J.; Fuess, L.; Ricci, C.; Butler, C.; et al. Microbial Dysbiosis Reflects Disease Resistance in Diverse Coral Species. Commun. Biol. 2021, 4, 679. [Google Scholar] [CrossRef] [PubMed]
  59. McDevitt-Irwin, J.M.; Baum, J.K.; Garren, M.; Vega Thurber, R.L. Responses of Coral-Associated Bacterial Communities to Local and Global Stressors. Front. Mar. Sci. 2017, 4, 262. [Google Scholar] [CrossRef] [Green Version]
  60. Vega Thurber, R.; Willner-Hall, D.; Rodriguez-Mueller, B.; Desnues, C.; Edwards, R.A.; Angly, F.; Dinsdale, E.; Kelly, L.; Rohwer, F. Metagenomic Analysis of Stressed Coral Holobionts. Environ. Microbiol. 2009, 11. [Google Scholar] [CrossRef]
  61. Glasl, B.; Herndl, G.J.; Frade, P.R. The Microbiome of Coral Surface Mucus Has a Key Role in Mediating Holobiont Health and Survival upon Disturbance. ISME J. 2016, 10, 2280–2292. [Google Scholar] [CrossRef] [PubMed] [Green Version]
  62. Gignoux-Wolfsohn, S.A.; Aronson, F.M.; Vollmer, S.V. Complex Interactions between Potentially Pathogenic, Opportunistic, and Resident Bacteria Emerge during Infection on a Reef-Building Coral. FEMS Microbiol. Ecol. 2017, 93, fix080. [Google Scholar] [CrossRef] [Green Version]
  63. Sharp, W.C.; Shea, C.P.; Maxwell, K.E.; Muller, E.M.; Hunt, J.H. Evaluating the Small-Scale Epidemiology of the Stony-Coral -Tissue-Loss-Disease in the Middle Florida Keys. PLoS ONE 2020, 15, e0241871. [Google Scholar] [CrossRef]
  64. Cooney, R.P.; Pantos, O.; Le Tissier, M.D.A.; Barer, M.R.; O’Donnell, A.G.; Bythell, J.C. Characterization of the Bacterial Consortium Associated with Black Band Disease in Coral using Molecular Microbiological Techniques. Environ. Microbiol. 2002, 4, 401–413. [Google Scholar] [CrossRef]
  65. Pantos, O.; Cooney, R.P.; Le Tissier, M.D.A.; Barer, M.R.; O’Donnell, A.G.; Bythell, J.C. The Bacterial Ecology of a Plague-Like Disease Affecting the Caribbean Coral Montastrea Annularis. Environ. Microbiol. 2003, 5, 370–382. [Google Scholar] [CrossRef]
  66. Pantos, O.; Bythell, J.C. Bacterial Community Structure Associated with White Band Disease in the Elkhorn Coral Acropora palmata Determined using Culture-Independent 16S rRNA Techniques. Dis. Aqu. Org. 2006, 69, 79–88. [Google Scholar] [CrossRef]
  67. Sunagawa, S.; DeSantis, T.Z.; Piceno, Y.M.; Brodie, E.L.; DeSalvo, M.K.; Voolstra, C.R.; Weil, E.; Andersen, G.L.; Medina, M. Bacterial Diversity and White Plague Disease-Associated Community Changes in the Caribbean Coral Montastraea faveolata. ISME J. 2009, 3, 512–521. [Google Scholar] [CrossRef] [Green Version]
  68. Mouchka, M.E.; Hewson, I.; Harvell, C.D. Coral-Associated Bacterial Assemblages: Current Knowledge and the Potential for Climate-Driven Impacts. Integr. Comp. Biol. 2010, 50, 662–674. [Google Scholar] [CrossRef] [PubMed]
  69. Soffer, N.; Zaneveld, J.; Vega Thurber, R. Phage-Bacteria Network Analysis and Its Implication for the Understanding of Coral Disease: Phage-Bacteria Interaction Networks of Corals. Environ. Microbiol. 2015, 17, 1203–1218. [Google Scholar] [CrossRef] [PubMed]
  70. Dang, H.; Lovell, C.R. Bacterial Primary Colonization and Early Succession on Surfaces in Marine Waters as Determined by Amplified rRNA Gene Restriction Analysis and Sequence Analysis of 16S rRNA Genes. Appl. Environ. Microbiol. 2000, 66, 467–475. [Google Scholar] [CrossRef] [Green Version]
  71. Dang, H.; Li, T.; Chen, M.; Huang, G. Cross-Ocean Distribution of Rhodobacterales Bacteria as Primary Surface Colonizers in Temperate Coastal Marine Waters. Appl. Environ. Microbiol. 2008, 74, 52–60. [Google Scholar] [CrossRef] [Green Version]
  72. Mayali, X.; Weber, P.K.; Mabery, S.; Pett-Ridge, J. Phylogenetic Patterns in the Microbial Response to Resource Availability: Amino Acid Incorporation in San Francisco Bay. PLoS ONE 2014, 9, e95842. [Google Scholar] [CrossRef] [PubMed]
  73. Brinkhoff, T.; Bach, G.; Heidorn, T.; Liang, L.; Schlingloff, A.; Simon, M. Antibiotic Production by a Roseobacter Clade-Affiliated Species from the German Wadden Sea and Its Antagonistic Effects on Indigenous Isolates. Appl. Environ. Microbiol. 2004, 70, 2560–2565. [Google Scholar] [CrossRef] [PubMed] [Green Version]
  74. Burge, C.A.; Eakin, C.M.; Friedman, C.S.; Froelich, B.; Hershberger, P.K.; Hofmann, E.E.; Petes, L.E.; Prager, K.C.; Weil, E.; Willis, B.L.; et al. Climate Change Influences on Marine Infectious Diseases: Implications for Management and Society. Mar. Sci. 2013, 6, 249–277. [Google Scholar] [CrossRef] [Green Version]
  75. Sweet, M.J.; Bythell, J.C.; Nugues, M.M. Algae as Reservoirs for Coral Pathogens. PLoS ONE 2013, 8, e69717. [Google Scholar] [CrossRef] [Green Version]
  76. Leiblein, M.; Wagner, N.; Adam, E.H.; Frank, J.; Marzi, I.; Nau, C. Clostridial Gas Gangrene - A Rare but Deadly Infection: Case Series and Comparison to Other Necrotizing Soft Tissue Infections. Orthop. Surg. 2020, 12, 1733–1747. [Google Scholar] [CrossRef] [PubMed]
Figure 1. Map of sampling sites (n = 8; represented by symbols) along Florida’s Coral Reef (FCR). Five sites (Sites A–E) were located in the epidemic zone, an area of FCR where stony coral tissue loss disease (SCTLD) was active at the time. Three sites (Sites F–H) were located ahead of the epidemic zone in an area designated the vulnerable zone. The black line indicates the approximate front of SCTLD at the time of sampling in 2018. Coral reef names corresponding to Sites A–H are in parentheses.
Microorganisms 09 02181 g001
Figure 2. Representative photos of colonies with stony coral tissue loss disease. (A) Colpophyllia natans with acute tissue loss and (B) Orbicella faveolata with chronic tissue loss.
Microorganisms 09 02181 g002
Figure 3. Non-metric Multidimensional Scaling (NMDS) ordination plots of amplicon sequence variants (ASVs) in the tissues of apparently healthy colonies of five coral species: (A) Colpophyllia natans, (B) Pseudodiploria strigosa, (C) Montastraea cavernosa, (D) Orbicella faveolata, and (E) Siderastrea siderea. Tissues of apparently healthy colonies were collected from the epidemic zone (orange) and the vulnerable zone (blue) of stony coral tissue loss disease. NMDS was performed using a Euclidean distance.
Microorganisms 09 02181 g003
Figure 4. Non-metric Multidimensional Scaling (NMDS) ordination plots of amplicon sequence variants (ASVs) in lesion tissue (orange) and unaffected tissue (purple) of colonies with stony coral tissue loss disease, and tissue of apparently healthy colonies (blue) of five coral species: (A) Colpophyllia natans, (B) Pseudodiploria strigosa, (C) Montastraea cavernosa, (D) Orbicella faveolata, and (E) Siderastrea siderea. These data reflect samples collected in the epidemic zone. NMDS ordination plots of ASVs in (F) water samples reflect samples collected in the epidemic zone (Sites A–E; orange) and vulnerable zone (Sites F–H; blue). NMDS was performed using a Euclidean distance.
Microorganisms 09 02181 g004
Figure 5. Microbial alpha diversity metrics (species richness and Shannon diversity) comparing lesion and unaffected tissues from colonies with stony coral tissue loss disease, and tissue of apparently healthy colonies, collected from five coral species: (A) Colpophyllia natans, (B) Pseudodiploria strigosa, (C) Montastraea cavernosa, (D) Orbicella faveolata, and (E) Siderastrea siderea. Letters denote significant differences determined by the post-hoc tests.
Microorganisms 09 02181 g005
Figure 6. Microbial alpha diversity metrics (species richness and Shannon diversity) comparing tissue of apparently healthy colonies collected from five coral species, Colpophyllia natans (CNAT), Pseudodiploria strigosa (PSTR), Montastraea cavernosa (MCAV), Orbicella faveolata (OFAV), and Siderastrea siderea (SSID) in (A) the vulnerable zone and (B) the epidemic zone of stony coral tissue loss disease. Letters denote significant differences determined by the post-hoc tests.
Microorganisms 09 02181 g006
Figure 7. Mean relative abundances of amplicon sequence variants (ASVs) visualized at the bacterial class level in (A) lesion and unaffected tissues from colonies with stony coral tissue loss disease, and tissue of apparently healthy colonies, collected from Colpophyllia natans, Pseudodiploria strigosa, Montastraea cavernosa, Orbicella faveolata, and Siderastrea siderea in the epidemic zone. Additionally, shown are the mean relative abundances of bacterial classes in (B) water samples collected across the epidemic zone (Sites A–E) and vulnerable zone (Sites F–H). Displayed are taxa with ≥100 ASV counts in at least 10% of samples. Taxa with <100 ASV counts are represented by the white space.
Microorganisms 09 02181 g007
Figure 8. Relative abundances of significantly differentiated taxa (i.e., taxa with W-statistic values greater than a detection threshold of 0.7) in lesion and unaffected tissues from colonies with stony coral tissue loss disease, and tissue of apparently healthy colonies, collected from five coral species: (A) Colpophyllia natans, (B) Pseudodiploria strigosa, (C) Montastraea cavernosa, (D) Orbicella faveolata, and (E) Siderastrea siderea. Additionally, displayed is the relative abundance of significant taxa detected in (F) water samples collected at sites in the epidemic zone and at sites in the vulnerable zone. Taxa are grouped by order.
Microorganisms 09 02181 g008
Table 1. Summary of coral tissue/mucus and water samples collected from sites (n = 8; Figure 1) along Florida’s Coral Reef. Shown are the dates of sampling, stony coral tissue loss disease (SCTLD) zone, site letter codes, and coral species sampled: Colpophyllia natans (CNAT), Pseudodiploria strigosa (PSTR), Montastraea cavernosa (MCAV), Orbicella faveolata (OFAV), and Siderastrea siderea (SSID). For each coral species, the number of lesion and unaffected tissue samples from colonies with SCTLD, and the number of samples from apparently healthy colonies, collected per site are shown. The number of water samples collected per site is also shown.
DateZoneSite Letter Code 1Coral
Species
Lesion/
Site
Unaffected/
Site
Healthy/
Site
Water/
Site
04/09–04/27/18EpidemicA–ECNAT553-
04/09–04/27/18EpidemicA–EPSTR4–54–53-
04/09–04/27/18EpidemicA–EMCAV553-
04/09–04/27/18EpidemicA–EOFAV3–53–53-
04/09–04/27/18EpidemicA–ESSID553-
04/09–04/27/18EpidemicA–E----3
05/08–06/05/18VulnerableF–HCNAT--3-
05/08–06/05/18VulnerableF–HPSTR--2–3-
05/08–06/05/18VulnerableF–HMCAV--3-
05/08–06/05/18VulnerableF–HOFAV--3-
05/08–06/05/18VulnerableF–HSSID--3-
05/08–06/05/18VulnerableF–H----3
Total 12212211924
1 Site: A—West Turtle Shoal; B—Boot Key Patch; C—Nearshore Patch; D—East Turtle Shoal; E—Dustan Rocks; F—Western Sambo Patch; G—Xesto Patch; H—Lindsay’s Patch.
Table 2. Significantly differentiated amplicon sequence variants (ASVs) enriched in the lesion tissue of ≥2 of the coral species examined in this study: Colpophyllia natans, Pseudodiploria strigosa, Montastraea cavernosa, Orbicella faveolata, and Siderastrea siderea. NCBI’s Basic Local Alignment Search Tool (BLAST) confirmed that the ASVs listed here match sequences published in other stony coral tissue loss disease studies.
ASV IDFamily, GenusReference
6Rhodobacteraceae, Ruegeria[39,51]
21Rhodobacteraceae, Thalassobius[39,40,52]
22Rhodobacteraceae, Shimia[39,40,51,52]
50Peptostreptococcaceae, Tepidibacter[39,51]
57Rhodobacteraceae, Nautella[39]
116Rhodobacteraceae, Planktotalea[39,51]
124Rhodobacteraceae, Salinihabitans[39]
148Rhodobacteraceae, unclassified[39]
208Rhodobacteraceae, Nioella[39,51]
Publisher’s Note: MDPI stays neutral with regard to jurisdictional claims in published maps and institutional affiliations.

