
Rapid Detection of Escherichia coli Antibiotic Susceptibility Using Live/Dead Spectrometry for Lytic Agents

 , and
, and 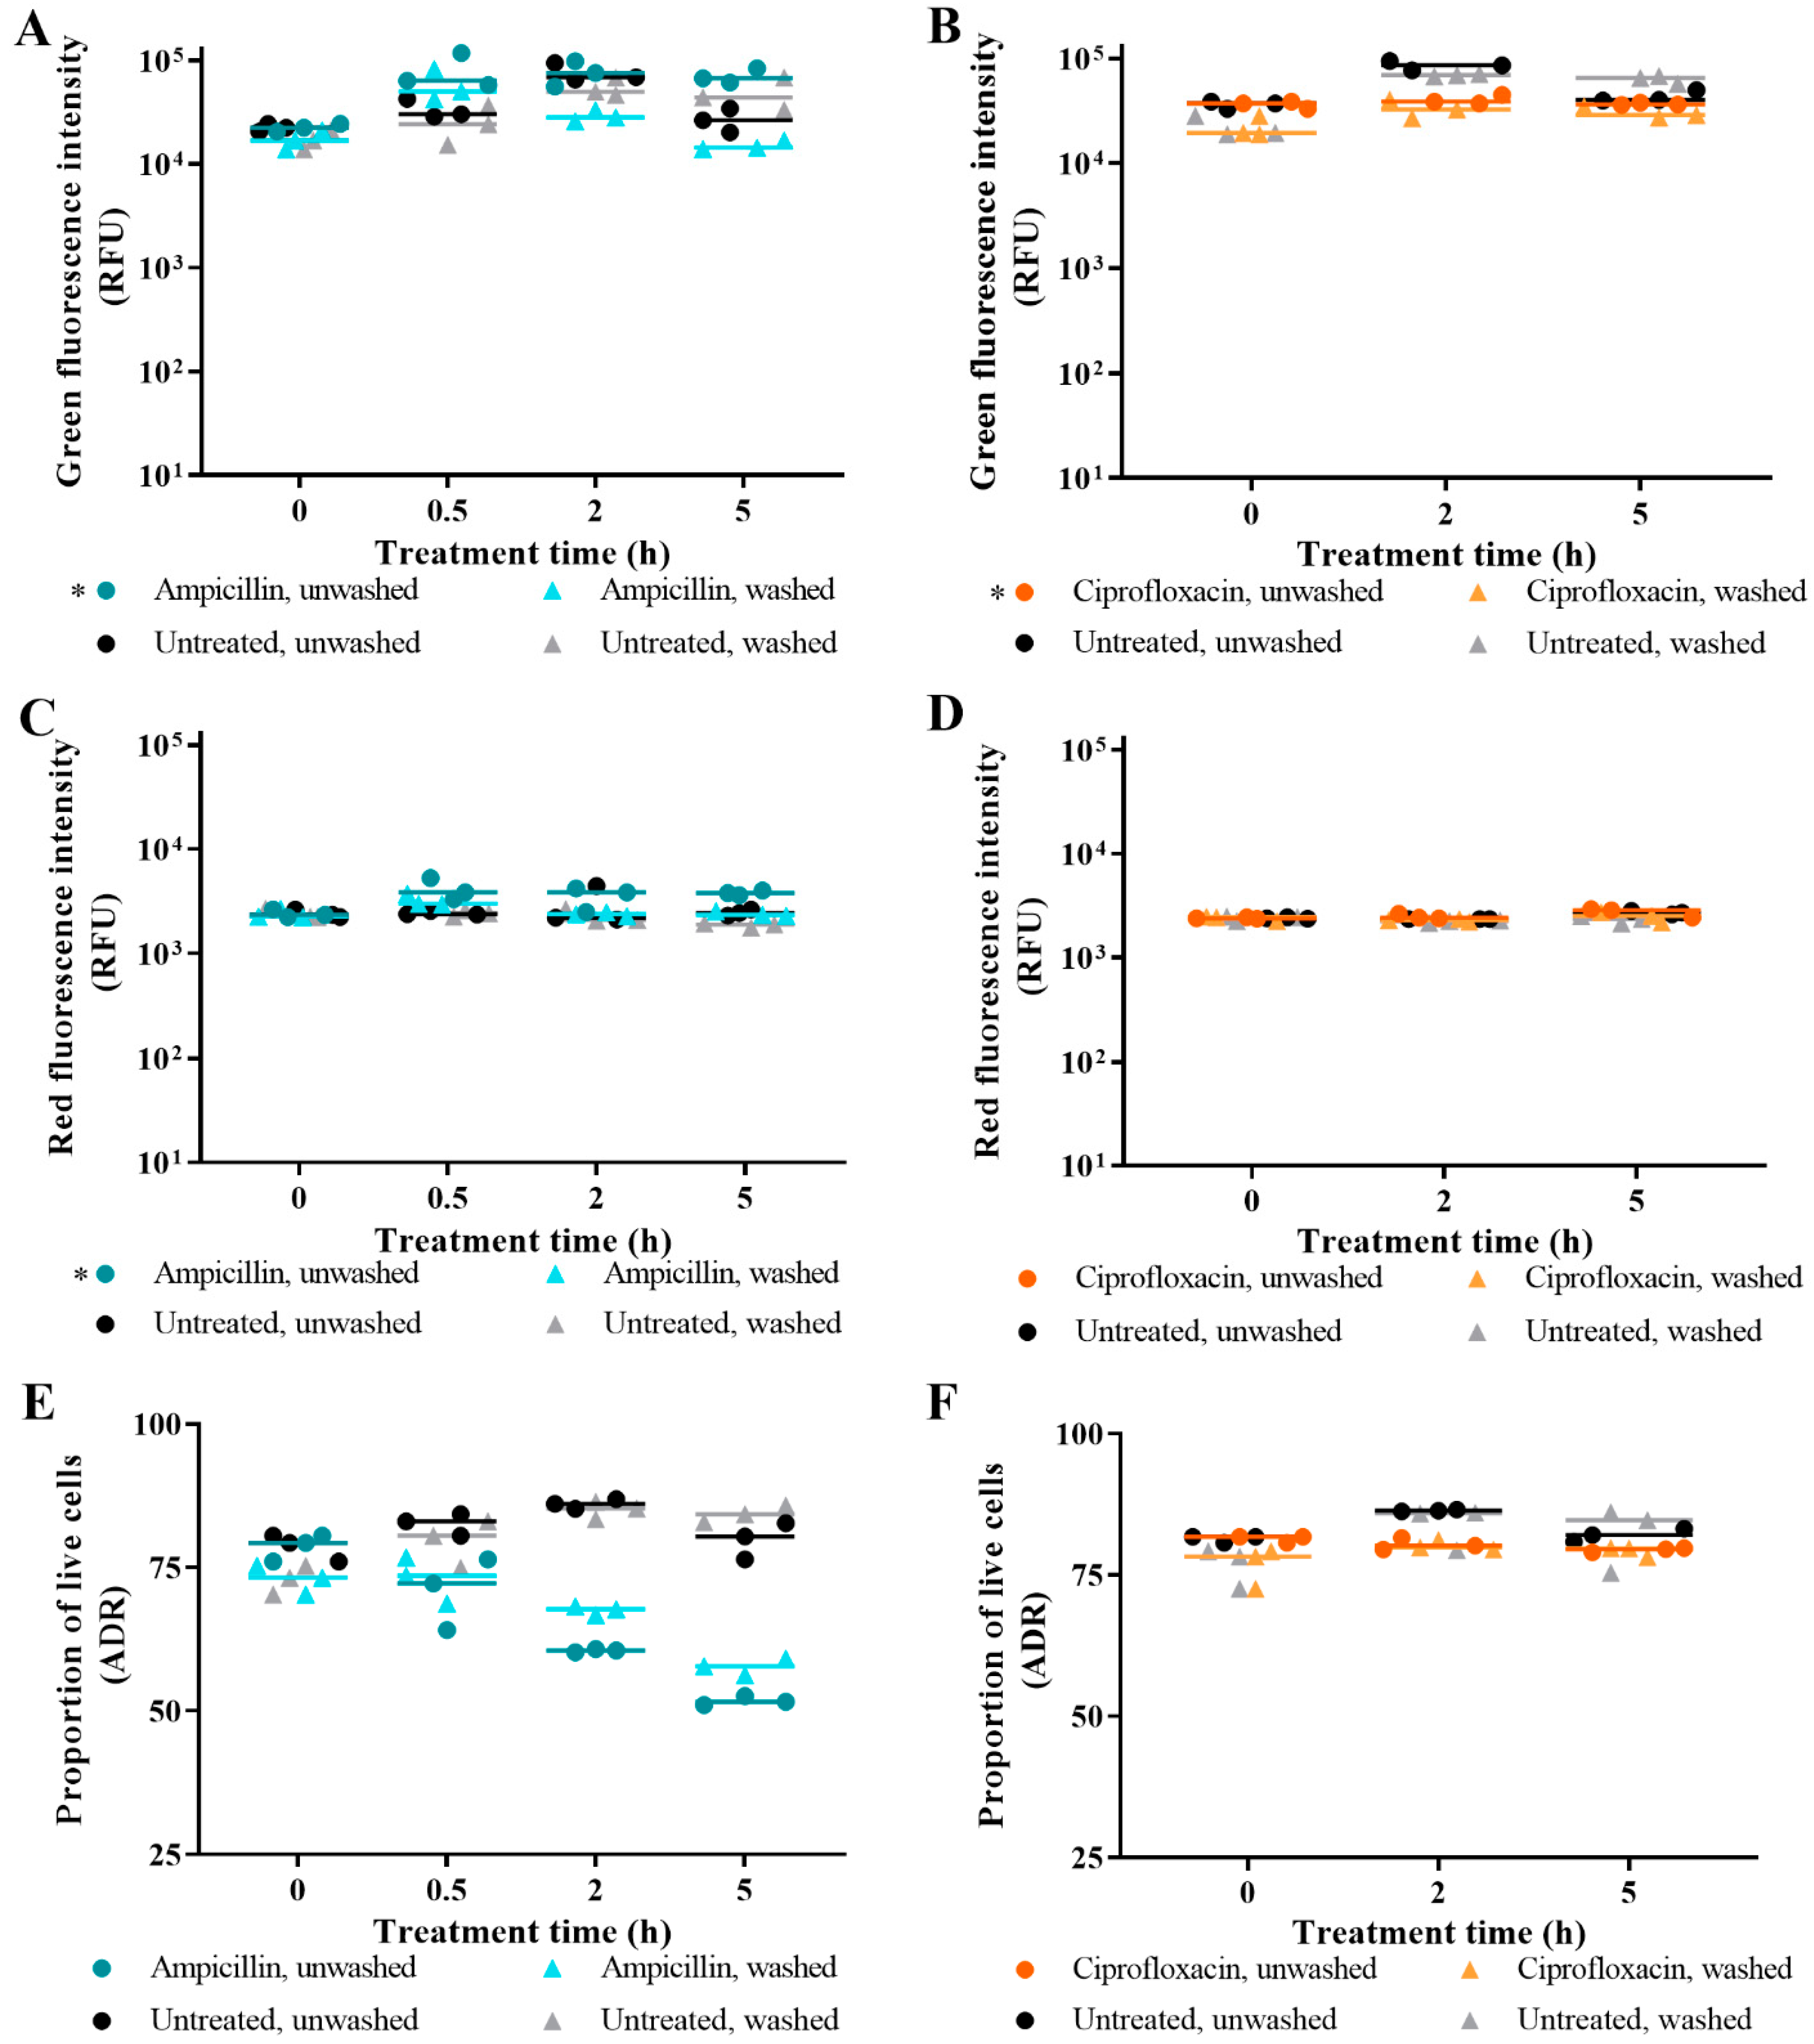
Abstract
:1. Introduction
2. Materials and Methods
2.1. Bacterial Strain
2.2. Media and Chemicals
2.3. Culture Preparation
2.4. Determination of MIC and MBC
2.5. Antibiotic Challenge
2.6. Staining Samples with SYTO 9 And/Or PI
2.7. Measuring Sample Fluorescence with the Optrode
2.8. Processing of Optrode Data Files
2.9. Flow Cytometry Measurements
2.10. Biological Data Processing
2.11. Processing of Flow Cytometry Data
2.12. Statistical Analysis
3. Results
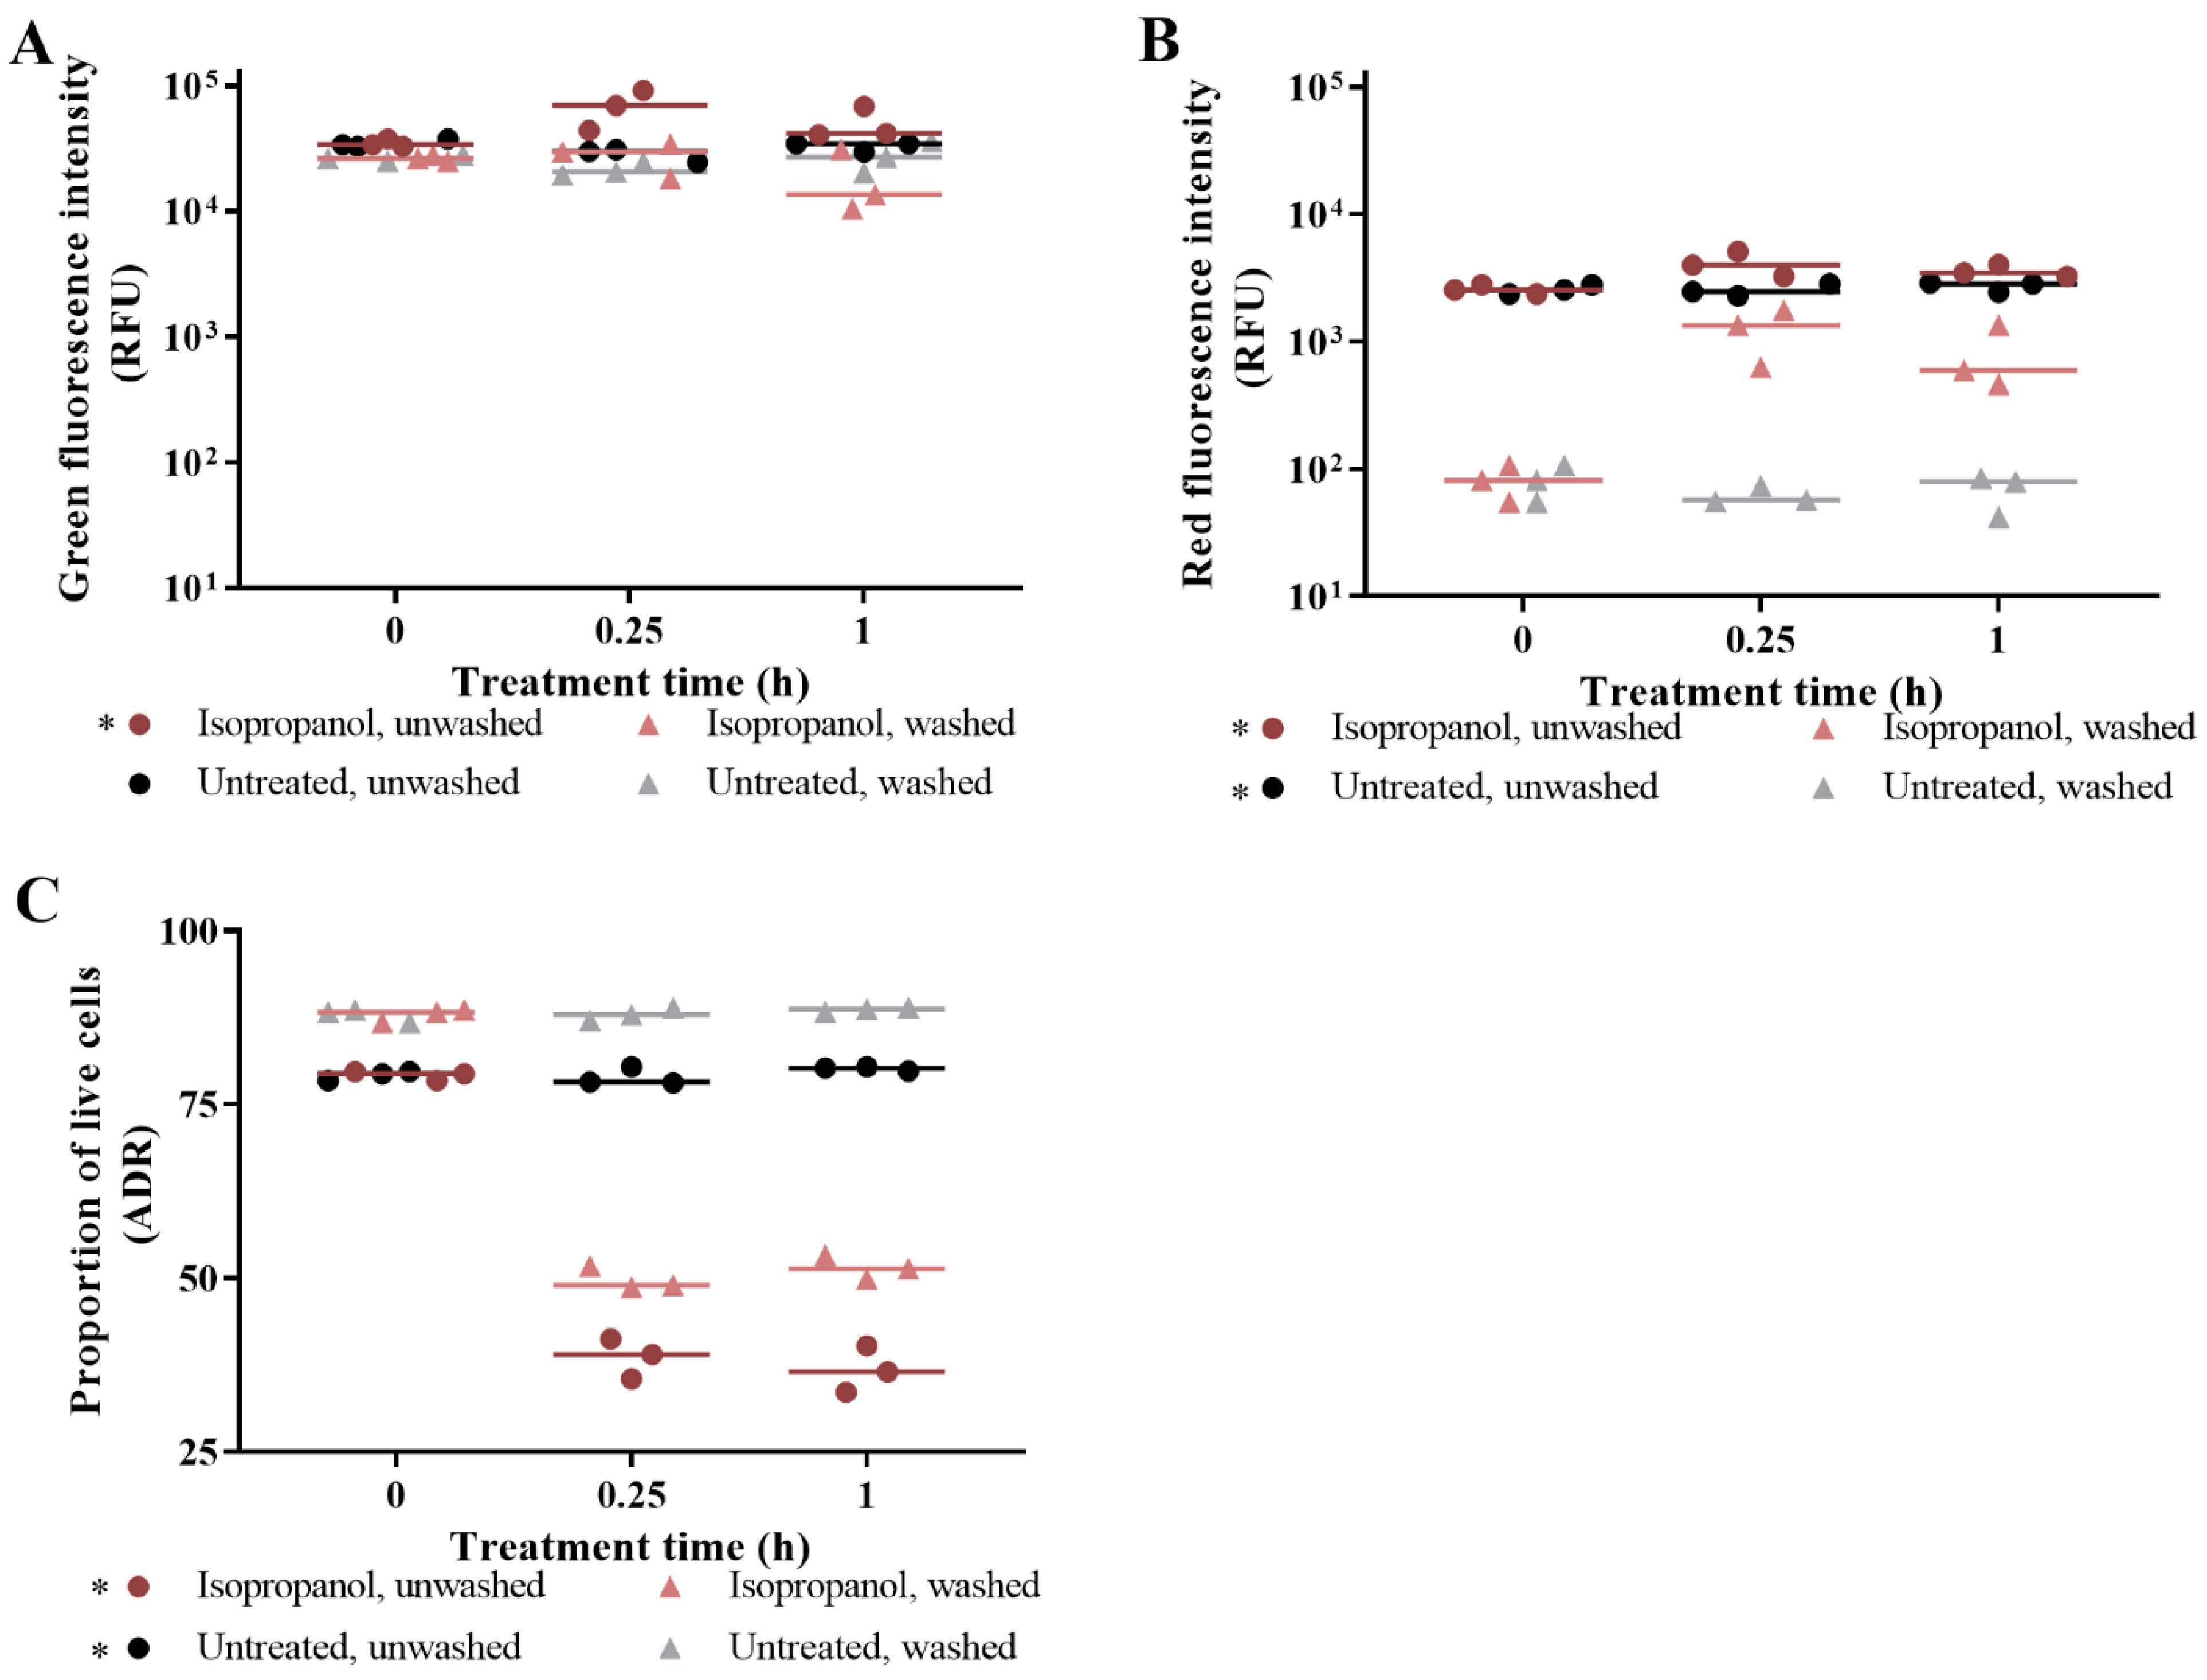
3.1. The Effect of Washing Samples before and after Staining
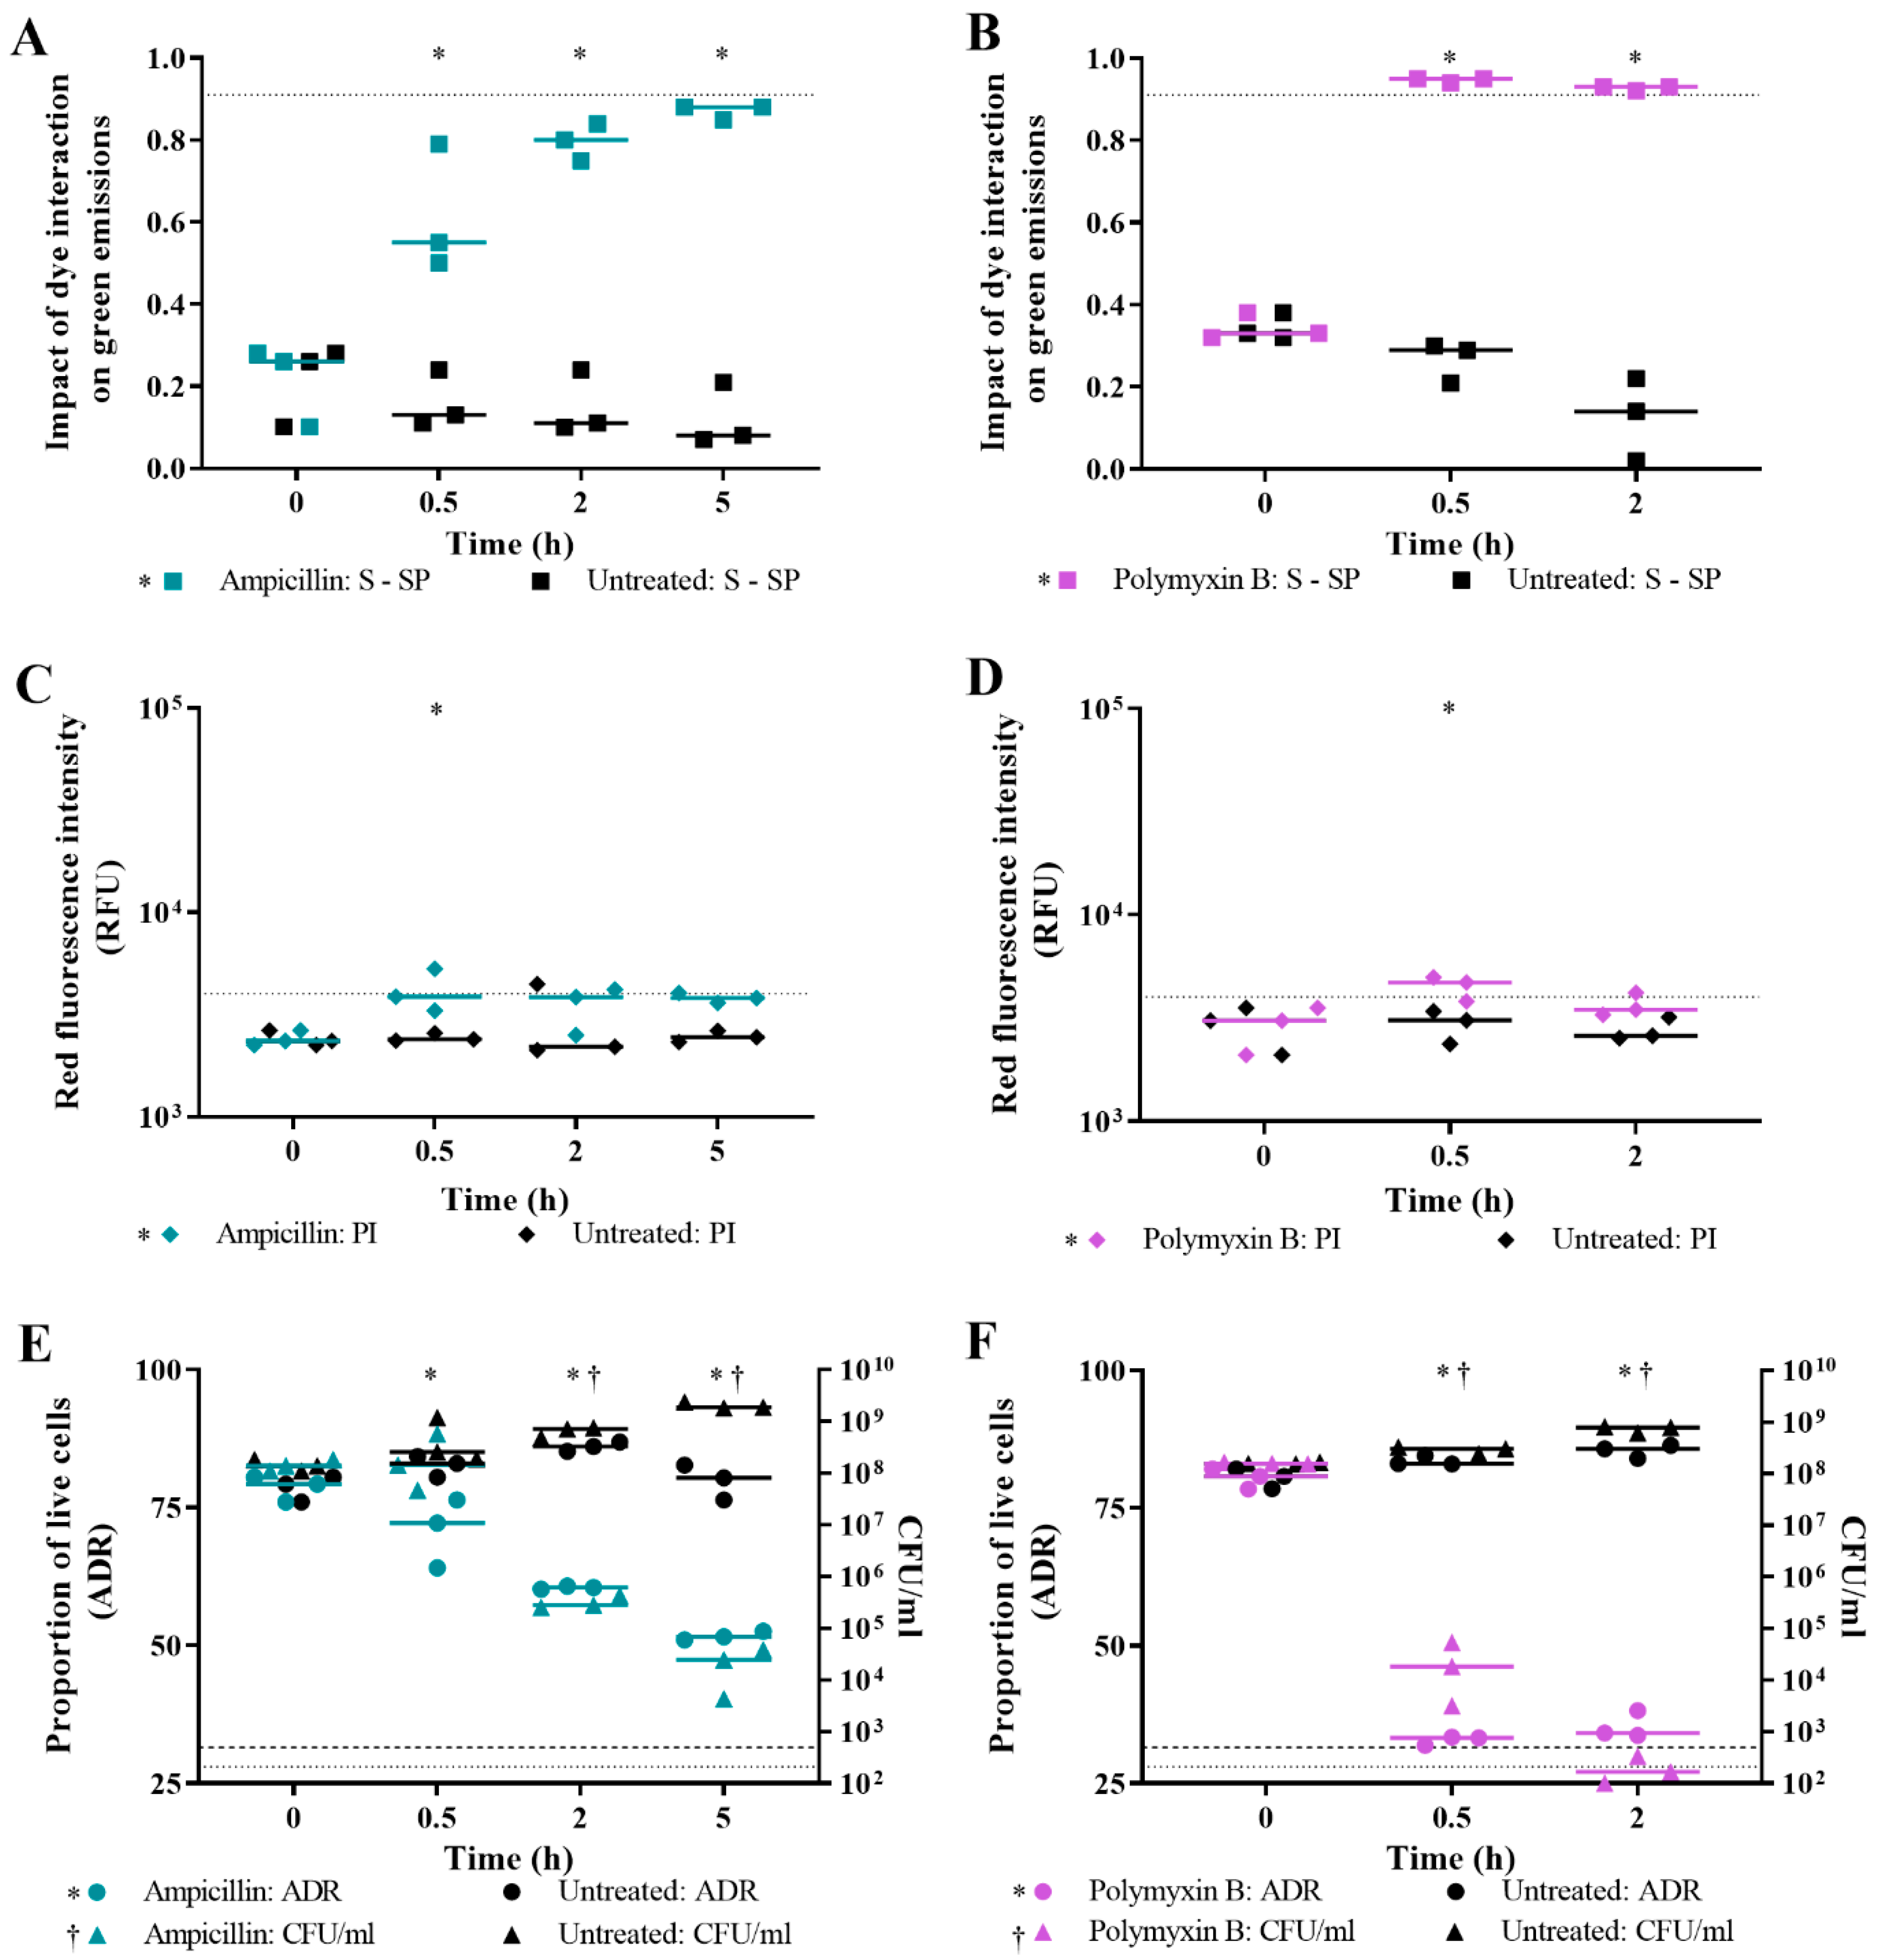
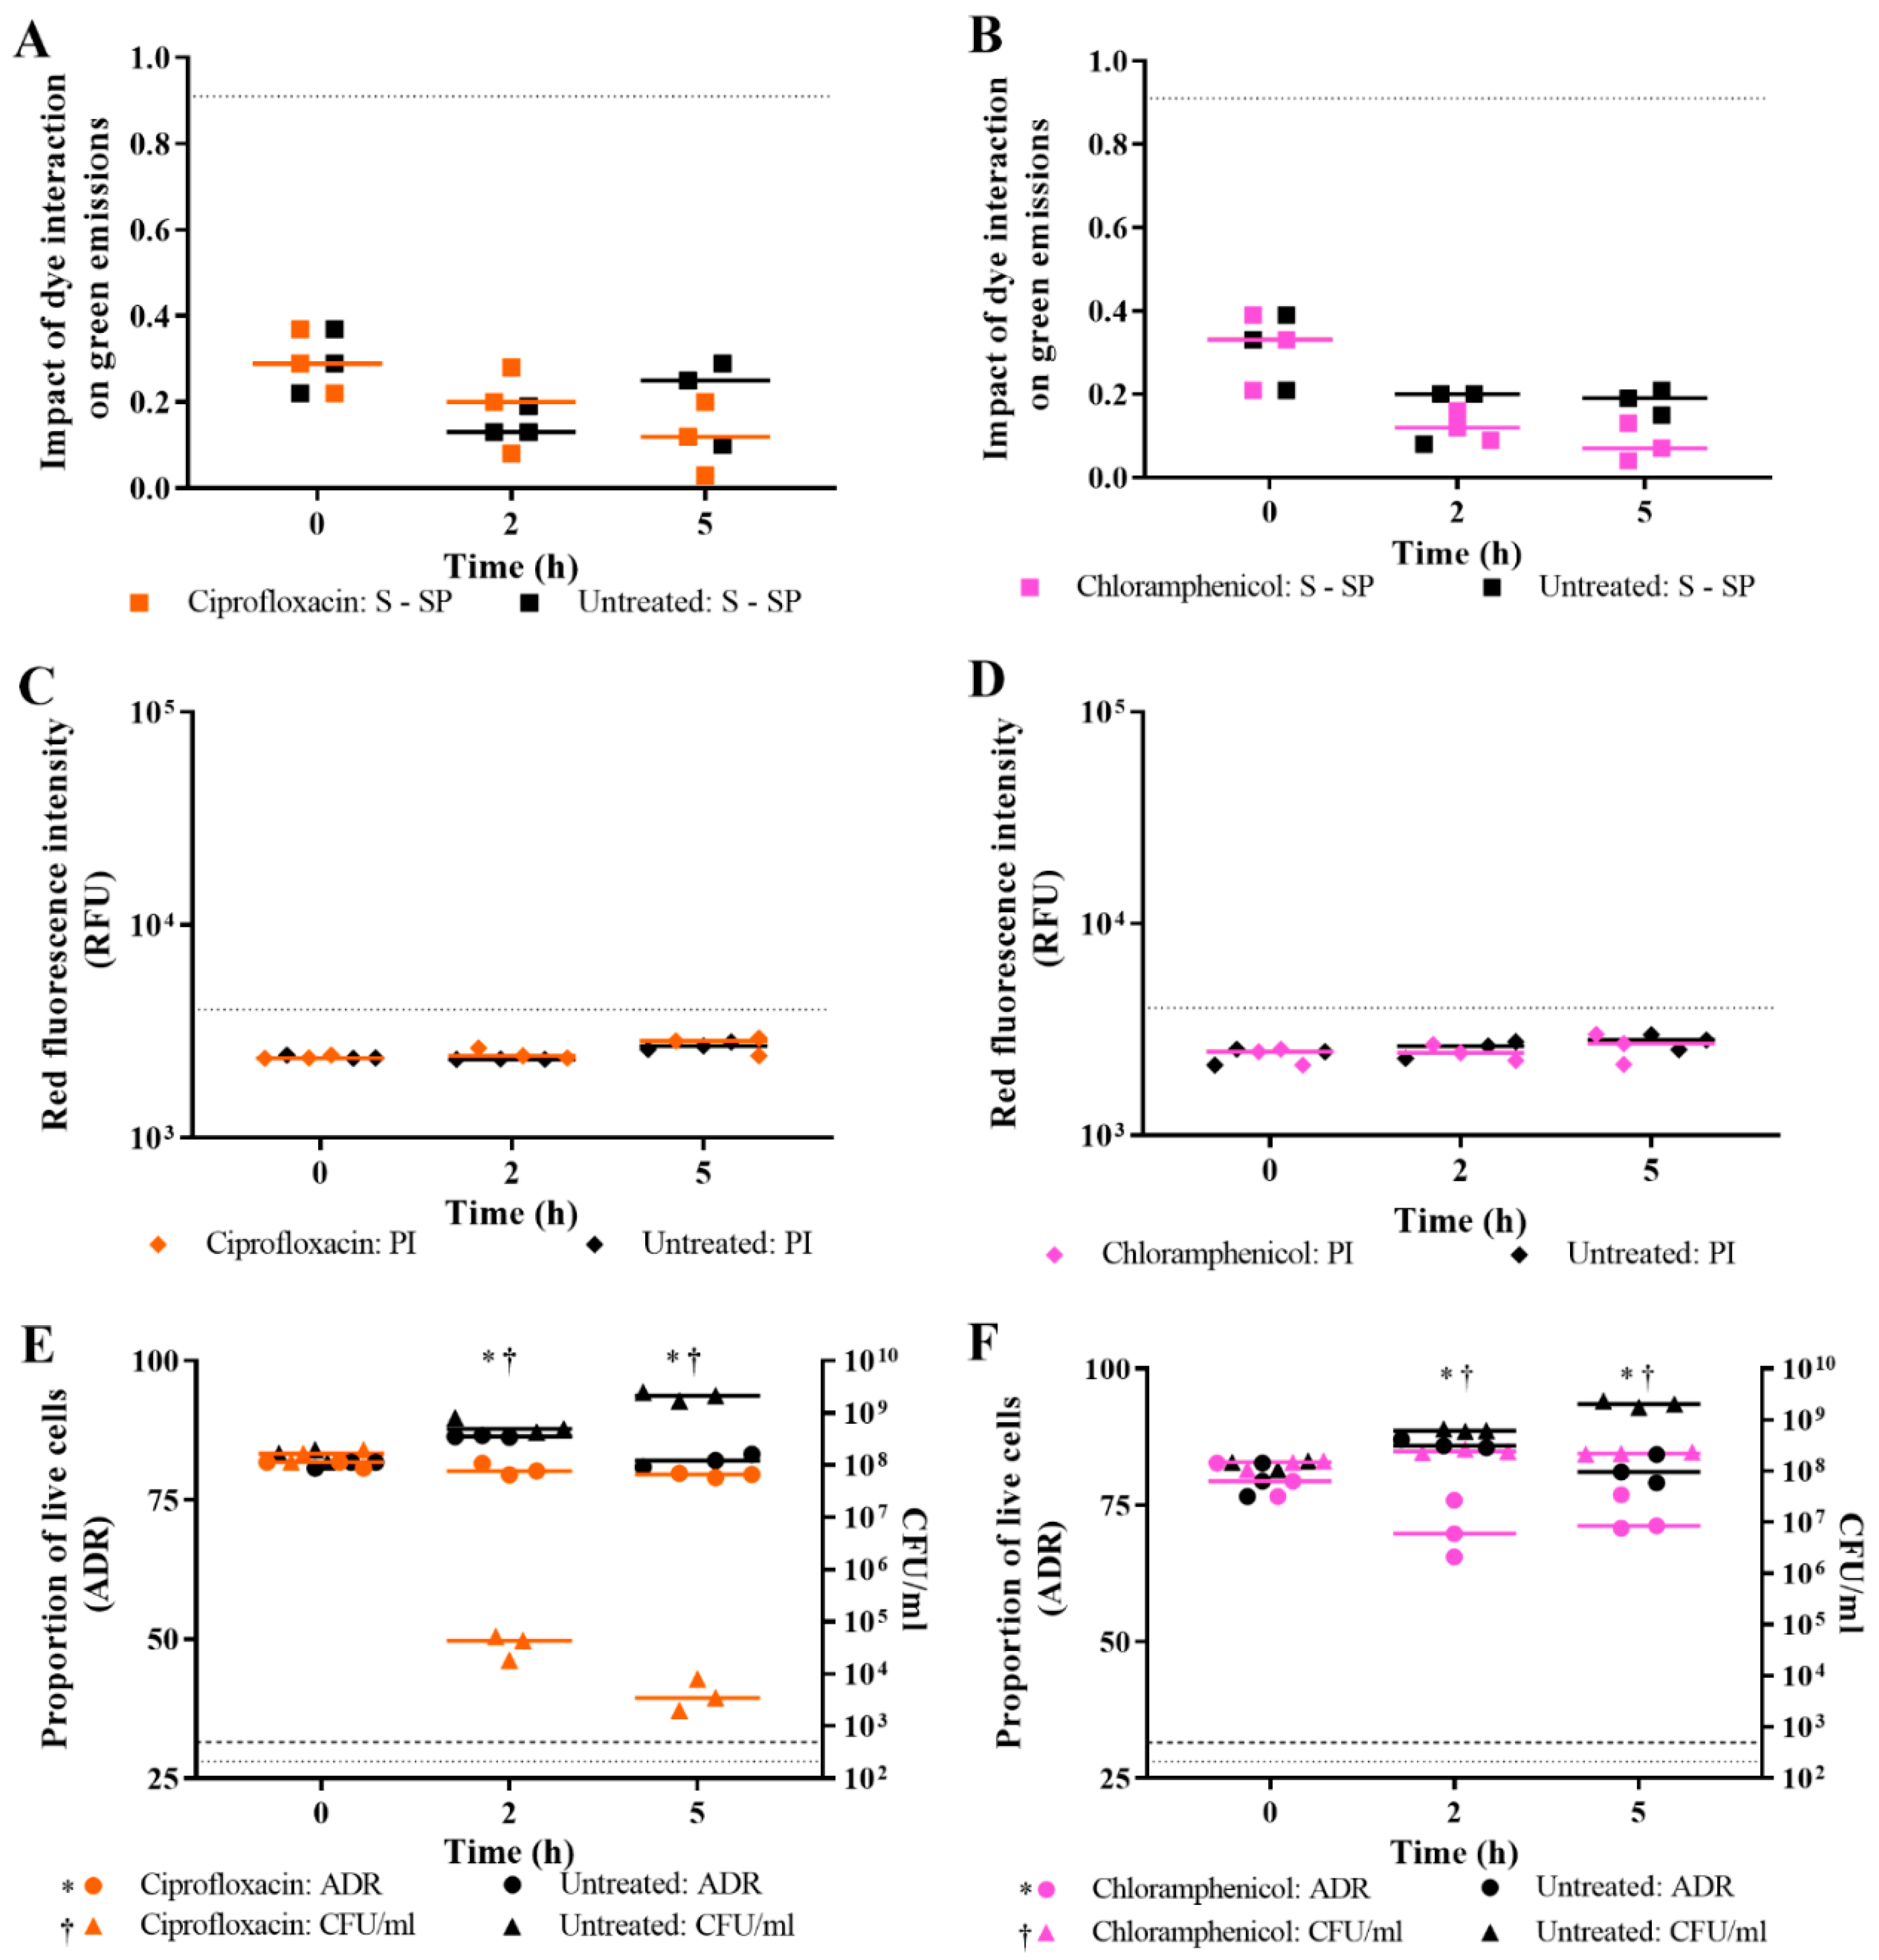
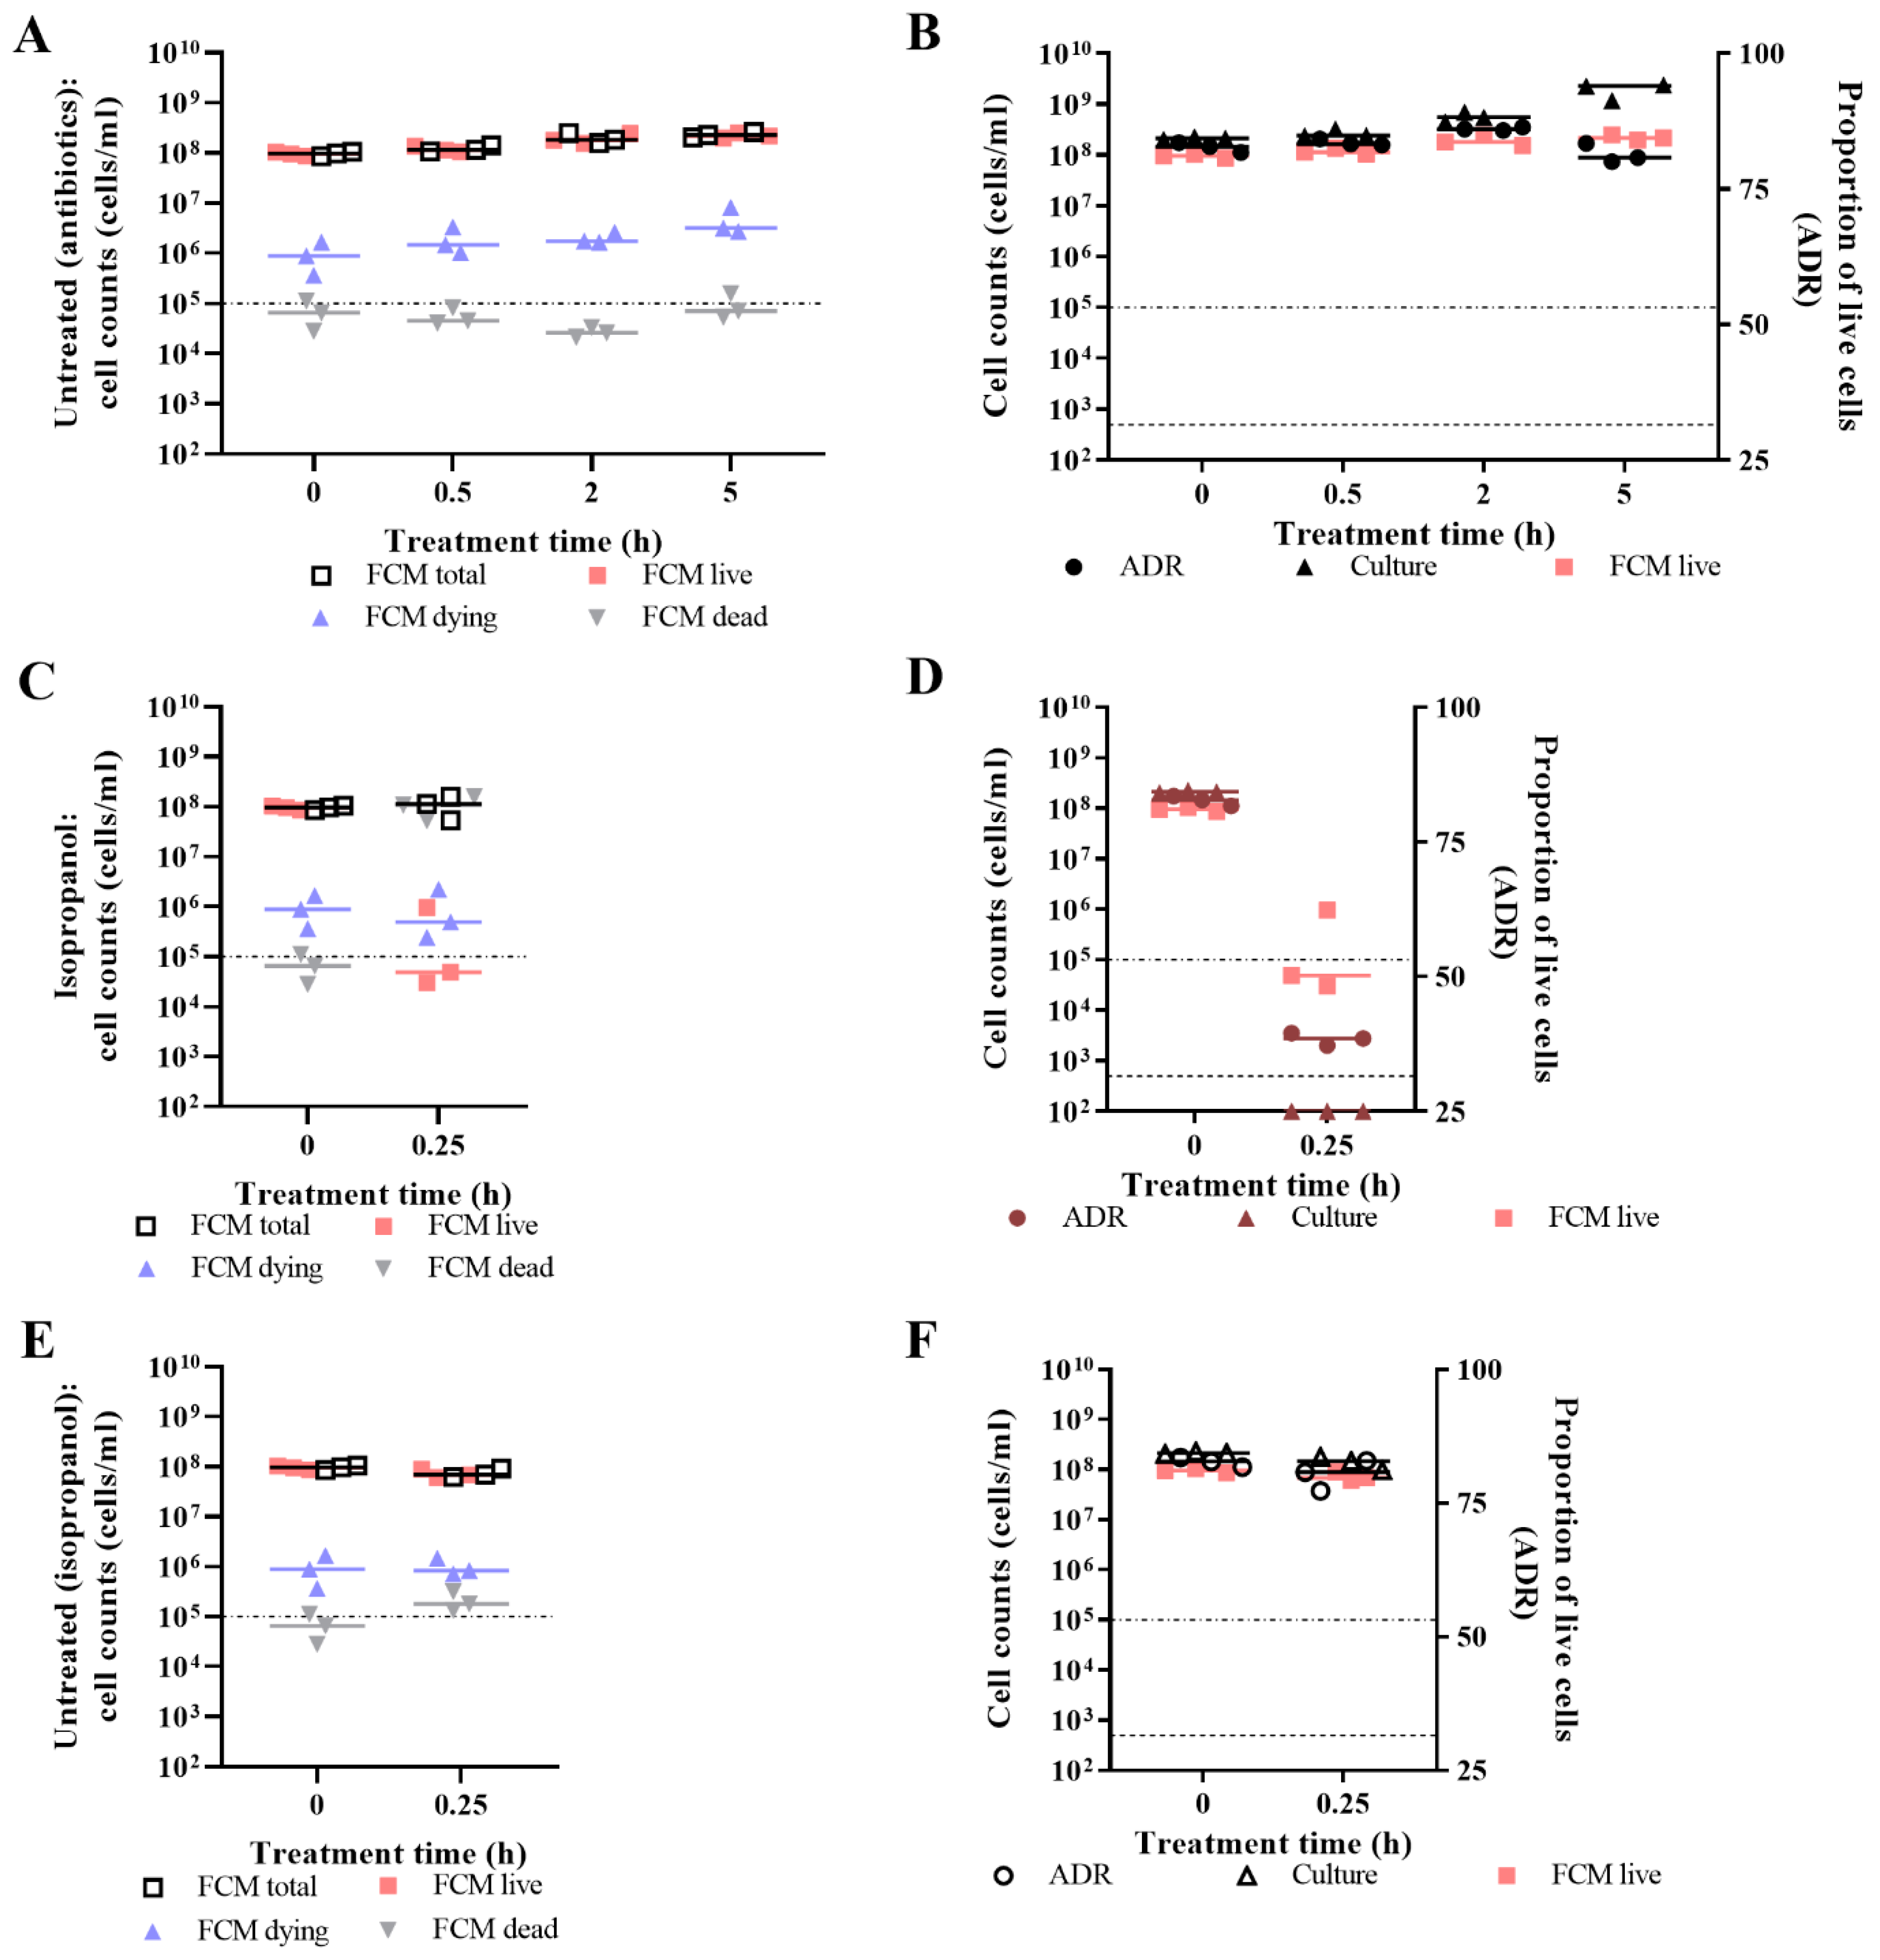
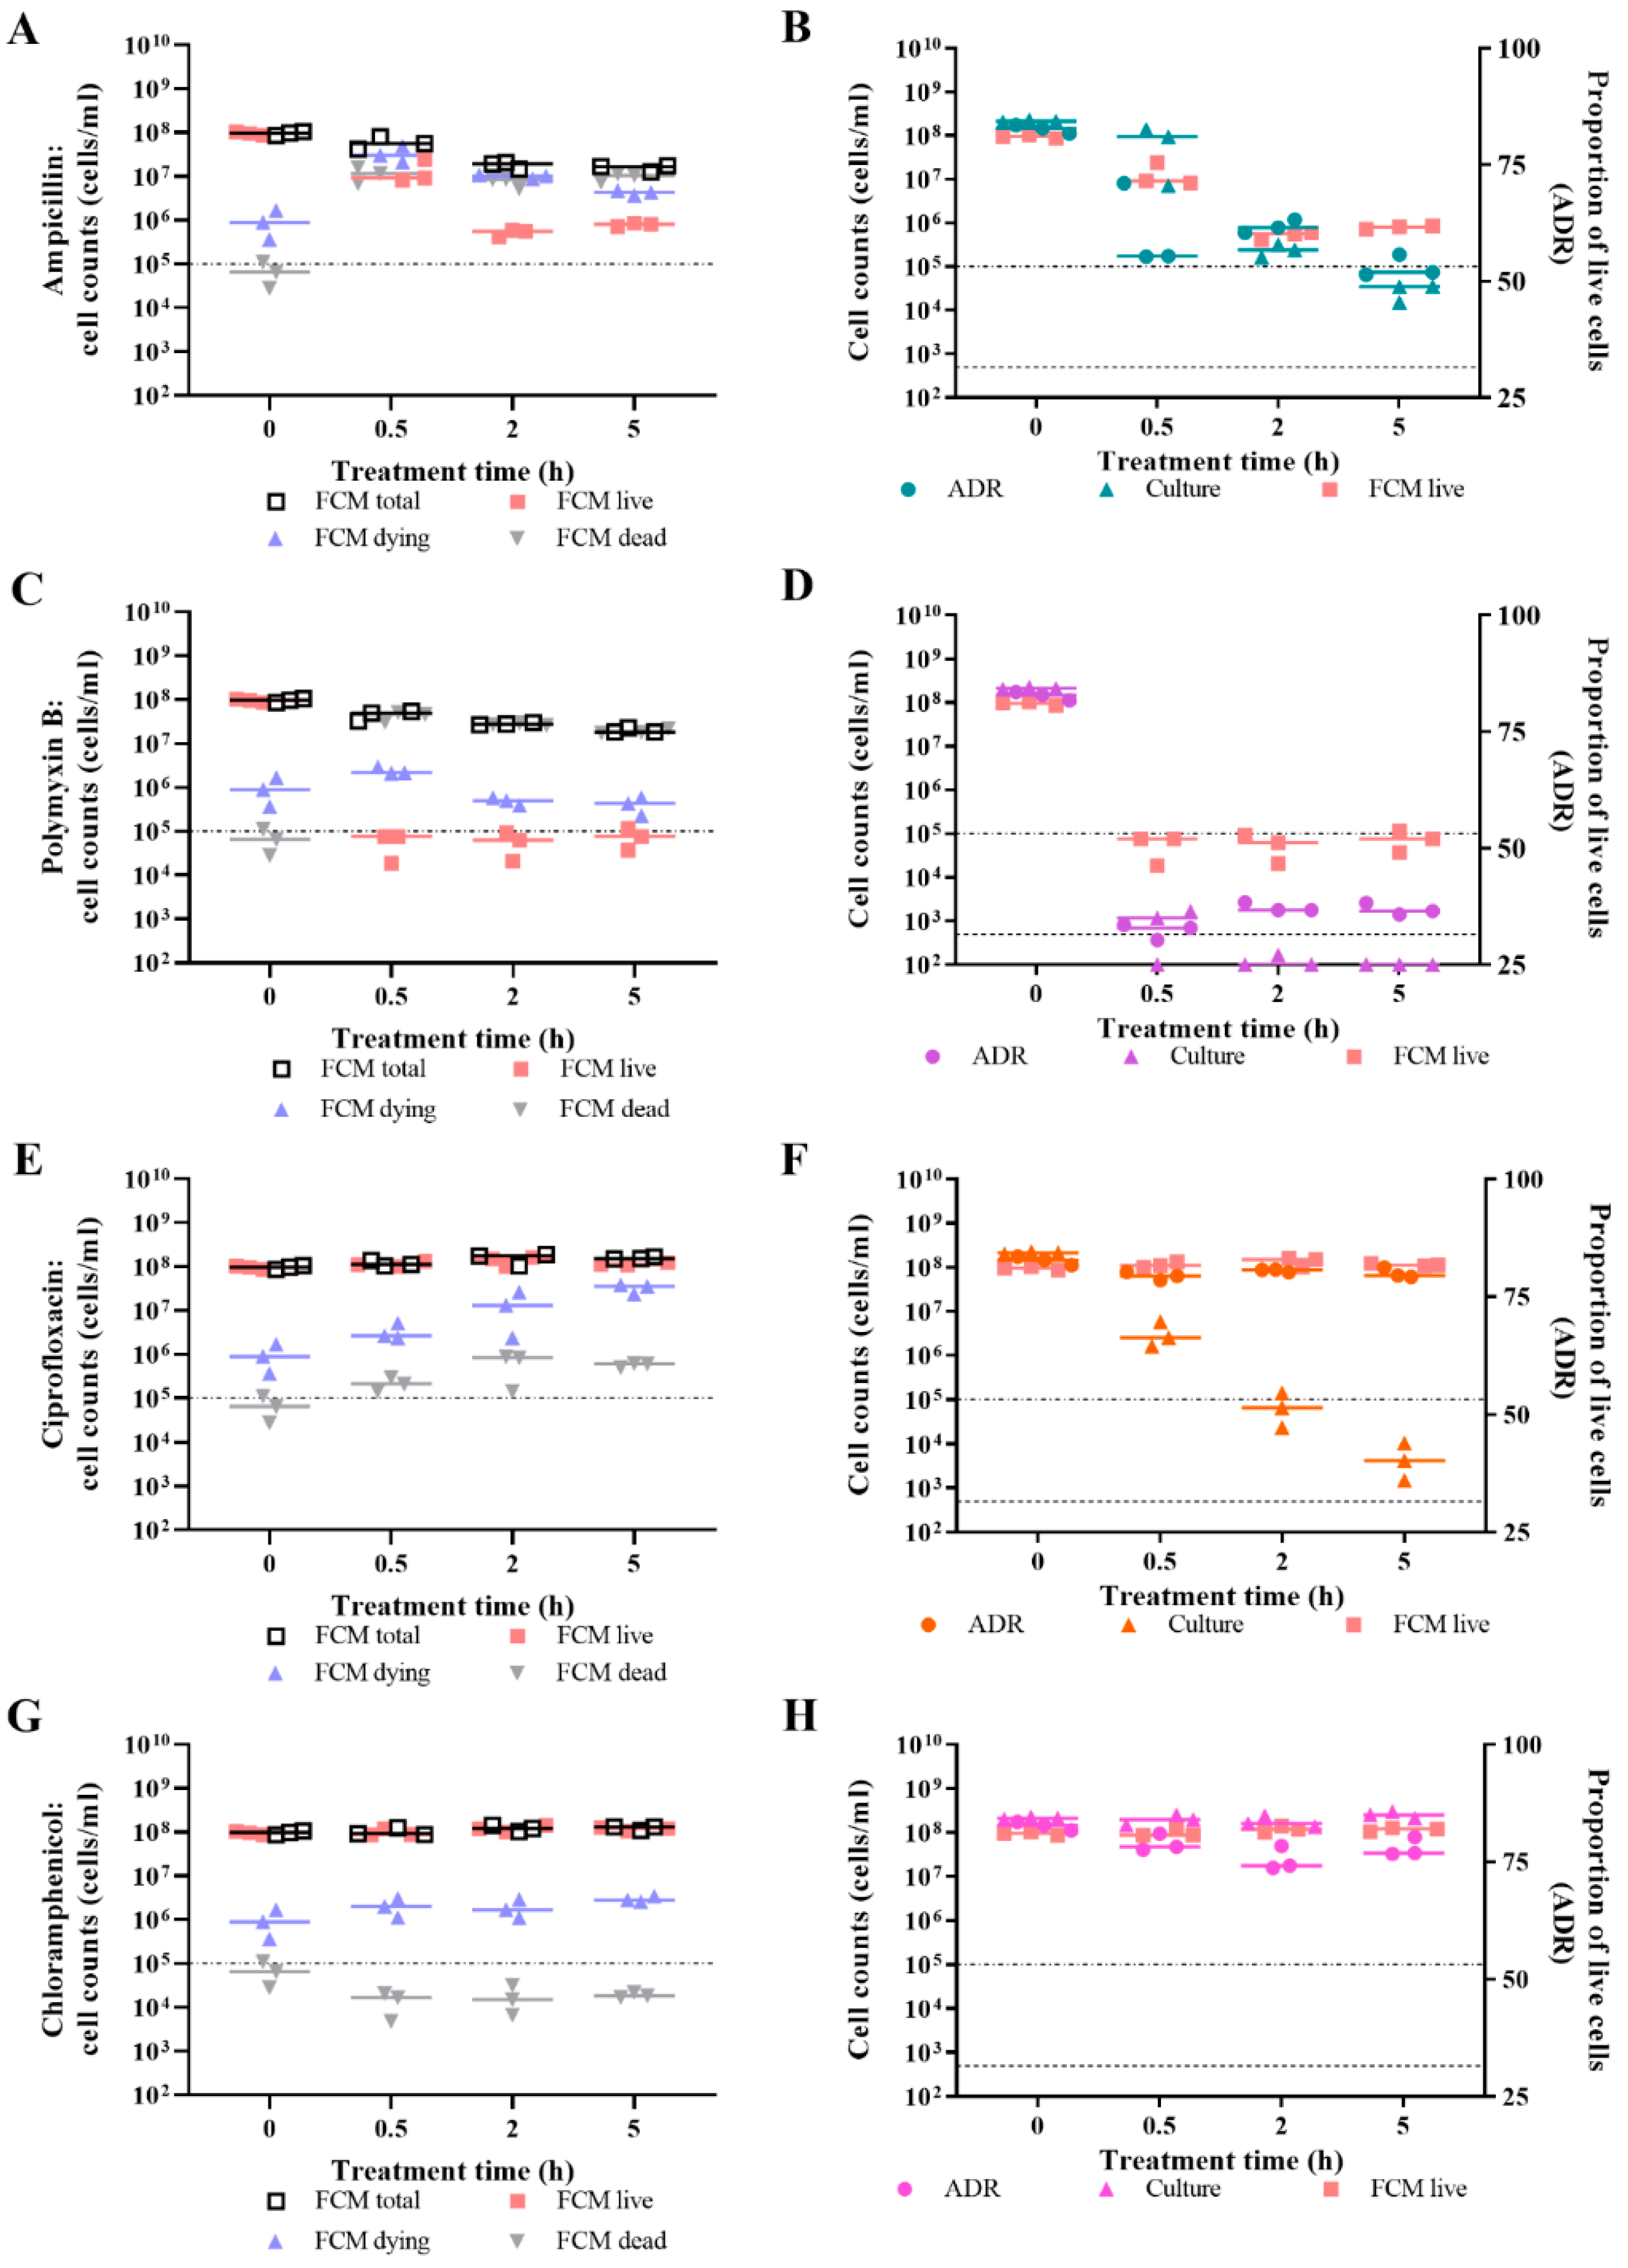
3.2. Live/Dead Spectrometry for Viability Determination of Unwashed Samples of Antibiotic-Challenged E. coli
3.3. Validation of Live/Dead Spectrometry for Viability Determination of Unwashed Samples of Antibiotic-Challenged E. coli
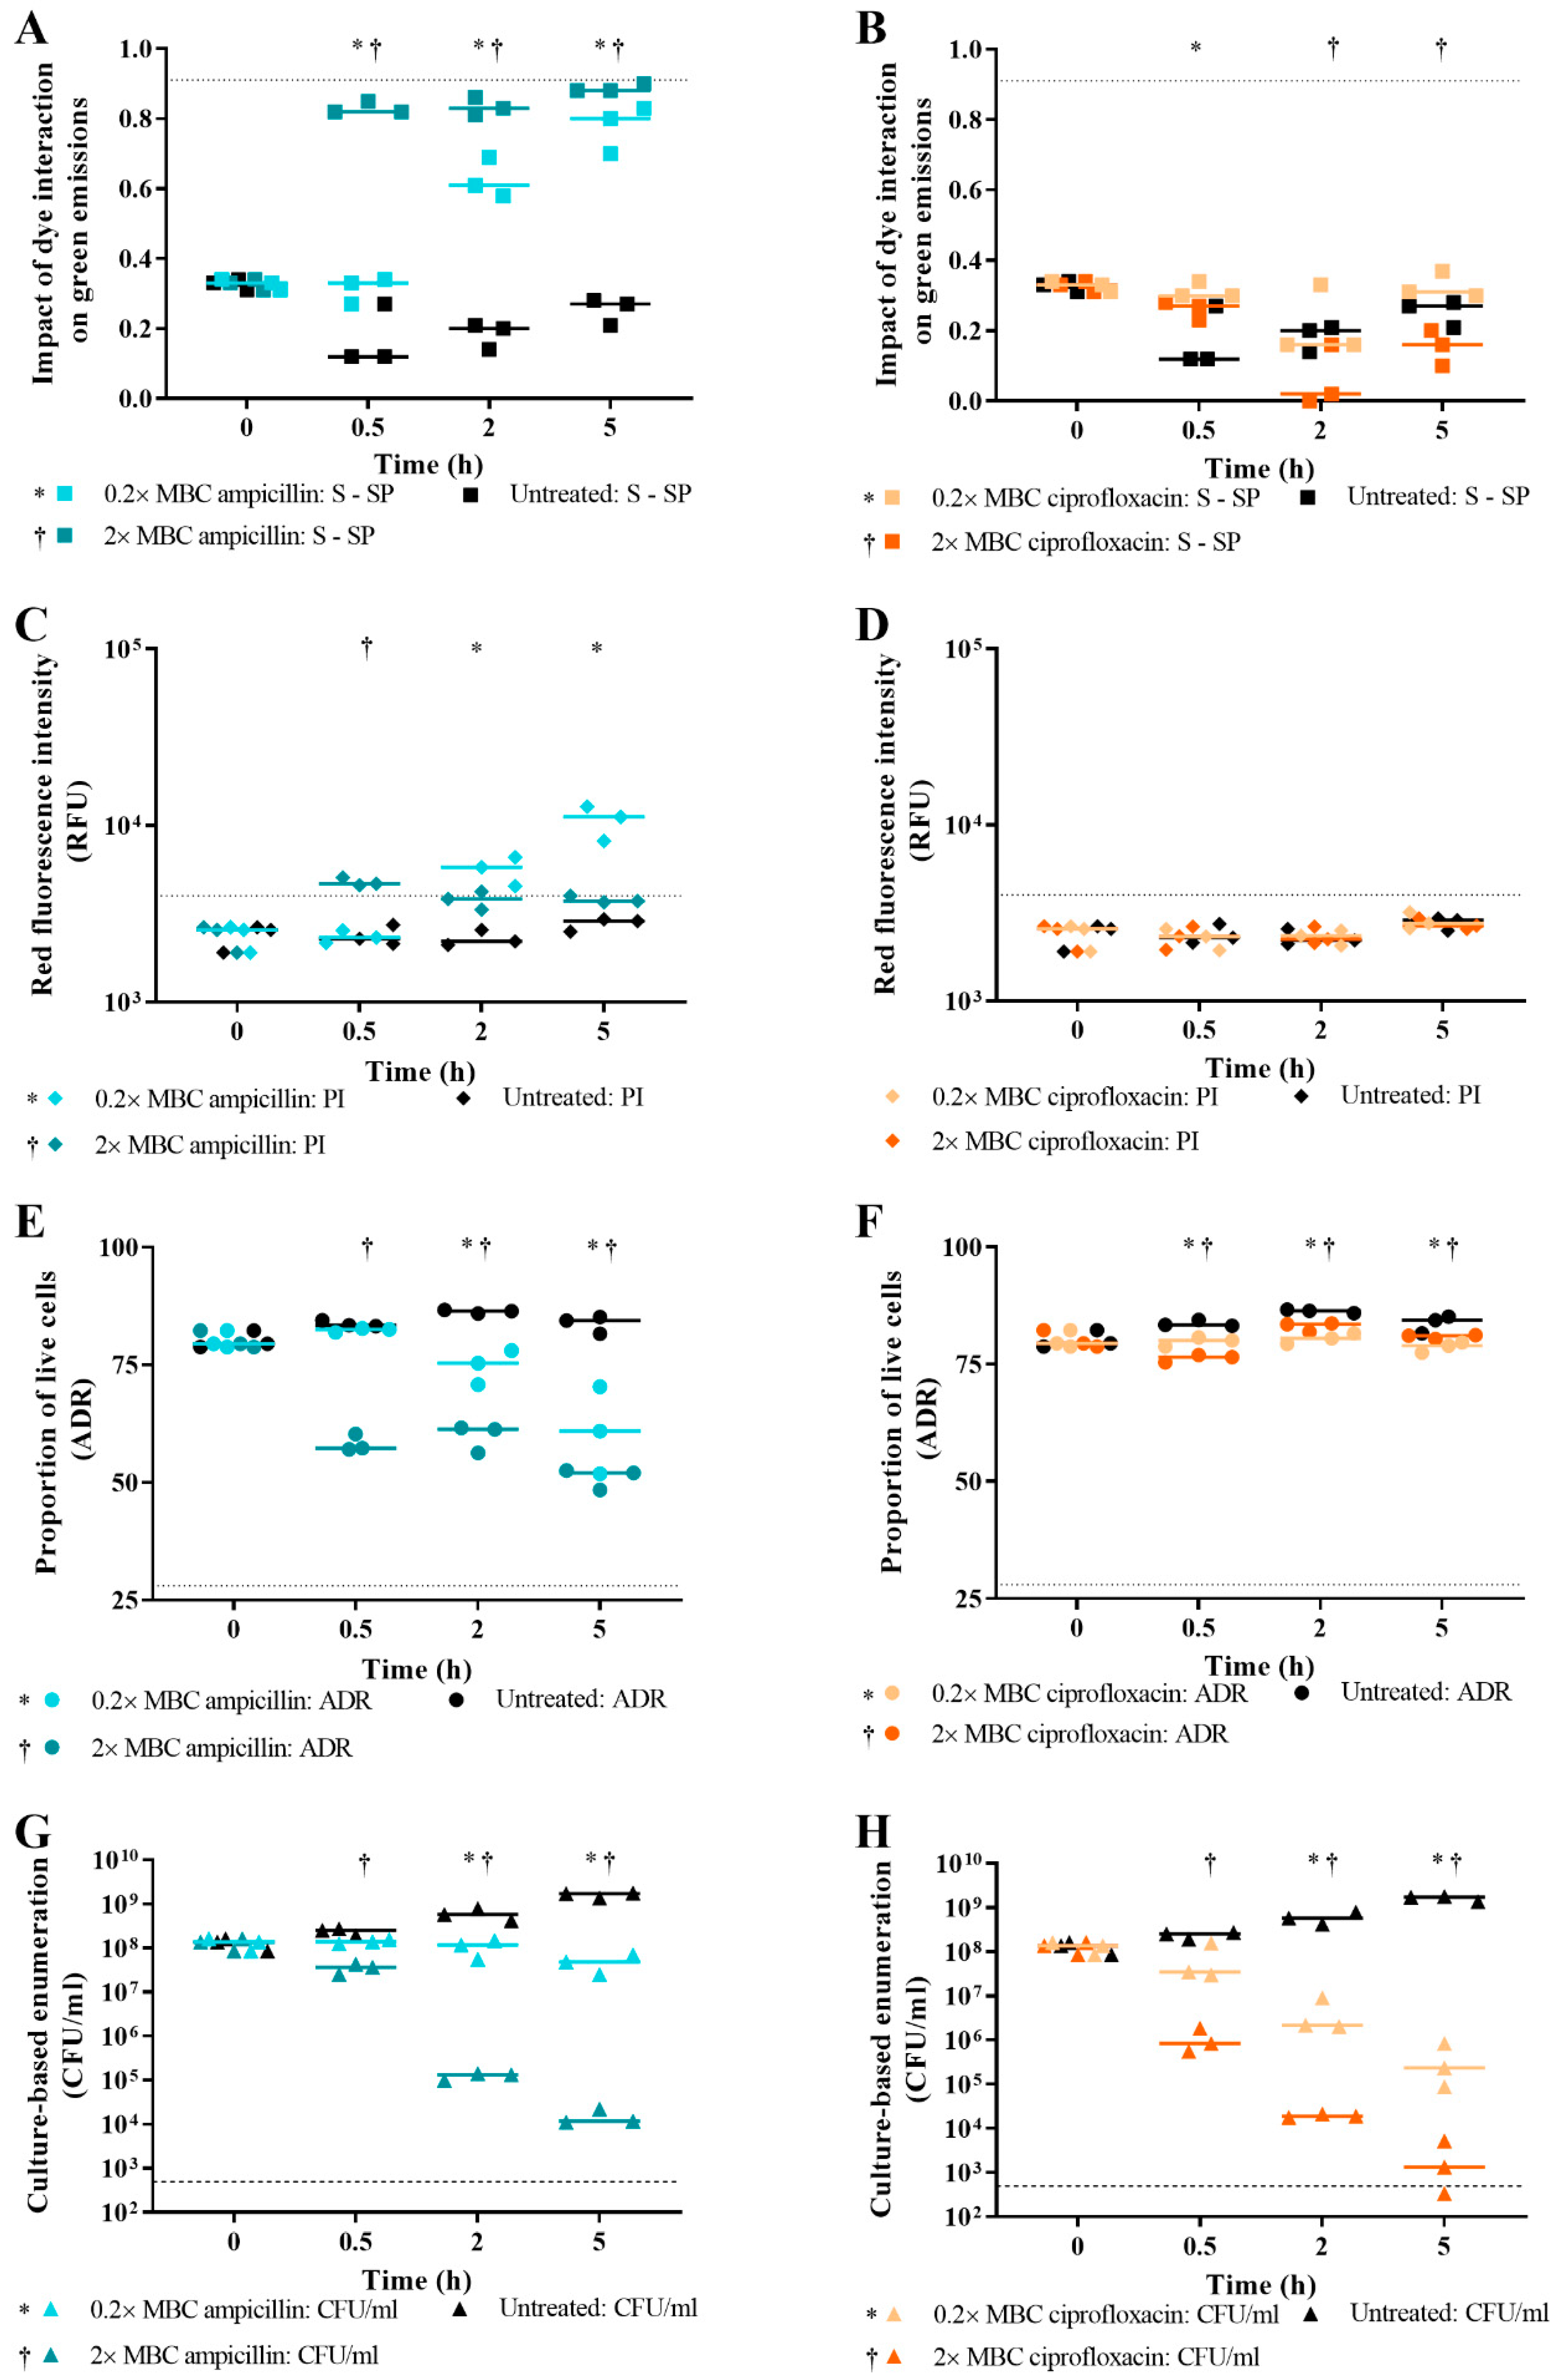
3.4. Effect of Antibiotic Concentration on Live/Dead Spectrometry of Challenged E. coli
3.5. Effect of Bacterial Growth Phase on Live/Dead Spectrometry of E. coli
4. Discussion
5. Conclusions
Supplementary Materials
Author Contributions
Funding
Conflicts of Interest
References
- Van Belkum, A.; Bachmann, T.T.; Lüdke, G.; Lisby, J.G.; Kahlmeter, G.; Mohess, A.; Becker, K.; Hays, J.P.; Woodford, N.; Mitsakakis, K.; et al. Developmental roadmap for antimicrobial susceptibility testing systems. Nat. Rev. Microbiol. 2019, 17, 51–62. [Google Scholar] [CrossRef] [PubMed] [Green Version]
- Andrews, J.M. Determination of minimum inhibitory concentrations. J. Antimicrob. Chemother. 2001, 48 (Suppl. 1), 5–16. [Google Scholar] [CrossRef] [PubMed] [Green Version]
- Wiegand, I.; Hilpert, K.; Hancock, R.E. Agar and broth dilution methods to determine the minimal inhibitory concentration (MIC) of antimicrobial substances. Nat. Protoc. 2008, 3, 163–175. [Google Scholar] [CrossRef]
- Balaban, N.Q.; Helaine, S.; Lewis, K.; Ackermann, M.; Aldridge, B.; Andersson, D.I.; Brynildsen, M.P.; Bumann, D.; Camilli, A.; Collins, J.J.; et al. Definitions and guidelines for research on antibiotic persistence. Nat. Rev. Genet. 2019, 17, 441–448. [Google Scholar] [CrossRef] [PubMed] [Green Version]
- WHO. Antimicrobial Resistance: Global Report on Surveillance; WHO: Geneva, Switzerland, 2014. [Google Scholar]
- WHO. Critically Important Antimicrobials for Human Medicine—5th Rev; WHO: Geneva, Switzerland, 2017. [Google Scholar]
- Marimuthu, S.; Wolf, L.A.; Summersgill, J.T. Real-Time PCR Detection of Mycoplasma pneumoniae, Chlamydia pneumoniae and Legionella pneumophila in Respiratory Specimens Using the ARIES® System. J. Respir. Infect. 2018, 2, 2–5. [Google Scholar] [CrossRef] [Green Version]
- Frye, A.M.; Baker, C.A.; Rustvold, D.L.; Heath, K.A.; Hunt, J.; Leggett, J.E.; Oethinger, M. Clinical Impact of a Real-Time PCR Assay for Rapid Identification of Staphylococcal Bacteremia. J. Clin. Microbiol. 2011, 50, 127–133. [Google Scholar] [PubMed] [Green Version]
- Hou, H.W.; Bhattacharyya, R.P.; Hung, D.T.; Han, J. Direct detection and drug-resistance profiling of bacteremias using inertial microfluidics. Lab Chip 2015, 15, 2297–2307. [Google Scholar] [CrossRef]
- Singh, A.; Poshtiban, S.; Evoy, S. Recent Advances in Bacteriophage Based Biosensors for Food-Borne Pathogen Detection. Sensors 2013, 13, 1763–1786. [Google Scholar] [CrossRef] [PubMed] [Green Version]
- Maugeri, G.; Lychko, I.; Sobral, R.; Roque, A.C.A. Identification and Antibiotic-Susceptibility Profiling of Infectious Bacterial Agents: A Review of Current and Future Trends. Biotechnol. J. 2019, 14, e1700750. [Google Scholar] [CrossRef] [PubMed]
- Wang, R.L.; Wang, H.W.; Li, Y. Selection of aptamers against pathogenic bacteria and their diagnostics application. World J. Microbiol. Biotechnol. 2018, 34, 1–11. [Google Scholar] [CrossRef] [PubMed]
- Majdinasab, M.; Hayat, A.; Marty, J.L. Aptamer-based assays and aptasensors for detection of pathogenic bacteria in food samples. TrAC Trends Anal. Chem. 2018, 107, 60–77. [Google Scholar] [CrossRef]
- Hrabák, J.; Chudáčková, E.; Walková, R. Matrix-assisted laser desorption ionization-time of flight (MALDITOF) mass spectrometry for detection of antibiotic resistance mechanisms: From research to routine diagnosis. Clin. Microbiol. Rev. 2013, 26, 103–114. [Google Scholar] [CrossRef] [Green Version]
- Kostrzewa, M.; Sparbier, K.; Maier, T.; Schubert, S. MALDI-TOF MS: An upcoming tool for rapid detection of antibiotic resistance in microorganisms. Proteom. Clin. Appl. 2013, 7, 767–778. [Google Scholar] [CrossRef] [PubMed]
- Ratiu, I.A.; Plugaru, V.R.; Pomastowski, P.; Milanowski, M.; Mametov, R.; Bocos-Bintintan, V.; Buszewski, B. Temporal influence of different antibiotics onto the inhibition of Escherichia coli bacterium grown in different media. Anal. Biochem. 2019, 585, 113407. [Google Scholar] [CrossRef] [PubMed]
- Feng, J.; Wang, T.; Zhang, S.; Shi, W.; Zhang, Y. An Optimized SYBR Green I/PI Assay for Rapid Viability Assessment and Antibiotic Susceptibility Testing for Borrelia burgdorferi. PLoS ONE 2014, 9, e111809. [Google Scholar] [CrossRef]
- Kaushik, A.M.; Hsieh, K.; Chen, L.; Shin, D.J.; Liao, J.C.; Wang, T.-H. Accelerating bacterial growth detection and antimicrobial susceptibility assessment in integrated picoliter droplet platform. Biosens. Bioelectron. 2017, 97, 260–266. [Google Scholar] [CrossRef] [PubMed]
- Chung, C.-Y.; Wang, J.-C.; Chuang, H.-S. Simultaneous and quantitative monitoring of co-cultured Pseudomonas aeruginosa and Staphylococcus aureus with antibiotics on a diffusometric platform. Sci. Rep. 2017, 7, 46336. [Google Scholar] [CrossRef] [PubMed] [Green Version]
- Mohan, R.; Mukherjee, A.; Sevgen, S.E.; Sanpitakseree, C.; Lee, J.; Schroeder, C.M.; Kenis, P.J. A multiplexed microfluidic platform for rapid antibiotic susceptibility testing. Biosens. Bioelectron. 2013, 49, 118–125. [Google Scholar] [CrossRef]
- Syal, K.; Mo, M.; Yu, H.; Iriya, R.; Jing, W.; Guodong, S.; Wang, S.; Grys, T.E.; Haydel, S.E.; Tao, N. Current and emerging techniques for antibiotic susceptibility tests. Theranostics 2017, 7, 1795–1805. [Google Scholar] [CrossRef]
- Leonard, H.; Halachmi, S.; Ben-Dov, N.; Nativ, O.; Segal, E. Unraveling Antimicrobial Susceptibility of Bacterial Networks on Micropillar Architectures Using Intrinsic Phase-Shift Spectroscopy. ACS Nano 2017, 11, 6167–6177. [Google Scholar] [CrossRef]
- Fratamico, P.M.; Strobaugh, T.P.; Medina, M.B.; Gehring, A.G. Detection of Escherichia coli O157:H7 using a surface plasmon resonance biosensor. Biotechnol. Tech. 2002, 12, 571–576. [Google Scholar] [CrossRef]
- Behera, B.; Vishnu, G.A.; Chatterjee, S.; Sreekumar V, V.S.N.; Nagabhushan, A.; Rajendran, N.; Prathik, B.; Pandya, H.J. Emerging technologies for antibiotic susceptibility testing. Biosens. Bioelectron. 2019, 142, 111552. [Google Scholar] [CrossRef] [PubMed]
- Waswa, J.; Debroy, C.; Irudayaraj, J. Rapid Detection of Salmonella enteritidis and Escherichia coli Using Surface Plasmon Resonance Biosensor. J. Food Process. Eng. 2006, 29, 373–385. [Google Scholar] [CrossRef]
- Müller, S.; Bley, T. High Resolution Microbial Single Cell Analytics; Springer: Berlin/Heidelberg, Germany, 2011; Volume 124. [Google Scholar]
- Ambriz-Aviña, V.; Contreras-Garduño, J.A.; Pedraza-Reyes, M. Applications of Flow Cytometry to Characterize Bacterial Physiological Responses. BioMed Res. Int. 2014, 2014, 1–14. [Google Scholar] [CrossRef] [PubMed]
- Kramer, B.; Thielmann, J. Monitoring the live to dead transition of bacteria during thermal stress by a multi-method approach. J. Microbiol. Methods 2016, 123, 24–30. [Google Scholar] [CrossRef] [PubMed]
- Hammes, F.; Berney, M.; Egli, T. Cultivation-independent Assessment of Bacterial Viability. Educ. Technol. Soc. 2010, 20, 123–150. [Google Scholar]
- Sträuber, H.; Müller, S. Viability states of bacteria-Specific mechanisms of selected probes. Cytom. Part A 2010, 77, 623–634. [Google Scholar] [CrossRef] [PubMed]
- Kramer, B.; Muranyi, P. Effect of pulsed light on structural and physiological properties of Listeria innocua and Escherichia coli. J. Appl. Microbiol. 2014, 116, 596–611. [Google Scholar] [CrossRef] [PubMed]
- Díaz, M.; Herrero, M.; García, L.A.; Quirós, C. Application of flow cytometry to industrial microbial bioprocesses. Biochem. Eng. J. 2010, 48, 385–407. [Google Scholar] [CrossRef]
- Caron, G.N.-V.; Stephens, A.W. Badley Assessment of bacterial viability status by flow cytometry and single cell sorting. J. Appl. Microbiol. 1998, 84, 988–998. [Google Scholar] [CrossRef]
- Invitrogen. LIVE/DEAD® BacLight Bacterial Viability Kits; Invitrogen: Carlsbad, CA, USA, 2004. [Google Scholar]
- Stiefel, P.; Schmidt-Emrich, S.; Maniura-Weber, K.; Ren, Q. Critical aspects of using bacterial cell viability assays with the fluorophores SYTO9 and propidium iodide. BMC Microbiol. 2015, 15, 36. [Google Scholar] [CrossRef] [PubMed] [Green Version]
- Freire, J.M.; Gaspar, D.; de la Torre, B.G.; Veiga, A.S.; Andreu, D.; Castanho, M.A. Monitoring antibacterial permeabilization in real time using time-resolved flow cytometry. Biochim. Biophys. Acta Biomembr. 2015, 1848, 554–560. [Google Scholar] [CrossRef] [Green Version]
- Berney, M.; Hammes, F.; Bosshard, F.; Weilenmann, H.-U.; Egli, T. Assessment and Interpretation of Bacterial Viability by Using the LIVE/DEAD BacLight Kit in Combination with Flow Cytometry. Appl. Environ. Microbiol. 2007, 73, 3283–3290. [Google Scholar] [CrossRef] [PubMed] [Green Version]
- Rosenberg, M.; Azevedo, N.F.; Ivask, A. Propidium iodide staining underestimates viability of adherent bacterial cells. Sci. Rep. 2019, 9, 6483. [Google Scholar] [CrossRef] [Green Version]
- Park, S.Y.; Kim, C.G. A comparative study of three different viability tests for chemically or thermally inactivated Escherichia coli. Environ. Eng. Res. 2018, 23, 282–287. [Google Scholar] [CrossRef] [Green Version]
- Hoerr, V.; Ziebuhr, W.; Kozitskaya, S.; Katzowitsch, E.; Holzgrabe, U. Laser-induced fluorescence-capillary electrophoresis and fluorescence microplate reader measurement: Two methods to quantify the effect of antibiotics. Anal. Chem. 2007, 79, 7510–7518. [Google Scholar] [CrossRef] [PubMed]
- ohnson, T.J.; Hildreth, M.B.; Gu, L.; Zhou, R.; Gibbons, W.R. Testing a dual-fluorescence assay to monitor the viability of filamentous cyanobacteria. J. Microbiol. Methods 2015, 113, 57–64. [Google Scholar] [CrossRef] [PubMed]
- Robertson, J.; McGoverin, C.; Vanholsbeeck, F.; Swift, S. Optimisation of the protocol for the LIVE/DEAD BacLight Bacterial Viability Kit for rapid determination of bacterial load. Front. Microbiol. 2019, 10, 801. [Google Scholar] [CrossRef] [PubMed] [Green Version]
- Ou, F.; McGoverin, C.; Swift, S.; Vanholsbeeck, F. Absolute bacterial cell enumeration using flow cytometry. J. Appl. Microbiol. 2017, 123, 464–477. [Google Scholar] [CrossRef] [Green Version]
- Elbing, K.; Brent, R. Media Preparation and Bacteriological Tools. Curr. Protoc. Mol. Biol. 2002, 59, 1–7. [Google Scholar] [CrossRef]
- Tawakoli, P.N.; Al-Ahmad, A.; Hoth-Hannig, W.; Hannig, M.; Hannig, C. Comparison of different live/dead stainings for detection and quantification of adherent microorganisms in the initial oral biofilm. Clin. Oral Investig. 2012, 17, 841–850. [Google Scholar] [CrossRef] [PubMed]
- Gao, G.; Jiang, Y.-W.; Jia, H.-R.; Wu, F.-G. Near-infrared light-controllable on-demand antibiotics release using thermo-sensitive hydrogel-based drug reservoir for combating bacterial infection. Biomaterials 2019, 188, 83–95. [Google Scholar] [CrossRef] [PubMed]
- Maisuria, V.B.; Hosseinidoust, Z.; Tufenkji, N. Polyphenolic extract from maple syrup potentiates antibiotic susceptibility and reduces biofilm formation of pathogenic bacteria. Appl. Environ. Microbiol. 2015, 81, 3782–3792. [Google Scholar] [CrossRef] [PubMed] [Green Version]
- Yu, W.; Ye, B. High-level iron mitigates fusaricidin-induced membrane damage and reduces membrane fluidity leading to enhanced drug resistance in Bacillus subtilis. J. Basic Microbiol. 2015, 56, 502–509. [Google Scholar] [CrossRef] [PubMed]
- Kohanski, M.A.; Dwyer, D.J.; Collins, J.J. How antibiotics kill bacteria: From targets to networks. Nat. Rev. Genet. 2010, 8, 423–435. [Google Scholar] [CrossRef] [PubMed] [Green Version]
- Poirel, L.; Jayol, A.; Nordmann, P. Polymyxins: Antibacterial Activity, Susceptibility Testing, and Resistance Mechanisms Encoded by Plasmids or Chromosomes. Clin. Microbiol. Rev. 2017, 30, 557–596. [Google Scholar] [CrossRef] [PubMed] [Green Version]
- Sezonov, G.; Joseleau-Petit, D.; D’Ari, R. Escherichia coli Physiology in Luria-Bertani Broth. J. Bacteriol. 2007, 189, 8746–8749. [Google Scholar] [CrossRef] [PubMed] [Green Version]
- Ou, F.; McGoverin, C.; Swift, S.; Vanholsbeeck, F. Near real-time enumeration of live and dead bacteria using a fibre-based spectroscopic device. Sci. Rep. 2019, 9, 4807. [Google Scholar] [CrossRef]
- Ou, F.; McGoverin, C.; Swift, S.; Vanholsbeeck, F. Rapid and cost-effective evaluation of bacterial viability using fluorescence spectroscopy. Anal. Bioanal. Chem. 2019, 411, 3653–3663. [Google Scholar] [CrossRef] [Green Version]
- Ekstrøm, C.T. Package MESS; 2019. Available online: https://cran.r-project.org/package=MESS (accessed on 21 January 2021).
- Rhdf5: HDF5 Interface to R. R Package Version 2.26.2. 2019. Available online: https://github.com/grimbough/rhdf5 (accessed on 21 January 2021).
- R Foundation for Statistical Computing. A Language and Environment for Statistical Computing; R Foundation for Statistical Computing: Vienna, Austria, 2013. [Google Scholar]
- Lee, J.A.; Spidlen, J.; Boyce, K.; Cai, J.; Crosbie, N.; Dalphin, M.; Furlong, J.; Gasparetto, M.; Goldberg, M.; Goralczyk, E.M.; et al. MIFlowCyt: The minimum information about a flow cytometry experiment. Cytom. Part A 2008, 73, 926–930. [Google Scholar] [CrossRef] [Green Version]
- Nebe-Von-Caron, G.; Stephens, P.; Hewitt, C.; Powell, J.; Badley, R. Analysis of bacterial function by multi-colour fluorescence flow cytometry and single cell sorting. J. Microbiol. Methods 2000, 42, 97–114. [Google Scholar] [CrossRef]
- Léonard, L.; Chibane, L.B.; Bouhedda, B.O.; Degraeve, P.; Oulahal, N. Recent Advances on Multi-Parameter Flow Cytometry to Characterize Antimicrobial Treatments. Front. Microbiol. 2016, 7, 1225. [Google Scholar] [CrossRef] [PubMed] [Green Version]
- Tan, C.; Smith, R.P.; Srimani, J.K.; Riccione, K.A.; Prasada, S.; Kuehn, M.; You, L. The inoculum effect and band-pass bacterial response to periodic antibiotic treatment. Mol. Syst. Biol. 2012, 8, 617. [Google Scholar] [CrossRef] [PubMed]
- Shi, L.; Günther, S.; Hübschmann, T.; Wick, L.Y.; Harms, H.; Müller, S. Limits of propidium iodide as a cell viability indicator for environmental bacteria. Cytom. Part A 2007, 71, 592–598. [Google Scholar] [CrossRef] [PubMed]
- Pankey, G.A.; Sabath, L.D. Clinical Relevance of Bacteriostatic versus Bactericidal Mechanisms of Action in the Treatment of Gram-Positive Bacterial Infections. Clin. Infect. Dis. 2004, 38, 864–870. [Google Scholar] [CrossRef] [Green Version]
- Nemeth, J.; Oesch, G.; Kuster, S.P. Bacteriostatic versus bactericidal antibiotics for patients with serious bacterial infections: Systematic review and meta-analysis. J. Antimicrob. Chemother. 2015, 70, 382–395. [Google Scholar] [CrossRef] [PubMed] [Green Version]
- Wald-Dickler, N.; Holtom, P.; Spellberg, B. Busting the Myth of ‘Static vs Cidal’: A Systemic Literature Review. Clin. Infect. Dis. 2018, 66, 1470–1474. [Google Scholar] [CrossRef] [PubMed]
- Andreu, A.; Zelmer, A.; Wiles, S. Noninvasive biophotonic imaging for studies of infectious disease. FEMS Microbiol. Rev. 2011, 35, 360–394. [Google Scholar] [CrossRef] [Green Version]
- Cosa, G.; Focsaneanu, K.-S.; McLean, J.R.N.; McNamee, J.P.; Scaiano, J.C. Photophysical Properties of Fluorescent DNA-dyes Bound to Single-and Double-stranded DNA in Aqueous Buffered Solution. Photochem. Photobiol. 2001, 73, 585. [Google Scholar] [CrossRef]
- Stocks, S.M. Mechanism and use of the commercially available viability stain, BacLight. Cytom. Part A 2003, 61, 189–195. [Google Scholar] [CrossRef]
- Tárnok, A. SYTO dyes and histoproteins—Myriad of applications. Cytom. Part A 2008, 73, 477–479. [Google Scholar] [CrossRef] [PubMed]
- West, A.M.; Teska, P.J.; Lineback, C.B.; Oliver, H.F. Strain, disinfectant, concentration, and contact time quantitatively impact disinfectant efficacy. Antimicrob. Resist. Infect. Control 2018, 7, 1–8. [Google Scholar] [CrossRef] [PubMed]
- Humphries, R.M.; Ambler, J.; Mitchell, S.L.; Castanheira, M.; Dingle, T.; Hindler, J.A.; Koeth, L.; Sei, K.; Hardy, D.; Zimmer, B.; et al. CLSI Methods Development and Standardization Working Group Best Practices for Evaluation of Antimicrobial Susceptibility Tests. J. Clin. Microbiol. 2018, 56, 1–10. [Google Scholar] [CrossRef] [PubMed] [Green Version]
- Caglar, M.U.; Houser, J.R.; Barnhart, C.S.; Boutz, D.R.; Carroll, S.M.; Dasgupta, A.; Lenoir, W.F.; Smith, B.L.; Sridhara, V.; Sydykova, D.K.; et al. The E. coli molecular phenotype under different growth conditions. Sci. Rep. 2017, 7, 45303. [Google Scholar] [CrossRef] [PubMed] [Green Version]
- Soufi, B.; Krug, K.; Harst, A.; Macek, B. Characterization of the E. coli proteome and its modifications during growth and ethanol stres. Front. Microbiol. 2015, 6, 103. [Google Scholar] [CrossRef] [PubMed]
- Sparbier, K.; Schubert, S.; Kostrzewa, M. MBT-ASTRA: A suitable tool for fast antibiotic susceptibility testing? Methods 2016, 104, 48–54. [Google Scholar] [CrossRef] [PubMed]
- Wickens, H.J.; Pinney, R.J.; Mason, D.J.; Gant, V.A. Flow Cytometric Investigation of Filamentation, Membrane Patency, and Membrane Potential in Escherichia coli following Ciprofloxacin Exposure. Antimicrob. Agents Chemother. 2000, 44, 682–687. [Google Scholar] [CrossRef] [PubMed] [Green Version]
- Mason, D.J.; Power, E.G.; Talsania, H.; Phillips, I.; Gant, V.A. Antibacterial action of ciprofloxacin. Antimicrob. Agents Chemother. 1995, 39, 2752–2758. [Google Scholar] [CrossRef] [Green Version]
- López, E.; Elez, M.; Matic, I.; Blázquez, J. Antibiotic-mediated recombination: Ciprofloxacin stimulates SOS-independent recombination of divergent sequences in Escherichia coli. Mol. Microbiol. 2007, 64, 83–93. [Google Scholar] [CrossRef]
- O’Neill, A.J.; Miller, K.; Oliva, B.; Chopra, I. Comparison of assays for detection of agents causing membrane damage in Staphylococcus aureus. J. Antimicrob. Chemother. 2004, 54, 1127–1129. [Google Scholar] [CrossRef]
- Novo, D.J.; Perlmutter, N.G.; Hunt, R.H.; Shapiro, H.M. Multiparameter flow cytometric analysis of antibiotic effects on membrane potential, membrane permeability, and bacterial counts of Staphylococcus aureus and Micrococcus luteus. Antimicrob. Agents Chemother. 2000, 44, 827–834. [Google Scholar] [CrossRef] [PubMed] [Green Version]
- Van Helvoort, J.; Kool, J.; Woldringh, C. Chloramphenicol causes fusion of separated nucleoids in Escherichia coli K-12 cells and filaments. J. Bacteriol. 1996, 178, 4289–4293. [Google Scholar] [CrossRef] [Green Version]
- Fishov, I.; Woldringh, C.L. Visualization of membrane domains in Escherichia coli. Mol. Microbiol. 1999, 32, 1166–1172. [Google Scholar] [CrossRef] [PubMed]
- Macey, M.G. Flow Cytometry: Principles and Application; Springer: Berlin/Heidelberg, Germany, 2007; Volume 1. [Google Scholar]
- Suller, M.; Lloyd, D. Fluorescence monitoring of antibiotic-induced bacterial damage using flow cytometry. Cytometry 1999, 35, 235–241. [Google Scholar] [CrossRef]
- Bridier, A.; Hammes, F.; Canette, A.; Bouchez, T.; Briandet, R. Fluorescence-based tools for single-cell approaches in food microbiology. Int. J. Food Microbiol. 2015, 213, 2–16. [Google Scholar] [CrossRef] [PubMed]
- Kim, S.; Masum, F.; Jeon, J.S. Recent Developments of Chip-based Phenotypic Antibiotic Susceptibility Testing. BioChip J. 2019, 13, 43–52. [Google Scholar] [CrossRef]
- Müller, S.; Davey, H. Recent advances in the analysis of individual microbial cells. Cytom. Part A 2009, 75, 83–85. [Google Scholar] [CrossRef] [PubMed]
- Aroonnual, A.; Janvilisri, T.; Ounjai, P. Chankhamhaengdecha, S. microfluidics: Innovative approaches for rapid diagnosis of antibiotic-resistant bacteria. Essays Biochem. 2017, 61, 91–101. [Google Scholar] [PubMed]
- Han, J.-H.; Heinze, B.C.; Yoon, J.-Y. Single cell level detection of Escherichia coli in microfluidic device. Biosens. Bioelectron. 2008, 23, 1303–1306. [Google Scholar] [CrossRef] [PubMed]
- Lopes, A.L.K.; Cardoso, J.; Dos Santos, F.R.C.C.; Silva, A.C.G.; Stets, M.I.; Zanchin, N.I.T.; Soares, M.J.; Krieger, M.A. Development of a magnetic separation method to capture sepsis associated bacteria in blood. J. Microbiol. Methods 2016, 128, 96–101. [Google Scholar] [CrossRef] [PubMed]
- Leonard, H.; Colodner, R.; Halachmi, S.; Segal, E. Recent Advances in the Race to Design a Rapid Diagnostic Test for Antimicrobial Resistance. ACS Sens. 2018, 3, 2202–2217. [Google Scholar] [CrossRef] [PubMed]
- Van Belkum, A.; Welker, M.; Pincus, D.; Charrier, J.-P.; Girard, V. Matrix-Assisted Laser Desorption Ionization Time-of-Flight Mass Spectrometry in Clinical Microbiology: What Are the Current Issues? Ann. Lab. Med. 2017, 37, 475–483. [Google Scholar] [CrossRef] [PubMed]


Publisher’s Note: MDPI stays neutral with regard to jurisdictional claims in published maps and institutional affiliations. |
© 2021 by the authors. Licensee MDPI, Basel, Switzerland. This article is an open access article distributed under the terms and conditions of the Creative Commons Attribution (CC BY) license (https://creativecommons.org/licenses/by/4.0/).
Share and Cite
Robertson, J.; McGoverin, C.; White, J.R.; Vanholsbeeck, F.; Swift, S. Rapid Detection of Escherichia coli Antibiotic Susceptibility Using Live/Dead Spectrometry for Lytic Agents. Microorganisms 2021, 9, 924. https://doi.org/10.3390/microorganisms9050924
Robertson J, McGoverin C, White JR, Vanholsbeeck F, Swift S. Rapid Detection of Escherichia coli Antibiotic Susceptibility Using Live/Dead Spectrometry for Lytic Agents. Microorganisms. 2021; 9(5):924. https://doi.org/10.3390/microorganisms9050924
Chicago/Turabian StyleRobertson, Julia, Cushla McGoverin, Joni R. White, Frédérique Vanholsbeeck, and Simon Swift. 2021. "Rapid Detection of Escherichia coli Antibiotic Susceptibility Using Live/Dead Spectrometry for Lytic Agents" Microorganisms 9, no. 5: 924. https://doi.org/10.3390/microorganisms9050924