
Seed Meals from Brassica nigra and Eruca sativa Control Artificial Nosema ceranae Infections in Apis mellifera

 , ,
, ,  , , and
Abstract
:1. Introduction
2. Materials and Methods
2.1. Source of Honey Bees
2.2. Nosema ceranae Spore Extraction
2.3. Brassicaceae DSMs
2.4. Feed Formulation
2.5. Experimental Design
2.5.1. Artificial Infections and Uninfected Groups
2.5.2. Bee Treatment Feeding Trials
2.6. N. ceranae Infection Quantification: DNA Extraction and qPCR
2.7. Bee GSL Metabolism Investigation
2.7.1. Bee Treatment and Gut Extraction
2.7.2. Total ITC Gut Analysis
2.8. Calculations and Statistics
3. Results
3.1. DSM Characterization
3.2. DSM Formulation and GSL Stability in the DSM Patties
3.3. Bee Treatment Feeding Trials
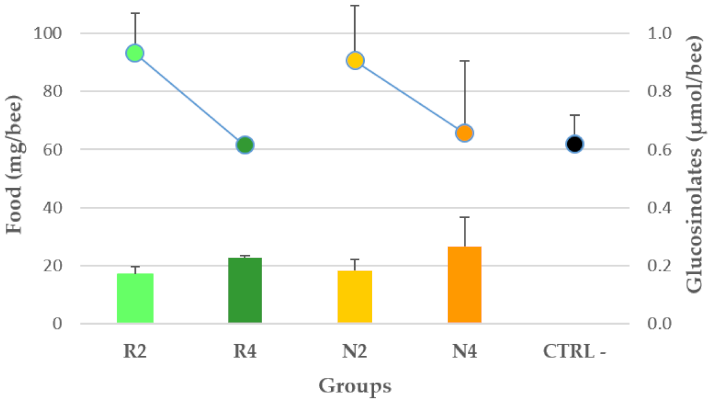
3.3.1. Palatability of DSM Patties and GSL Intake
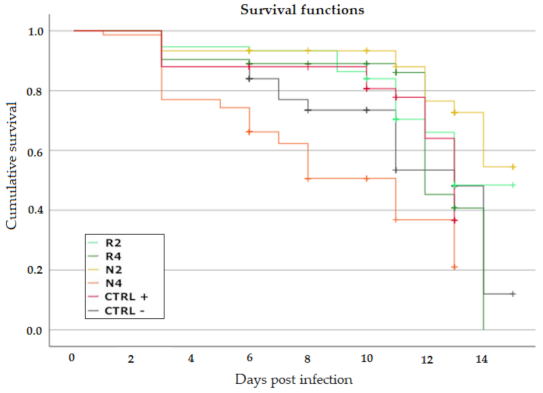
3.3.2. Effect of DSM Patties on Bee Survival
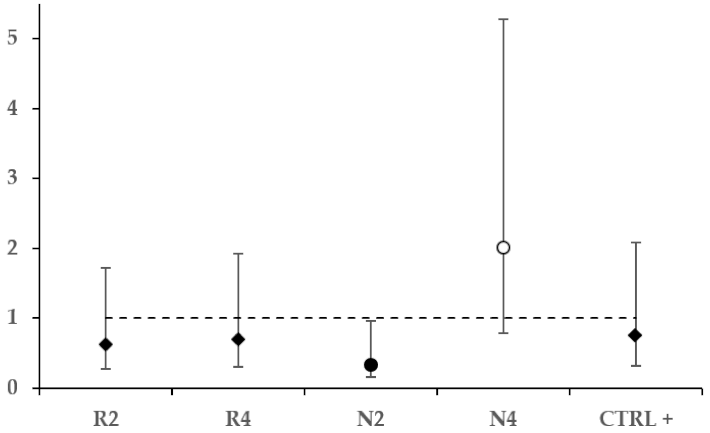
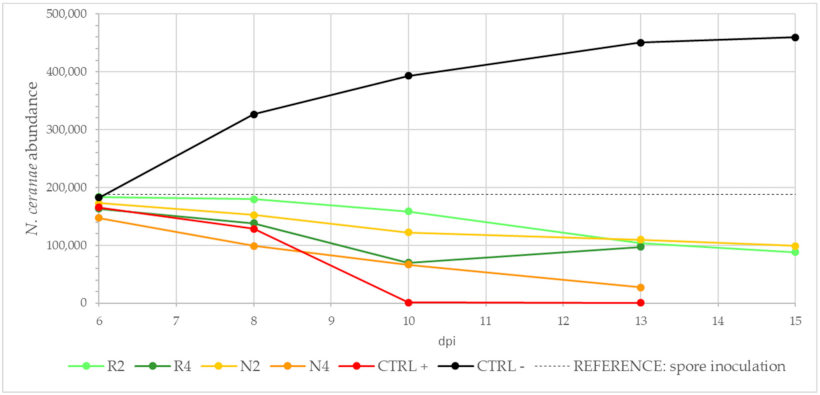
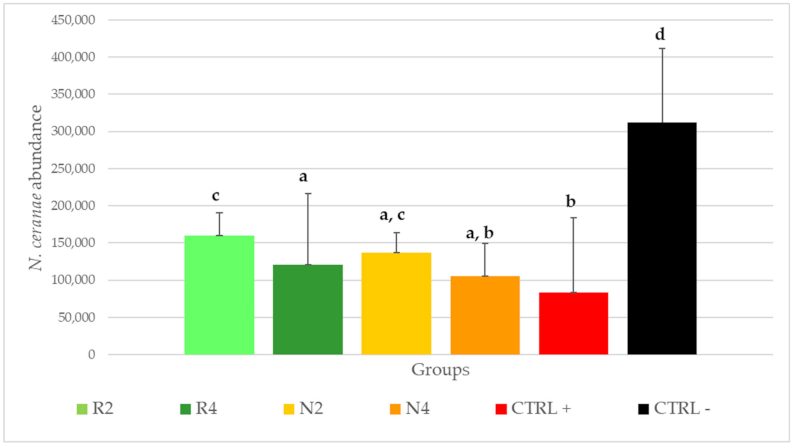
3.3.3. Effect of DSM Patties on N. ceranae
3.4. Total ITC Gut Analysis
4. Discussion
5. Conclusions
Author Contributions
Funding
Institutional Review Board Statement
Informed Consent Statement
Data Availability Statement
Conflicts of Interest
References
- Fries, I.; Martín, R.; Meana, A.; García-Palencia, P.; Higes, M. Natural infections of Nosema ceranae in European honey bees. J. Apic. Res. 2006, 45, 230–233. [Google Scholar] [CrossRef]
- Higes, M.; García-Palencia, P.; Urbieta, A.; Nanetti, A.; Martín-Hernández, R. Nosema apis and Nosema ceranae tissue tropism in worker honey bees (Apis mellifera). Vet. Pathol. 2020, 57, 132–138. [Google Scholar] [CrossRef] [PubMed]
- Fries, I.; Feng, F.; da Silva, A.; Slemenda, S.B.; Pieniazek, N.J. Nosema ceranae n. sp. (Microspora, Nosematidae), morphological and molecular characterization of a microsporidian parasite of the Asian honey bee Apis cerana (Hymenoptera, Apidae). Eur. J. Protistol. 1996, 32, 356–365. [Google Scholar] [CrossRef]
- Higes, M.; Martín, R.; Meana, A. Nosema ceranae, a new microsporidian parasite in honeybees in Europe. J. Invertebr. Pathol. 2006, 92, 93–95. [Google Scholar] [CrossRef]
- Klee, J.; Besana, A.M.; Genersch, E.; Gisder, S.; Nanetti, A.; Tam, D.Q.; Chinh, T.X.; Puerta, F.; Ruz, J.M.; Kryger, P.; et al. Widespread dispersal of the microsporidian Nosema ceranae, an emergent pathogen of the western honey bee, Apis mellifera. J. Invertebr. Pathol. 2007, 96, 1–10. [Google Scholar] [CrossRef]
- Fries, I.; Chauzat, M.-P.; Chen, Y.-P.; Doublet, V.; Genersch, E.; Gisder, S.; Higes, M.; McMahon, D.P.; Martín-Hernández, R.; Natsopoulou, M.; et al. Standard methods for Nosema research. J. Apic. Res. 2013, 52, 1–28. [Google Scholar] [CrossRef] [Green Version]
- Higes, M.; Martín-Hernández, R.; Botías, C.; Bailón, E.G.; González-Porto, A.V.; Barrios, L.; Del Nozal, M.J.; Bernal, J.L.; Jiménez, J.J.; Palencia, P.G.; et al. How natural infection by Nosema ceranae causes honeybee colony collapse. Environ. Microbiol. 2008, 10, 2659–2669. [Google Scholar] [CrossRef]
- Eiri, D.M.; Suwannapong, G.; Endler, M.; Nieh, J.C. Nosema ceranae can infect honey bee larvae and reduces subsequent adult longevity. PLoS ONE 2015, 10, e0126330. [Google Scholar] [CrossRef] [Green Version]
- Higes, M.; Martín-Hernández, R.; Garrido-Bailón, E.; González-Porto, A.V.; García-Palencia, P.; Meana, A.; del Nozal, M.J.; Mayo, R.; Bernal, J.L.; Kamer, Y.; et al. Honeybee colony collapse due to Nosema ceranae in professional apiaries. Environ. Microbiol. Rep. 2009, 1, 110–113. [Google Scholar] [CrossRef]
- Antúnez, K.; Martín-Hernández, R.; Prieto, L.; Meana, A.; Zunino, P.; Higes, M. Immune suppression in the honey bee (Apis mellifera) following infection by Nosema ceranae (Microsporidia). Environ. Microbiol. 2009, 11, 2284–2290. [Google Scholar] [CrossRef]
- Dussaubat, C.; Brunet, J.-L.; Higes, M.; Colbourne, J.K.; Lopez, J.; Choi, J.-H.; Martín-Hernández, R.; Botías, C.; Cousin, M.; McDonnell, C.; et al. Gut pathology and responses to the microsporidium Nosema ceranae in the honey bee Apis mellifera. PLoS ONE 2012, 7, e37017. [Google Scholar] [CrossRef] [Green Version]
- Di Pasquale, G.; Salignon, M.; Le Conte, Y.; Belzunces, L.P.; Decourtye, A.; Kretzschmar, A.; Suchail, S.; Brunet, J.-L.; Alaux, C. Influence of pollen nutrition on honey bee health: Do Pollen Quality and Diversity Matter? PLoS ONE 2013, 8, e72016. [Google Scholar] [CrossRef] [Green Version]
- Aufauvre, J.; Misme-Aucouturier, B.; Viguès, B.; Texier, C.; Delbac, F.; Blot, N. Transcriptome analyses of the honeybee response to Nosema ceranae and insecticides. PLoS ONE 2014, 9, e91686. [Google Scholar] [CrossRef]
- Cox-Foster, D.L.; Conlan, S.; Holmes, E.C.; Palacios, G.; Evans, J.D.; Moran, N.A.; Quan, P.-L.; Briese, T.; Hornig, M.; Geiser, D.M.; et al. A metagenomic survey of microbes in honey bee colony collapse disorder. Science 2007, 318, 283–287. [Google Scholar] [CrossRef] [Green Version]
- Williams, G.R.; Sampson, M.A.; Shutler, D.; Rogers, R.E.L. Does fumagillin control the recently detected invasive parasite Nosema ceranae in western honey bees (Apis mellifera)? J. Invertebr. Pathol. 2008, 99, 342–344. [Google Scholar] [CrossRef]
- Higes, M.; Nozal, M.J.; Alvaro, A.; Barrios, L.; Meana, A.; Martín-Hernández, R.; Bernal, J.L.; Bernal, J. The stability and effectiveness of fumagillin in controlling Nosema ceranae (Microsporidia) infection in honey bees (Apis mellifera) under laboratory and field conditions. Apidologie 2011, 42, 364–377. [Google Scholar] [CrossRef] [Green Version]
- Cilia, G.; Garrido, C.; Bonetto, M.; Tesoriero, D.; Nanetti, A. Effect of Api-Bioxal® and ApiHerb® treatments against Nosema ceranae infection in Apis mellifera investigated by two qPCR methods. Vet. Sci. 2020, 7, 125. [Google Scholar] [CrossRef]
- Botías, C.; Martín-Hernández, R.; Meana, A.; Higes, M. Screening alternative therapies to control Nosemosis type C in honey bee (Apis mellifera iberiensis) colonies. Res. Vet. Sci. 2013, 95, 1041–1045. [Google Scholar] [CrossRef]
- Maistrello, L.; Lodesani, M.; Costa, C.; Leonardi, F.; Marani, G.; Caldon, M.; Mutinelli, F.; Granato, A. Screening of natural compounds for the control of Nosema disease in honeybees (Apis mellifera). Apidologie 2008, 39, 436–445. [Google Scholar] [CrossRef] [Green Version]
- Bravo, J.; Carbonell, V.; Sepúlveda, B.; Delporte, C.; Valdovinos, C.E.; Martín-Hernández, R.; Higes, M. Antifungal activity of the essential oil obtained from Cryptocarya alba against infection in honey bees by Nosema ceranae. J. Invertebr. Pathol. 2017, 149, 141–147. [Google Scholar] [CrossRef]
- Porrini, M.P.; Garrido, P.M.; Umpiérrez, M.L.; Porrini, L.P.; Cuniolo, A.; Davyt, B.; González, A.; Eguaras, M.J.; Rossini, C. Effects of synthetic acaricides and Nosema ceranae (Microsporidia: Nosematidae) on molecules associated with chemical communication and recognition in honey bees. Vet. Sci. 2020, 7, 199. [Google Scholar] [CrossRef] [PubMed]
- Burnham, A.J. Scientific advances in controlling Nosema ceranae (Microsporidia) infections in honey bees (Apis mellifera). Front. Vet. Sci. 2019, 6, 79. [Google Scholar] [CrossRef] [PubMed] [Green Version]
- Borges, D.; Guzman-Novoa, E.; Goodwin, P.H. Control of the microsporidian parasite Nosema ceranae in honey bees (Apis mellifera) using nutraceutical and immuno-stimulatory compounds. PLoS ONE 2020, 15, e0227484. [Google Scholar] [CrossRef] [PubMed]
- Michalczyk, M.; Sokół, R.; Koziatek, S. Evaluation of the effectiveness of selected treatments of Nosema spp. infection by the hemocytometric method and duplex PCR. Acta Vet. 2016, 66, 115–124. [Google Scholar] [CrossRef] [Green Version]
- Michalczyk, M.; Sokół, R. Estimation of the influence of selected products on co-infection with N. apis/N. ceranae in Apis mellifera using real-time PCR. Invertebr. Reprod. Dev. 2018, 62, 92–97. [Google Scholar] [CrossRef]
- Cilia, G.; Fratini, F.; Tafi, E.; Turchi, B.; Mancini, S.; Sagona, S.; Nanetti, A.; Cerri, D.; Felicioli, A. Microbial profile of the ventriculum of honey bee (Apis mellifera ligustica Spinola, 1806) fed with veterinary drugs, dietary supplements and non-protein amino acids. Vet. Sci. 2020, 7, 76. [Google Scholar] [CrossRef]
- Cilia, G.; Fratini, F.; Tafi, E.; Mancini, S.; Turchi, B.; Sagona, S.; Cerri, D.; Felicioli, A.; Nanetti, A. Changes of Western honey bee Apis mellifera ligustica (Spinola, 1806) ventriculus microbial profile related to their in-hive tasks. J. Apic. Res. 2020, 60, 198–202. [Google Scholar] [CrossRef]
- Nanetti, A.; Rodriguez-García, C.; Meana, A.; Martín-Hernández, R.; Higes, M. Effect of oxalic acid on Nosema ceranae infection. Res. Vet. Sci. 2015, 102, 167–172. [Google Scholar] [CrossRef]
- Porrini, M.P.; Garrido, P.M.; Silva, J.; Cuniolo, A.; Román, S.; Iaconis, D.; Eguaras, M. Ácido oxálico: Potencial antiparasitario frente a Nosema ceranae por administración oral y exposición total. In Proceedings of the I Workshop Latinoamericano en Sanidad Apicola, Mar de Plata, Argentina, 25–26 October 2018; p. 64. [Google Scholar]
- Valizadeh, P.; Guzman-Novoa, E.; Goodwin, P.H. Effect of immune inducers on Nosema ceranae multiplication and their Impact on Honey Bee (Apis mellifera L.) Survivorship and Behaviors. Insects 2020, 11, 572. [Google Scholar] [CrossRef]
- Borges, D.; Guzman-Novoa, E.; Goodwin, P.H. Effects of prebiotics and probiotics on honey bees (Apis mellifera) infected with the microsporidian parasite Nosema ceranae. Microorganisms 2021, 9, 481. [Google Scholar] [CrossRef]
- El Khoury, S.; Rousseau, A.; Lecoeur, A.; Cheaib, B.; Bouslama, S.; Mercier, P.L.; Demey, V.; Castex, M.; Giovenazzo, P.; Derome, N. Deleterious interaction between honeybees (Apis mellifera) and its microsporidian intracellular parasite Nosema ceranae was mitigated by administrating either endogenous or allochthonous gut microbiota strains. Front. Ecol. Evol. 2018, 6, 58. [Google Scholar] [CrossRef] [Green Version]
- Fanigliulo, R.; Pochi, D.; Bondioli, P.; Grilli, R.; Fornaciari, L.; Folegatti, L.; Malaguti, L.; Matteo, R.; Ugolini, L.; Lazzeri, L. Semi-refined Crambe abyssinica (Hochst. EX R.E.Fr.) oil as a biobased hydraulic fluid for agricultural applications. Biomass Convers. Biorefinery 2021. [Google Scholar] [CrossRef]
- Lazzeri, L.; Riva, G.; D’Avino, L.; Pedretti, E.F. Short introduction to the VALSO and EXTRAVALORE project activities. Ind. Crops Prod. 2015, 75, 1–7. [Google Scholar] [CrossRef]
- Franco, P.; Spinozzi, S.; Pagnotta, E.; Lazzeri, L.; Ugolini, L.; Camborata, C.; Roda, A. Development of a liquid chromatography–electrospray ionization–tandem mass spectrometry method for the simultaneous analysis of intact glucosinolates and isothiocyanates in Brassicaceae seeds and functional foods. J. Chromatogr. A 2016, 1428, 154–161. [Google Scholar] [CrossRef]
- Canistro, D.; Vivarelli, F.; Ugolini, L.; Pinna, C.; Grandi, M.; Antonazzo, I.C.; Cirillo, S.; Sapone, A.; Cinti, S.; Lazzeri, L.; et al. Digestibility, toxicity and metabolic effects of rapeseed and sunflower protein hydrolysates in mice. Ital. J. Anim. Sci. 2017, 16, 462–473. [Google Scholar] [CrossRef] [Green Version]
- Lucarini, E.; Pagnotta, E.; Micheli, L.; Parisio, C.; Testai, L.; Martelli, A.; Calderone, V.; Matteo, R.; Lazzeri, L.; Mannelli, C. Eruca sativa meal against diabetic neuropathic pain: An H2S-mediated effect of glucoerucin. Molecules 2019, 24, 3006. [Google Scholar] [CrossRef] [Green Version]
- Bones, A.; Rossiter, J. The enzymic and chemically induced decomposition of glucosinolates. Phytochemistry 2006, 67, 1053–1067. [Google Scholar] [CrossRef]
- Fenwick, G.R.; Heaney, R.K.; Mullin, W.J.; VanEtten, C.H. Glucosinolates and their breakdown products in food and food plants. CRC Crit. Rev. Food Sci. Nutr. 1983, 18, 123–201. [Google Scholar] [CrossRef]
- Agerbirk, N.; Olsen, C.E. Glucosinolate structures in evolution. Phytochemistry 2012, 77, 16–45. [Google Scholar] [CrossRef]
- Blažević, I.; Montaut, S.; Burčul, F.; Olsen, C.E.; Burow, M.; Rollin, P.; Agerbirk, N. Glucosinolate structural diversity, identification, chemical synthesis and metabolism in plants. Phytochemistry 2020, 169, 112100. [Google Scholar] [CrossRef]
- Björkman, M.; Klingen, I.; Birch, A.N.E.; Bones, A.M.; Bruce, T.J.A.; Johansen, T.J.; Meadow, R.; Mølmann, J.; Seljåsen, R.; Smart, L.E.; et al. Phytochemicals of Brassicaceae in plant protection and human health—Influences of climate, environment and agronomic practice. Phytochemistry 2011, 72, 538–556. [Google Scholar] [CrossRef] [PubMed]
- Hanschen, F.S.; Lamy, E.; Schreiner, M.; Rohn, S. Reactivity and stability of glucosinolates and their breakdown products in foods. Angew. Chemie Int. Ed. 2014, 53, 11430–11450. [Google Scholar] [CrossRef] [PubMed]
- Matthiessen, J.N.; Kirkegaard, J.A. Biofumigation and enhanced biodegradation: Opportunity and challenge in soilborne pest and disease management. CRC Crit. Rev. Plant Sci. 2006, 25, 235–265. [Google Scholar] [CrossRef]
- Lazzeri, L.; Curto, G.; Dallavalle, E.; D’Avino, L.; Malaguti, L.; Santi, R.; Patalano, G. Nematicidal efficacy of biofumigation by defatted brassicaceae meal for control of Meloidogyne incognita (Kofoid et White) Chitw. on a full field zucchini Crop. J. Sustain. Agric. 2009, 33, 349–358. [Google Scholar] [CrossRef]
- Cilia, G.; Sagona, S.; Giusti, M.; Jarmela dos Santos, P.E.; Nanetti, A.; Felicioli, A. Nosema ceranae infection in honeybee samples from Tuscanian Archipelago (Central Italy) investigated by two qPCR methods. Saudi J. Biol. Sci. 2019, 26, 1553–1556. [Google Scholar] [CrossRef]
- Dufour, V.; Stahl, M.; Baysse, C. The antibacterial properties of isothiocyanates. Microbiology 2015, 161, 229–243. [Google Scholar] [CrossRef] [Green Version]
- Ugolini, L.; Pagnotta, E.; Matteo, R.; Malaguti, L.; Di Francesco, A.; Lazzeri, L. Brassica meal-derived allyl-isothiocyanate postharvest application: Influence on strawberry nutraceutical and biochemical parameters. J. Sci. Food Agric. 2019, 99, 4235–4241. [Google Scholar] [CrossRef]
- Ugolini, L.; Martini, C.; Lazzeri, L.; D’Avino, L.; Mari, M. Control of postharvest grey mould (Botrytis cinerea Per.: Fr.) on strawberries by glucosinolate-derived allyl-isothiocyanate treatments. Postharvest Biol. Technol. 2014, 90, 34–39. [Google Scholar] [CrossRef]
- Herr, I.; Büchler, M.W. Dietary constituents of broccoli and other cruciferous vegetables: Implications for prevention and therapy of cancer. Cancer Treat. Rev. 2010, 36, 377–383. [Google Scholar] [CrossRef]
- Yang, L.; Palliyaguru, D.L.; Kensler, T.W. Frugal chemoprevention: Targeting Nrf2 with foods rich in sulforaphane. Semin. Oncol. 2016, 43, 146–153. [Google Scholar] [CrossRef] [Green Version]
- Johansson, N.; Pavia, C.; Chiao, J. Growth inhibition of a spectrum of bacterial and fungal pathogens by sulforaphane, an isothiocyanate product found in broccoli and other cruciferous vegetables. Planta Med. 2008, 74, 747–750. [Google Scholar] [CrossRef]
- Fahey, J.W.; Stephenson, K.K.; Wade, K.L.; Talalay, P. Urease from Helicobacter pylori is inactivated by sulforaphane and other isothiocyanates. Biochem. Biophys. Res. Commun. 2013, 435, 1–7. [Google Scholar] [CrossRef] [Green Version]
- Kurepina, N.; Kreiswirth, B.N.; Mustaev, A. Growth-inhibitory activity of natural and synthetic isothiocyanates against representative human microbial pathogens. J. Appl. Microbiol. 2013, 115, 943–954. [Google Scholar] [CrossRef] [Green Version]
- Bonvicini, F.; Pagnotta, E.; Punzo, A.; Calabria, D.; Simoni, P.; Mirasoli, M.; Passerini, N.; Bertoni, S.; Ugolini, L.; Lazzeri, L.; et al. Effect of Lactobacillus acidophilus fermented broths enriched with Eruca sativa seed extracts on intestinal barrier and inflammation in a co-culture system of an enterohemorrhagic Escherichia coli and human intestinal cells. Nutrients 2020, 12, 3064. [Google Scholar] [CrossRef]
- Ramirez, D.; Abellán-Victorio, A.; Beretta, V.; Camargo, A.; Moreno, D.A. Functional ingredients from Brassicaceae species: Overview and perspectives. Int. J. Mol. Sci. 2020, 21, 1998. [Google Scholar] [CrossRef] [Green Version]
- Lazzeri, L.; Malaguti, L.; Cinti, S.; Ugolini, L.; De Nicola, G.R.; Bagatta, M.; Casadei, N.; D’Avino, L.; Matteo, R.; Patalano, G. The Brassicaceae biofumigation system for plant cultivation and defence. An Italian twenty-year experience of study and application. Acta Hortic. 2013, 1005, 375–380. [Google Scholar] [CrossRef]
- Lazzeri, L.; Leoni, O.; Manici, L.M.; Palmieri, S.; Patalano, G. Use of Seed Flour as Soilpesticide. U.S. Patent 7749549, 6 July 2010. [Google Scholar]
- Pagnotta, E.; Ugolini, L.; Matteo, R.; Lazzeri, L.; Foschi, L.; Angelini, L.G.; Tavarini, S. Exploring the Camelina sativa value chain: A new opportunity for bio-based products and overall crop sustainability. Riv. Ital. Delle Sostanze Grasse 2019, 96, 259–268. [Google Scholar]
- ISO 9167-1:1992/Amd 1:2013. Graines de Colza—Dosage des Glucosinolates—Partie 1: Methode par Chromatographie Liquide à Haute Performance. 1992. Available online: https://www.iso.org/fr/standard/72207.html (accessed on 31 March 2021).
- Pagnotta, E.; Agerbirk, N.; Olsen, C.E.; Ugolini, L.; Cinti, S.; Lazzeri, L. Hydroxyl and methoxyl derivatives of benzylglucosinolate in Lepidium densiflorum with hydrolysis to isothiocyanates and non-isothiocyanate products: Substitution governs product type and mass spectral fragmentation. J. Agric. Food Chem. 2017, 65, 3167–3178. [Google Scholar] [CrossRef]
- Whatelet, J.-P.; Iori, R.; Leoni, O.; Quinsac, A.; Palmieri, S. Guidelines for glucosinolate analysis in green tissues used for biofumigation. Agroindustria 2004, 3, 257–266. [Google Scholar]
- Citi, V.; Piragine, E.; Pagnotta, E.; Ugolini, L.; Di Cesare Mannelli, L.; Testai, L.; Ghelardini, C.; Lazzeri, L.; Calderone, V.; Martelli, A. Anticancer properties of erucin, an H 2 S-releasing isothiocyanate, on human pancreatic adenocarcinoma cells (AsPC-1). Phyther. Res. 2019, 33, 845–855. [Google Scholar] [CrossRef] [Green Version]
- Cilia, G.; Cabbri, R.; Maiorana, G.; Cardaio, I.; Dall’Olio, R.; Nanetti, A. A novel TaqMan® assay for Nosema ceranae quantification in honey bee, based on the protein coding gene Hsp70. Eur. J. Protistol. 2018, 63, 44–50. [Google Scholar] [CrossRef]
- Teixeira, E.W.; dos Santos, L.G.; Sattler, A.; Message, D.; Alves, M.L.T.M.F.; Martins, M.F.; Grassi-Sella, M.L.; Francoy, T.M. Nosema ceranae has been present in Brazil for more than three decades infecting Africanized honey bees. J. Invertebr. Pathol. 2013, 114, 250–254. [Google Scholar] [CrossRef]
- Fuentes, F.; Paredes-Gonzalez, X.; Kong, A.-N.T. Dietary glucosinolates sulforaphane, phenethyl isothiocyanate, indole-3-carbinol/3,3′-diindolylmethane: Antioxidative stress/inflammation, Nrf2, epigenetics/epigenomics and in vivo cancer chemopreventive efficacy. Curr. Pharmacol. Reports 2015, 1, 179–196. [Google Scholar] [CrossRef] [Green Version]
- Boddupalli, S.; Mein, J.R.; Lakkanna, S.; James, D.R. Induction of Phase 2 Antioxidant enzymes by broccoli sulforaphane: Perspectives in maintaining the antioxidant activity of vitamins A, C, and E. Front. Genet. 2012, 3, 7. [Google Scholar] [CrossRef] [Green Version]
- Heiss, E.; Herhaus, C.; Klimo, K.; Bartsch, H.; Gerhäuser, C. Nuclear Factor κB Is a Molecular Target for sulforaphane-mediated anti-inflammatory mechanisms. J. Biol. Chem. 2001, 276, 32008–32015. [Google Scholar] [CrossRef] [Green Version]
- Bhattacharya, A.; Li, Y.; Shi, Y.; Zhang, Y. Enhanced inhibition of urinary bladder cancer growth and muscle invasion by allyl isothiocyanate and celecoxib in combination. Carcinogenesis 2013, 34, 2593–2599. [Google Scholar] [CrossRef] [Green Version]
- Muth, F.; Breslow, P.R.; Masek, P.; Leonard, A.S. A pollen fatty acid enhances learning and survival in bumblebees. Behav. Ecol. 2018, 29, 1371–1379. [Google Scholar] [CrossRef]
- Arien, Y.; Dag, A.; Shafir, S. Omega-6:3 Ratio more than absolute lipid level in diet affects associative learning in honey bees. Front. Psychol. 2018, 9, 1001. [Google Scholar] [CrossRef] [Green Version]
- Rzepecka-Stojko, A.; Stojko, J.; Kurek-Górecka, A.; Górecki, M.; Kabała-Dzik, A.; Kubina, R.; Moździerz, A.; Buszman, E. Polyphenols from bee pollen: Structure, absorption, metabolism and biological Activity. Molecules 2015, 20, 21732–21749. [Google Scholar] [CrossRef] [Green Version]
- Das, S.; Tyagi, A.; Singhal, K.K. Chemical composition including amino acid, fatty acid and glucosinolate profile of taramira (Eruca sativa) oilseed. Indian, J. Agric. Sci. 2001, 71, 613–615. [Google Scholar]
- Danlami, U. Phytochemical, Nutritional and antimicrobial evaluations of the aqueous extract of Brassica Nigra (Brassicaceae) Seeds. Am. J. Appl. Chem. 2016, 4, 161–163. [Google Scholar] [CrossRef] [Green Version]
- Knutsen, H.K.; Alexander, J.; Barregård, L.; Bignami, M.; Brüschweiler, B.; Ceccatelli, S.; Dinovi, M.; Edler, L.; Grasl-Kraupp, B.; Hogstrand, C.; et al. Erucic acid in feed and food. EFSA J. 2016, 14, e04593. [Google Scholar]
- Ali, A.; Bashir, U.; Haiden, M. Bio-control effect of Eruca sativa Mill. oil against the hazardous food borne pathogens. Pak. J. Phytopathol. 2014, 26, 181–185. [Google Scholar]
- Aiyaa, S.J. Antibacterial activity of oil extracted of Brassica nigra seeds on some bacteria isolated from plaque and healthy teeth in children (1–5) years. Basrah J. Sci. 2012, 30, 105–119. [Google Scholar]
- Cartea, M.E.; Francisco, M.; Soengas, P.; Velasco, P. Phenolic compounds in Brassica vegetables. Molecules 2010, 16, 251–280. [Google Scholar] [CrossRef]
- Melchini, A.; Traka, M. Biological profile of erucin: A new promising anticancer agent from cruciferous vegetables. Toxins 2010, 2, 593–612. [Google Scholar] [CrossRef] [Green Version]
- Zhang, Y. The 1,2-benzenedithiole-based cyclocondensation assay: A valuable tool for the measurement of chemopreventive isothiocyanates. Crit. Rev. Food Sci. Nutr. 2012, 52, 525–532. [Google Scholar] [CrossRef] [Green Version]
- Pontoh, J.; Low, N. Purification and characterization of β-glucosidase from honey bees (Apis mellifera). Insect Biochem. Mol. Biol. 2002, 32, 679–690. [Google Scholar] [CrossRef]
- Beran, F.; Pauchet, Y.; Kunert, G.; Reichelt, M.; Wielsch, N.; Vogel, H.; Reinecke, A.; Svato, A.; Mewis, I.; Schmid, D.; et al. Phyllotreta striolata flea beetles use host plant defense compounds to create their own glucosinolate-myrosinase system. Proc. Natl. Acad. Sci. USA 2014, 111, 7349–7354. [Google Scholar] [CrossRef] [Green Version]
- Albaser, A.; Kazana, E.; Bennett, M.H.; Cebeci, F.; Luang-In, V.; Spanu, P.D.; Rossiter, J.T. Discovery of a bacterial glycoside hydrolase family 3 (GH3) β-glucosidase with myrosinase activity from a Citrobacter strain isolated from Soil. J. Agric. Food Chem. 2016, 64, 1520–1527. [Google Scholar] [CrossRef] [Green Version]
- Ricigliano, V.A.; Fitz, W.; Copeland, D.C.; Mott, B.M.; Maes, P.; Floyd, A.S.; Dockstader, A.; Anderson, K.E. The impact of pollen consumption on honey bee (Apis mellifera) digestive physiology and carbohydrate metabolism. Arch. Insect Biochem. Physiol. 2017, 96, e21406. [Google Scholar] [CrossRef]
- Mentor, S.; Fisher, D. Aggressive antioxidant reductive stress impairs brain endothelial cell angiogenesis and blood brain barrier function. Curr. Neurovasc. Res. 2016, 14, 71–81. [Google Scholar] [CrossRef]
- Hu, R.; Khor, T.O.; Shen, G.; Jeong, W.S.; Hebbar, V.; Chen, C.; Xu, C.; Reddy, B.; Chada, K.; Kong, A.N.T. Cancer chemoprevention of intestinal polyposis in ApcMin/+ mice by sulforaphane, a natural product derived from cruciferous vegetable. Carcinogenesis 2006, 27, 2038–2046. [Google Scholar] [CrossRef]
- Inês Amaro, M.; Rocha, J.; Vila-Real, H.; Eduardo-Figueira, M.; Mota-Filipe, H.; Sepodes, B.; Ribeiro, M.H. Anti-inflammatory activity of naringin and the biosynthesised naringenin by naringinase immobilized in microstructured materials in a model of DSS-induced colitis in mice. Food Res. Int. 2009, 42, 1010–1017. [Google Scholar] [CrossRef]


| E. sativa DSM | B. nigra DSM | |
|---|---|---|
| Moisture (%) | 5.9 ± 0.1 | 7.6 ± 0.1 |
| Nitrogen (%) | 5.6 ± 0.1 | 7.0 ± 0.1 |
| Oil (%) | 17.9 ± 0.2 | 8.9 ± 0.1 |
| GSL1 (¦μmol/g) side chain (R1) GSL2 (¦μmol/g) side chain (R2) | GER 72.5 ± 1.8 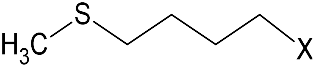 | SIN 101.8 ± 2.5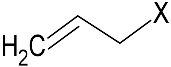 |
GRA 19.7 ± 0.2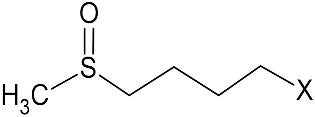 | ||
| Phenols (mg GAE/g) | 8.6 ± 0.4 | 8.6 ± 0.2 |
| DSM Patty | GSL | T0 | T10 |
|---|---|---|---|
| N4 | SIN | 4.07 ± 0.01 | 4.00 ± 0.07 |
| R4 | GER | 2.90 ± 0.05 a | 2.74 ± 0.14 b |
| GRA | 0.79 ± 0.03 b | 0.85 ± 0.08 a |
| Group | Censured Observations | Total Observations | Survival (Days) | 0.95 C.I. |
|---|---|---|---|---|
| CTRL− | 47 | 75 | 11.125 +/− 0.511 | 10.124–12.127 |
| R2 | 56 | 75 | 12.677 +/− 0.434 | 11.827–13.527 |
| R4 | 52 | 73 | 11.886 +/− 0.415 | 11.073–12.699 |
| N2 | 63 | 75 | 13.384 +/− 0.417 | 12.568–14.201 |
| N4 | 35 | 74 | 8.798 +/− 0.508 | 7.801–9.794 |
| CTRL+ | 53 | 75 | 11.385 +/− 0.394 | 10.613–12.157 |
| Effect | Parameter +/− s.e. | t | p |
|---|---|---|---|
| Intercept | 216,340.0 +/− 14,952.0 | 14.469 | 0.000 |
| dpi | −7204.6 +/− 1641.4 | −4.389 | 0.000 |
| CTRL− | 157,167.9 +/− 9409.3 | 16.703 | 0.000 |
| R2 | 8551.0 +/− 8779.9 | 0.974 | 0.331 |
| R4 | −33,488.0 +/− 9029.3 | −3.709 | 0.000 |
| N2 | −10,336.3 +/− 8475.6 | −1.219 | 0.224 |
| N4 | −52,406.2 +/− 10,684.5 | −4.905 | 0.000 |
| DSM Patty | ITC Content (pmol/mg) | |
|---|---|---|
| Midgut | Hindgut | |
| R2 | 347.83 b | 788.90 a |
| N2 | 21.95 c | 285.57 b |
Publisher’s Note: MDPI stays neutral with regard to jurisdictional claims in published maps and institutional affiliations. |
© 2021 by the authors. Licensee MDPI, Basel, Switzerland. This article is an open access article distributed under the terms and conditions of the Creative Commons Attribution (CC BY) license (https://creativecommons.org/licenses/by/4.0/).
Share and Cite
Nanetti, A.; Ugolini, L.; Cilia, G.; Pagnotta, E.; Malaguti, L.; Cardaio, I.; Matteo, R.; Lazzeri, L. Seed Meals from Brassica nigra and Eruca sativa Control Artificial Nosema ceranae Infections in Apis mellifera. Microorganisms 2021, 9, 949. https://doi.org/10.3390/microorganisms9050949
Nanetti A, Ugolini L, Cilia G, Pagnotta E, Malaguti L, Cardaio I, Matteo R, Lazzeri L. Seed Meals from Brassica nigra and Eruca sativa Control Artificial Nosema ceranae Infections in Apis mellifera. Microorganisms. 2021; 9(5):949. https://doi.org/10.3390/microorganisms9050949
Chicago/Turabian StyleNanetti, Antonio, Luisa Ugolini, Giovanni Cilia, Eleonora Pagnotta, Lorena Malaguti, Ilaria Cardaio, Roberto Matteo, and Luca Lazzeri. 2021. "Seed Meals from Brassica nigra and Eruca sativa Control Artificial Nosema ceranae Infections in Apis mellifera" Microorganisms 9, no. 5: 949. https://doi.org/10.3390/microorganisms9050949
APA StyleNanetti, A., Ugolini, L., Cilia, G., Pagnotta, E., Malaguti, L., Cardaio, I., Matteo, R., & Lazzeri, L. (2021). Seed Meals from Brassica nigra and Eruca sativa Control Artificial Nosema ceranae Infections in Apis mellifera. Microorganisms, 9(5), 949. https://doi.org/10.3390/microorganisms9050949