Article

Does the Composition of the Gut Bacteriome Change during the Growth of Tuna?

1
MARBEC, University Montpellier, CNRS, Ifremer, IRD, 34095 Montpellier, France
2
Centre de Recherches Océanologiques, Abidjan, Côte d’Ivoire
3
Mediterranean Insitute of Oceanodraphy (MIO), 13009 Marseille, France
*
Author to whom correspondence should be addressed.
Microorganisms 2021, 9(6), 1157; https://doi.org/10.3390/microorganisms9061157
Submission received: 13 April 2021 / Revised: 20 May 2021 / Accepted: 24 May 2021 / Published: 27 May 2021
(This article belongs to the Special Issue Gut Microorganisms of Aquatic Animals 2.0)

Abstract

:
In recent years, a growing number of studies sought to examine the composition and the determinants of the gut microflora in marine animals, including fish. For tropical tuna, which are among the most consumed fish worldwide, there is scarce information on their enteric bacterial communities and how they evolve during fish growth. In this study, we used metabarcoding of the 16S rDNA gene to (1) describe the diversity and composition of the gut bacteriome in the three most fished tuna species (skipjack, yellowfin and bigeye), and (2) to examine its intra-specific variability from juveniles to larger adults. Although there was a remarkable convergence of taxonomic richness and bacterial composition between yellowfin and bigeyes tuna, the gut bacteriome of skipjack tuna was distinct from the other two species. Throughout fish growth, the enteric bacteriome of yellowfin and bigeyes also showed significant modifications, while that of skipjack tuna remained relatively homogeneous. Finally, our results suggest that the gut bacteriome of marine fish may not always be subject to structural modifications during their growth, especially in species that maintain a steady feeding behavior during their lifetime.

1. Introduction

In recent years, the number of microbiome studies on marine organisms was increasing, particularly for corals and fish, about which we now know that their microbial associates play a considerable role in their health and fitness [1,2,3,4]. Among the different biological compartments that harbor microorganisms, the digestive tract is certainly the one that has received the greatest deal of attention; mostly because enteric bacteria are involved in a wide range of important functions for the host, including digestion, production of useful metabolites, protection against pathogens, promotion of the immune system, behavior, to name a few [5,6,7,8]. Previous studies have shown that for humans, the gut microbiome of fish include, from the larval stage onwards, a wide range of taxa mostly dependent on several factors such as life stage [9], sex [10], phylogeny [11], trophic level [12], diet [7], season [13], habitat [14] and captive-state [10].
At various growth stages, the life traits of fish may evolve and could therefore result in major changes in the composition of enteric bacterial communities [6,15,16]. This is the case, for example, in wild migratory species that undergo several ontogenetic transformations during their development and need to adapt their metabolism and diet to major environmental changes, such as the transition from fresh water to salt water [17]. A handful of studies revealed that the gut microbiome changes throughout fish growth, as shown in the farmed olive flounders Paralichthys olivaceus [18] and Chinook salmon Oncorhynchus tshawytsha [19]. However, these studies have been mostly conducted on experimental reared fish, hence it is timely to evaluate whether such patterns also occur in wild fish, especially for species that represent an important food source for humans.
Tunas are teleostean species living in tropical and temperate waters. They are top predators playing a fundamental role in the marine trophic food chain and ecosystem resilience. They are among the most fished species in the world, exploited in all oceans by both industrial and small-scale fisheries [20].
Despite their ecological importance, but also in terms of ecosystem services provided by tunas, little is currently known about the composition, diversity and role of their gut bacteriome, including its possible changes during fish growth. Knowing that the ontogenic changes typical of certain tuna species allow them to access additional sources of food during their growth [21], it is possible that the diversification of their diet with age could result in substantial modifications of their gut bacteriome.
The objective of this study was (i) to describe the composition of the gut bacteriome of the three most fished tuna species (skipjack-Katsuwonus pelamis, yellowfin-Thunnus albacares and bigeye-Thunnus obesus), and (ii) to investigate whether the fish size (as a proxy of their development stage) is a decisive factor in explaining the structure of this enteric community.

2. Materials and Methods
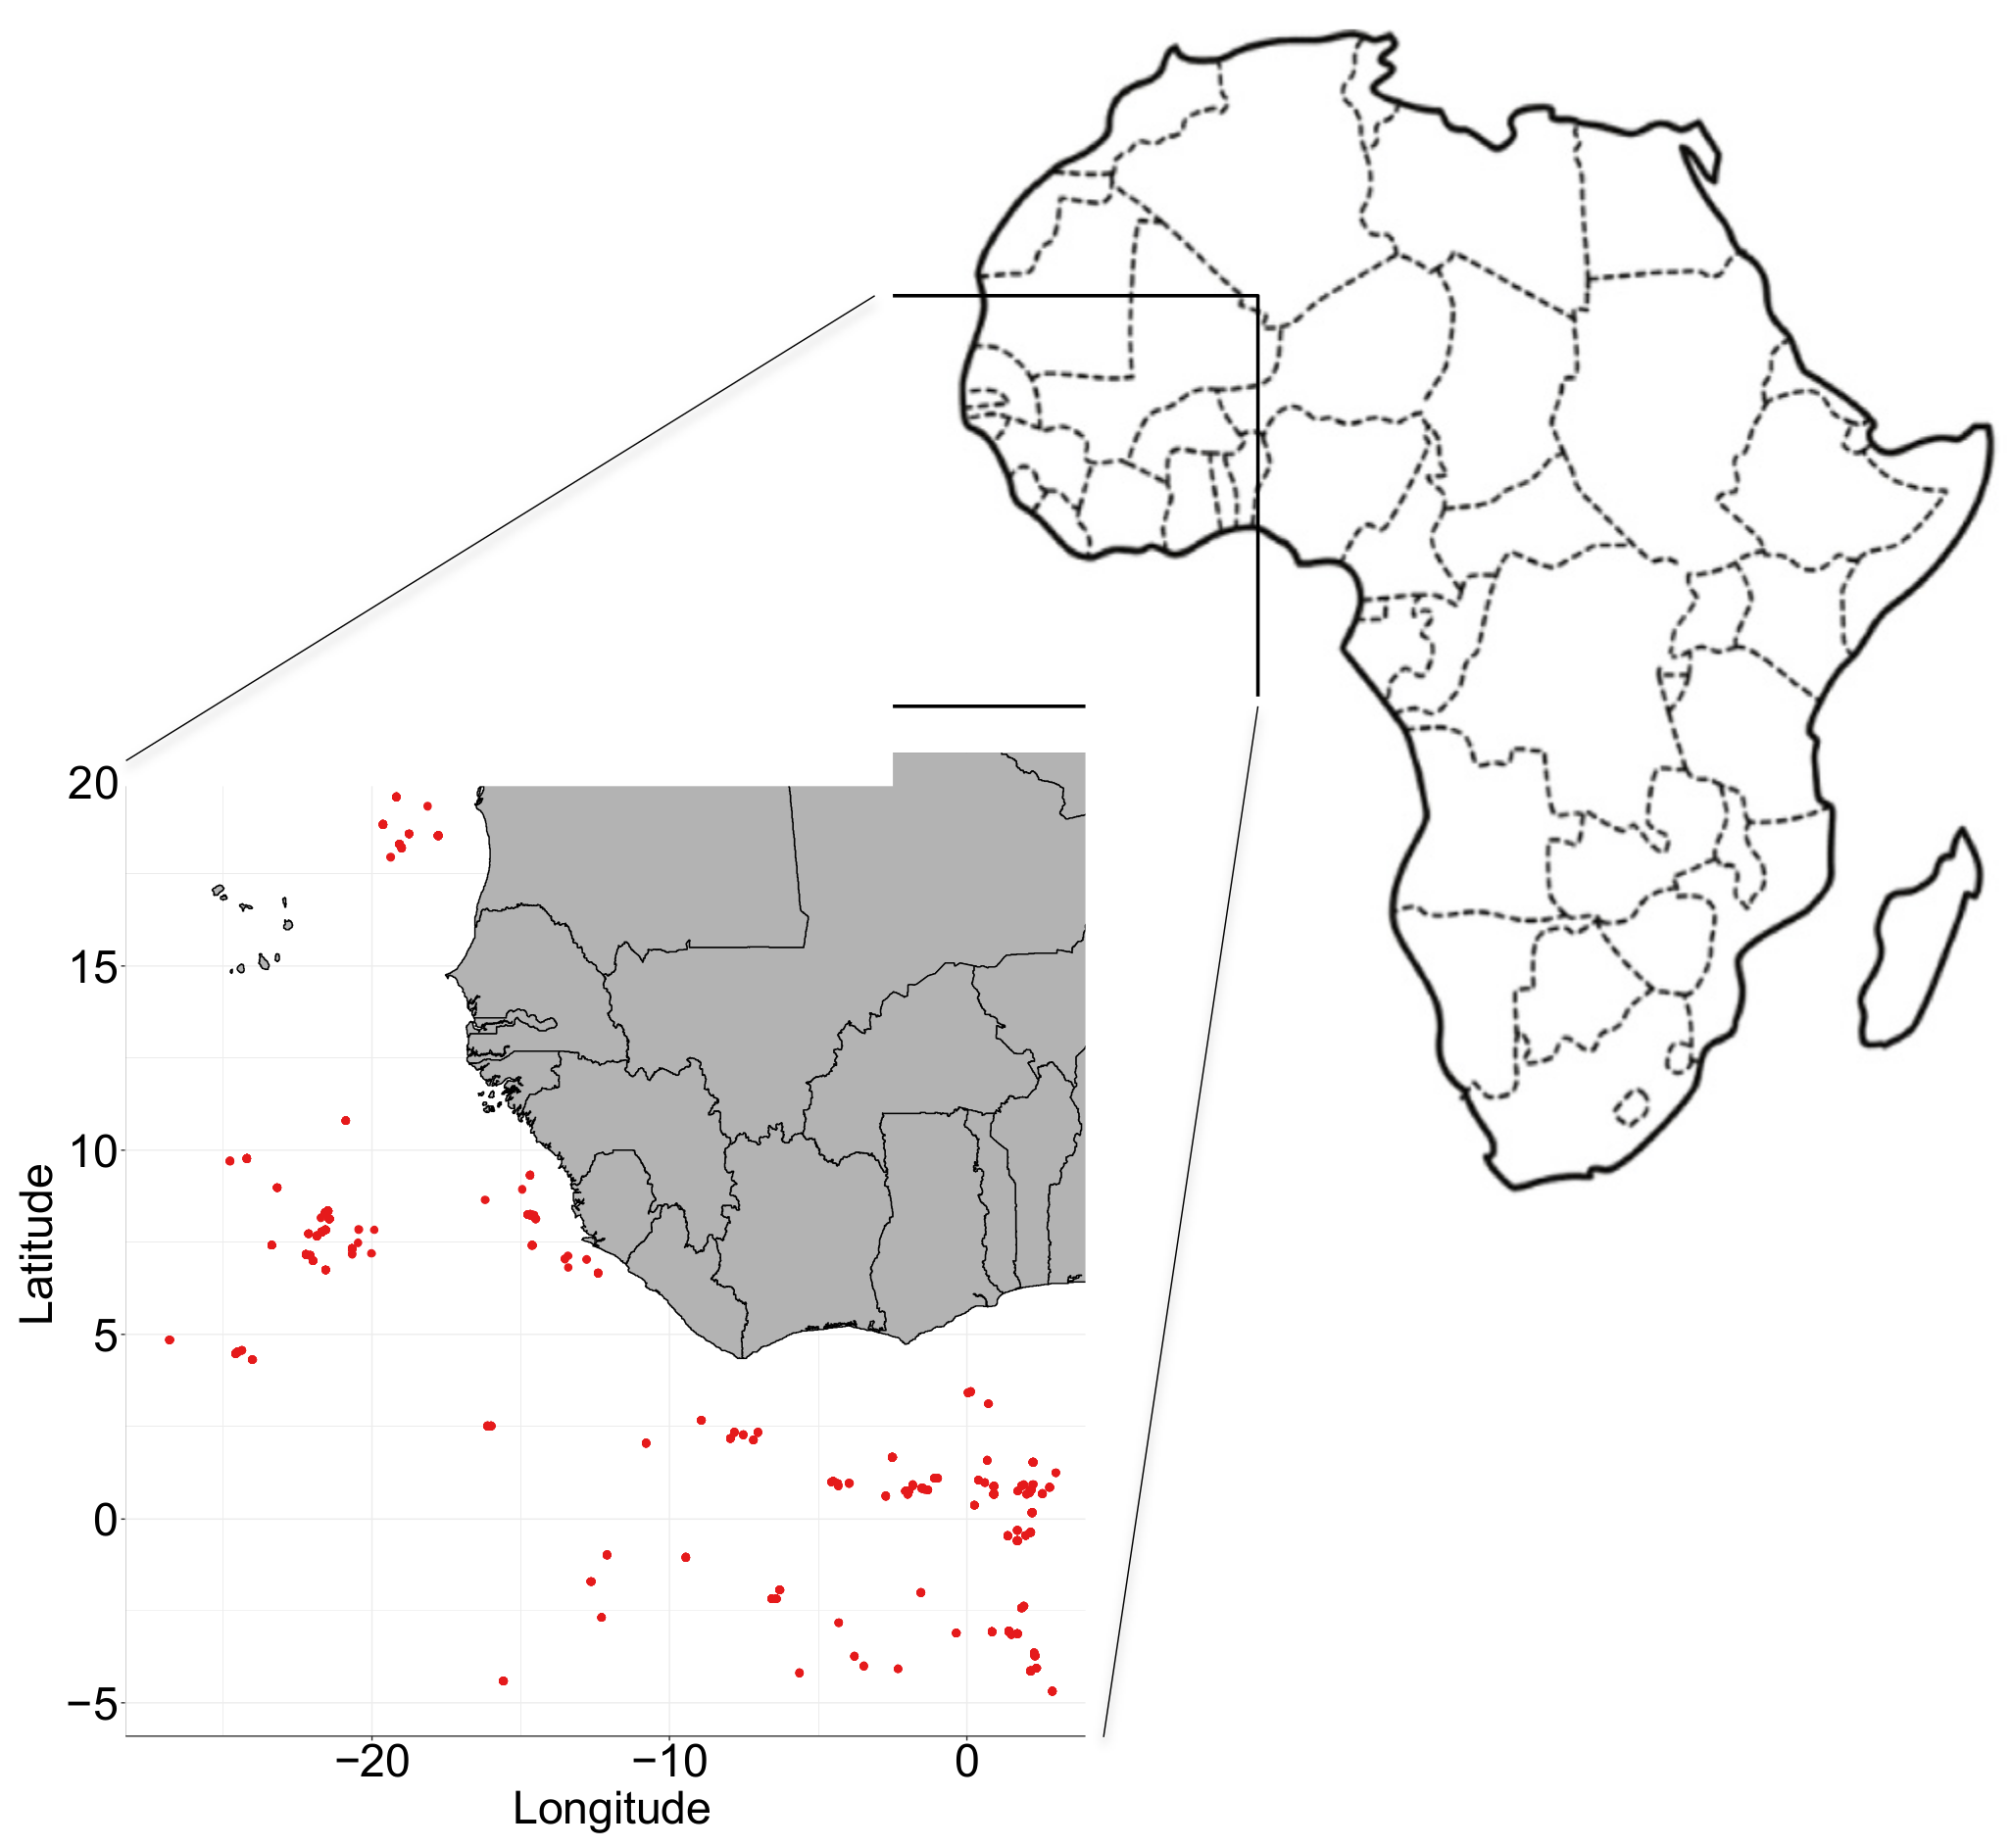
2.1. Sampling

The protocol consisted of collecting 18 individuals of each of the three tuna species targeted by the large-scale purse seine fleet. All individuals were caught between May and December 2019 (Figure 1) in the Eastern Atlantic Ocean (Gulf of Guinea and off the coast of Senegal) and sampled by the Exploited Tropical Pelagic Ecosystem Observatory (IRD, Ob7), as part of the multiannual European fishery data collection framework (DCF, financed by the European Maritime and Fisheries Fund, Article 77). Once the fish had been caught, they were stored onboard in chilled brine to lower their temperature to around −15 °C.
Each fish was weighed (whole weight, in kg) and lengthed (at fork, in cm). Size ratio (SR) between the largest and smallest individuals was calculated for each species, following the equation: SR = minimal size/maximal size. For each species, the individuals were grouped into three equivalent categories (in terms of number), named Small, Medium and Large, and corresponding, respectively, to the 6 smallest, medium and largest fish per species (Table 1). Considering the size at 50% sexual maturity of each species [22], individuals from the Small group can be considered as being mainly juvenile or sub-adult fish, and individuals from the Medium group as sub-adults or young adults, while the Large group for each species can be considered to be composed of adults. The complete set included male, female and immature fishes but no significant difference in size or weight were observed between these three categories (p > 0.05, Kruskal-Wallis test).

2.2. Extraction of the Gut Bacteriome

After landing, the 54 frozen fish were transferred to the Laboratory of Microbiology of the Centre de Recherches Océanologiques (CRO) of Abidjan, where they were thawed and dissected. The time length between catch and dissection was approximately 40 days and it was comparable for each sampled fish. Briefly, the gastrointestinal tract was extracted from each individual and cut from below the stomach to 2 cm before the rectum (to avoid potential chilled brine intrusion), using sterile tools. Each gut was squeezed to expel the contents (from 3 to 15 mL) on a sterile surface, and the contents were homogenized before sampling [23] and conserved at −80 °C until the DNA extraction.

2.3. DNA Extraction, Amplification and Sequencing

Bacterial DNA was extracted from 250 ± 0.5 mg of gut (n = 54). All extractions were performed with the PowerSoil DNA Isolation Kit (Qiagen®, Hilden, Germany) following the manufacturer’s instructions. DNA quality and quantity were assessed by spectrophotometry (NanoDrop®, Wilmington, DE, USA). The V3-V4 region of the 16S rDNA gene was amplified using universal bacterial primers modified for Illumina sequencing: 343F (5’- ACGGRAGGCAGCAG) [24] and 784R (5’- TACCAGGGTATCTAATCCT) [25]. The reaction mixture consisted of 12.5 μL of 2X Phusion Mix (New England Biolabs®, Ipswich, MA, USA), 1 μL of each primer at 10 μM (Eurofin®, Luxembourg), 10 ng of DNA template and enough molecular-grade H2O (Qiagen®) to reach a final volume of 25 μL. All samples were amplified in triplicate and pooled to avoid PCR bias in the taxonomic diversity of the community [26]. Successfully amplified samples (n = 54) were sequenced on the Illumina platform (Genoscreen®, Lille, France) using 2 × 250 bp MiSeq chemistry.

2.4. Treatment and Analysis of the Bacterial Sequences

In total 1,823,118 reads were obtained and were processed on RStudio (R v. 3.5.3) with the DADA2 pipeline (v. 1.10.1) [27], following the authors’ tutorial (https://benjjneb.github.io/dada2/tutorial.html, accessed on 27 February 2019). The quality of the forward and reverse reads was assessed prior to the removing of adaptors and primers, based on their length. Reads were then filtered, trimmed and merged into 583,716 amplicon sequence variants (ASV), which have a greater resolution than the operational taxonomic unit (OTU) [27]. The chimeras were removed and the paired sequences were aligned with the SILVA 123 taxonomic database [28] to access their taxonomy. To compensate for varying sequencing efficiency, analyses were performed on a random subsample of 8979 sequences per sample, which corresponded to the sample with the smaller number of sequences after trimming and quality processing. Final taxonomic and ASVs tables were associated with the morphometric data using the phyloseq package [29]. Finally, relative abundances of ASVs in each sample were calculated by the phyloseq package and ASVs corresponding to archea, non-prokaryotes, chloroplasts and mitochondria were deleted.
To assess the alpha diversity, the Shannon diversity index was calculated by phyloseq for each sample. The composition of bacterial communities was represented at the order level, based on the relative abundance of ASVs in each sample and performed with phyloseq and ggplot packages. Finally, using the microbiome package [30], the Core Microbiota, defined here as all ASVs (relative abundance ≥ 1%) shared by at least 50% of the gut samples, was determined for the three size groups of the three tuna species.

2.5. Statistical Analysis

All the statistical analyses were carried out using RStudio (R v. 3.5.3). For each species, possible relationship between the alpha diversity index (Shannon) and the size were tested by linear regression, while Kruskal-Wallis and Wilcoxon non-parametric tests were used to observe the variation of the alpha diversity between the three species. Finally, the effects of the species then of the size on the bacterial composition was determined by one-factor PERMANOVA with 999 permutations of the Bray-Curtis matrix using the “adonis” function of the vegan package [31].

3. Results

3.1. Fish Morphometric Traits

For the three target species, the size ratio between the smallest and largest individuals was comparable, reaching 2.2, 2.5 and 2.3 for skipjack, yellowfin and bigeye tunas, respectively. Skipjack were significantly smaller (30.5 to 67.5 cm) than the yellowfin (66.1 to 164.3 cm) and the bigeye tuna (71.4 to 166.8 cm) (p < 0.001, Kruskal-Wallis test).

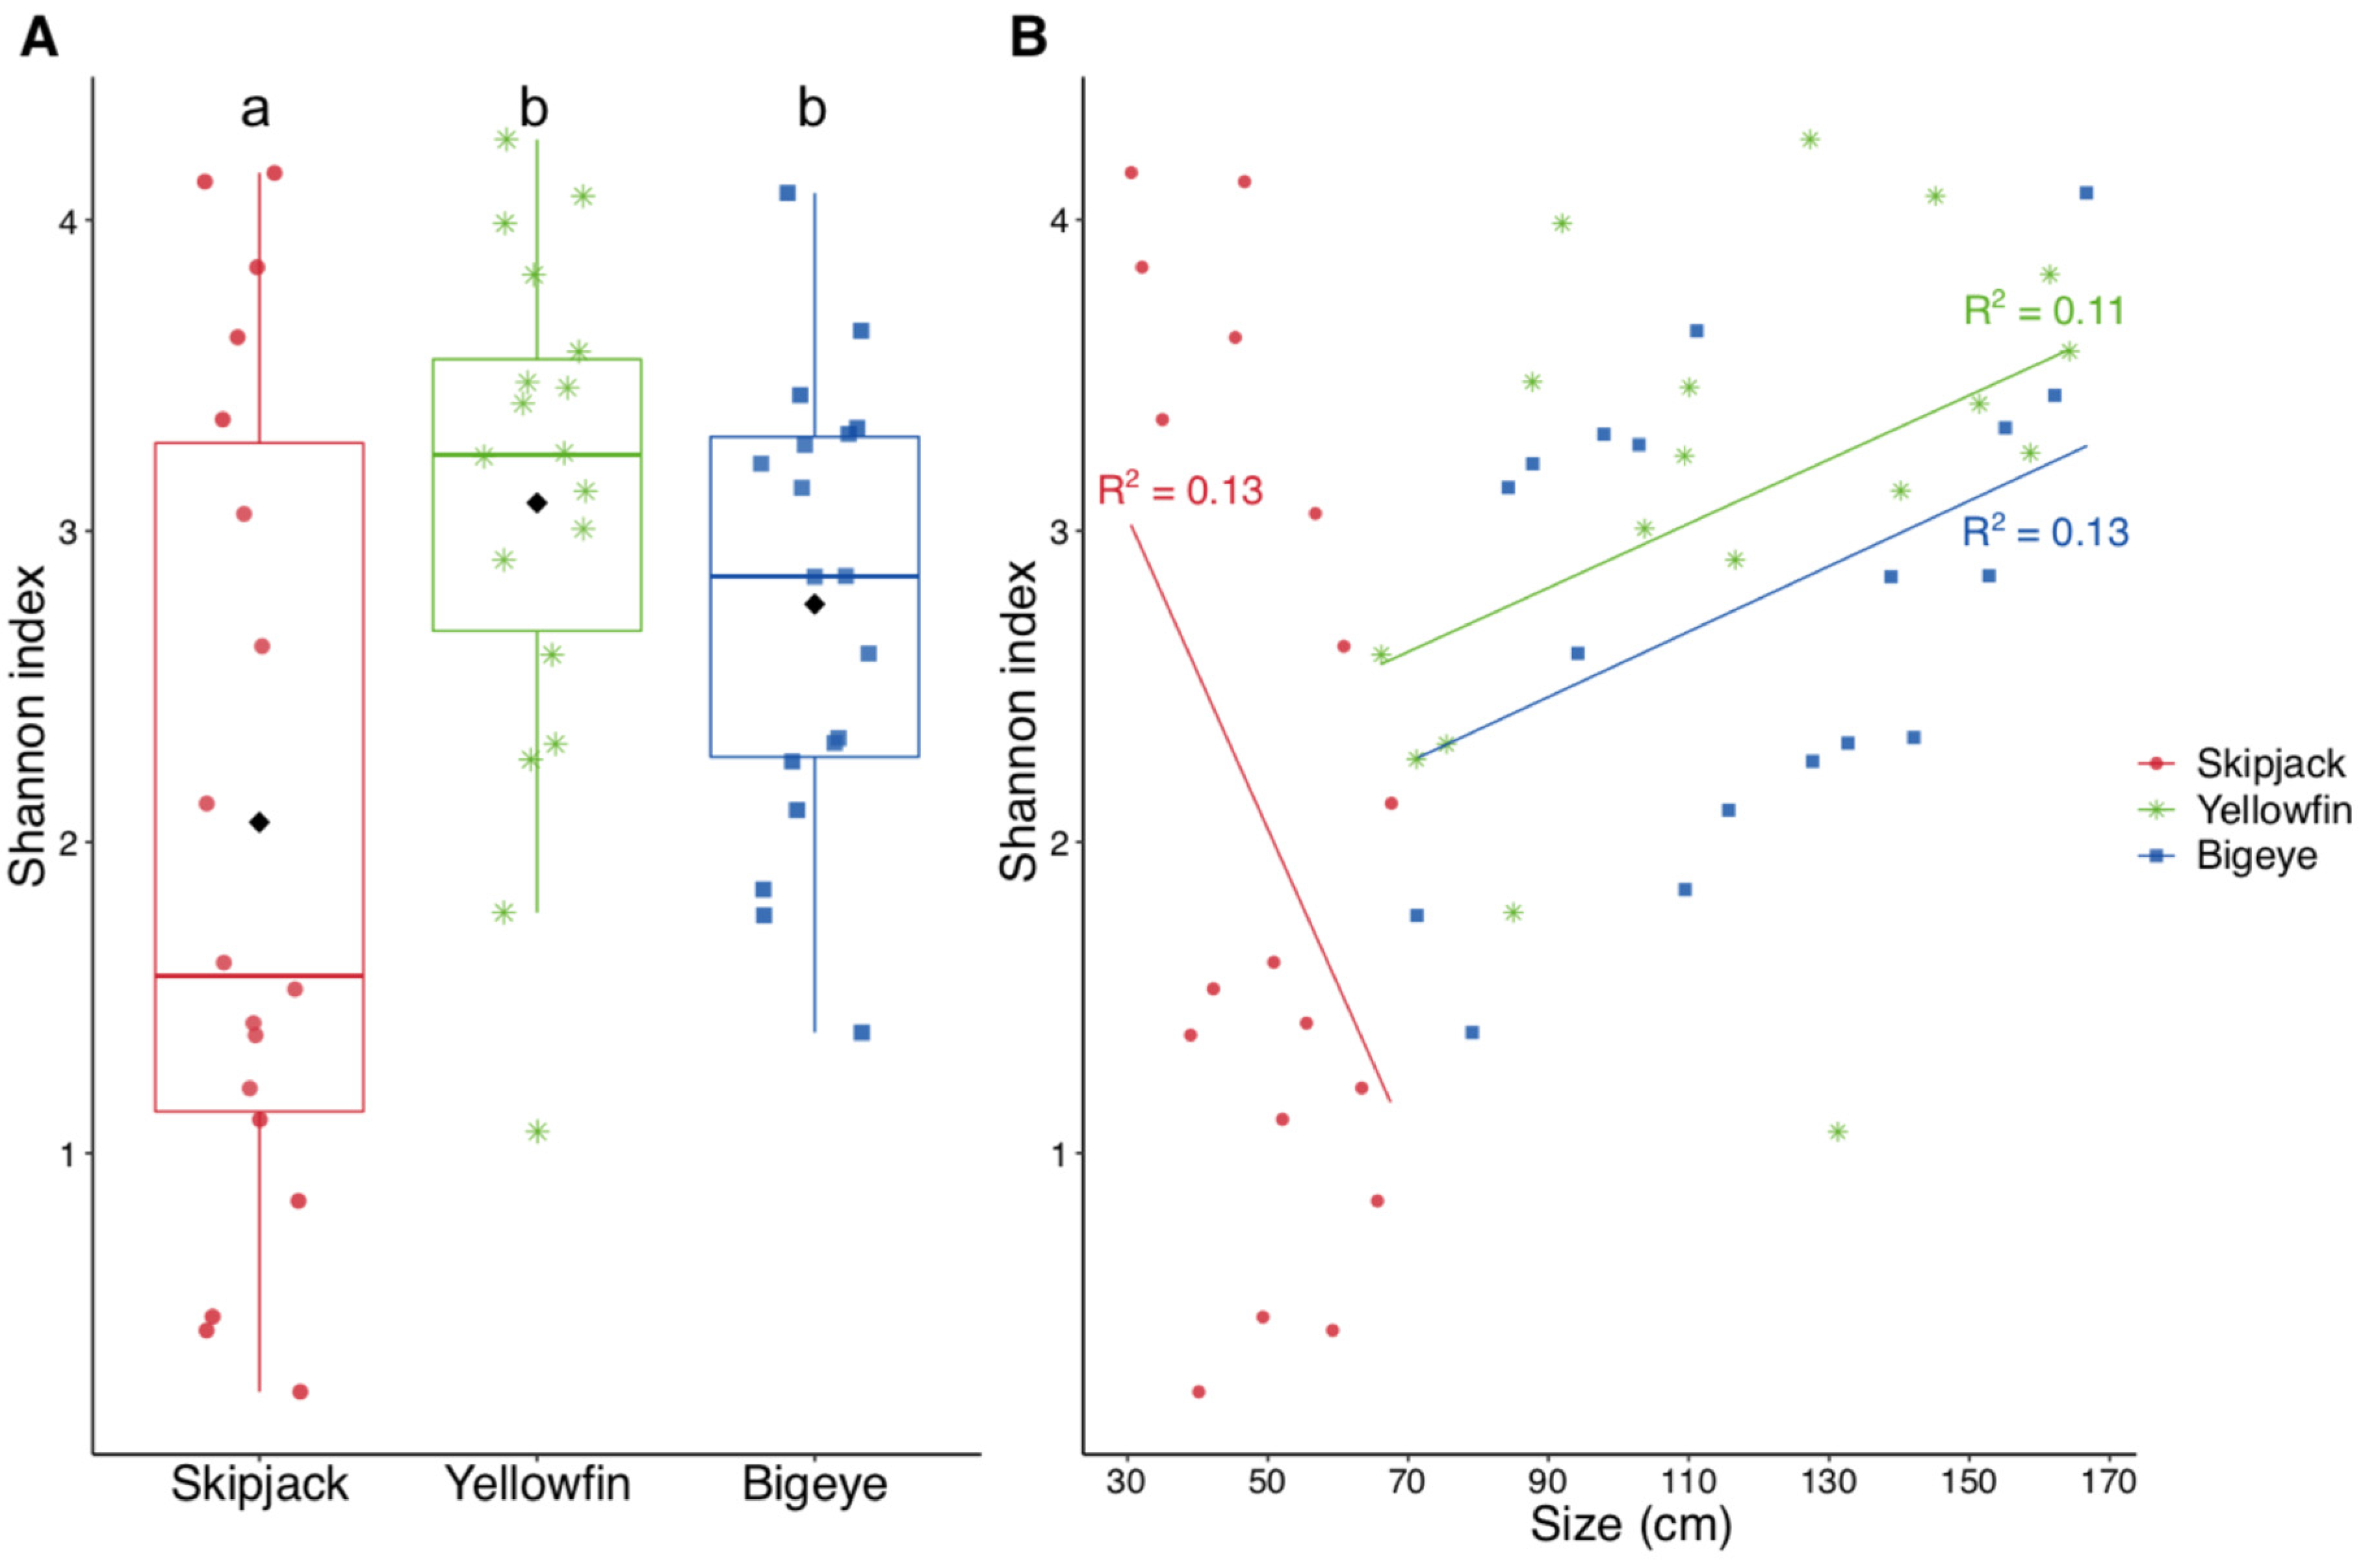
3.2. Alpha Diversity

The Shannon diversity index varied considerably for each of the three species of tuna (Figure 2A). On average, the index for the skipjack tuna was significantly lower than for the two other species (Kruskall-Wallis, p < 0.05). However, for all the three species, the Shannon index did not vary significantly along the size gradient (R2Skipjack = 0.13, p = 0.07; R2Yellowfin = 0.11, p = 0.09; R2Bigeye = 0.13, p = 0.07) (Figure 2B).

3.3. Composition and Beta Diversity

Forty-five orders of bacteria belonging to 15 different classes were identified (Figure 3). Actinobacteria, Alphaproteobacteria and Gammaproteobacteria were the most represented classes, regardless of the species and size of tuna. Generally, there was a significant species-effect on the enteric bacteriome of tuna, which was particularly marked for the gut skipjack individuals, which was dominated by Mycoplasmatales (Mollicutes) (Figure 3).
Regarding the variability in the gut microflora during fish growth, two different patterns were observed: while the composition of enteric bacterial communities was significantly affected by fish size for yellowfin and bigeyes tunas, that of skipjack remained relatively stable across the range of fish sizes (Table 2).

3.4. The Core Gut Microbiome

During their growth, each species hosted taxa that were common and specific to one or more size groups. Twelve genera of bacteria were found in the gut of all the three different tuna species (Table 3), some of them such as Carnobacterium sp., Oceanisphaera spp., Pseudomonas spp. and Psychrobacter spp. were even found in all the three size groups (small, medium and large). Each tuna species had also its own specific taxa, such as Mycoplasma sp. in skipjack, in all size categories, and to a lesser extent, Corynebacterium sp. and Rahnella spp. Yellowfin tuna hosted specific bacterial taxa mainly belonging to the Alphaproteobacteria, Clostridia, Fusobacteriia and Gammaproteobacteria classes, the latter being the most relevant, with taxa such as Citenobacter sp., Aeromonas sp., Massilia sp., and Photobacterium sp. Taxa such as Microbacterium sp., Labrenzia sp. Vibrionimonas magnilacihabitans and Escherischia/Shigella were specific to the bigeye’s gut.
Some taxa were characteristic of a size group, this being very marked for yellowfin which had the highest number of size-specific taxa. Taxa such as Acinetobacter sp. and Aeromonas sp. were specific to medium sized yellowfin and others such as Photobacterium angustum and Photobacterium leiognathi, both reported as histamine producing bacteria, were found only in large yellowfin (Table 3).

4. Discussion

In the three tuna species, the gut bacteriome was dominated by four main phyla: Proteobacteria, Firmicutes, Bacteroidetes and Actinobactera, which accounted for up to 95% of the bacteria identified in the gut. Such phyla are typically found in the intestinal microflora of marine and freshwater fish [6,32]. However, the diversity of the 16S rDNA gene sequences showed considerable differences between the enteric bacterial communities of the three species (Figure 2 and Figure 3). Skipjack were distinguished from yellowfin and bigeye tunas by their particularly low species richness and a strong presence of Firmicutes (Mollicutes, Mycoplasma sp.). A low gut microbial diversity, associated with the dominance of Mycoplasma spp. was also reported for Atlantic salmon (Salmo salar) [17]. So far, within the marine environment, Firmicutes were thought to be the dominant phylum in herbivorous species [11,33], probably as they facilitate the digestion of cellulose. However, this metabolic function is not vital in tunas and Salmonids, which are carnivorous fish. By comparison with yellowfin and bigeye, skipjack tunas are also more subjected to risk of overheating as they grow mostly because of their lower capacity of thermoregulation [34]. The occurrence of temperature-induced changes in the gut microbiome is a well-known phenomenon in vertebrates and usually results in a disruption of the alpha-diversity towards a decrease in richness [35]. Identical microbiome responses to thermal shifts in phylogenetically distant animal taxa suggest the existence of a conserved mechanism, which could also apply in tuna. All together, these may explain the observed lowest alpha diversity in skipjack.
Although our results indicate a clear species effect on the enteric bacteriome of tuna (Figure 3), there is nevertheless a strong convergence in the structure of the gut microbiota between yellowfin and bigeye while skipjack (both belonging to the same genus Thunnus), whereas skipjack tuna (genus Katsuwonus) are in a separate branch). The composition of the gut bacteriome in tropical tuna could thus depend mainly on evolutive considerations [36]. Indeed, phylogenetically close fish usually host a similar bacterial flora [37]. However, the formation of the bacterial communities in the gastro-intestinal tract of fish is a complex process affected by other exogenic and endogenic factors such as the diet, the life style and the environment [6,37,38].

4.1. Microbial Changes during Fish Growth

For all the three species, the taxonomic structural diversity of enteric bacteria did not vary significantly with size (Figure 2). This is contradictory with recent reports showing a reduction of the alpha diversity with age, and therefore, with size, for Atlantic Salmon, olive flounders and zebra fish [17,18,39,40]. A reduction in diversity is usually associated with a diet that encouraged the growth of generalist bacteria or that included chemical compounds inhibiting certain more specialist bacteria [41]. Conversely, in terrestrial vertebrates (mammals, birds and reptiles) a positive correlation was observed between the enteric microbial diversity and the mass of the animal, independent of the age, phylogeny, diet or the structure of the digestive tract [42]. Overall, the changes in the structural diversity of enteric bacteria during bodily growth does not seem to follow a unidirectional pathway within the animal world and more studies are needed to identify the factors that govern this particular diversity.
The examination of the core microbiome demonstrated that changes in the proportions of the main taxa during growth were specific to each tuna species (Table 3). Although a core bacterial community was found across the three tuna species (comprising four major genera: Carnobacterium, Oceanisphaera, Pseudomonas and Psychrobacter), other genera were specific to one or more size groups for each species. In particular, for yellowfin, Acinetobacter and Aeromonas were found in medium sized fish while Cutibacterium, Lactococcus, Gottschalkia and Photobacterium spp. were found only in large individuals. These taxa might, therefore, play a specific role in the late development stage of yellowfin.

4.2. Dietary Changes during Growth

The most striking result of our study was a drastic change in the composition of the gut microbiome of yellowfin and bigeye tuna during their growth, which was not observed for skipjack (Table 2, Figure 3). The fish size could have an effect on the selection of prey and some studies demonstrated that the proportion of fish in the tuna diet increases as the size of the tuna increases [43,44]. A vertical distribution of tuna species in the water column has been long reported, with the larger fish (bigeye and yellowfin) able to stay in deeper water than the smaller (skipjack), which gives them access to different types of prey [21]. Such modifications in the diet could be related to changes in nutritional needs depending on the development stage of the tuna. Indeed, ontogenic changes in yellowfin and bigeye tuna are generally observed when they reach about 45–50 cm, enabling them to dive into colder, deeper water [45], which would radically change their diet, and promote its diversification throughout growth. Quite the opposite, skipjack are physiologically enabled to reach these deeper waters with potential new preys and therefore remain in surface waters at all life stage, which could explain the homogeneity of their gut microbiota throughout growth. Conversely, although there was no yellowfin or bigeye smaller than 65 cm in our sampling, we suspect that the significant differences observed between the various growth stages was due to their ability to diversify their diet with age, going further and further to seek food.

4.3. Commensal and Potential Pathogenic Bacteria

In our study, the main bacterial genera forming the core microbiome of the tuna species included commensal and potential pathogenic taxa, some of them being common to all the three target species (Table 3). Of the commensal taxa, some Carnobacterium species, for example, are known to inhibit the action of certain fish pathogens [46,47]. A similar antagonistic activity of several Pseudomonas bacterial strains has also been reported [48]. Many Kocuria species are commensal bacteria found on mammals and have been isolated from the gut of rainbow trout (Oncorhynchus mykiss) and the Atlantic cod (Ghadus morhua) [49]. However, several species of Carnobacterium and Kocuria are also known to be pathogenic [49,50], like Escherichia and Shigella, which are enteric human pathogens able to establish in the gut of several fish in certain conditions. This has occurred, for example, in trout after consuming infected food and in Nile tilapia when the surrounding water had been contaminated [51,52]. Other Sporocarcina species are bacteria that spoil seafood and refrigerated meat [53]. Some species found in the tuna gut microbiome are also known to be histamine-producing bacteria (HPB) [54]. The histamine is produced by these bacteria from a precursor (histidine) by a bacterial enzyme (histidine decarboxylase) and is main global cause of food-poisoning from consuming fish [55]. HPB are often found in tuna when the cold chain is broken during landing, processing and handling fresh tuna [56,57]. In this study, two Photobacterium species (Photobacterium angustum and Photobacterium leiognathi) were found in the gut microbiome of large yellowfin. Other species such as Photobacterium damselae, Photobacterium phosphoreum and Pseudomonas fluorescens were found in some samples of all three tuna species. The relative abundances were low (<2%) and there was no clear relationship between the size of the tuna and the presence of these HPBs.
All these confirm that the fish gut typically hosts a complex and highly diversified bacterial community composed of a balance of commensal and pathogenic taxa, which contribute to the functioning of the gut and help to maintain the health of the host organism.

5. Conclusions

Our results revealed that the composition of the enteric microflora showed contrasting patterns between skipjack on one side, and yellowfin and bigeye tuna on the other side. Beside phylogeny, several other endogenic factors could explain the microbial differences and similarities between species, including the size which emerged as a major determinant of gut bacteriome in tuna. If significant changes in the intestinal microflora have been observed during the growth of yellowfin and bigeye tuna, the case of skipjack, by contrast, is interesting because of the relative stability of its microbiota and its unique composition. Overall, our study suggests that strong structural (and presumably functional) microbiological differences exist between species within the same family of fish, probably linked to their differential ability to grow in size, improve their mobility for foraging, and thus promote diet diversification.

Author Contributions

Conceptualization, Y.B.; E.G. and A.G.; methodology, E.G.; S.C.; L.D.; software, L.D. (Lucile Durand); E.G. and J.-C.A.; validation, Y.B.; formal analysis, L.D. (Lucile Durand); investigation, Y.B., E.R.d.; T.B.; E.G.; resources, A.G.; data curation, L.D.; writing—original draft preparation, Y.B. and L.D. (Laurent Dagorn); writing—review and editing, Y.B.; E.G.; T.B.; E.R.d.; L.D. (Laurent Dagorn), J.-C.A. and C.D. visualization, A.A.; supervision, Y.B.; E.G.; A.G. and C.D. project administration, Y.B.; funding acquisition, Y.B. All authors have read and agreed to the published version of the manuscript.

Funding

This research was funded by THE MOME Projet and Montpellier University of Excellence (MUSE), and the APC was funded by the MOSANE project (JEAI IRD). The data used here was collected within the framework of the Data Collection Framework program (Reg 2017/1004 and 2016/1251) co-financed by the IRD and Measure 77 of the European Maritime and Fisheries Fund (EMFF).

Institutional Review Board Statement

No applicable.

Informed Consent Statement

Not applicable.

Data Availability Statement

Not applicable.

Acknowledgments

We would like to thank the members of the IRD’s Exploited Tropical Pelagic Ecosystems Observatory in Abidjan for their help in extracting the digestive tracts of tuna. We also grateful to the CRO staff for providing access to their laboratory and facilities, and to Monique Simier for her advices on the statistical analysis.

Conflicts of Interest

The authors declare no conflict of interest to publish the results.

References

  1. Stal, L.J.; Cretoiu, M.S. The Marine Microbiome: An Untapped Source of Biodiversity and Biotechnological Potential; Springer: Berlin/Heidelberg, Germany, 2016. [Google Scholar]
  2. Apprill, A. Marine animal microbiomes: Toward understanding host–microbiome interactions in a changing ocean. Front. Mar. Sci. 2017, 4, 222. [Google Scholar] [CrossRef] [Green Version]
  3. Trevathan-Tackett, S.M.; Sherman, C.D.H.; Huggett, M.J.; Campbell, A.H.; Laverock, B.; Hurtado-McCormick, V.; Macreadie, P.I. A horizon scan of priorities for coastal marine microbiome research. Nat. Ecol. Evol. 2019, 3, 1509–1520. [Google Scholar] [CrossRef]
  4. Chiarello, M.; Auguet, J.C.; Graham, N.; Claverie, T.; Sucre, E.; Bouvier, C.; Rieuvilleneuve, F.; Bettarel, Y.; Villeger, S.; Bouvier, T. Exceptional but vulnerable microbial diversity in coral reef animal surface microbiomes. Proc. R. Soc. B 2020, 287, 1927. [Google Scholar] [CrossRef] [PubMed]
  5. Tarnecki, A.M.; Burgos, F.A.; Ray, C.L.; Arias, C.R. Fish intestinal microbiome: Diversity and symbiosis unravelled by metagenomics. J. Appl. Microbiol. 2017, 123, 2–17. [Google Scholar] [CrossRef] [PubMed] [Green Version]
  6. Egerton, S.; Culloty, S.; Whooley, J.; Stanton, C.; Ross, R.P. The gut microbiota of marine fish. Front. Microbiol. 2018, 9, 1–17. [Google Scholar] [CrossRef] [PubMed]
  7. Butt, R.L.; Volkoff, H. Gut microbiota and energy homeostasis in fish. Front. Endocrinol. 2019, 10, 9. [Google Scholar] [CrossRef] [PubMed] [Green Version]
  8. Gupta, V.K.; Minsuk, K.; Bakshi, U.; Cunningham, K.Y.; Davis III, J.M.D.; Lazaridis, K.N.; Nelson, H.; Chia, N.; Sung, J. A predictive index for health status using species-level gut microbiome profiling. Nat. Commun. 2020, 11, 4635. [Google Scholar] [CrossRef] [PubMed]
  9. Hansen, G.H.; Olafsen, J.A. Bacterial interactions in early life stages of marine cold water fish. Microb. Ecol. 1999, 38, 1–26. [Google Scholar] [CrossRef]
  10. Dhanasiri, A.K.S.; Brunvold, L.; Brinchmann, M.F.; Kornses, K.; Bergh, O.; Kiron, W. Changes in the intestinal microbiota of wild Atlantic cod Gadus morhua L. upon captive rearing. Microb. Ecol. 2011, 1, 20–30. [Google Scholar] [CrossRef]
  11. Miyake, S.; Ngugo, D.K.; Stingl, U. Diet strongly influences the gut microbiota of surgeon fishes. Mol. Ecol. 2015, 24, 656–672. [Google Scholar] [CrossRef]
  12. Clements, K.D.; Pasch, I.B.Y.; Moran, D.; Turner, S.J. Clostridia dominate 16S rRNA gene libraries prepared from the hindgut of temperate marine herbivorous fishes. Mar. Biol. 2007, 150, 1431–1440. [Google Scholar] [CrossRef]
  13. Hovda, M.B.; Fontanillas, R.; McGurk, C.; Obach, A.; Rosnes, J.T. Seasonal variations in the intestinal microbiota of farmed Atlantic salmon (Salmo salar L.). Aquac. Res. 2012, 43, 154–159. [Google Scholar] [CrossRef]
  14. Bano, N.; Smith, A.D.; Bennett, W.; Vasquez, L.; Hollibaugh, J.T. Dominance of Mycoplasma in the guts of the long jawed Mudsucker, Gillichthys mirabilis, from five California salt marshes. Environ. Microbiol. 2007, 9, 2636–2641. [Google Scholar] [CrossRef] [PubMed]
  15. Talwar, C.; Nagar, S.; Lal, R.; Negi, R.K. Fish gut microbiome: Current approaches and future perspectives. Indian J. Microbiol. 2018, 58, 397–414. [Google Scholar] [CrossRef] [PubMed]
  16. Perry, W.B.; Lindsay, E.; Payne, C.J.; Brodie, C.; Kazlauskaite, R. The role of the gut microbiome in sustainable teleost aquaculture. Proc. R. Soc. B 2020, 287, 20200184. [Google Scholar] [CrossRef] [PubMed]
  17. Llewellyn, M.S.; McGinnity, P.; Dionne, M.; Letourneau, J.; Thonier, F.; Carvalho, G.R.; Creer, S.; Derome, N. The biogeography of the atlantic salmon (Salmo salar) gut microbiome. ISME J. 2016, 10, 1280–1284. [Google Scholar] [CrossRef] [PubMed] [Green Version]
  18. Niu, K.M.; Lee, B.J.; Kothari, D.; Loo, W.D.; Hur, S.W.; Lim, S.G.; Kim, K.W.; Kim, N.N.; Kim, S.K. Dietary effect of low fish meal aquafeed on gut microbiota in olive flounder (Paralichtys olivaceus) at different growth stages. MicrobiologyOpen 2020, 9, e992. [Google Scholar] [CrossRef] [Green Version]
  19. Zhao, R.; Symonds, J.E.; Walker, S.P.; Steiner, K.; Carter, C.G.; Bowman, J.P.; Nowak, B.F. Salinity and fish age affect the gut microbiota of farmed Chinook salmon (Oncorhynchus tshawytscha). Aquaculture 2020, 528, 735539. [Google Scholar] [CrossRef]
  20. FAO. The State of World Fisheries and Aquaculture 2018—Meeting the Sustainable Development Goals; FAO: Rome, Italy, 2018. [Google Scholar]
  21. Schaefer, K.M.; Fuller, D.W. Simultaneous behavior of skipjack (Katsuwonus pelamis), bigeye (Thunnus obsesus), and yellowfin (T. albacares) tunas, within large multi-species aggregations associated with drifting fish aggregating devices (FADs) in the equatorial eastern Pacific Ocean. Mar. Biol. 2013, 160, 3005–3014. [Google Scholar] [CrossRef]
  22. Albaret, J.J. La reproduction de l’albacore (Thunnus albacares) dans le Golfe de Guinée. Cah. ORSTOM. Série Océanographie 1977, 15, 389–419. [Google Scholar]
  23. Bettarel, Y.; Combe, M.; Adingra, A.; Ndiaye, A.; Bouvier, T.; Panfili, J.; Durand, J.D. Horde of phages in the fish gut of the tilapia Sarotherodon Melanotheron. Sci. Rep. 2018, 8, 11311. [Google Scholar] [CrossRef] [Green Version]
  24. Klindworth, A.; Pruesse, E.; Schweer, T.; Peplies, J.; Quast, C.; Horn, M.; Glöckner, F.O. Evaluation of general 16S ribosomal RNA gene PCR primers for classical and next-generation sequencing-based diversity studies. Nucleic Acids Res. 2013, 41, 1. [Google Scholar] [CrossRef]
  25. Andersson, A.F.; Lindberg, M.; Jakobsson, H.; Bäckhed, F.; Nyrén, P.; Engstrand, L. Comparative analysis of korean human gut microbiota by barcoded pyrosequencing. PLoS ONE 2008, 3, e2836. [Google Scholar] [CrossRef]
  26. Perreault, N.N.; Andersen, D.T.; Pollard, W.H.; Greer, C.W.; Whyte, L.G. Characterization of the prokaryotic diversity in cold saline perennial springs of the Canadian high arctic. Appl. Environ. Microbiol. 2007, 73, 1532–1543. [Google Scholar] [CrossRef] [Green Version]
  27. Callahan, B.J.; McMurdie, P.J.; Rosen, M.J.; Han, A.W.; Johnson, A.J.A.; Holmes, S.P. DADA2: High-resolution sample inference from Illumina amplicon data. Nat. Met. 2016, 13, 581–583. [Google Scholar] [CrossRef] [Green Version]
  28. Quast, C.; Pruesse, E.; Yilmaz, P.; Gerken, J.; Schweer, T.; Yarza, P.; Peplies, J.; Glöckner, F.O. The SILVA ribosomal RNA gene database project: Improved data processing and web-based tools. Nucleic Acid Res. 2012, 41, D590–D596. [Google Scholar] [CrossRef] [PubMed]
  29. McMurdie, P.J.; Holmes, S. phyloseq: An R package for reproducible interactive analysis and graphics of microbiome census data. PLoS ONE 2013, 8, e61271. [Google Scholar] [CrossRef] [PubMed] [Green Version]
  30. Lahti, L.; Shetty, S.; Blake, T.; Salojarvi, J. Tools for Microbiome Analysis in R. Available online: https://microbiome.github.io/tutorials/ (accessed on 15 February 2019).
  31. Dixon, P. VEGAN, a package of R functions for community ecology. J. Veg. Sci. 2003, 14, 927–930. [Google Scholar] [CrossRef]
  32. Ghanbari, M.; Kneifel, W.; Domig, K.J. A new view of the fish gut microbiome: Advances from next-generation sequencing. Aquaculture 2015, 448, 464–475. [Google Scholar] [CrossRef]
  33. Mouchet, M.A.; Bouvier, C.; Bouvier, T.; Troussellier, M.; Escalas, A.; Mouillot, D. Genetic difference but fonctional similarity among fish gut bacterial communities through molecular and biogeochemical fingerprints. FEMS Microbiol. Ecol. 2012, 79, 568–580. [Google Scholar] [CrossRef] [PubMed]
  34. Kitchell, J.F.; Neill, W.H.; Dizon, A.E.; Magnusson, J.J. Bioenergetic spectra of skipjack and yellowfin tunas. In The Physiologycal Ecology of Tunas; Sharp, G.D., Dizon, A.E., Eds.; Academic Press: New York, NY, USA, 1978; pp. 357–368. [Google Scholar]
  35. Sepulveda, J.; Moeller, A.H. The effects of temperature on animal gut microbiomes. Front. Microbiol. 2020, 11, 384. [Google Scholar] [CrossRef]
  36. Sharpton, T.J. Role of the gut microbiome in vertebrate Evolution. Msystems 2018, 3, e00174-17. [Google Scholar] [CrossRef] [Green Version]
  37. Sullam, K.E.; Essinger, S.D.; Lozupone, C.A.; O’Connor, M.P.; Rosen, G.L.; Knight, R.; Kilham, S.S.; Russell, J.A. Environmental and ecological factors that shape the gut bacterial communities of fish: A meta-analysis. Mol. Ecol. 2012, 21, 3363–3378. [Google Scholar] [CrossRef] [Green Version]
  38. Givens, C.E.; Ransom, B.; Bano, N.; Hollibaugh, J.T. Comparison of the gut microbiomes of 12 bony fish and 3 shark species. Mar. Ecol. Prog. Ser. 2015, 518, 209–223. [Google Scholar] [CrossRef] [Green Version]
  39. Burns, A.R.; Stephens, W.Z.; Stagaman, K.; Wong, S.; Rawls, J.F.; Guillemin, K.; Bohannan, B.J. Contribution of neutral processes to the assembly of gut microbial communities in the zebrafish over host development. ISME J. 2016, 10, 655–664. [Google Scholar] [CrossRef] [Green Version]
  40. Heys, C.; Cheaib, B.; Busetti, A.; Kazlauskaite, R.; Sloan, W.T.; Ijaz, U.; Kaufmann, J.; McGinnity, P.; Llewellyn, M.S. Neutral processes dominate microbial community assembly in Atlantic salmon, Salmo salar. Appl. Environ. Microbiol. 2020, 86. [Google Scholar] [CrossRef] [PubMed] [Green Version]
  41. Bolnick, D.I.; Snowberg, L.K.; Hirsch, P.E.; Lauber, C.L.; Org, E.; Parks, B.; Lusis, A.J.; Knight, R.; Caporaso, J.G.; Svanbäck, R. Individual diet has sex-dependent effects on vertebrate gut microbiota. Nat. Commun. 2014, 5, 4500. [Google Scholar] [CrossRef] [PubMed]
  42. Godon, J.-J.; Arulazhagan, P.; Steyer, J.-P.; Hamelin, J. Vertebrate bacterial gut diversity: Size also matters. BMC Ecol. 2016, 16, 12. [Google Scholar] [CrossRef] [Green Version]
  43. Dragovich, A. The Food of Bluefin Tuna (Thunnus thynnus) in the Western North Atlantic Ocean. Trans. Am. Fish. Soc. 1970, 99, 726–731. [Google Scholar] [CrossRef]
  44. Dragovich, A.; Potthoff, T. Comparative study of food of skipjack and yellowfin tunas off the coast of west Africa. Fish. Bull. 1972, 70, 1087–1110. [Google Scholar]
  45. Graham, J.B.; Dickson, K.A. Tuna comparative physiology. Mar. Biol. 2004, 150, 647–658. [Google Scholar] [CrossRef]
  46. Ringø, E.; Schillinger, U.; Holzapfel, W. Antimicrobial activity of lactic acid bacteria isolated from aquatic animals and the use of lactic acid bacteria in aquaculture. In Biology of Growing Animals; Elsevier: Amsterdam, The Netherlands, 2005; Volume 2, pp. 418–453. [Google Scholar]
  47. Nayak, S.K. Role of gastrointestinal microbiota in fish. Aquac. Res. 2020, 41, 1553–1573. [Google Scholar] [CrossRef]
  48. Sivasubramanian, K.; Ravichandran, S.; Kavitha, R. Isolation and characterization of gut microbiota from some estuarine fishes. Mar. Sci. 2012, 2, 1–6. [Google Scholar] [CrossRef]
  49. Pękala-Safińska, A. Contemporary threats of bacterial infections in freshwater fish. J. Vet. Res. 2018, 62, 261–267. [Google Scholar] [CrossRef] [PubMed] [Green Version]
  50. Leisner, J.J.; Laursen, B.G.; Prévost, H.; Drider, D.; Dalgaard, P. Carnobacterium: Positive and negative effects in the environment and in foods. FEMS Microbiol. Rev. 2007, 31, 592–613. [Google Scholar] [CrossRef] [Green Version]
  51. Del Rio-Rodriguez, R.E.; Inglis, V.; Millar, S.D. Survival of Escherichia coli in the intestine of fish. Aquac. Res. 1997, 28, 257–264. [Google Scholar] [CrossRef]
  52. David, O.M.; Wandili, S.; Kakai, R.; Waindi, E.N. Isolation of Salmonella and Shigella from fish harvested from the Winam Gulf of Lake Victoria, Kenya. J. Infect Dev. Ctries. 2009, 3, 99–104. [Google Scholar] [CrossRef] [PubMed] [Green Version]
  53. Tsuda, K.; Nagano, H.; Ando, A.; Shima, J.; Ogawa, J. Isolation and characterization of psychrotolerant endospore-forming Sporosarcina species associated with minced fish meat (surimi). Int. J. Food Microbiol. 2015, 199, 15–22. [Google Scholar] [CrossRef] [PubMed]
  54. Bjornsdottir-Butler, K.; Green, D.P.; Bolton, G.E.; McClellan-Green, P.D. Control of histamine-producing bacteria and histamine formation in fish muscle by trisodium phosphate. J. Food Sci. 2015, 80, 1253–1258. [Google Scholar] [CrossRef]
  55. Hungerford, J.M. Scombroid poisoning: A review. Toxicon 2010, 56, 231–243. [Google Scholar] [CrossRef] [PubMed] [Green Version]
  56. Takahashi, H.; Ogai, M.; Miya, S.; Kuda, T.; Kimura, B. Effects of environmental factors on histamine production in the psychrophilic histamine-producing bacterium Photobacterium iliopiscarium. Food Control. 2015, 52, 39–42. [Google Scholar] [CrossRef]
  57. Trevisani, M.; Cecchini, M.; Fedrizzi, G.; Corradini, A.; Mancusi, R.; Tothill, I.E. Biosensing the histamine producing potential of bacteria in tuna. Front. Microbiol. 2019, 10, 1844. [Google Scholar] [CrossRef] [PubMed] [Green Version]
Figure 1. Fishing positions in the east Atlantic Ocean. Colored circles correspond to tuna caught from shoals near fish aggregating devices or from free swimming schools.
Microorganisms 09 01157 g001
Figure 2. Representation of alpha taxonomic diversity (Shannon index) of enteric bacterial communities (ASVs) in the three tuna species (A), and according to the size of individuals (B). Boxplots represent the distribution of the alpha taxonomic diversity within each species. Different letters indicate significant differences (KW, p < 0.05) between groups within each square. * Significant correlation between the Shannon index and fish size (Pearson, p < 0.05).
Microorganisms 09 01157 g002
Figure 3. Relative abundances of the main bacterial classes in the gut of skipjack, yellowfin and bigeye tunas, in their size group (small/medium/large). Each bar corresponds to an individual fish. Bacterial classes showing a relative abundance lower than 1% were designated “<1% abund”.
Microorganisms 09 01157 g003
Table 1. Main morphometric and sexual traits of the fish sampled in the three size categories (small/medium/large). M, male; F, female; I, Immature.
SKIPJACKYELLOWFINBIGEYE
Size ClassSize (cm)Weight (kg)SexSize (cm)Weight (kg)SexSize (cm)Weight (kg)Sex
Small30.50.6F66.15.8M71.48.0M
32.10.6I71.06.8F79.212.2F
34.80.7I75.38.7M84.415.9F
38.91.1I84.912.1F87.813.2M
40.21.4F87.813.3M94.219.8M
42.11.4I91.915.3M97.822.2F
Medium45.51.8M103.825.9I102.823.8F
46.72.1M109.328.3F109.529.9M
49.42.6F110.124.8F111.330.9F
51.02.7F116.832.3F115.736.6M
52.03.0F127.238.5F127.747.6F
55.53.9M131.350.4M132.551.7F
Large56.74.1F140.459.2M138.863.3M
59.24.7M145.258.9F142.268.5M
60.85.2M151.668.7M152.878.4F
63.57.7M158.881.9M155.090.0F
65.56.0F161.689.9M162.187.3F
67.56.0F164.371.0M166.899.9M
Table 2. Results of permutational ANOVAS (PERMANOVA, 999 permutations) performed on Bray-Curtis dissimilarity matrices to test the variation of bacterial community composition with respect to the size of the three tuna species. Bold values indicate a significant effect of the tested factor (p < 0.05).
SKIPJACKYELLOWFINBIGEYE
dfSum of SquaresF. Modelp ValuedfSum of SquaresF. Modelp ValuedfSum of SquaresF. Modelp Value
SIZE10.250.700.6810.772.020.0110.481.760.04
Residuals165.7 166.11 164.48
Total175.97 176.89 174.96
Table 3. Bacterial genera representative of the ‘Core Microbiota’ (determined with the microbiome package in R) in the gut of Skipjack, Yellowfin and Bigeye tunas, in the small (S), medium (M) and large (L) size categories. Taxa common to all the three tuna species are represented by grey squares. Red, green and blue squares correspond to unique taxa present in each species.
SKIPJACK YELLOWFIN BIGEYE
ClassGenus SpeciesSML SML SML
ActinobacteriaCorynebacterium sp.
Cutibacterium sp.
Kocuria sp.
Microbacterium sp.
AlphaproteobacteriaBradyrhizobium sp.
Brevundimonas sp.
Labrenzia sp.
Novosphingobium sp.
Paracoccus sp.
Ruegeria sp.
BacilliBrochothrix thermosphacta
Carnobacteriumsp.
Lactococcus spp.
Sporosarcina spp.
Vagococcus salmoninarum
BacteroidiaUlvibacter spp.
Vibrionimonas magnilacihabitans
ClostridiaClostridium_sensu_stricto_7 spp.
Gottschalkia spp.
Tissierella spp.
FusobacteriiaPsychrilyobacter spp.
GammaproteobacteriaAcinetobacter spp.
Acinetobacter haemolyticus
Aeromonas sp.
BD1-7_clade spp.
Enhydrobacter aerosaccus
Escherichia/Shigella sp.
Massilia sp.
Massilia timonae
Oceanisphaera spp.
Oceanisphaera ostreae
Photobacterium spp.
Photobacterium angustum
Photobacterium leiognathi
Pseudomonas spp.
Psychrobacter spp.
Psychrobacter fozii
Psychrobacter maritimus
Rahnella spp.
Shewanella sp.
MollicutesMycoplasma sp.
Publisher’s Note: MDPI stays neutral with regard to jurisdictional claims in published maps and institutional affiliations.

