Article

The Use of Stable Isotope Ratio Analysis to Trace European Sea Bass (D. labrax) Originating from Different Farming Systems

by
Francesca Tulli
1,
José M. Moreno-Rojas
2,*,
Concetta Maria Messina
3,
Angela Trocino
4,
Gerolamo Xiccato
5,
José M. Muñoz-Redondo
2,
Andrea Santulli
3 and
Emilio Tibaldi
1
1
Department of Agriculture, Food, Environment and Animal Sciences, University of Udine, Via Sondrio 2, 33100 Udine, Italy
2
Department of Food Science and Health, Andalusian Institute of Agricultural and Fisheries Research and Training (IFAPA), Alameda del Obispo Centre, Avda. Menendez Pidal, s/n, 14004 Córdoba, Spain
3
Laboratory of Marine Biochemistry and Ecotoxicology, Department of Earth and Sea Science, University of Palermo, Via Barlotta, 4, 91100 Trapani, Italy
4
Department of Comparative Biomedicine and Food Science, University of Padova, Viale dell’Università 16, 35020 Legnaro, Padova, Italy
5
Department of Agronomy, Food, Natural Resources, Animals and Environment, University of Padova, Viale dell’Università 16, 35020 Legnaro, Padova, Italy
*
Author to whom correspondence should be addressed.
Animals 2020, 10(11), 2042; https://doi.org/10.3390/ani10112042
Submission received: 21 October 2020 / Revised: 29 October 2020 / Accepted: 2 November 2020 / Published: 5 November 2020
(This article belongs to the Special Issue Animal Products Quality and Characterization)

Abstract

:

Simple Summary

European sea bass is one of the most economically important fish species in the Mediterranean area. The potential effects of farming systems on the final quality of this product and the recent popular demand for labels to certify the animal rearing origin, which is increasingly used as a marketing tool, have raised the use of analytical techniques that make it possible to differentiate this fish product according to the rearing farming system and authenticate their geographical origin. The aim of this study was to determine whether isotopic ratio mass spectrometry (IRMS) can discriminate farmed European sea bass according to different farming systems (concrete tank inland, sea cages, and extensive methods in valleys or salt works) and geographic origins (different locations scattered throughout Italy). The results of this study showed the viability of δ13C and δ15N to discriminate cultured sea bass from different farming systems (extensive vs. intensive) reared at different geographical sites in Italy. Meanwhile, the measurement of δ18O and δ2H made it possible to distinguish the geographical origin of the sea bass farmed extensively and intensively (in cages).

Abstract

This study aimed to determine whether isotopic ratio mass spectrometry (IRMS) can discriminate farmed European sea bass according to different farming systems and geographic origins. Dicentrarchus labrax of commercial size from three different rearing systems (concrete tank inland, sea cages, and extensive methods in valleys or salt works) were collected at the trading period (autumn–winter). For each farming type, different locations spread over Italy were monitored. Once the fish were harvested, the muscle and feed were sampled. For both muscle and feed, δ13C and δ15N were measured by continuous flow elemental analyzer isotope ratio mass spectrometry (CF-EA-IRMS) with the goal of discriminating samples based on the rearing system. Additional δ2H and δ18O measurements of fish samples were performed by continuous flow total combustion elemental analyzer isotope ratio mass spectrometry (CF-TC/EA-IRMS) to track the geographical origin. The measurements of δ13C and δ15N made it possible to discriminate cultured sea bass from different farming systems (extensive vs. intensive) reared at different geographical sites in Italy. Additional information was obtained from δ18O and δ2H, which enabled the geographical areas of origin of the sea bass farmed extensively and intensively (in cages) to be distinguished.

1. Introduction

In recent years, the trade of seafood has experienced strong growth due to the rising world population and increases in the annual consumption per capita of seafood from 9.9 kg in the 1960s to over 20 kg in 2013 [1]. In 2013, fish accounted for 17% of the global population’s intake of animal protein and 6.7% of all protein consumed [1]. Consequently, international trade of fish products has addressed the evolution of food safety and food quality issues as emphasized by several EU Directives introduced into the chain for fisheries and aquaculture products with the concept “from farm to fork” usually based on the Codex Alimentarius provisions. In addition, national and transnational regulations regarding meat traceability have been imposed (European Regulation (EU) n. 1379/2013) to ensure more accessible details for retailers and consumers about labeling, packaging, and origin of wild capture and aquaculture products. In this respect, consumers are more and more concerned about the origin of foodstuffs for both health and ecological reasons, and food quality has become an essential parameter for their consumer preferences. Therefore, product differentiation appears to be a fundamental issue for the further development of the fish farming industry distributed around the whole Mediterranean area involved in different rearing and environmental systems.
The potential effects of different fish farming systems involve modifications to the final product quality such as fish appearance, organoleptic properties or even nutritional characteristics [2]. Feeding and breeding conditions are known to affect the nutritional quality of the fillet, the high content in essential polyunsaturated omega 3 and omega 6 fatty acids of wild fish and suitably fed farmed fish being of note [3]. Linked to, but different from, consumers’ demand for fish quality standards is the public perception that aquaculture can harm the environment [1]. In recent years, intensive farming has led to misperceptions and mistrust among consumers. Thus, authorities have acknowledged the need for labels that certify animal health and welfare, food safety and quality, environmental integrity, and social responsibility associated with aquaculture. The aims of such labels are (i) to reassure producers, buyers, consumers and civil society regarding the quality and safety of aquaculture products, and (ii) to provide a further tool to support responsible and sustainable aquaculture. A popular demand for labels to certify the animal rearing origin has emerged over the last years since, and, according to formal regulation, it is increasingly used as a marketing tool rather than a designation of quality and safety. Thus, besides being a tool to guarantee food safety, tracking, and traceability, these labels are also of major interest to retail business as a powerful communication tool aimed at improving consumer confidence [4,5,6,7,8,9,10]. However, food products with geographical indications and designation of origins following the European Regulation (EU) n. 1151/2012 are generally expensive but bring greater benefits to the producers than ordinary products. In this sense, consumers seem to be prepared to accept higher prices linked to superior quality, certification of the production process and the product origin.
European sea bass (Dicentrarchus labrax L.) is one of the most economically important fish species in the Mediterranean area [11] as it is one of the most requested marine species for its overall quality, with an interesting polyunsaturated fatty acid (PUFA) content 0.58 g/100 g of docosahexaenoic acid (DHA, 22:6(n − 3)) and 0.44 g/100 g of eicosapentaenoic acid (EPA, 20:5(n − 3)) (EC, 2015 [12]). Sea bass is found in the Mediterranean area in a variety of different culture systems including highly intensive recirculating systems, flow through concrete raceways or pond systems, floating sea cages, as well as traditional extensive pond systems located in highly environmentally sensitive areas [2]. Currently, intensive systems are the most common rearing method in this area due to a higher production yield [13]. Many publications have considered the authentication and quality of sea bass in relation to different factors, such as eco-physiological factors, diet, rearing condition, and differences between wild and farmed fish, but the reported results refer to a limited period of time, a restricted geographical area, or to only one type of culture system compared to the wild [2,14,15,16,17,18,19,20,21,22,23].
Despite the attention given to these issues, mislabeling, whether accidental or fraudulent, is expected to occur [24]. In the last few years, an increase in such mislabeling concerning the product processing and fish origin has been reported [25]. Therefore, new tools enabling simple and accurate discrimination between farming systems and authenticating their geographical provenance would be extremely valuable. Stable isotope ratio mass spectrometry (S-IRMS) could be used as an alternative tool to PCR-DGGE techniques that have been recently proposed to indirectly discriminate the geographical origin of fish by the analysis of the DNA fragments of microorganisms [26]. The isotopic content of an animal’s diet is known to affect the isotopic ratio of its meat [27,28,29]. For this reason, IRMS has previously been used for ecosystem studies [30,31], for fish and shellfish specifically, food web assessment [32,33,34,35], and back calculations of diet [36,37]. The technique was also used to enable geographical sourcing for plants and animals [38,39,40,41]. The ability of IRMS to thoroughly characterize a sample and therefore accurately discriminate different samples, makes it a powerful forensic tool to detect fraud [42,43].
In general, animals, and, in particular, fish are a complex substrate for the interpretation of isotopic enrichment as the abundance of stable nitrogen (δ15N) and stable carbon (δ13C) isotopes are the result of both the feed ingested as well as the fractionation occurring through the metabolic processes. The first application of stable isotope analysis in fish product authentication is quite recent [44]. Based on the assumption of the different isotopic signature of the feeding relationships in aquatic environments between natural food webs and fish reared on feed, wild and farmed Atlantic salmon were successfully discriminated by the relative abundances of N and C isotopes in their fillets. This technique has been successively proposed for the unequivocal discrimination of wild and cultured sea bass [14,45], sea bream [46,47], shrimp [48], other fish [49,50], or even for the differentiation of different species in the same family (gadoids) [51]. In contrast, only a limited number of applications are available for differentiating cultured fish farmed according to different types of diet [37,52,53], farming system or different regions of a relatively small area [54]. δ13C and δ15N have demonstrated potential for the geographical discrimination of wild fish [55], but limitations exist as it depends on the feeding habits of the animals. In this regard, the 2H/1H and 18O/16O ratios have been proven to be very useful to trace the geographical origin of a food product as their abundance largely reflects climatic differences depending on temperature, latitude, altitude, and distance from the sea [56,57]. According to this, the measurement of the stable isotope ratios of hydrogen and oxygen are applicable to the characterization of geographical origin because they are strongly latitude dependent. This was the case of different food products from different countries previously reviewed by [58]. Therefore, isotope analysis is considered to be an excellent tool for origin assessment [59] in the specific case of fish products due to the global nature of production and the variable point of origin, and also taking into account the different rearing systems in use, this tool appears to be of even more interest.
This study aimed to determine whether isotopic ratio mass spectrometry (IRMS) makes it possible to discriminate farmed European sea bass raised in extensive or intensive systems. For that purpose, the muscle of three types of commercially farmed sea bass from different systems (intensively inland basin, intensively sea cages in the sea, and extensive coastal lagoon) and locations in Italy were sampled to determine whether it was possible to discriminate the rearing systems and geographical origins.

2. Materials and Methods

2.1. Description of Experimental Design, Fish Sampling and Farms

We purchased the fishes uses in this study from the commercial farms. The farms used the procedures according to the commercial standards and regulations (Reg. (CE) N. 1099/2009).
One-hundred-seventy-five European sea bass (Dicentrarchus labrax) were sampled for one month (December–January) from 11 aquaculture plans (10–20 specimens per farm) representative of different farming systems: extensive (E; n = 4), intensive in sea cages (C; n = 3), and intensive inland (I; n = 4) farms. The location and the main characteristics of the selected farms are reported in Table 1 (map, Figure S1). One of the extensive farms (E3) also used commercial feed, as supplier declared after additional requests on our part once we obtained the isotopic data. Commercial fish from the suppliers were slaughtered in an ice slurry according to the commercial standards of each farm, put in polystyrene boxes covered with ice, and stored at the university laboratories at 24 °C until processed within the 24 h after death. All the fish were subjected to linear biometry (total length, total weight) and dissected to recover right and left fillets that were freeze dried for further analytical purposes. The feed distributed in the last rearing period was also collected for each sampling site (except for the extensive farms), and the main hydrological characteristics were also monitored during the experimental period.

2.2. Composition Analysis

Dry matter (AOAC method 934.01), protein by the Kjeldahl method (AOAC 920.53), and lipid [60] contents were determined in the fresh and minced left fillets without skin obtained after dissection and on the minced feeds. To analyze the lipid fraction and de-lipidize the sample (residual from chloroform: methanol extraction) for their stable isotope ratio (SIRA) we followed the previously mentioned procedure recovering the residue after lipid extraction of the freeze-dried sample.

2.3. Isotopic Measurements, Standards and Equations

The stable isotope ratios (13C/12C, 15N/14N, 18O/16O and 2H/1H) were measured on dried samples obtained after pooling 5 fish fillet muscle samples per farm. The values for δ13C and δ15N were measured by continuous flow (ConfloII) elemental analysis isotope ratio mass spectrometry (CF-EA-IRMS) using an EA 1108 CHN elemental analyzer (ThermoFisher, Milan, Italy) (oxidation column temperature: 1050 °C; reduction column temperature: 650 °C; and gas chromatography column: 65 °C) coupled to a DeltaPlus mass spectrometer (ThermoFisher, Milan, Italy). The values for δ18O and δ2H were measured by continuous flow (ConfloII) total combustion elemental analysis isotope ratio mass spectrometry (CF-TC-IRMS) using a TC/EA (ThermoFisher, Milan, Italy) (pyrolysis column temperature: 1450 °C and gas chromatography column: 45 °C) coupled to the previously described IRMS instrument. As fish muscle has a C/N ratio of less than 5:1, the CF-EA-IRMS system operated in the dual isotope mode, allowing δ13C and δ15N to be measured on the same sample. Complete feeds were analyzed in single mode, meaning that δ13C and δ15N were analyzed in separate analyses due to the different ratio of C/N for each diet and, therefore, different quantities were weighed for each one. The results of carbon (δ13C) and nitrogen (δ15N) isotope ratio analyses were reported in per mill (‰) on the relative δ-scale and referred to the following international standards: V-PDB (Vienna Pee Dee Belemnite) for the carbon isotope ratio and atmospheric air for the nitrogen isotope ratio. In the same way, the oxygen (δ18O) and hydrogen (δ2H) isotope ratio analyses were reported in per mill (‰) on the relative δ-scale and referred to the international standard V-SMOW (Vienna Standard Mean Ocean Water) for both oxygen and hydrogen isotope ratios.
All the results were calculated according to the following equation,
Delta (‰) = [(RSample/RReference) − 1] × 1000
where R is the ratio of the heavy to light stable isotope (e.g., 15N/14N) in the sample (RSample) and in the standard (RReference).
The precision (standard deviation) of the analysis of laboratory standard (urea) for δ13C was ± 0.11‰ (n = 10) and ± 0.15‰ for δ15N (n = 10). To evaluate the precision of the fish muscle sample analyses, one sample was repeatedly measured (n = 10) with a calculated standard deviation of ± 0.09‰ for δ13C and ±0.12‰ for δ15N. The remaining muscle samples were analyzed in triplicate with a standard deviation lower than 0.15‰ for δ13C and 0.20‰ for δ15N measurements. In addition, the diets and their ingredients were analyzed in triplicate with a standard deviation lower than 0.21‰ for δ13C and 0.27‰ for δ15N measurements. International standard USGS-40 (δ13C = 26.39‰ and δ15N = 4.52‰) was analyzed at the beginning and at the end of each run to check the instrument functioning. Moreover, one sample of fish muscle was calibrated against the international reference materials IAEA-CH7 (δ13C = 32.15‰) and IAEA-CH6 (δ13C = 10.4‰) for carbon and IAEA-N1 (δ15N = 0.45‰) and IAEA-N2 (δ15N = 20.39‰) for nitrogen ratios, respectively, and used as the working standard. This working standard was analyzed at regular intervals in each run to control the repeatability and to correct the possible drift deviations in the measurements. In the same way, international standard IAEA-601 Benzoic acid (δ18O = 23.3‰) and IAEA-CH7 Polyethylene (δ2H = 100.3‰) were analyzed at the beginning and end of each run to check the instrument functioning when measuring δ18Oand δ2H. The standard deviation of the measurements (n = 10) determined using the respective reference gas was ±0.10‰ for δ18O and ± 0.8‰ for δ2H. Each sample of fish muscle was analyzed in triplicate to obtain data representative of the material. The standard deviation for the analyses was <0.5‰ for δ18O and <3.0‰ for δ2H.

2.4. Statistics

A one-way analysis of variance (ANOVA) was applied to study the differences among the farming systems. The level of significance was set at p < 0.05. The Duncan post hoc test was used for comparison of means. All statistical analyses were performed using SPSS/PC Release 17 for Windows (SPSS Inc., Chicago, IL, USA).

3. Results and Discussion

3.1. Biometric Measurements and Proximate Composition

The size distribution of the fish sampled is presented in Table 2 and reveals an unbiased size distribution among the different farming systems in the 11 fish farms. The average fish weight varied from 552 g to 663 g and the average total length of the fish varied from 36.3 cm to 38.0 cm. The farming system significantly affected the chemical composition of the fillet (Table 2). The fillets of sea bass from the extensive systems exhibited a lower lipid content (2.7%) and higher moisture levels, making them readily distinguishable from the intensively reared fish. The fish reared in cages presented a significantly lower fat content in fillets than the fish kept in intensive land-based farms (7.1% vs. 8.9%).

3.2. Isotope Ratio Values in Feed and Animal Tissues

3.2.1. Influence of the Defatted Process on Isotopic Data of Fish Muscle Tissues

As lipids are depleted in 13C relative to the other major components (protein and carbohydrate), the variation in lipid content affects the δ13C of the whole muscle and in some cases the δ15N value. For this reason, defatted muscle is generally considered to enable more accurate and precise tissue comparison [61]. The effect of lipid extraction on δ15N remains unclear due to the limited number of studies and inconclusive results obtained in marine organisms [62,63,64,65]. According to Serrano et al. [47], no significant differences were observed in δ15N values between tissues with and without lipids. Additionally, the same authors demonstrated that the influence of lipid depletion in 13C is dependent on the tissues studied. δ13C values are clearly correlated with the lipid content of the tissue, liver, red muscle, and gills presenting significant differences in δ13C value when lipids are removed, while no significant differences were observed for the white muscle and gonads. In order to clarify the importance of the 13C depletion of lipids in our dataset, nine samples from the C4 farm (fish in sea cages) were extracted and two subsamples were obtained from each one: lipids and defatted muscle. An analysis was performed on the δ13C, δ15N, and δ2H values for the whole muscle sample, the lipid fraction extracted from the muscle, and the defatted muscle, the results being shown in Table 3. In our case no significant differences were observed in δ15N values between tissues with and without lipids. The depletion in 13C linked to lipids can be observed in the lower δ13C values obtained for lipid fraction and the significant differences found for δ13C values between tissues with and without lipids. Similar conclusions can be drawn for the δ2H values. The lipid fraction shows an important depletion in 2H and therefore significant differences can be observed in the δ2H values between the whole and the defatted muscle samples. In this research, the well documented δ13C contribution was witnessed and the contribution of δ2H has been studied for the first time; the discrimination of the diet and geographical origin of whole muscle from European sea bass was still possible and no lipid extraction was performed in order to avoid this time-consuming step.

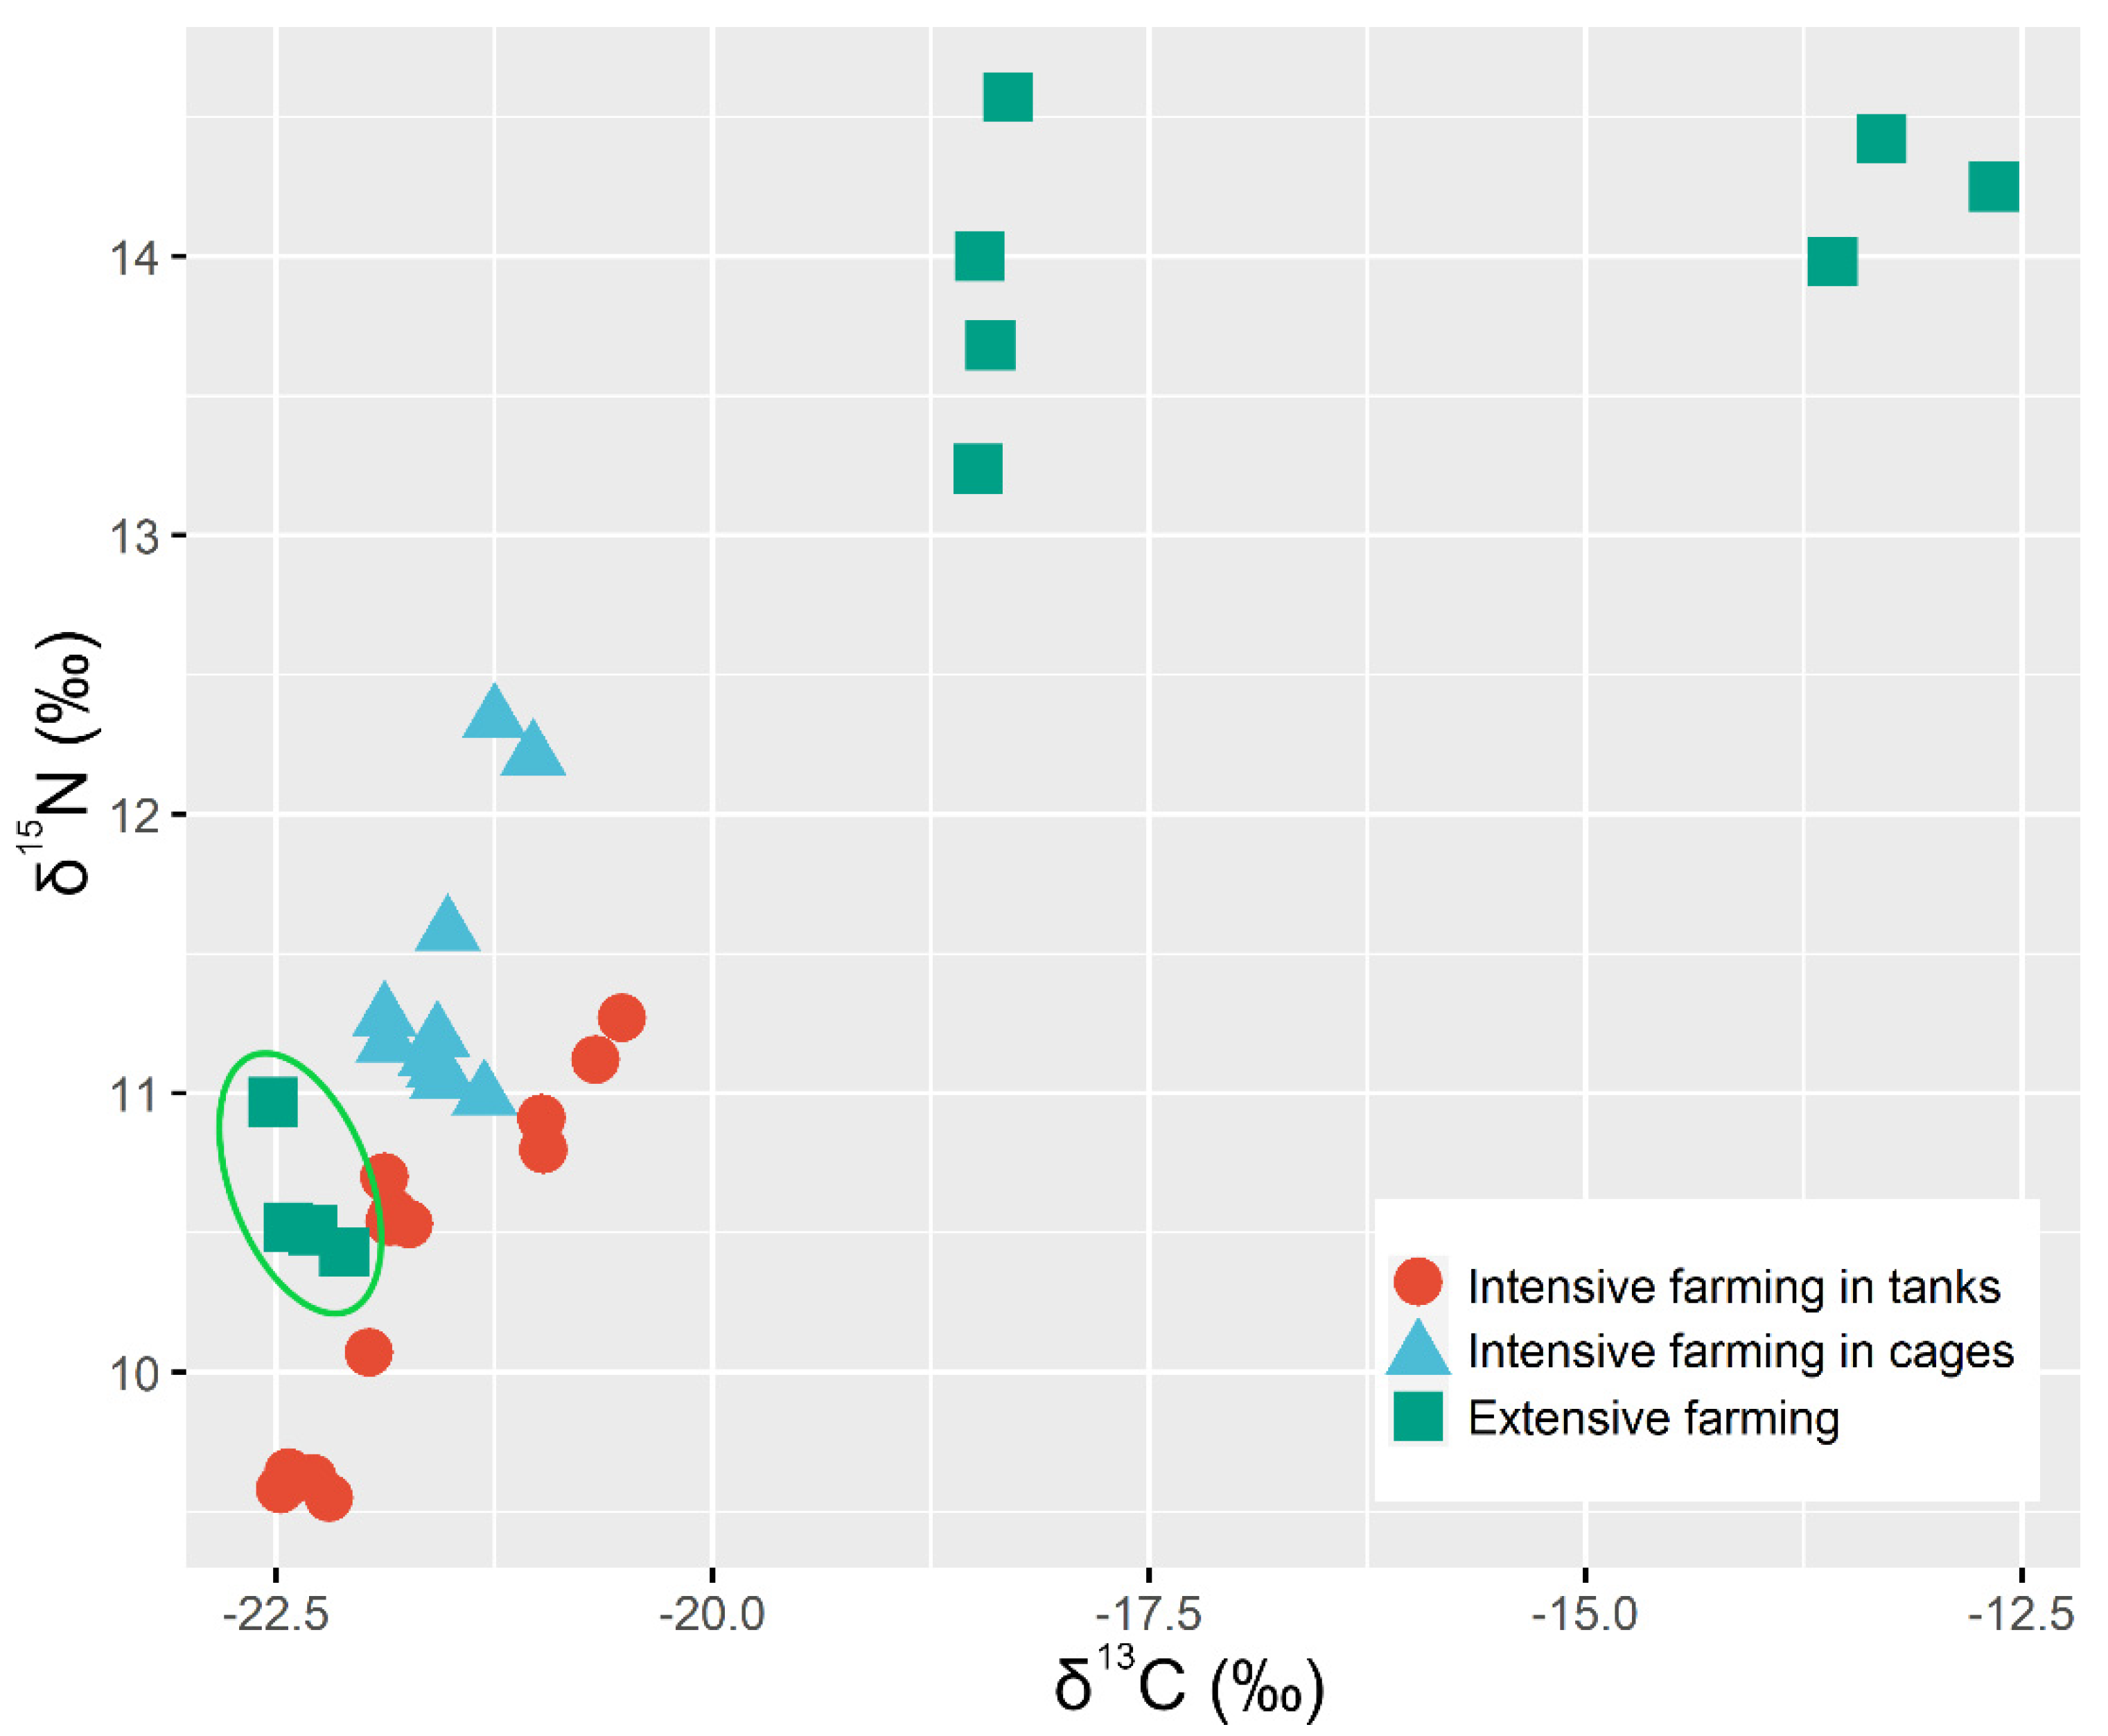
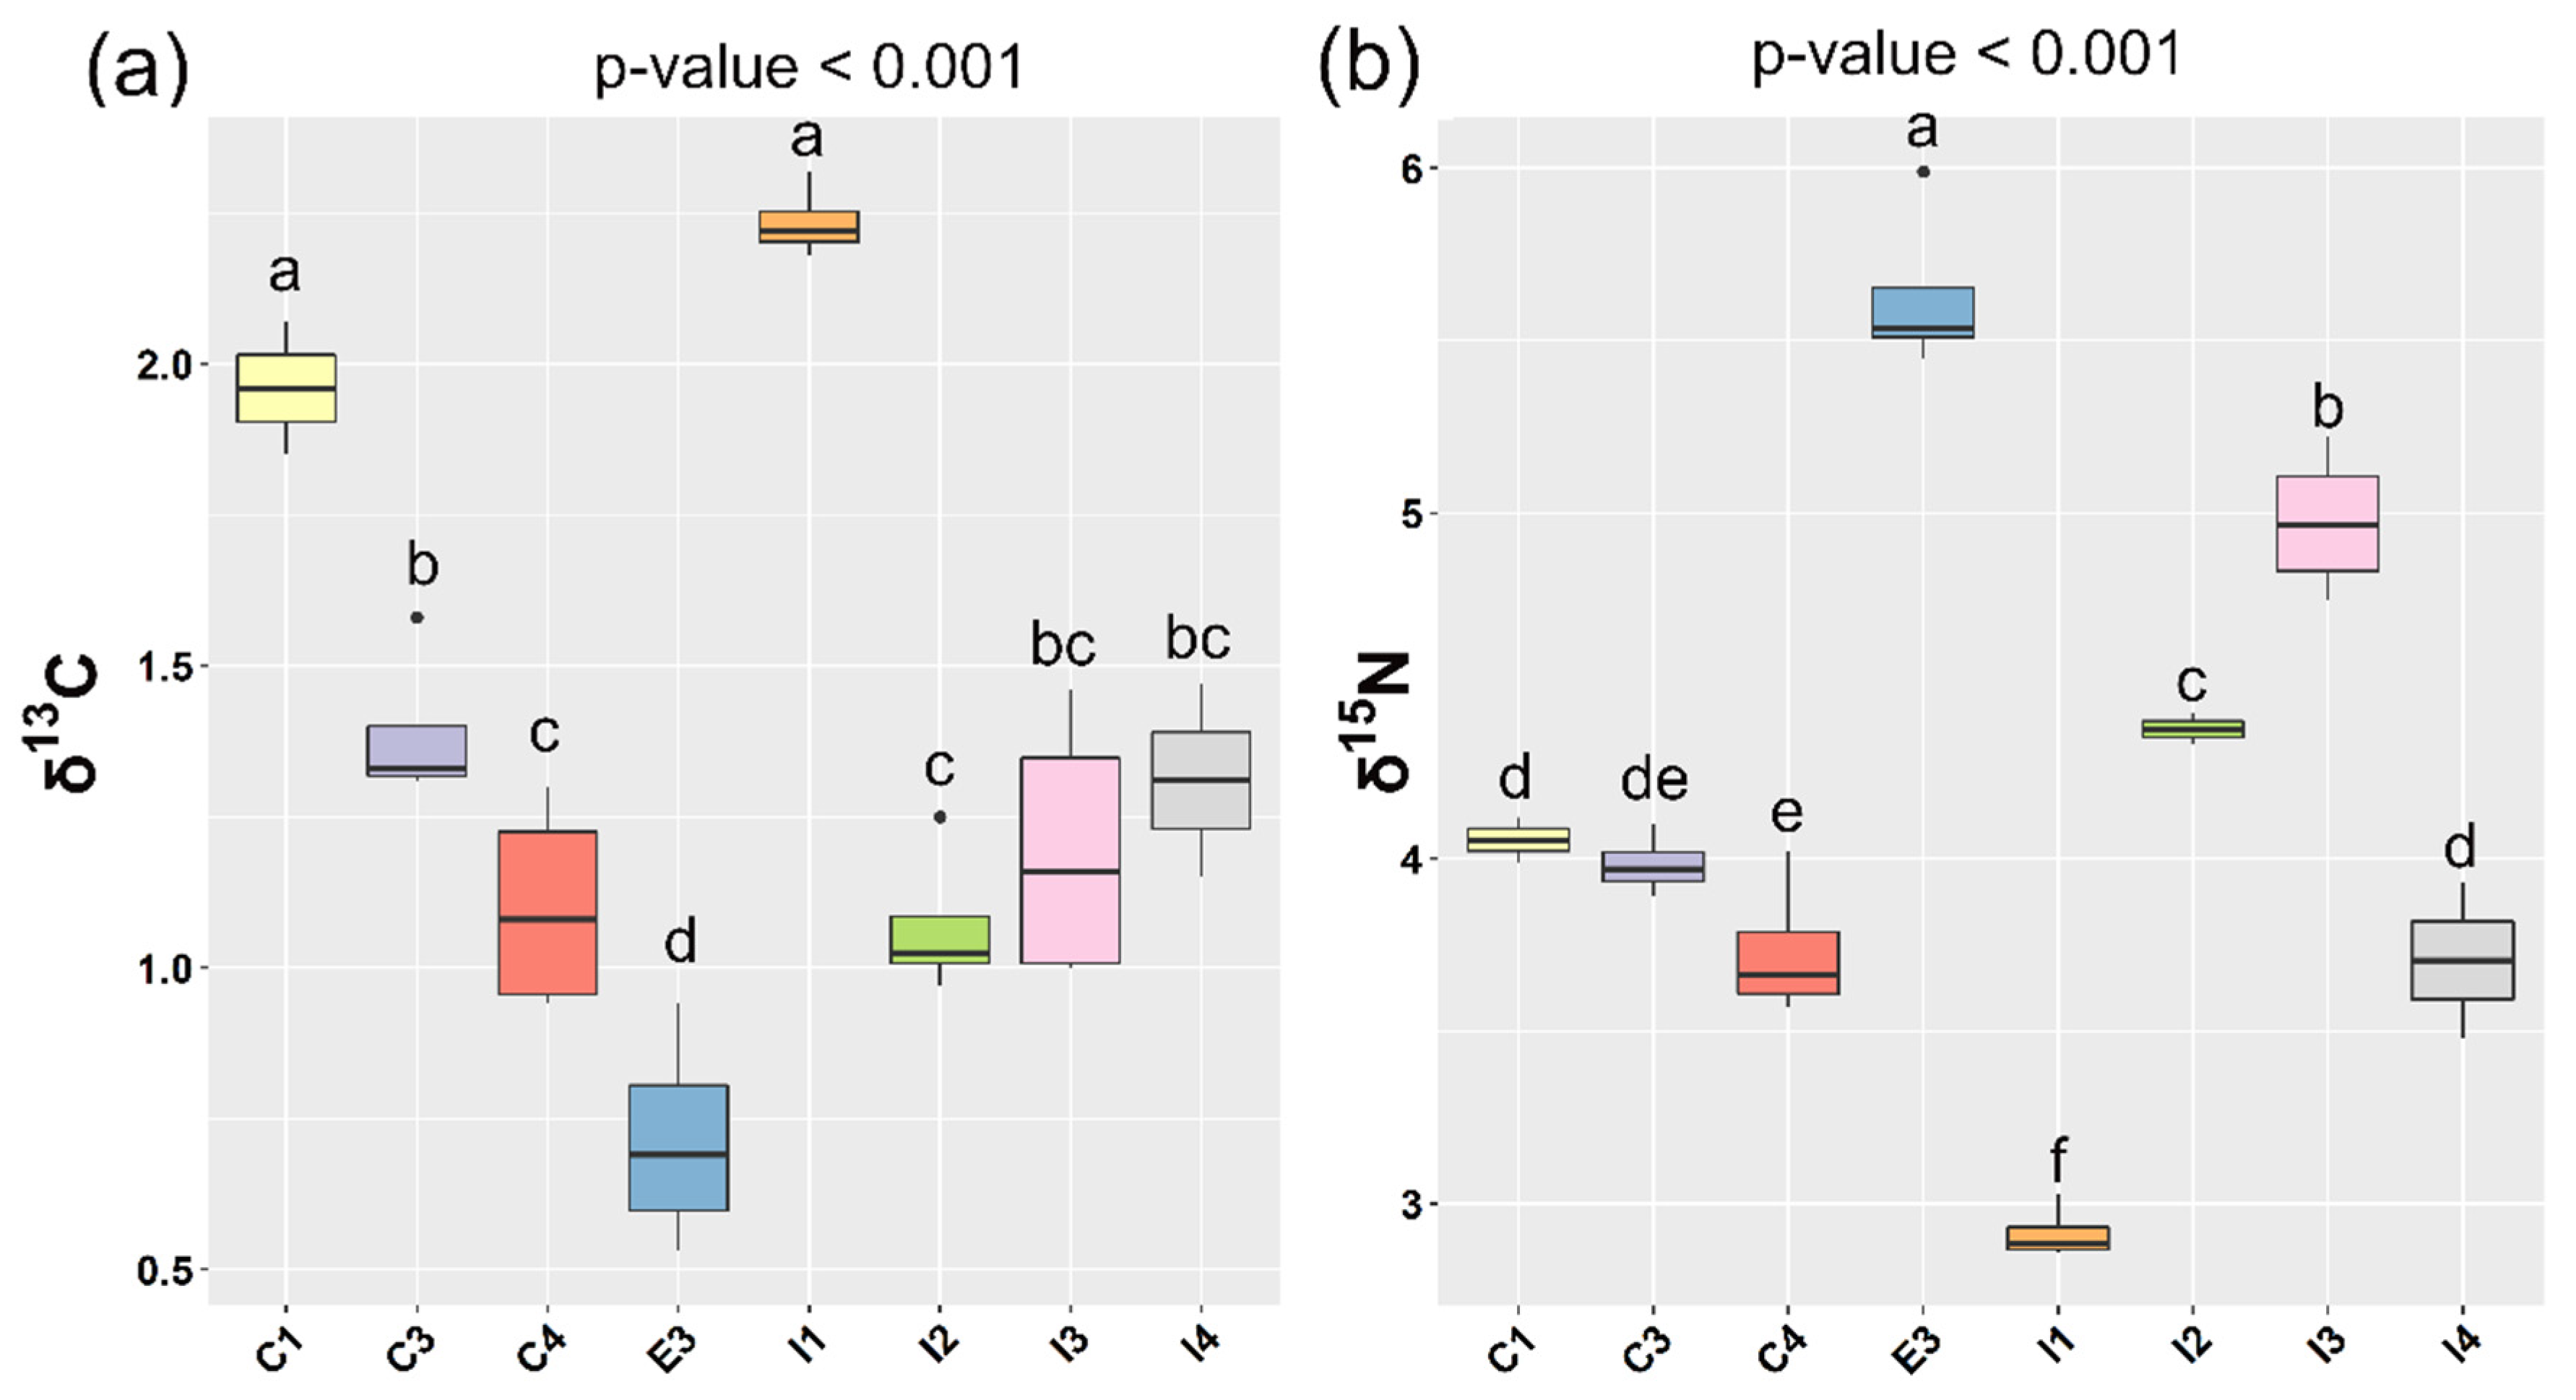
3.2.2. Discrimination of Farming System

The muscle from extensively farmed fish (E) exhibited less negative δ13C values compared to fish reared intensively inland (I) and in sea cages (C) (Table 2); this makes it possible to discriminate the farming system and is consistent with previous data found in literature based on wild and farmed fish discrimination [14,46,66,67]. The differences in the isotopic values of the three fish rearing groups were clearly reflected in significantly different carbon and nitrogen isotope values in the sea bass fillets (Table 2). The average values for δ13C were −16.17‰ for extensively reared sea bass, and −21.87‰ and −21.52‰ for sea bass intensively reared in tanks inland and in sea cages, respectively. The average δ15N values obtained were 14.02‰ for the extensively reared sea bass, and 10.38‰ and 11.40‰ for intensive sea bass reared inland in tanks and in cages in the sea, respectively.
According to the studies published by DeNiro et al. [27,28], the slight enrichment in δ13C and δ15N of the animal’s tissues compared with the values found in their diets was named trophic shift. In extensive farming, fish growth is limited by the availability of the natural food supply, and fasting has been reported to affect the isotopic composition of different species. In fact, the amount of food consumed, as well as its dietary composition, are known to affect the trophic shifts of C and N in fish [61,68,69,70]. The δ13C values of the sea bass from the E3 farm, an extensive system with diet supplementation, placed them inside the “Intensive population” (Figure 1). The use of a commercial diet had measurable consequences on the isotopic composition of fish muscle that was more important than other growing parameters such as physical activity (extensive system). Meanwhile, a significant increment in δ13C and δ15N values was found in the muscle of the rest of extensive compared to the intensive farmed fish (Figure 1), in agreement with previous findings in wild turbot [71]. While the isotopic values of the sea bass reared in intensive farming systems remained mostly constant, the δ13C values for the extensive farming fish displayed a significant variation (Figure 1). This may be explained by the controlled food type and dose applied to the intensive farming, as long as the wild sea bass faces with different food availability with scarcity periods into which the fish need to use its body stores. Therefore, farmed fish is expected to show more negative values of δ13C than the wild fish, since its diet is less variable and richer in fat, resulting in muscles with higher lipid content that induces larger isotopic fractionation of δ13C [71]. The δ15N values depend on the content, origin, and type of proteins supplemented during the diet of fish. The main natural diet of wild sea bass is hard crabs and various small fishes, depending upon the geographical location. However, protein from different origins (animal or vegetable) can be supplemented during the diet of farmed sea bass, so that the variation in δ15N values found between wild and intensive sea bass may be influenced by the natural or administered diet [37,71].
In our experimental work, the metabolic assimilation of the feed was reflected in the muscle of the fish with the characteristic trophic shift, defined as the difference between the mean muscle isotopic signature of a group and that of its respective diet. The Δδ13C and Δδ15N values (Table 4 and Figure 2) found for fish reared intensively inland ranged from 1.07‰ to 2.24‰ and from 2.95‰ to 4.98‰, respectively. The values found for fish reared intensively in sea cages ranged from 1.10 to 1.96 for δ13C and from 3.73 to 4.05 for δ15N. Finally, the values for the trophic shift found for the “semi-extensive” group (E3) of fish were 0.72‰ and 5.63‰ for carbon and nitrogen, respectively. The δ13C and δ15N enrichment between muscle and diet values obtained in the present study was in agreement with the literature [27,28,72,73,74], 1–3‰ for δ13C and 1.3–5.3‰ for δ15N. Of note were the sea bass reared “semi-extensively” as the values found for their trophic shift were slightly different to the ranges found in literature. The explanation for those differences is probably due to the rearing conditions of those animals, whose artificial diet was also supplemented by natural prey found in the extensive location in which they were reared [75]. Clear differences in the trophic shift were also observed within both intensive farming systems (sea cages and inland tank) (Figure 2). The temperature regime of the growth media and food deprivation due to differences on feeding frequency and quantity of the intensive systems may affect the fish isotopic values [76].

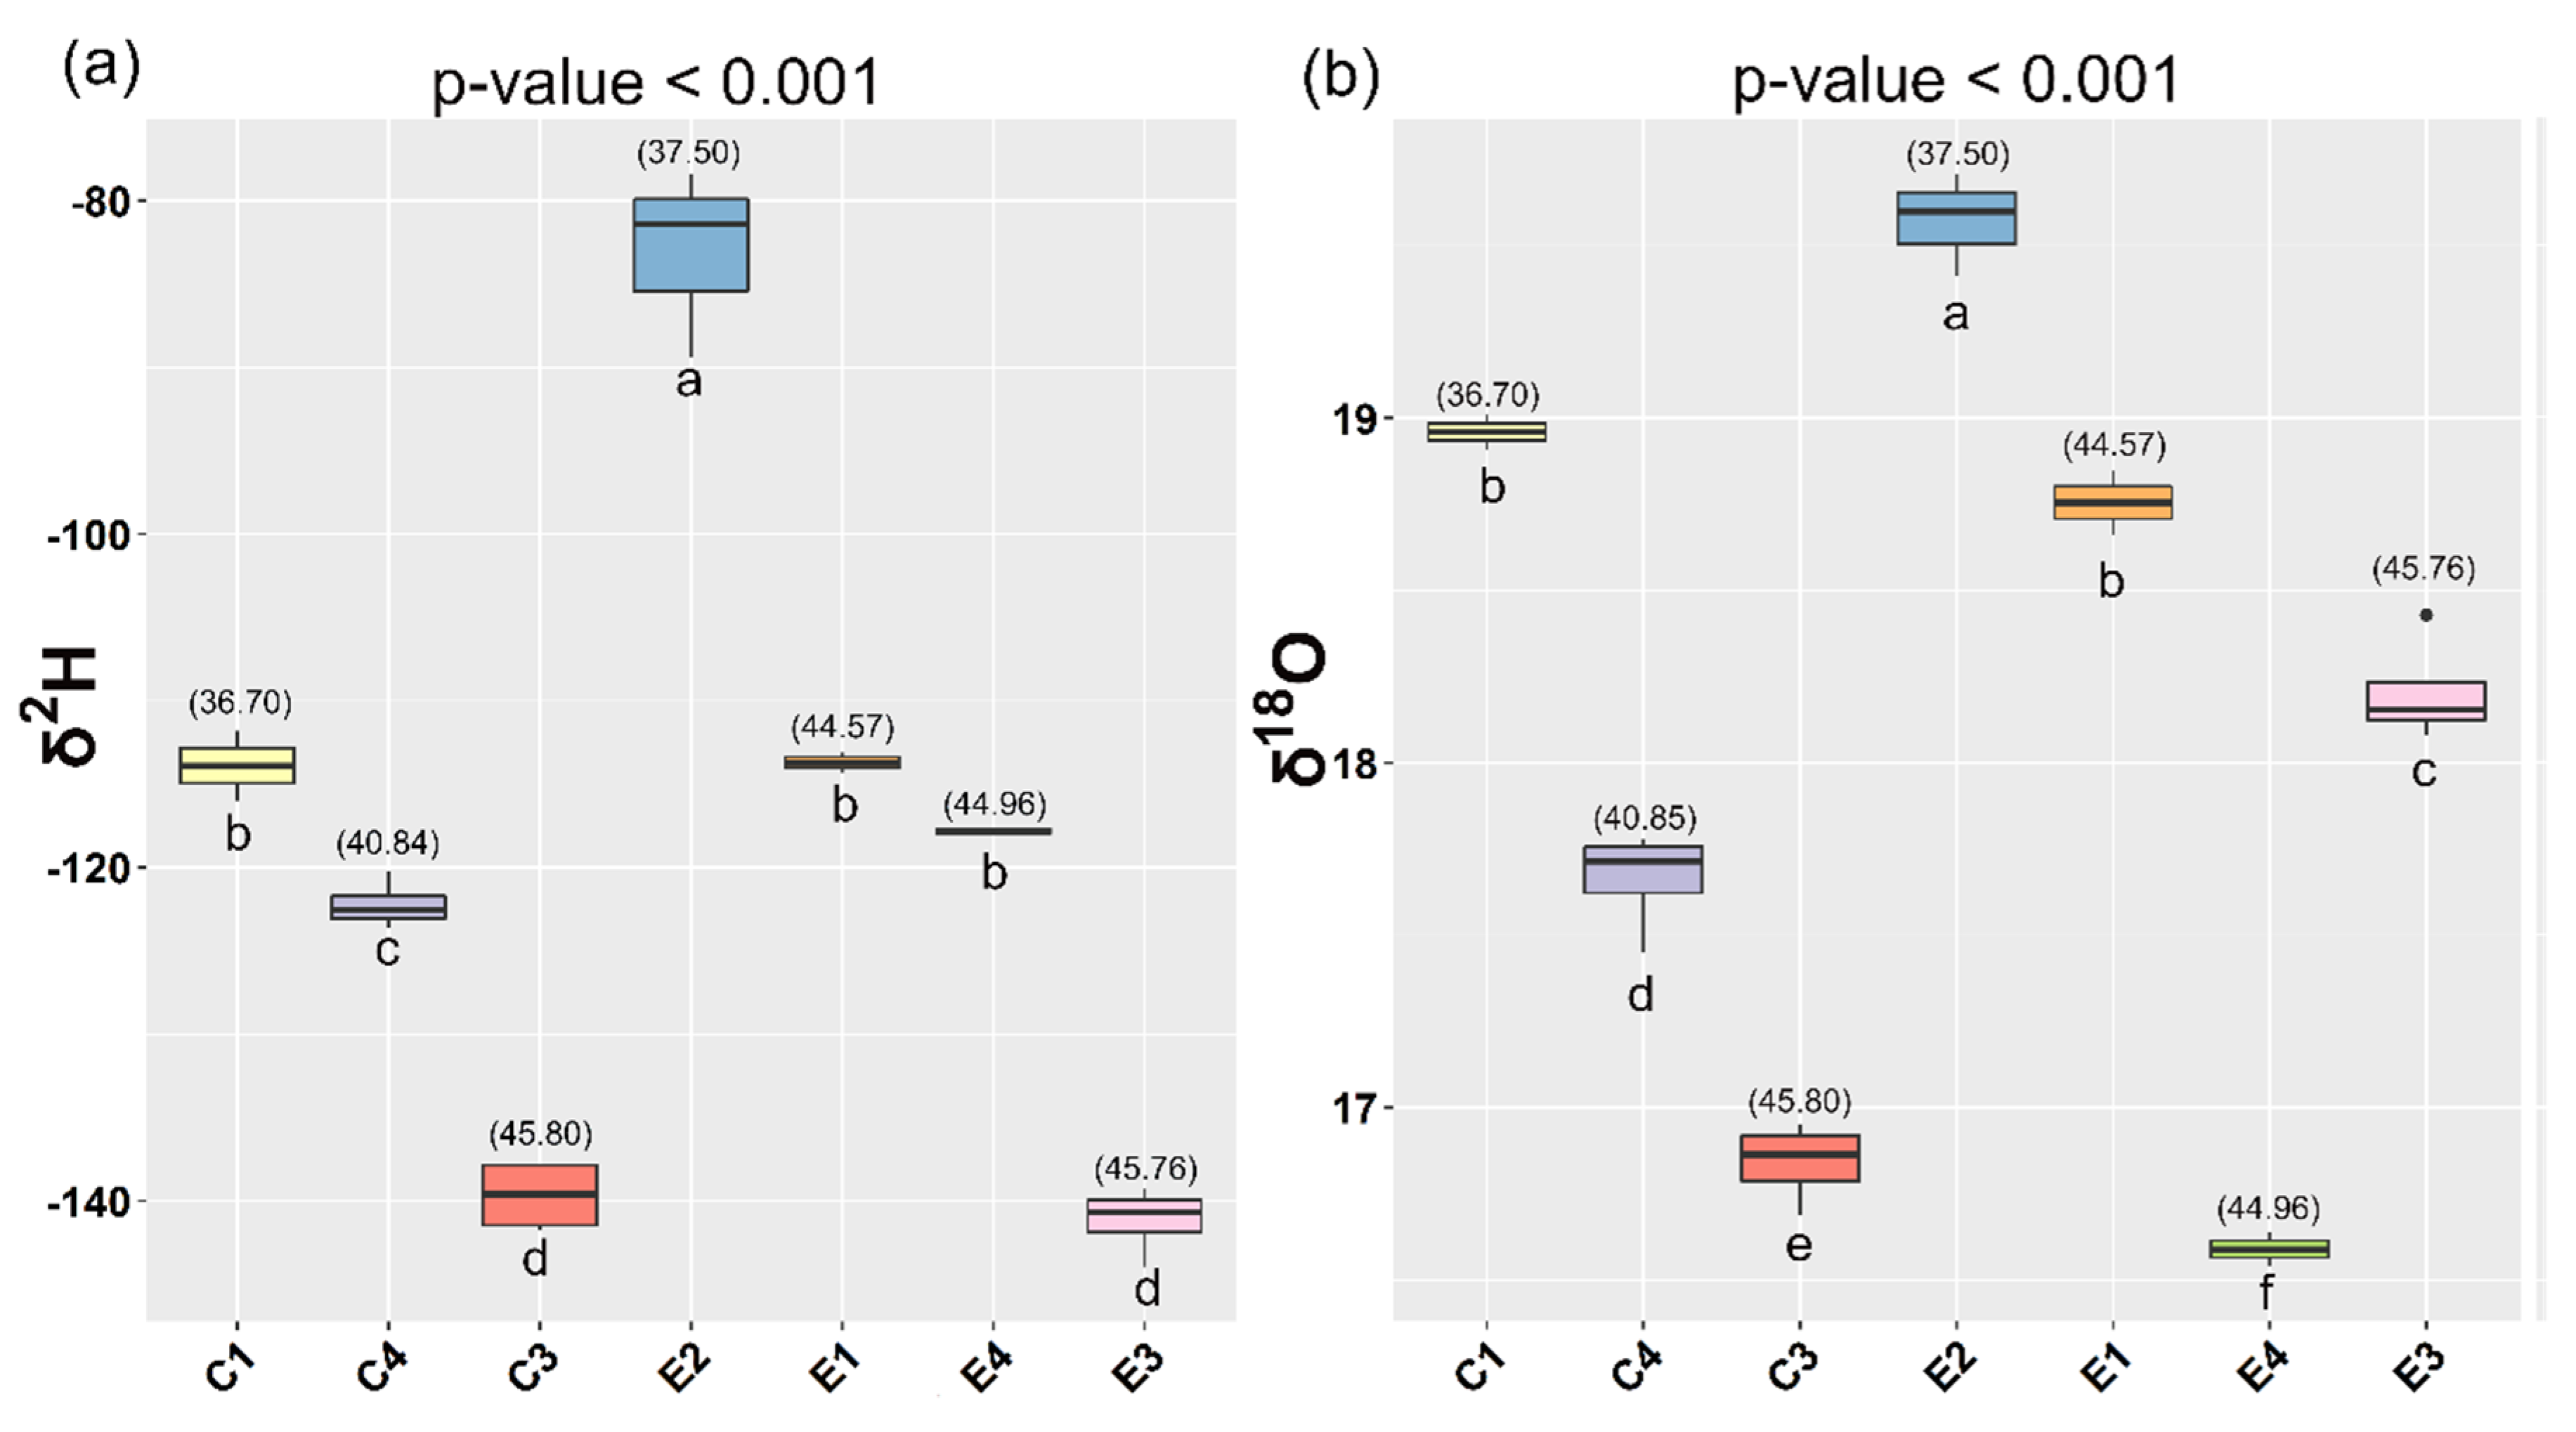
3.2.3. Geographical Origin Discrimination

Regarding the geographical origin of the extensively farmed fish samples, the δ2H and δ18O ratios of the sea bass muscle presented powerful markers. The wild samples belonging to the southern location (37.50° N) showed the most enriched δ2H and δ18O values (Figure 3) compared to the northern locations (44.57° N, 44.96° N, and 45.76° N). Both isotope ratios for fish muscle are dominated by the isotopic composition of the water ingested by the fish [39,67] and controlled by regional climatic conditions and temperature [77]. The differences in δ2H and δ18O for the muscle samples are therefore reflecting the different geographical latitudes of the three locations. Therefore, understanding the spatial distribution of these stable isotopes to determine the geospatial origin of water gives valuable information to provide evidence for geographical differentiation.
Additionally, geographical discrimination for intensively reared sea bass was attempted based on the isotopic signatures. A geographical correlation was found for the fish reared under the intensive system in sea cages between their origin and their hydrogen isotope values (Figure 3). These results demonstrated the strong correlation between the δ2H ratio of the muscle, and the hydrogen isotope composition of the sea water as previously concluded for the extensively reared sea bass. However, no patterns were identified for the fish reared under intensive inland tank systems and their isotope signatures, probably due to the complex water supply, which is often a mixture of marine, inland, and well sources. In Supplementary Figure S1, two maps of isotope ratios in annual average precipitation for hydrogen and oxygen are shown. In general terms, δ2H and δ18O values were less negative from the southern to the northern of Italy and the coastal areas. As it can be seen in Figure 3, this behavior was reflected in the isotopic values of fish reared under the same system (sea cages or extensively one). However, some differences were observed between both systems, which displayed a constant shift of about 30–35 δ2H values in sea bass from near geographical areas in spite of showing similar δ2H of water obtained from the precipitation map, with the exception of the “false declared” extensive E3 (Supplementary Figure S1 and Figure 3), whose hydrogen isotopic value was more similar to the fish reared in the intensive sea cages. This behavior may be explained by the nature of this farming system, since the sea bass from E3 reared in lagoon water are expected to be more affected by evapotranspiration and precipitation in comparison to the sea bass reared in the sea. Meanwhile, the cage systems account for about 6–8 m deep, limiting the habitat of sea bass which can be found for up to 15 m deep in extensive systems, exposing them to a higher contribution of evapotranspiration and precipitation too. In a similar way, a depletion of δ18O was found in the sea bass muscle from the intensive systems in sea cages, which could also be related with the fractionation induced by a higher influence of the environmental factors. In this case, the sea bass sampled from E3 farming displayed the same behavior than the rest of extensive systems, with the exception of E4, which were more similar to the intensive systems in sea cages. Whilst water can be considered as the only hydrogen source of the isotopic ratio of hydrogen, oxygen also depends on the carbon dioxide and atmospheric oxygen [78] that could explain this different behavior.
The identification of differences in the isotope values of samples from different origins therefore shows the potential of stable isotope analysis for the verification of geographic traceability. However, the identified patterns should be confirmed in further studies with a significantly larger number of samples from certified origins and over a longer period. The small geographical latitude range covered by our experiment (36.70° N to 45.80° N) supports the potential of a combination of isotopes to trace the origin of products on a larger scale and gains more importance when taking into account the current regulations regarding providing consumers with additional information.

4. Conclusions

The results of the current study showed the viability of δ13C and δ15N to discriminate cultured sea bass from different farming systems (extensive vs. intensive) reared at different geographical sites in Italy. The metabolic assimilation of commercial diets led to an enrichment of the δ13C and δ15N of the fish muscle, reflecting a characteristic trophic shift. Additional information was obtained from δ18O and δ2H, which made it possible to differentiate extensively and intensively (in cages) farmed sea bass. Finally, a depletion of δ13C and δ2H linked to the lipid fraction of the samples was observed, while no significant differences were found for δ15N values between tissues with and without lipids.

Supplementary Materials

The following are available online at https://www.mdpi.com/2076-2615/10/11/2042/s1, Figure S1: Isotope ratios in annual average precipitation for hydrogen and oxygen. Location of the 11 sea bass farms along the Italian coasts are indicated.

Author Contributions

Conceptualization: F.T., J.M.M.-R. (José M. Moreno-Rojas), and E.T.; methodology: F.T., E.T. and J.M.M.-R. (José M. Moreno-Rojas); formal analysis: F.T., J.M.M.-R. (José M. Muñoz-Redondo), and J.M.M.-R. (José M. Moreno-Rojas); investigation: F.T., C.M.M., A.T., G.X., A.S., J.M.M.-R. (José M. Muñoz-Redondo), and J.M.M.-R. (José M. Moreno-Rojas); writing—original draft: F.T. and J.M.M.-R. (José M. Moreno-Rojas); writing—review and editing: F.T., C.M.M., A.T., J.M.M.-R. (José M. Muñoz-Redondo), and J.M.M.-R. (José M. Moreno-Rojas); project administration: F.T. and E.T.; funding acquisition: A.S. and E.T. Please turn to the CRediT taxonomy for the term explanation. Authorship must be limited to those who have contributed substantially to the work reported. All authors have read and agreed to the published version of the manuscript.

Funding

This study was funded by the Italian Ministry of Agricultural, Food and Forestry Politics (MIPAAF) and realized in the framework of the project “Quality and food safety of Italian sea bass: definition of indicators and innovative instrumental applications” (Project COD. 6-C-153—National coordinator A. Santulli). None of the authors had any financial or personal conflicts of interest.

Conflicts of Interest

The authors declare no conflict of interest.

References

  1. FAO. The State of World Fisheries and Aquaculture 2016. Contributing to Food Security and Nutrition for All; FAO: Rome, Italy, 2016; 200p. [Google Scholar]
  2. Fuentes, A.; Fernández-Segovia, I.; Serra, J.A.; Barat, J.M. Comparison of wild and cultured sea bass (Dicentrarchus labrax) quality. Food Chem. 2010, 119, 1514–1518. [Google Scholar] [CrossRef]
  3. Steffens, W. Aquaculture produces wholesome food: Cultured fish as a valuable source of n-3 fatty acids. Aquac. Int. 2015, 24, 787–802. [Google Scholar] [CrossRef]
  4. Van Rijswijk, W.; Frewer, L.J. Consumer perceptions of food quality and safety and their relation to traceability. Br. Food J. 2008, 110, 1034–1046. [Google Scholar] [CrossRef]
  5. Chiesa, L.; Panseri, S.; Bonacci, S.; Procopio, A.; Zecconi, A.; Arioli, F.; Cuevas, F.; Moreno-Rojas, J.M. Authentication of Italian PDO lard using NIR spectroscopy, volatile profile and fatty acid composition combined with chemometrics. Food Chem. 2016, 212, 296–304. [Google Scholar] [CrossRef]
  6. Alonso-Salces, R.M.; Segebarth, N.; Garmón-Lobato, S.; Holland, M.V.; Moreno-Rojas, J.M.; Fernández-Pierna, J.A.; Baeten, V.; Fuselli, S.R.; Gallo, B.; Berrueta, L.A.; et al. 1H-NMR and isotopic fingerprinting of olive oil and its unsaponifiable fraction: Geographical origin of virgin olive oils by pattern recognition. Eur. J. Lipid Sci. Technol. 2015, 117, 1991–2006. [Google Scholar] [CrossRef]
  7. Araghipour, N.; Colineau, J.; Koot, A.; Akkermans, W.; Rojas, J.M.M.; Beauchamp, J.; Wisthaler, A.; Maärk, T.D.; Downey, G.; Guillou, C.; et al. Geographical origin classification of olive oils by PTR-MS. Food Chem. 2008, 108, 374–383. [Google Scholar] [CrossRef]
  8. Mattarucchi, E.; Stocchero, M.; Moreno-Rojas, J.M.; Giordano, G.; Reniero, F.; Guillou, C. Authentication of Trappist Beers by LC-MS Fingerprints and Multivariate Data Analysis. J. Agric. Food Chem. 2010, 58, 12089–12095. [Google Scholar] [CrossRef] [PubMed]
  9. Cuevas, F.; Pereira-Caro, G.; Pereira-Caro, G.; Ruiz-Moreno, M.J.; Montenegro, J.C.; Moreno-Rojas, J.M. A holistic approach to authenticate organic sweet oranges (Citrus Sinensis L. cv Osbeck) using different techniques and data fusion. Food Control. 2019, 104, 63–73. [Google Scholar] [CrossRef]
  10. Camin, F.; Bontempo, L.; Perini, M.; Tonon, A.; Breas, O.; Guillou, C.; Moreno-Rojas, J.; Gagliano, G. Control of wine vinegar authenticity through δ18O analysis. Food Control. 2013, 29, 107–111. [Google Scholar] [CrossRef]
  11. Ghidini, S.; Varrà, M.O.; Dall’Asta, C.; Badiani, A.; Ianieri, A.; Zanardi, E. Rapid authentication of European sea bass (Dicentrarchus labrax L.) according to production method, farming system, and geographical origin by near infrared spectroscopy coupled with chemometrics. Food Chem. 2019, 280, 321–327. [Google Scholar] [CrossRef]
  12. European Commission. Report from the Commission to the European Parliament and the Council Regarding Trans Fats in Foods and in the Overall Diet of the Union Population; COM: Brussels, Belgium, 2015. [Google Scholar]
  13. EUMOFA. Highlights the EU in the World EU Market Supply Consumption Trade EU Landings Aquaculture Production (2019 ed.). The EU Fish Market “Sea Bass” Intensive. Available online: https://www.eumofa.eu/documents/20178/314856/EN_The+EU+fish+market_2019.pdf (accessed on 29 May 2020).
  14. Bell, J.G.; Preston, T.; Henderson, R.J.; Strachan, F.; Bron, J.E.; Cooper, K.; Morrison, D.J. Discrimination of Wild and Cultured European Sea Bass (Dicentrarchus labrax) Using Chemical and Isotopic Analyses. J. Agric. Food Chem. 2007, 55, 5934–5941. [Google Scholar] [CrossRef] [PubMed]
  15. Grigorakis, K. Compositional and organoleptic quality of farmed and wild gilthead sea bream (Sparus aurata) and sea bass (Dicentrarchus labrax) and factors affecting it: A review. Aquaculture 2007, 272, 55–75. [Google Scholar] [CrossRef]
  16. Roncarati, A.; Sirri, F.; Di Domenico, A.; Brambilla, G.; Iamiceli, A.L.; Melotti, P.; Meluzzi, A. Survey of qualitative traits of European sea bass cultivated in different rearing systems. Eur. J. Lipid Sci. Technol. 2010, 112, 770–779. [Google Scholar] [CrossRef]
  17. Vidal, N.P.; Guillén, M.D.; Goicoechea, E.; Guillén, M.D. Farmed and wild sea bass (Dicentrarchus labrax) volatile metabolites: A comparative study by SPME-GC/MS. J. Sci. Food Agric. 2015, 96, 1181–1193. [Google Scholar] [CrossRef]
  18. Di Marco, P.; Petochi, T.; Marino, G.; Priori, A.; Finoia, M.; Tomassetti, P.; Porrello, S.; Giorgi, G.; Lupi, P.; Bonelli, A.; et al. Insights into organic farming of European sea bass Dicentrarchus labrax and gilthead sea bream Sparus aurata through the assessment of environmental impact, growth performance, fish welfare and product quality. Aquaculture 2017, 471, 92–105. [Google Scholar] [CrossRef]
  19. Mokrani, D.; Oumouna, M.; Cuesta, A.; Djamal, M.; Mustapha, O. Fish farming conditions affect to European sea bass (Dicentrarchus labrax L.) quality and shelf life during storage in ice. Aquaculture 2018, 490, 120–124. [Google Scholar] [CrossRef]
  20. Petrovic, M.; Kreisc, G.; Zrncic, S.; Oraic, D.; Dzafic, N.; Pleadin, J. Influence of season and farming location on the quality parameters of sea bass (Dicentrarchus labrax) and sea bream (Sparus aurata). Ital. J. Food Sci. 2015, 27, 151. [Google Scholar]
  21. Smichi, N.; Abdelmalek, B.E.; Kharrat, N.; Sila, A.; Bougatef, A.; Gargouri, Y.-T.; Fendri, A. The effects of storage on quality and nutritional aspects of farmed and wild sea bass (Dicentrachus labrax) muscle: In vitro oils digestibility evaluation. Fish. Res. 2017, 188, 74–83. [Google Scholar] [CrossRef]
  22. Vidal, N.P.; Manzanos, M.J.; Goicoechea, E.; Guillén, M.D. Quality of farmed and wild sea bass lipids studied by 1H NMR: Usefulness of this technique for differentiation on a qualitative and a quantitative basis. Food Chem. 2012, 135, 1583–1591. [Google Scholar] [CrossRef]
  23. Xiccato, G.; Trocino, A.; Tulli, F.; Tibaldi, E. Prediction of chemical composition and origin identification of european sea bass (Dicentrarchus labrax L.) by near infrared reflectance spectroscopy (NIRS). Food Chem. 2004, 86, 275–281. [Google Scholar] [CrossRef]
  24. Arvanitoyannis, I.S.; Tsitsika, E.V.; Panagiotaki, P. Implementation of quality control methods (physico-chemical, microbiological and sensory) in conjunction with multivariate analysis towards fish authenticity. Int. J. Food Sci. Technol. 2005, 40, 237–263. [Google Scholar] [CrossRef]
  25. Reilly, A. Overview of Food Fraud in the Fisheries Sector; FAO Fisheries and Aquaculture Circular No. 1165; FAO: Rome, Italy, 2018; 32p. [Google Scholar]
  26. El Sheikha, A.F.; Montet, D. How to Determine the Geographical Origin of Seafood? Crit. Rev. Food Sci. Nutr. 2014, 56, 306–317. [Google Scholar] [CrossRef] [Green Version]
  27. Deniro, M.J.; Epstein, S. Influence of diet on the distribution of carbon isotopes in animals. Geochim. Cosmochim. Acta 1978, 42, 495–506. [Google Scholar] [CrossRef]
  28. Deniro, M.J.; Epstein, S. Influence of diet on the distribution of nitrogen isotopes in animals. Geochim. Cosmochim. Acta 1981, 45, 341–351. [Google Scholar] [CrossRef]
  29. Moreno-Rojas, J.M.; Vasta, V.; Lanza, A.; Luciano, G.; Ladroue, V.; Guillou, C.; Priolo, A. Stable isotopes to discriminate lambs fed herbage or concentrate both obtained from C3plants. Rapid Commun. Mass Spectrom. 2008, 22, 3701–3705. [Google Scholar] [CrossRef] [PubMed]
  30. Hobson, K.A.; Clark, R.G. Assessing Avian Diets Using Stable Isotopes I: Turnover of13C in Tissues. Condor 1992, 94, 181–188. [Google Scholar] [CrossRef] [Green Version]
  31. Peterson, B.J.; Fry, B. Stable isotopes in ecosystem studies. Annu. Rev. Ecol. Syst. 1987, 18, 293–320. [Google Scholar] [CrossRef]
  32. Michener, R.H.; Kaufman, L. Stable Isotope Ratios as Tracers in Marine Food Webs: An Update. Stable Isot. Ecol. Environ. Sci. 2008, 2, 238–282. [Google Scholar] [CrossRef]
  33. Kim, S.L.; Casper, D.R.; Galván-Magaña, F.; Ochoa-Díaz, R.; Hernández-Aguilar, S.B.; Koch, P.L. Carbon and nitrogen discrimination factors for elasmobranch soft tissues based on a long-term controlled feeding study. Environ. Boil. Fishes 2011, 95, 37–52. [Google Scholar] [CrossRef]
  34. Domi, N.; Bouquegneau, J.; Das, K. Feeding ecology of five commercial shark species of the Celtic Sea through stable isotope and trace metal analysis. Mar. Environ. Res. 2005, 60, 551–569. [Google Scholar] [CrossRef] [Green Version]
  35. Shiffman, D.S.; Frazier, B.S.; Kucklick, J.R.; Ábel, D.; Brandes, J.; Sancho, G. Feeding Ecology of the Sandbar Shark in South Carolina Estuaries Revealed through δ13C and δ15N Stable Isotope Analysis. Mar. Coast. Fish. 2014, 6, 156–169. [Google Scholar] [CrossRef] [Green Version]
  36. Dubois, S.F.; Orvain, F.; Marin-Léal, J.; Ropert, M.; Lefebvre, S. Small-scale spatial variability of food partitioning between cultivated oysters and associated suspension-feeding species, as revealed by stable isotopes. Mar. Ecol. Prog. Ser. 2007, 336, 151–160. [Google Scholar] [CrossRef] [Green Version]
  37. Moreno-Rojas, J.M.; Tulli, F.; Messina, M.; Tibaldi, E.; Guillou, C. Stable isotope ratio analysis as a tool to discriminate between rainbow trout (O. mykiss) fed diets based on plant or fish-meal proteins. Rapid Commun. Mass Spectrom. 2008, 22, 3706–3710. [Google Scholar] [CrossRef] [PubMed]
  38. Kelly, S.; Heaton, K.; Hoogewerff, J. Tracing the geographical origin of food: The application of multi-element and multi-isotope analysis. Trends Food Sci. Technol. 2005, 16, 555–567. [Google Scholar] [CrossRef]
  39. Camin, F.; Perini, M.; Bontempo, L.; Galeotti, M.; Tibaldi, E.; Piasentier, E. Stable isotope ratios of H, C, O, N and S for the geographical traceability of Italian rainbow trout (Oncorhynchus mykiss). Food Chem. 2018, 267, 288–295. [Google Scholar] [CrossRef] [Green Version]
  40. Cossignani, L.; Cossignani, L.; Blasi, F.; Perini, M.; Barbero, A.; Pianezze, S.; Montesano, D. Characterisation and geographical traceability of Italian goji berries. Food Chem. 2019, 275, 585–593. [Google Scholar] [CrossRef]
  41. Wang, J.; Chen, T.; Zhang, W.; Zhao, Y.; Yang, S.; Chen, A. Tracing the geographical origin of rice by stable isotopic analyses combined with chemometrics. Food Chem. 2020, 313, 126093. [Google Scholar] [CrossRef]
  42. Benson, S.; Lennard, C.; Maynard, P.; Roux, C. Forensic applications of isotope ratio mass spectrometry—A review. Forensic Sci. Int. 2006, 157, 1–22. [Google Scholar] [CrossRef]
  43. Hong, E.; Lee, S.Y.; Jeong, J.Y.; Park, J.M.; Kim, B.H.; Kwon, K.; Chun, H.S. Modern analytical methods for the detection of food fraud and adulteration by food category. J. Sci. Food Agric. 2017, 97, 3877–3896. [Google Scholar] [CrossRef]
  44. Dempson, J.B.; Power, M. Use of stable isotopes to distinguish farmed from wild Atlantic salmon, Salmo salar. Ecol. Freshw. Fish 2004, 13, 176–184. [Google Scholar] [CrossRef]
  45. Ottavian, M.; Facco, P.; Fasolato, L.; Novelli, E.; Mirisola, M.; Perini, M.; Barolo, M. Use of Near-Infrared Spectroscopy for Fast Fraud Detection in Seafood: Application to the Authentication of Wild European Sea Bass (Dicentrarchus labrax). J. Agric. Food Chem. 2012, 60, 639–648. [Google Scholar] [CrossRef]
  46. Rojas, J.M.M.; Serra, F.; Giani, I.; Moretti, V.M.; Reniero, F.; Guillou, C. The use of stable isotope ratio analyses to discriminate wild and farmed gilthead sea bream (Sparus aurata). Rapid Commun. Mass Spectrom. 2006, 21, 207–211. [Google Scholar] [CrossRef]
  47. Serrano, R.; Blanes, M.; Orero, L. Stable isotope determination in wild and farmed gilthead sea bream (Sparus aurata) tissues from the western Mediterranean. Chemosphere 2007, 69, 1075–1080. [Google Scholar] [CrossRef] [PubMed]
  48. Gamboa-Delgado, J.; Molina-Poveda, C.; Godínez-Siordia, D.E.; Villarreal, D.; Ricque-Marie, D.; Cruz-Suárez, L.E. Application of stable isotope analysis to differentiate shrimp extracted by industrial fishing or produced through aquaculture practices. Can. J. Fish. Aquat. Sci. 2014, 71, 1520–1528. [Google Scholar] [CrossRef] [Green Version]
  49. Thomas, F.; Jamin, E.; Wietzerbin, K.; Guérin, R.; Lees, M.; Morvan, E.; Billault, I.; Derrien, S.; Rojas, J.M.M.; Serra, F.; et al. Determination of Origin of Atlantic Salmon (Salmo salar): The Use of Multiprobe and Multielement Isotopic Analyses in Combination with Fatty Acid Composition to Assess Wild or Farmed Origin. J. Agric. Food Chem. 2008, 56, 989–997. [Google Scholar] [CrossRef]
  50. Sant’Ana, L.S.; Ducatti, C.; Ramires, D.G. Seasonal variations in chemical composition and stable isotopes of farmed and wild Brazilian freshwater fish. Food Chem. 2010, 122, 74–77. [Google Scholar] [CrossRef]
  51. Oliveira, E.J.V.M.; Sant’Ana, L.S.; Ducatti, C.; Denadai, J.C.; Kruliski, C.R.D.S. The use of stable isotopes for authentication of gadoid fish species. Eur. Food Res. Technol. 2010, 232, 97–101. [Google Scholar] [CrossRef]
  52. Lv, W.; Ju, T.; Dong, B.; Yu, B.; Yin, J. Effect of dietary stable isotopic ratios of carbon and nitrogen on the extent of their incorporation into tissues of rats. J. Anim. Sci. Biotechnol. 2012, 3, 14. [Google Scholar] [CrossRef] [Green Version]
  53. Kambikambi, M.J.; Chakona, A.; Kadye, W.T. The influence of diet composition and tissue type on the stable isotope incorporation patterns of a small-bodied southern African minnowEnteromius anoplus (Cypriniformes, Cyprinidae). Rapid Commun. Mass Spectrom. 2019, 33, 613–623. [Google Scholar] [CrossRef]
  54. Turchini, G.M.; Quinn, G.P.; Jones, P.L.; Palmeri, G.; Gooley, G. Traceability and Discrimination among Differently Farmed Fish: A Case Study on Australian Murray Cod. J. Agric. Food Chem. 2009, 57, 274–281. [Google Scholar] [CrossRef] [PubMed]
  55. Kim, H.; Kumar, K.S.; Shin, K.-H. Applicability of stable C and N isotope analysis in inferring the geographical origin and authentication of commercial fish (Mackerel, Yellow Croaker and Pollock). Food Chem. 2015, 172, 523–527. [Google Scholar] [CrossRef]
  56. Bontempo, L.; Camin, F.; Larcher, R.; Nicolini, G.; Perini, M.; Rossmann, A. Coast and year effect on H, O and C stable isotope ratios of Tyrrhenian and Adriatic italian olive oils. Rapid Commun. Mass Spectrom. 2009, 23, 1043–1048. [Google Scholar] [CrossRef]
  57. Camin, F.; Larcher, R.; Nicolini, G.; Bontempo, L.; Bertoldi, D.; Perini, M.; Schlicht, C.; Schellenberg, A.; Thomas, F.; Heinrich, K.; et al. Isotopic and Elemental Data for Tracing the Origin of European Olive Oils. J. Agric. Food Chem. 2010, 58, 570–577. [Google Scholar] [CrossRef]
  58. Drivelos, S.A.; Georgiou, C.A. Multi-element and multi-isotope-ratio analysis to determine the geographical origin of foods in the European Union. TrAC Trends Anal. Chem. 2012, 40, 38–51. [Google Scholar] [CrossRef]
  59. Schwägele, F. Traceability from a European perspective. Meat Sci. 2005, 71, 164–173. [Google Scholar] [CrossRef]
  60. Folch, J.; Lees, M.; Stanley, G.S. A simple method for the isolation and purification of total lipides from animal tissues. J. Biol. Chem. 1957, 226, 497–509. [Google Scholar]
  61. Barnes, C.; Sweeting, C.J.; Jennings, S.; Barry, J.T.; Polunin, N.V.C. Effect of temperature and ration size on carbon and nitrogen stable isotope trophic fractionation. Funct. Ecol. 2007, 21, 356–362. [Google Scholar] [CrossRef]
  62. Bodin, N.; Le Loc’H, F.; Hily, C. Effect of lipid removal on carbon and nitrogen stable isotope ratios in crustacean tissues. J. Exp. Mar. Biol. Ecol. 2007, 341, 168–175. [Google Scholar] [CrossRef]
  63. Sweeting, C.; Barry, J.; Barnes, C.J.; Polunin, N.V.C.; Jennings, S.G. Effects of body size and environment on diet-tissue δ15N fractionation in fishes. J. Exp. Mar. Biol. Ecol. 2007, 340, 1–10. [Google Scholar] [CrossRef]
  64. Hussey, N.E.; Olin, J.A.; Kinney, M.J.; McMeans, B.C.; Fisk, A.T. Lipid extraction effects on stable isotope values (δ13C and δ15N) of elasmobranch muscle tissue. J. Exp. Mar. Biol. Ecol. 2012, 434, 7–15. [Google Scholar] [CrossRef]
  65. Ingram, T.; Matthews, B.; Harrod, C.; Stephens, T.; Grey, J.; Markel, R.; Mazumder, A. Lipid extraction has little effect on the d15N of aquatic consumers. Limnol. Oceanogr. Methods 2007, 5, 338–342. [Google Scholar] [CrossRef]
  66. Vasconi, M.; Lopez, A.; Galimberti, C.; Rojas, J.M.M.; Redondo, J.M.M.; Bellagamba, F.; Moretti, V.M. Authentication of farmed and wild european eel (Anguilla anguilla) by fatty acid profile and carbon and nitrogen isotopic analyses. Food Control. 2019, 102, 112–121. [Google Scholar] [CrossRef] [Green Version]
  67. Li, L.; Boyd, C.E.; Sun, Z. Authentication of fishery and aquaculture products by multi-element and stable isotope analysis. Food Chem. 2016, 194, 1238–1244. [Google Scholar] [CrossRef]
  68. Park, H.J.; Park, T.H.; Lee, C.-I.; Kang, C.-K. Ontogenetic shifts in diet and trophic position of walleye pollock, Theragra chalcogramma, in the western East Sea (Japan Sea) revealed by stable isotope and stomach content analyses. Fish. Res. 2018, 204, 297–304. [Google Scholar] [CrossRef]
  69. Kusche, H.; Hillgruber, N.; Rößner, Y.; Focken, U. The effect of different fish feed compositions on δ13C and δ15N signatures of sea bass and its potential value for tracking mariculture-derived nutrients. Isot. Environ. Health Stud. 2017, 54, 28–40. [Google Scholar] [CrossRef]
  70. Gaye-Siessegger, J.; Focken, U.; Abel, H.; Becker, K. Starvation and low feeding levels result in an enrichment of13C in lipids and15N in protein of Nile tilapia Oreochromis niloticus L. J. Fish Biol. 2007, 71, 90–100. [Google Scholar] [CrossRef]
  71. Busetto, M.L.; Moretti, V.M.; Moreno-Rojas, J.M.; Caprino, F.; Giani, I.; Malandra, R.; Bellagamba, F.; Guillou, C. Authentication of Farmed and Wild Turbot (Psetta maxima) by Fatty Acid and Isotopic Analyses Combined with Chemometrics. J. Agric. Food Chem. 2008, 56, 2742–2750. [Google Scholar] [CrossRef]
  72. Gannes, L.Z.; Del Rio, C.M.; Koch, P. Natural Abundance Variations in Stable Isotopes and their Potential Uses in Animal Physiological Ecology. Comp. Biochem. Physiol. Part A Mol. Integr. Physiol. 1998, 119, 725–737. [Google Scholar] [CrossRef]
  73. Minagawa, M.; Wada, E. Stepwise enrichment of 15N along food chains: Further evidence and the relation between δ15N and animal age. Geochim. Cosmochim. Acta 1984, 48, 1135–1140. [Google Scholar] [CrossRef]
  74. Post, D.M. Using stable isotopes to estimate trophic position: Models, methods, and assumptions. Ecology 2002, 83, 703–718. [Google Scholar] [CrossRef]
  75. Trocino, A.; Xiccato, G.; Majolini, D.; Tazzoli, M.; Tulli, F.; Tibaldi, E.; Messina, C.M.; Santulli, A. Levels of dioxin-like polychlorinated biphenyls (DL-PCBs) and metals in European sea bass from fish farms in Italy. Food Chem. 2012, 134, 333–338. [Google Scholar] [CrossRef]
  76. Valladares, S.; Planas, M. Application of Effective Day Degrees in the Assessment of Stable Isotope Patterns in Developing Seahorses under Different Temperatures. Animals 2020, 10, 1571. [Google Scholar] [CrossRef]
  77. Horacek, M.; Min, J.-S. Discrimination of Korean beef from beef of other origin by stable isotope measurements. Food Chem. 2010, 121, 517–520. [Google Scholar] [CrossRef]
  78. De Rijke, E.; Schoorl, J.; Cerli, C.; Vonhof, H.; Verdegaal, S.; Vivó-Truyols, G.; Lopatka, M.; Dekter, R.; Bakker, D.; Sjerps, M.J.; et al. The use of δ2H and δ18O isotopic analyses combined with chemometrics as a traceability tool for the geographical origin of bell peppers. Food Chem. 2016, 204, 122–128. [Google Scholar] [CrossRef] [Green Version]
Figure 1. δ13C and δ15N values in sea bass muscle. Each data point represents the measure of a pooled sample of 5 fish fillets.
Animals 10 02042 g001
Figure 2. Trophic shift measured for carbon (a) and nitrogen (b) isotopic ratios between the feed supplied and muscle of sea bass. A one-way ANOVA was performed on the data and the letters above the boxes correspond to the Tukey Honestly Significant Difference (HSD) post hoc test.
Animals 10 02042 g002
Figure 3. δ2H (a) and δ18O (b) values (‰) of muscle of E. sea bass reared in extensive systems and sea cages. The latitude of each group is shown in parenthesis. A one-way ANOVA was performed on the data and the letters below the boxes correspond to the Tukey HSD post hoc test.
Animals 10 02042 g003
Table 1. General farms characteristics, water quality, commercial feed producer, and number of fish sampled.
Farm CodeLatitudeLongitudeFarming SystemWater SourceTemperature (°C)Salinity (‰)Feed ProducerSampled Fish
C136.70° N15.12° ESea cageSea1837Biomar10
C345.80° N13.55° ESea cageSea/river1234Skretting20
C440.84° N17.47° ESea cageSea9.837Aller20
E144.57° N12.33° EExtensiveSea1628---10
E237.50° N12.48° EExtensiveSea1637---15
E345.76° N13.17° ESemi-intensiveLagoon820Skretting20
E444.96° N12.32° EExtensiveSea1625---10
I142.42° N11.28° EInland in pondWell1824Skretting20
I240.93° N14.03° EInland outdoorWell1828Biomar20
I344.95° N12.32° EInland outdoorSea1728Skretting20
I437.98° N12.51° EInland outdoorSea1837Biomar10
Table 2. Effect of the rearing system (E = Extensive; I = Intensive inland; C = Intensive in sea cages) on biometric traits, chemical composition, and δ13C and δ15N of the muscle of the sea bass.
EICMSE
Biometric traits
n. of samples557050
Whole body weight (g)633.2 ± 136.4613.7 ± 175.4552.5 ± 146.230,964.2
Total length (cm)38.0 ± 4.2236.5 ± 3.4036.3 ± 2.2110.776
Chemical composition (g/100 g)
n. of samples557050
Moisture76.25 ± 1.79 a69.54 ± 2.57 c71.64 ± 3.17 b7.004
Protein Content19.21 ± 0.41 b19.73 ± 1.13 a19.31 ± 0.73 b0.875
Lipid2.67 ± 1.80 c8.91 ± 2.79 a7.13 ± 3.01 b7.361
Stable isotope data (‰)
n. of samples111410
δ13C−16.17 ± 2.81 a−21.87 ± 0.64 b−21.52 ± 0.26 b1.927
δ15N14.02 ± 0.45 a10.38 ± 0.57 b11.40 ± 0.49 b0.312
Stable isotope data were measured on pooled samples of 5 fish fillets. MSE = Mean Square Error. Mean values in the same row with different letters differ significantly (p < 0.01).
Table 3. Mean isotopic values of whole muscle, lipid fraction, and defatted muscle of nine sea bass from C4 farm.
MeasureWhole MuscleLipid FractionDefatted Muscle
δ13C (‰)−21.74 ± 0.19−26.05 ± 0.17−19.88 ± 0.11
δ15N (‰)11.12 ± 0.24 11.01 ± 0.22
δ2H (‰)−124.43 ± 5.52−197.78 ± 2.37−85.52 ± 1.05
Table 4. δ13C and δ15N trophic shifts for intensive (inland and sea cages) or semi-intensive (E3) reared sea bass.
Farming SystemFarm Codeδ13C (‰) Dietδ13C (‰) Group
(Mean Value)
Δδ13C (‰)δ15N (‰) Dietδ15N (‰) Group
(Mean Value)
Δδ15N (‰)
II1−24.06−21.822.247.6710.622.95
I2−23.45−22.381.075.229.604.38
I3−21.98−20.791.196.0511.034.98
I4−23.44−22.131.316.149.843.70
CC1−23.10−21.141.968.2212.274.05
C3−22.89−21.501.397.1011.083.98
C4−22.82−21.721.107.5611.293.73
EE3−23.05−22.340.724.9810.615.63
Publisher’s Note: MDPI stays neutral with regard to jurisdictional claims in published maps and institutional affiliations.

