Article

Low Expression of Sirtuin 1 in the Dairy Cows with Mild Fatty Liver Alters Hepatic Lipid Metabolism

1
College of Animal Science and Technology, Anhui Agricultural University, Hefei 230036, China
2
Anhui Province Key Laboratory of Veterinary Pathobiology and Disease Control, Hefei 230036, China
3
Institute of Animal Husbandary and Veterinary Medicine, Anhui Academy of Agriculture Sciences, Hefei 230031, China
*
Authors to whom correspondence should be addressed.
Animals 2020, 10(4), 560; https://doi.org/10.3390/ani10040560
Submission received: 22 February 2020 / Revised: 19 March 2020 / Accepted: 24 March 2020 / Published: 27 March 2020
(This article belongs to the Collection High-Yielding Dairy Cows)

Abstract

:

Simple Summary

Sirtuin 1 (SIRT1), a NAD-dependent histone deacetylase, is involved in oxidative stress and lipid metabolism regulation. Limited studies exist regarding the role of SIRT1 in lipid metabolism disorder in periparturient dairy cows. This study explores the effect of hepatic steatosis on the expression of the SIRT1 gene and protein and the proteins encoded by the genes downstream to it, all of which are involved in lipid metabolism in the liver. Control cows (n = 6, parity 3.0 ± 2.0, milk production 28 ± 47 kg/d) and mild fatty liver cows (n = 6, parity 2.3 ± 1.5, milk production 20 ± 6 kg/d) were retrospectively selected based on liver triglycerides (TG) content (% wet liver). The present study indicates that low SIRT1 expression caused by hepatic steatosis promotes hepatic fatty acid synthesis and inhibits fatty acid β-oxidation. We believe that our study makes a significant contribution to the literature because it demonstrates that hepatic steatosis is associated with increased hepatic fatty acid synthesis, inhibited fatty acid β-oxidation and reduced lipid transport.

Abstract

Dairy cows usually experience negative energy balance coupled with an increased incidence of fatty liver during the periparturient period. The purpose of this study was to investigate the effect of hepatic steatosis on the expression of the sirtuin 1 (SIRT1), along with the target mRNA and protein expressions and activities related to lipid metabolism in liver tissue. Control cows (n = 6, parity 3.0 ± 2.0, milk production 28 ± 7 kg/d) and mild fatty liver cows (n = 6, parity 2.3 ± 1.5, milk production 20 ± 6 kg/d) were retrospectively selected based on liver triglycerides (TG) content (% wet liver). Compared with the control group, fatty liver cows had greater concentrations of cholesterol and TG along with the typically vacuolated appearance and greater lipid droplets in the liver. Furthermore, fatty liver cows had greater mRNA and protein abundance related to hepatic lipid synthesis proteins sterol regulatory element binding proteins (SREBP-1c), long-chain acyl-CoA synthetase (ACSL), acyl-CoA carbrolase (ACC) and fatty acid synthase (FAS) and lipid transport proteins Liver fatty acid binding protein (L-FABP), apolipoprotein E (ApoE), low density lipoprotein receptor (LDLR) and microsomal TG transfer protein (MTTP) (p < 0.05). However, they had lower mRNA and protein abundance associated with fatty acid β-oxidation proteins SIRT1, peroxisome proliferator-activated receptor co-activator-1 (PGC-1α), peroxisome proliferator–activated receptor-α (PPARα), retinoid X receptor (RXRα), acyl-CoA 1 (ACO), carnitine palmitoyltransferase 1 (CPT1), carnitine palmitoyltransferase 2 (CPT2) and long- and medium-chain 3-hydroxyacyl-CoA dehydrogenases (LCAD) (p < 0.05). Additionally, mRNA abundance and enzyme activity of enzymes copper/zinc superoxide dismutase (Cu/Zn SOD), catalase (CAT), glutathione peroxidase (GSH-Px) and manganese superoxide dismutase (Mn SOD) decreased and mRNA and protein abundance of p45 nuclear factor-erythroid 2 (p45 NF-E2)-related factor 1 (Nrf1), mitochondrial transcription factor A (TFAM) decreased (p < 0.05). Lower enzyme activities of SIRT1, PGC-1α, Cu/Zn SOD, CAT, GSH-Px, SREBP-1c and Mn SOD (p < 0.05) and concentration of reactive oxygen species (ROS) were observed in dairy cows with fatty liver. These results demonstrate that decreased SIRT1 associated with hepatic steatosis promotes hepatic fatty acid synthesis and inhibits fatty acid β-oxidation. Hence, SIRT1 may represent a novel therapeutic target for the treatment of the fatty liver disease in dairy cows.

1. Introduction

Dairy cows undergo negative energy balance (NEB) when they transition from late gestation to early lactation, during which ketosis, fatty liver and metritis are likely to occur [1,2]. The occurrence of fatty liver in dairy cows increases treatment costs and culling and decreased milk production [3]. In addition, fatty liver disease develops when increased infectious and metabolic diseases are likely to occur [4,5]. For these reasons, fatty liver has become a major international health burden in dairy cows.
The protein sirtuin 1 (SIRT1), an NAD+-dependent deacetylase, and deacetylates histones including transcription factors lead to the regulation of metabolism, oxidative stress and cellular survival [6]. SIRT1 is highly sensitive to intracellular redox status and provides cells with the ability to tolerate oxidative stress. SIRT1 protects cells from oxidative stress by increasing the activity of catalase [7,8,9]. Oxidative stress was increased by SIRT1 inhibitor (Ex 527) treatment and decreases in SIRT1 expression were observed in neurons [10]. Ex 527 attenuated the activity of histone deacetylase (HDAC) and increased the degree of myocardial injury during oxidative stress [11]. Accumulating evidence suggests that SIRT1 plays a protective role in the process of oxidative stress and that oxidative stress was induced by excessive fat mobilization in perinatal cows. We observed in our studies that oxidative stress was induced by high non-esterified fatty acid (NEFA) concentrations in dairy cows [12,13]. To date, the effect of SIRT1 on the oxidative stress in dairy cows remains unclear.
It was reported that SIRT1 plays a critical role in lipid metabolism by modulating the activity of transcription factors [14]. In mice and obese patients fed with a high-fat diet, the activity and expression of SIRT1 were significantly decreased, which attenuated the mobilization of fatty acids and promoted the occurrence of metabolic disorders [15,16,17]. In addition, mounting evidence indicates that a long-term, high-calorie-diet induced liver steatosis is promoted by increasing the expression of SIRT1 in animals [18,19]. Here, we report that the knocked down expression or overexpression of SIRT1 results in changes in the lipid/cholesterol (Chol) levels in the serum and liver, and causes accumulation of lipids in the liver, a process leading to hepatic steatosis [20,21]. Evidence is emerging that SIRT1 plays a vital role in lipid metabolism in the liver. However, the underlying molecular mechanisms, the effect of hepatic steatosis on the expression of SIRT1 genes and proteins and the expressions and activities of downstream lipid-metabolism-related proteins and key enzymes, have not yet been fully clarified.
Therefore, we aimed to investigate the change of expression levels of SIRT1 and downstream lipid-metabolism-related proteins in the pathogenesis of fatty liver disease in dairy cows, thereby providing a theoretical and experimental basis for revealing the pathogenesis of fatty liver in dairy cows and searching for therapeutic targets.

2. Materials and Methods

2.1. Ethics Statement

This study was conducted following the recommendations in the Guide for Care and Use of Laboratory Animals of the National Institutes of Health. All experimental procedures were approved by the Institutional Animal Care and Use Committee of Anhui Agricultural University (permit number: 20170624). All surgeries were performed under anesthesia and all efforts were made to minimize suffering. Briefly, cows were anesthetized with thiamylal sodium along the midline skin of the abdomen. Then the abdominal cavity was opened, the liver was obtained and placed on a sterile bench treated with sterile 0.9% sodium chloride solution for removing bloodstains on the surface.

2.2. Animals

Lactating Holstein multiparous cows with the same breed, age and having similar milk production characteristics and body condition scores were selected from a commercial dairy farm located in Hefei city, Anhui province, China. The rectal temperature, respiratory rate and pulse rate for each cow was performed by a skilled veterinarian to ensure the cows had no other co-morbidities. Clinical observations and other disease conditions were recorded (Table 1). The cows were fed ad libitum with a total mixed ration (TMR) forage that met the animals’ nutrient requirements (Table 2) and had free access to get water. A total of 34 dairy cows were screened by liver biopsy using a liver puncture needle based on the hepatic TG content (% wet liver, <1% was considered to be healthy cows, 1–10% was considered to be mild fatty liver cows), which is the standard for fatty liver diagnosis [22,23]. Equal numbers of control (n = 6) and fatty liver cows and were retrospectively selected based on liver triglycerides (TG) content. Finally, 12 dairy cows were slaughtered for collecting liver tissue samples and processed as part of the normal work of a commercial abattoir (Hefei, China).

2.3. Average Milk Production Collection and Milk Components Analysis

As described in the previous study, the daily dry matter intake (DMI) for individual cows was calculated by subtracting the orts from the feed offered [24]. Cows were milked at 06:00, 14:00 and 20:00 and milk production was recorded at each milking. At d 70 in milk, the liver was collected. The milk aliquots were stored at 4 °C until analysis. Milk components include fat, protein, lactose, total solids and milk urea nitrogen (MUN) concentrations were determined by mid-infrared spectrophotometry method on a MilkoTMScan (MilkoScan Type FT120, Foss Electric, Hillerød, Denmark). Somatic cell counts (SCC) were conducted on a Fossomatics 5000 (Foss Analytical A/S; Foss Electric, Hillerød, Denmark). Both 4% fat corrected milk (FCM) and energy corrected milk (ECM) were calculated and the equations were as follows: 4% FCM = 0.4 × milk (kg) + 15 × fat (kg) and ECM = 0.327 × milk (kg) + 12.95 × fat (kg) + 7.20 × protein (kg). Feed efficiency was calculated as the daily milk yield/kg of feed DMI on an individual cow basis.

2.4. Liver chemistry measurement

The liver Chol and TG measurements were performed as previously described [25]. In brief, frozen liver tissue (50 mg) was homogenized with 1 mL lysis buffer. The Chol contents were measured with Chol assay kit, while TG contents were determined using TG kits (IDEXX Vet Tests, Westbrook, ME, USA). Total protein concentration was measured using bicinchoninic acid (BCA) method.

2.5. ELISA Assay for the Contents of SIRT1 and Downstream Lipid- metabolism-related Proteins and Key Enzymes

Liver samples were homogenized in ice-cold lysis buffer (0.05 M-phosphosaline, pH 7.4, containing 0.025 M EDTA, 0.08% sodium azide and 0.05% Triton X-100) supplemented with protease inhibitor cocktail (P1860, Sigma-Aldrich Co., St. Louis, MO, USA). Homogenates were incubated for 10 min at 4 °C and centrifuged at 14,000 × g at 4 °C for 15 min. The supernatants were separated into two aliquots (500 μL each). One was immediately used for analysis, while the other was stored at −80 °C until further analysis. SIRT1, SREBP-1c, PGC-1α and the concentrations of CAT, Cu/Zn-SOD, Mn-SOD, GSH-Px, GSH, GSSG and ROS (oxidation and antioxidation key indexes) levels in liver supernatants were determined by ELISA provided by Shanghai Bluegene Biotech Co., Ltd. according to the manufacture’s protocol. Total protein concentration was measured using the bicinchoninic acid (BCA) method.

2.6. Liver Histology

Tissue samples obtained from biopsy or necropsy were fixed in 10% formalin and embedded in paraffin. Sections were prepared with a thickness of 2–3 μm, stained with hematoxylin/eosin (H&E), and examined. Accumulation of triglyceride (TG) content in the liver was visualized by Oil Red O (Sigma-Aldrich) staining. Slides were viewed and images were taken using an Olympus BX41TF System Microscope (Olympus Corporation, Tokyo, Japan).

2.7. Total RNA Isolation and qRT-PCR

The liver was homogenized in TRIzol reagent (Invitrogen Life Technologies, Grand Island, NY) and total RNA was isolated according to the manufacturer’s instructions. The RNA concentration and quality were measured by K5500 Micro-Spectrophotometer (Kaiao, Beijing, China). RNA was reverse-transcribed into cDNA according to the Reverse Transcription Systems instructions (TaKaRa, Dalian, China). According to the GenBank sequence, the primer sequences of the target genes were designed using the software Primer Premier 5.0 and β-actin was used as a reference gene (Table 3). The amplification products were analyzed by 1.5% agarose gel electrophoresis and a gel imaging and analysis system (UVItec, Cambridge, UK). The mRNA expression levels were determined by quantitative reverse-transcription polymerase chain reaction (qPCR) via an ABI prism 7500 Real-Time PCR system (Applied Biosystems). The mRNA relative abundance was calculated according to the method of Pfaffl and was normalized to the mean expression of β-actin and results (fold changes) were expressed as 2−ΔΔCt [26].

2.8. Western Blot Analysis

Liver tissue homogenates were solubilized in SDS sample buffer. As previously described, liver total protein was extracted by a commercial kit (Sangon Biotech, China) [12]. Protein concentrations were measured by BCA method. A total of 50 μg protein for each sample was separated by SDS-PAGE. The required gels were cut and transferred into a PVDF membrane (Shanghai Jinsheng Biological Engineering Co, Shanghai, China) with electrophoresis buffer. By using appropriate antibodies (Abs), immunoreactive bands were visualized by a gel imaging system (Bio-Rad, Hercules, CA, USA). Primary antibodies against ACO (YN0401), FAS (YM1224), ACCα (YT0074), p-ACCα (YP0620), ACSL1 (YN0827), LDLR (YN2236), RXRα (YN0018), Nrf1 (YT3188) and TFAM (YT2916) were purchased from ImmunoWay Biotechnology Company (Newark, DE, USA). Primary antibodies against CPT1 (15184-1-AP) and CPT2 (26555-1-AP) were purchased from Proteintech Group (Chicago, IL, USA). Primary antibodies against PPARα (SC-1985), SREBP-1c (SC-365513) and ApoE (SC-31822) were purchased from Santa Cruz Biotechnology (Santa Cruz, CA, USA). Primary antibody against SIRT1 (D1D7) was purchased from Cell Signaling Technology (Danvers, MA, USA). Antibodies against PGC-1α (ab54481) was purchased from Abcam (Cambridge, MA, USA). Horseradish peroxidase-conjugated secondary antibodies were purchased from Wuhan Boster Biological Engineering Co. (Wuhan, China). The results were analyzed using Quantity One software (Bio-Rad, Hercules, CA, USA). The protein levels were normalized by blots against β-actin.

2.9. Statistical Analysis

Data are presented as mean ± SEM. Differences between the mean values of the normally distributed and homogeneity of variance data were analyzed using a two-tailed Student’s t-test. The results are exploratory and the differences were considered significant at p < 0.05 or p < 0.01 in all the studies.

3. Results

3.1. Milk Production, Milk Component and SCC

As shown in Table 4, the DMI and milk yield in the fatty liver group were significantly lower than those in the control group (p < 0.01). The milk protein and MUN were significantly reduced (p < 0.01) and SCCs were significantly increased (p < 0.01) in the fatty liver group.

3.2. Chol and TG Concentrations in the Control and Fatty Liver Dairy Cows

Compared with the control group, the concentrations of Chol (Figure 1A) and TG (Figure 1B) were increased in the fatty liver group.

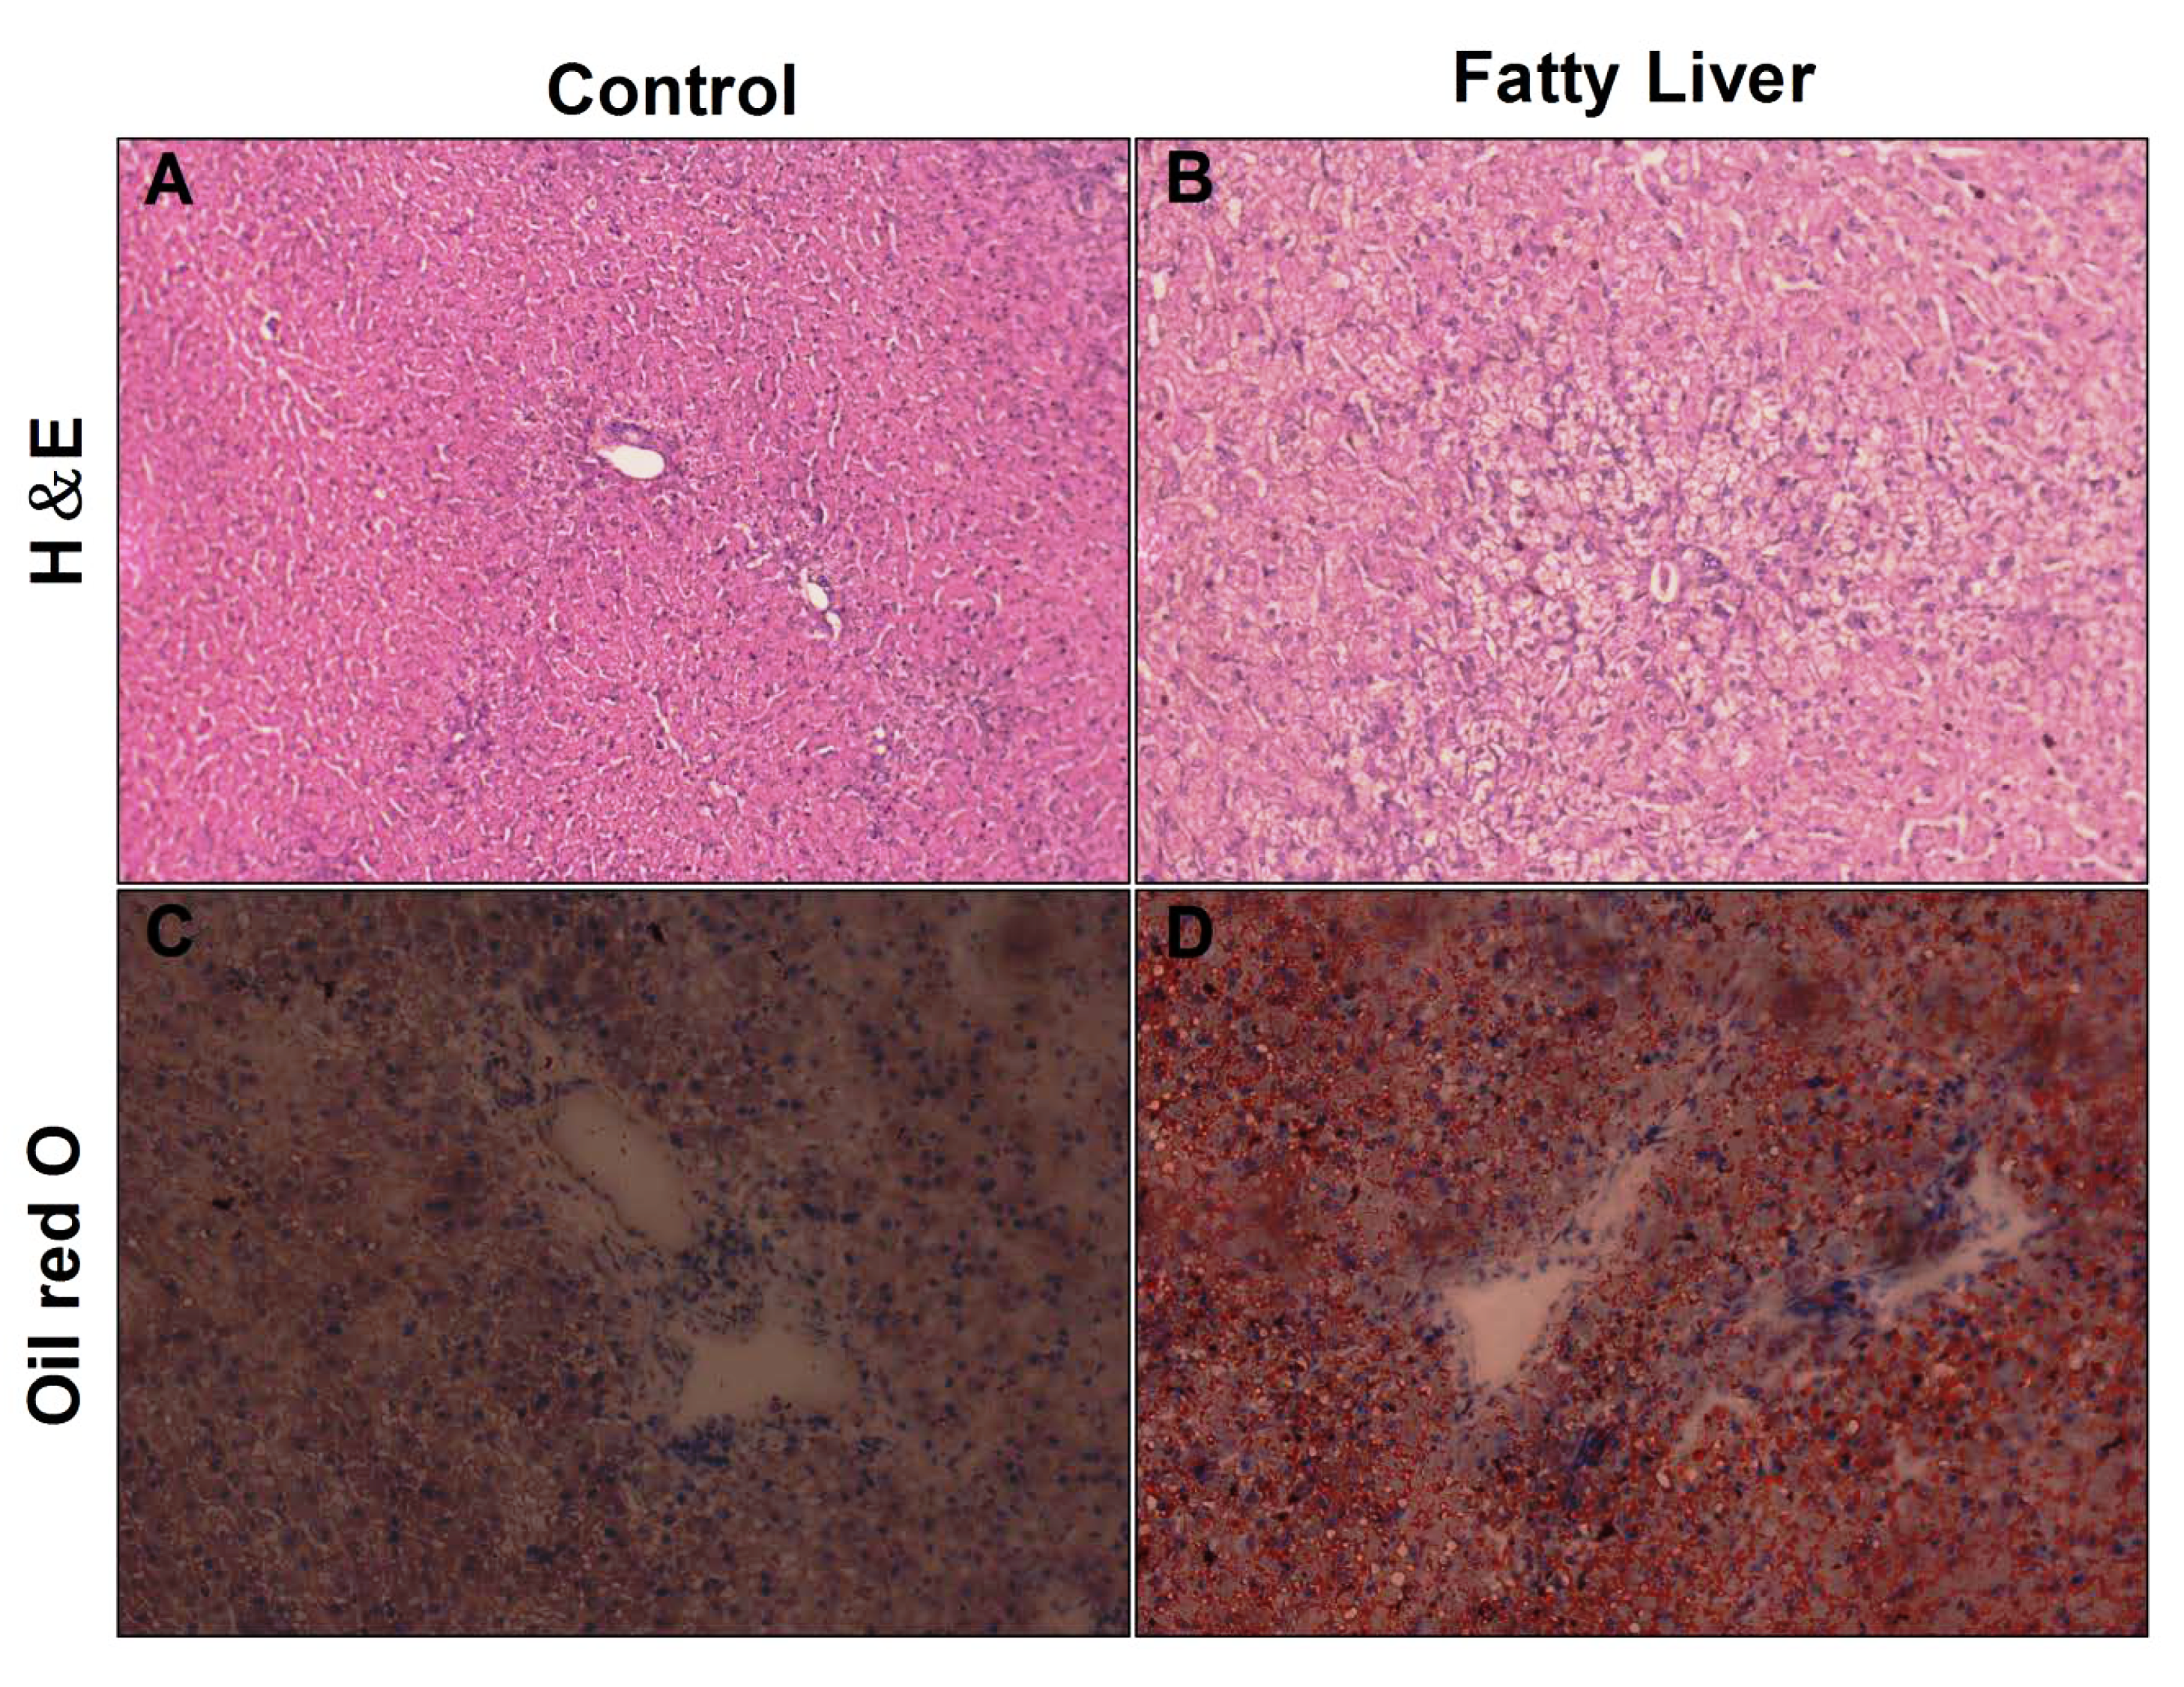
3.3. Histological Analysis of Liver

Isolated cow livers were subjected to H&E staining to evaluate their hepatic steatosis status. It was characterized by a typically vacuolated appearance of the lipid-laden hepatocytes in the H&E-stained sections of the liver (Figure 2A,B) and confirmed by the demonstration of more intrahepatic lipid on oil red O staining of the frozen sections (Figure 2C,D). Steatosis was primarily centrilobular and either microvesicular or mixed microvesicular/ macrovesicular. In fatty liver cows, the oil red O stained lipid droplets occupied an area larger and more than that which was in the control group cows. These results suggest that cows with fatty liver have a hepatic injury.

3.4. Effects of Hepatic Steatosis on Enzyme Activities of SIRT1, SREBP-1c, PGC-1α and Redox Index

The effects of hepatic steatosis on hepatic SIRT1, sterol regulatory element binding transcription factor 1 (SREBP-1c), peroxisome proliferator-activated receptor γ coactivator-1 alpha (PGC-1α), oxidation and antioxidation activities in the liver are shown in Figure 3. The SIRT1, catalase (CAT) and glutathione peroxidase (GSH-Px) activities of the fatty liver group were significantly reduced (p < 0.05). The enzyme activities of Cu/Zn superoxide dismutase (SOD), Mn SOD and the content of glutathione (GSH) in the fatty liver group were significantly lower than those in the control group (p < 0.01). The GSSG (Figure 3I) contents in the fatty liver were higher than those in the control group liver (p < 0.01). The cow livers in the fatty liver group generated more reactive oxygen species (ROS) compared to the cow livers in the control group (p < 0.01, Figure 3J). Besides, mRNA abundance of CAT, GSH-Px and Mn SOD have a greater decrease (p < 0.01, Table 5) compared with the fatty liver group.

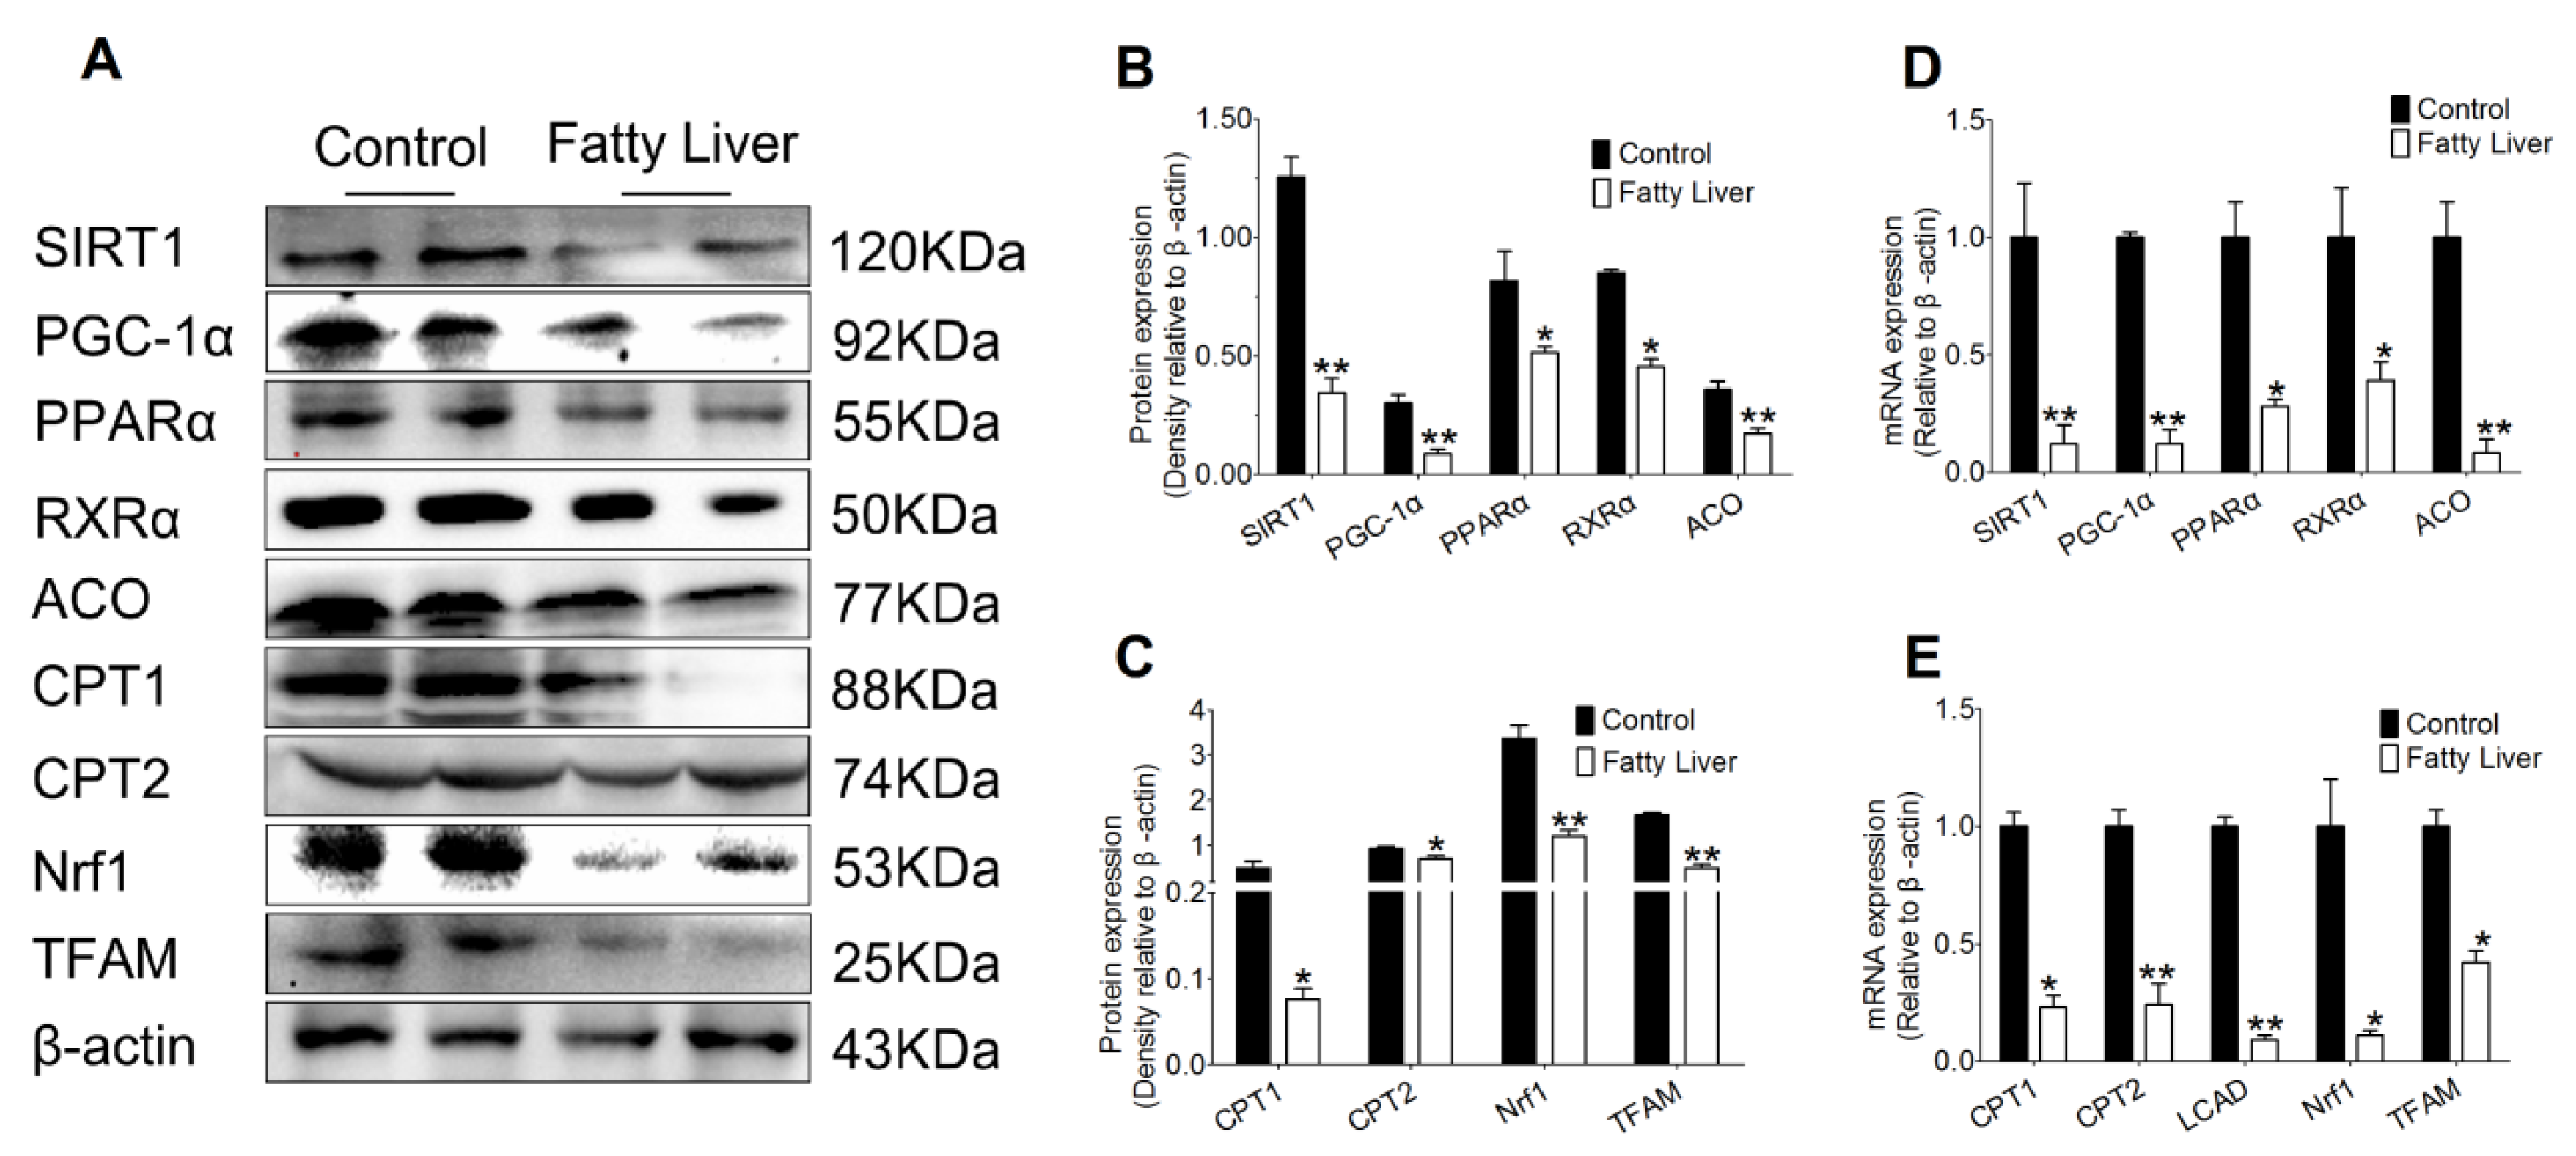
3.5. Effect of Hepatic Steatosis on the Protein and mRNA Abundance of Fatty Acid Oxidation Proteins

To explore the effect of hepatic steatosis on hepatic lipid metabolism, we measured the protein and mRNA abundance of different enzymes involved in lipid acid oxidation process. As shown in Figure 4A–C, compared with the control group, a greater downregulation of SIRT1 took place in liver tissues of the fatty liver group (p < 0.01). Additionally, hepatic steatosis (fatty liver group) led to a lower protein abundance of SIRT1 related transcription factors PGC-1α and peroxisome proliferator-activated receptor alpha (PPARα) (p < 0.05 or p < 0.01). Subsequently, the transcription factors target genes retinoid X receptor alpha (RXRα), acyl coenzyme A oxidase (ACO), carnitine palmitoyltransferase 1 (CPT1), carnitine palmitoyltransferase 2 (CPT2), nuclear respiratory factor 1 (Nrf1) and transcription factor A (TFAM) decreased in the fatty liver group (p < 0.05 or p < 0.01).
Meanwhile, mRNA abundance of fatty acid oxidation proteins, including SIRT1, PGC-1α, PPARα, RXRα, ACO, CPT1, CPT2, long chain acyl-CoA dehydrogenase (LCAD), Nrf1 and TFAM were observed. As shown in Figure 4D, mRNA abundance of SIRT1 and its downstream transcription factors PGC-1αand PPARα decreased in the liver tissue of the fatty liver group compared with the control group (p < 0.05 or p < 0.01). Furthermore, compared with the control group, hepatic steatosis (fatty liver group) led to decreased mRNA abundance of RXRα, ACO, CPT1, CPT2, LCAD, Nrf1 and TFAM (p < 0.05 or p < 0.01).

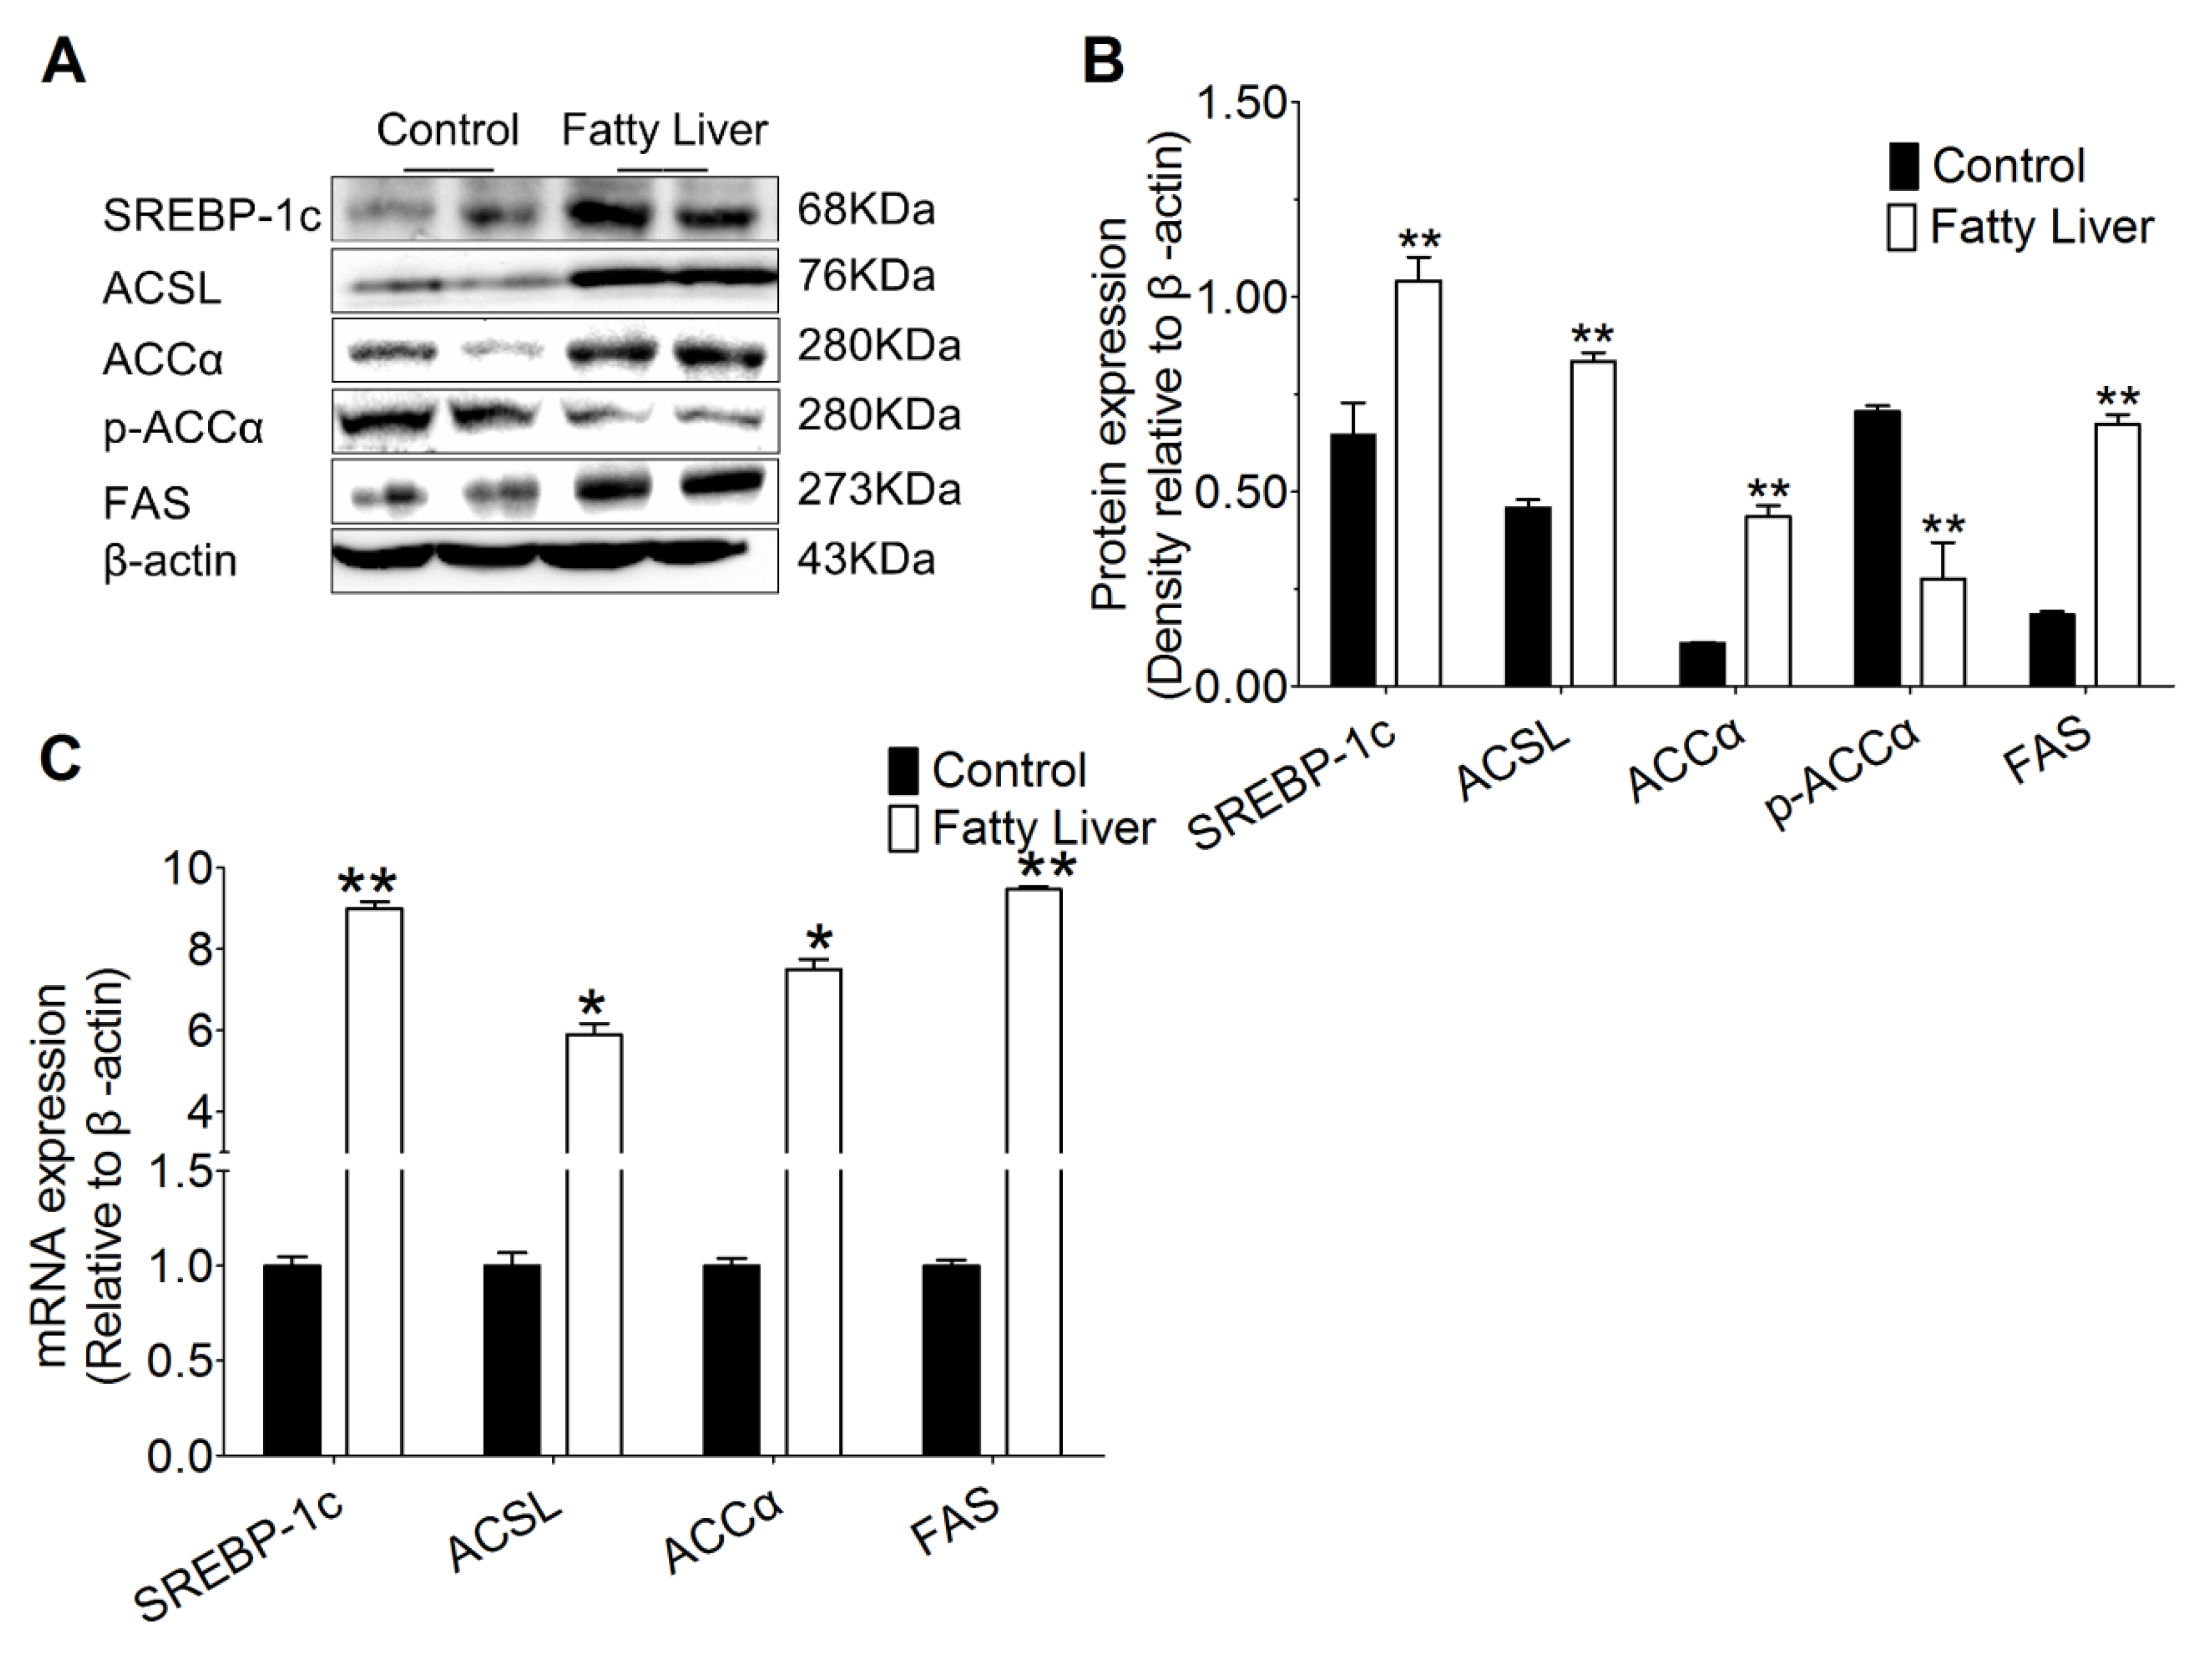
3.6. Hepatic Steatosis Enhances Protein and mRNA Abundance of Hepatic Lipogenesis

As shown in Figure 5A,B, compared with the control group, hepatic steatosis (fatty liver group) increased protein abundance of SIRT1 related transcription factor SREBP-1c (p < 0.01). Moreover, the transcription factors target genes including acyl-CoA synthetase long chain family member 1 (ACSL1) and fatty acid synthetase (FAS) increased in liver tissue of fatty liver group (p < 0.01). It is noteworthy that, protein abundance of acetyl-CoA carboxylase alpha (ACCα) being greater increase compared with the control group, hepatic steatosis (fatty liver group) led to lower p-ACCα and p-ACCα/ACCα.
Compared with the control group, mRNA abundance of SREBP-1c and its target genes ACSL and FAS had a greater increase in liver tissue of the fatty liver group (p < 0.01, Figure 5C). Hepatic steatosis (fatty liver group) also led to increased mRNA abundance of ACCα compared with control.

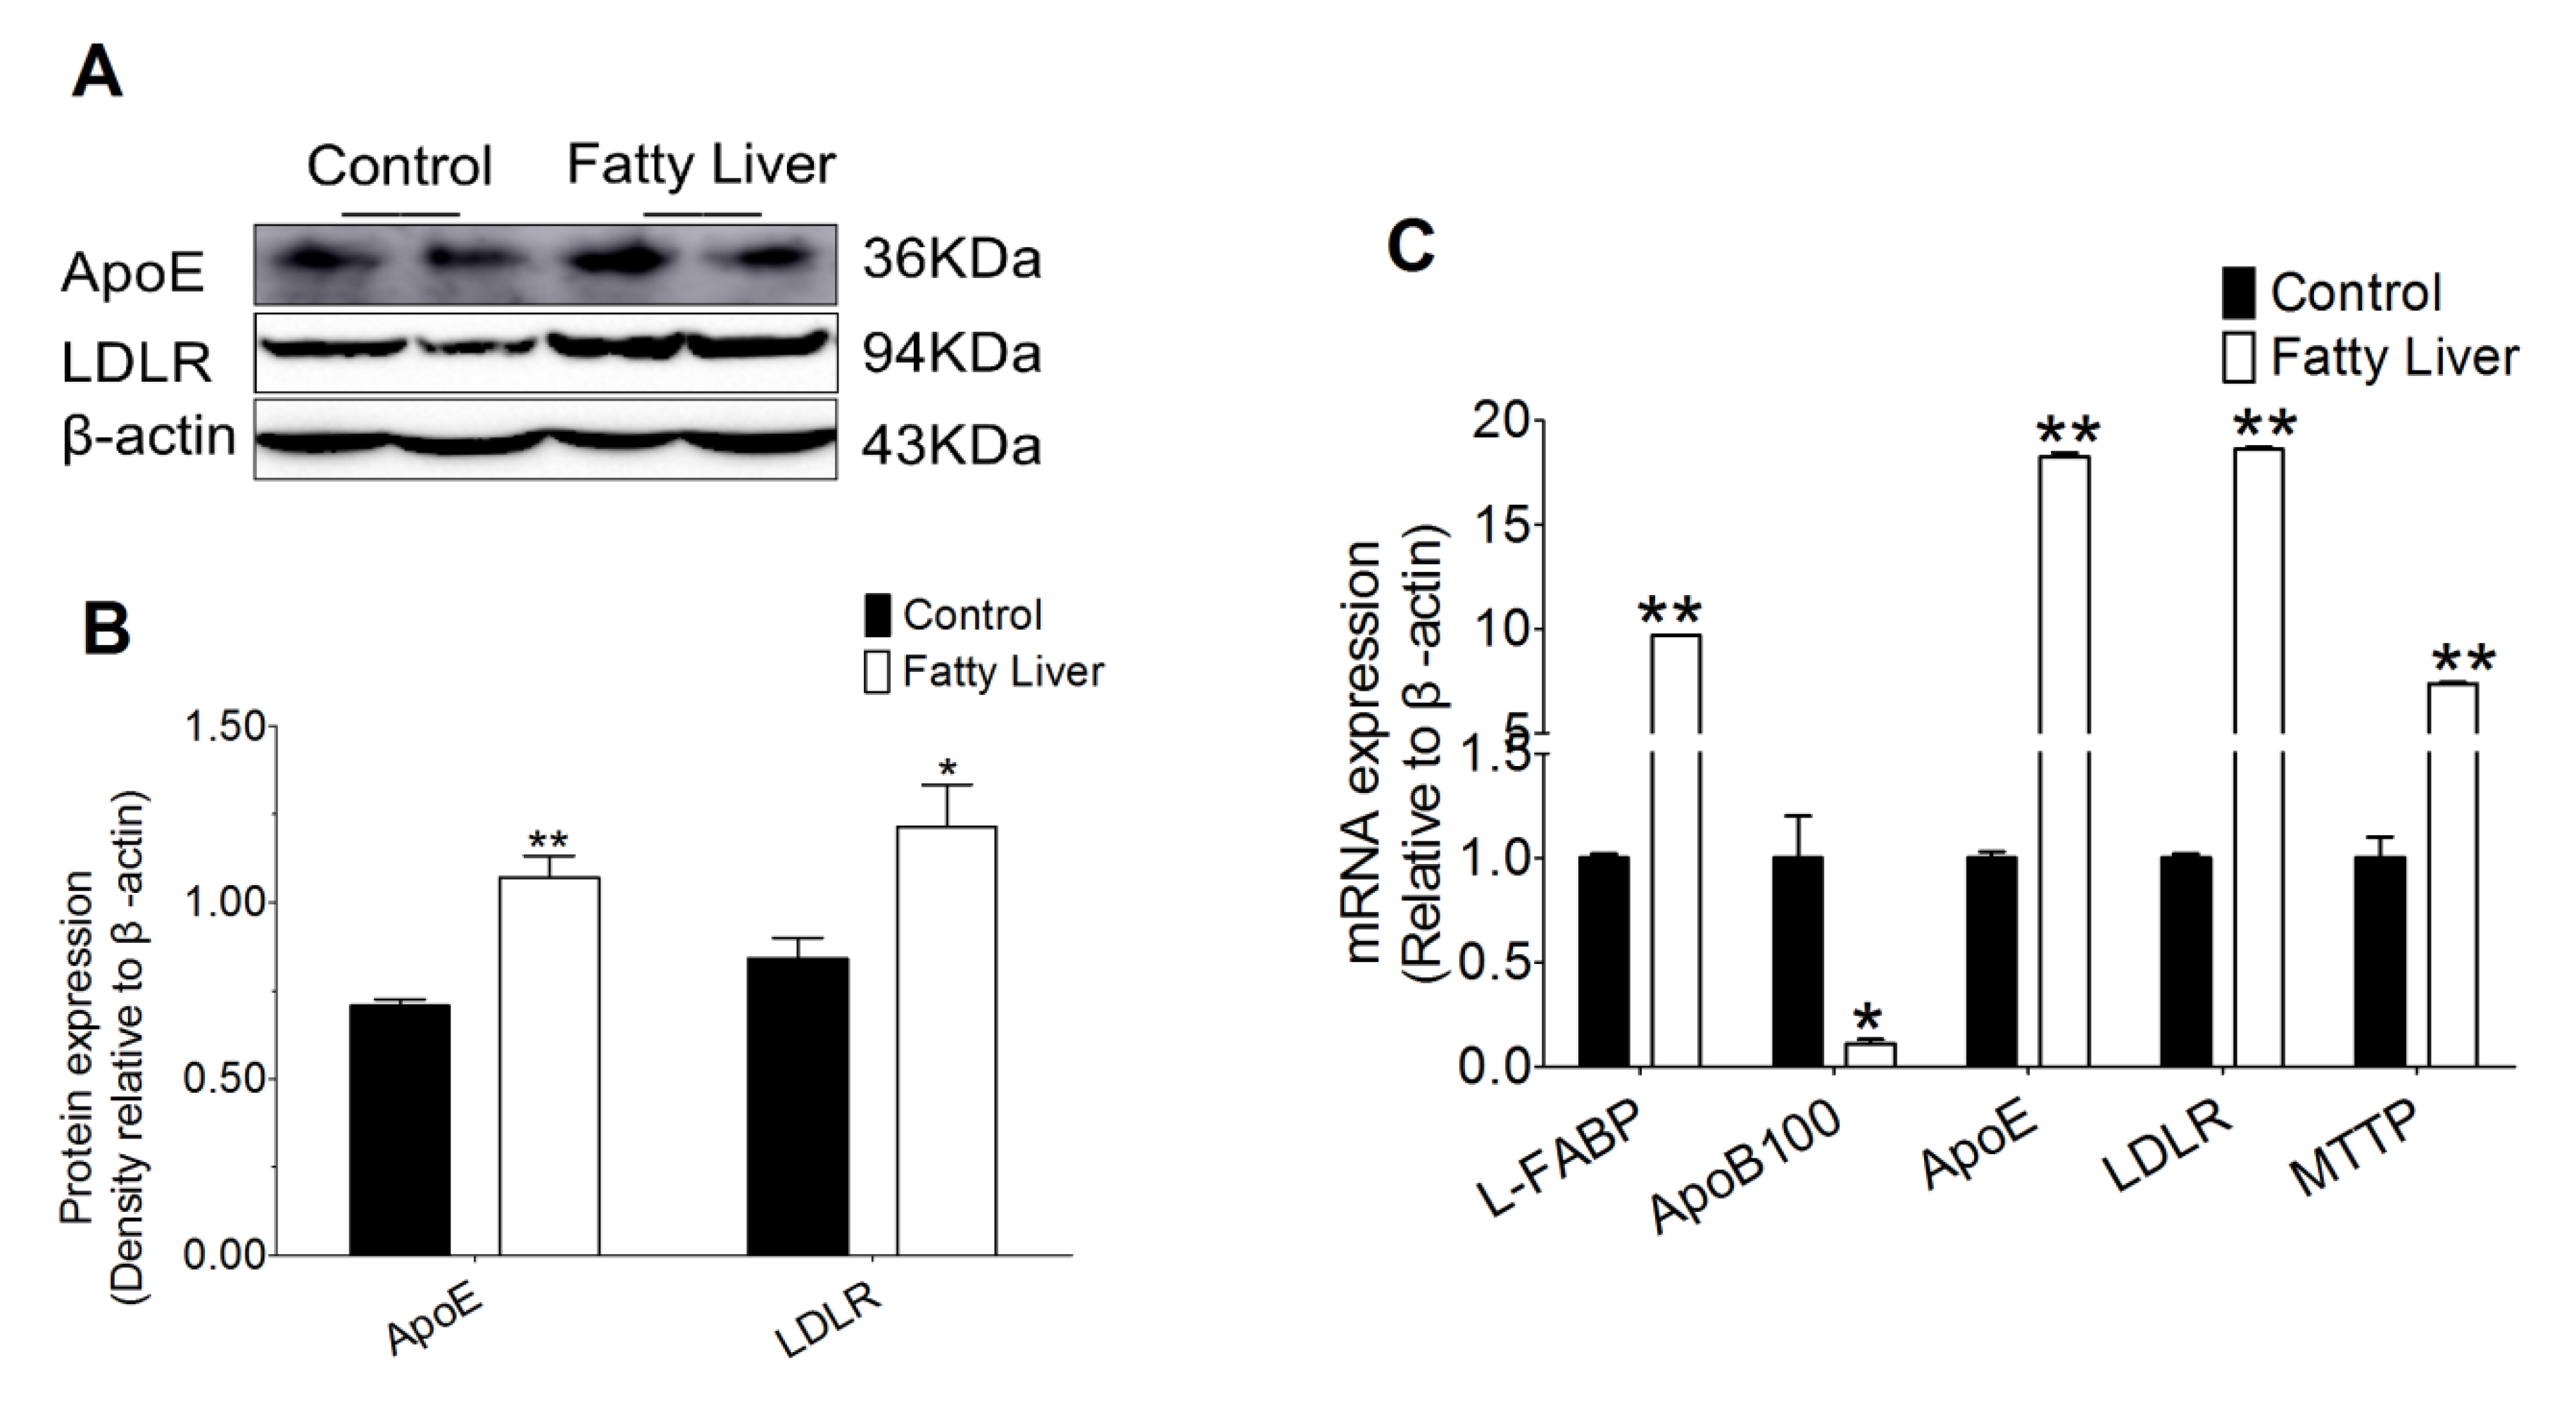
3.7. Effect of Hepatic Steatosis on Hepatic Lipid Transport Related Proteins

We also found that the protein abundance of hepatic lipid transport including apolipoprotein E (ApoE) and low density lipoprotein receptor (LDLR) in the fatty liver group were increased, compared with the control group (p < 0.05 or p < 0.01, Figure 6A,B). Liver tissue in the fatty liver group had greater mRNA abundance of liver fatty acid binding proteins (L-FABP), apolipoprotein E (ApoE), low density lipoprotein receptor (LDLR) and microsomal triglyceride transfer protein (MTTP) compared with the control group (p < 0.01, Figure 6C). However, mRNA abundance of apolipoprotein B 100 (ApoB100) decreased in the liver tissue of the fatty liver group.

4. Discussion

The present study provides the basis for further animal and clinical studies to validate the mechanism, namely SIRT1, as a nicotinamide adenine dinucleotide (NAD+, NADH)-dependent class III protein deacetylase, which is a key regulator of energy homeostasis in response to nutrient availability. Negative energy balance is a normal incidence in dairy cows during the transition from late gestation to early lactation [27]. It occurs because the energy demands for early milk production cannot be completely met by feed intake [3], during which most infectious and metabolic diseases are likely to occur, such as hepatic steatosis [1,4]. Our study showed that fatty liver significantly decreased DMI, milk yield, the milk protein and MUN, and significantly increased SCC, which indicates that fatty liver decreased the milk production and negatively affect milk quality. Furthermore, the protein, as well as the levels of Chol and TG were higher in the livers of fatty liver dairy cows. The liver is of immediate importance in maintaining health and plays a key role in the development of impaired metabolic regulation [28]. Previous studies have highlighted the importance of SIRT1 in cell metabolism, but mainly focused on the upstream regulation of SIRT1, and did not explore the mechanisms regarding SIRT1, lipid metabolism and oxidative stress [29,30,31]. In the present study, our results showed that hepatic steatosis decreased SIRT1 activity that facilitated hepatic fatty acid synthesis and inhibited fatty acid oxidation and lipid transport.
While SIRT1 is mainly localized in the nucleus, it is also present in the cytosol [30]. It deacetylates a variety of protein targets [32]. Hepatic SIRT1 deficiency in mice impairs lipid metabolism and results in hepatic steatosis [31,33]. Treatment with resveratrol, a SIRT1 activator, ameliorates fatty liver with a reduction in the expression of lipogenic enzymes in mice exhibiting obesity and insulin resistance [34,35,36]. Numerous studies have demonstrated that SIRT1 can act as a signaling molecule that promotes lipid metabolism by affecting the expressions of the genes controlling fatty acid synthesis, fatty acid oxidation and lipid transport [37]. It was reported that fatty livers facilitate the development of hepatic steatosis by upregulating primarily the lipogenic pathway genes via the SREBP-1c signaling pathway and down-regulating the lipid oxidizing genes predominantly via the SIRT1 and PGC-1α signaling pathways, which is in agreement with our results. Concomitant with the occurrence of hepatic steatosis, oxidative stress is an established risk factor for the development of lipid metabolism disorders at least partly through the SIRT1-SREBP-1c/ PGC-1α signaling pathway.
Previous studies suggest that excess lipid accumulation is associated with fatty liver through oxidative stress [38,39]. Also, it is found that oxidative stress participates in liver disease both in humans and animal models [40,41]. Oxidative stress is caused by an imbalance between the generation of ROS and the defense capabilities of antioxidants [42]. Previous studies on dairy cows have also demonstrated that elevated NEFA during the periparturient period largely activates oxidative stress [43]. Further results from in vivo study indicate that the primary approaches to prevent the occurrence of fatty liver disease in cows are counteracted oxidative damage [44]. However, most studies focus on the blood oxidative and antioxidative levels to assess the oxidative stress status of dairy cows. Fortunately, the oxidative status of ketotic dairy cows had been evaluated by liver biopsies [12]. As shown in the present study, the activities of hepatic CAT and GSH-Px and the GSH content had a greater reduction in dairy cows with fatty livers. However, the hepatic GSSG and ROS contents were significantly increased in dairy cows with fatty livers compared with the control group. Herein, our results indicated that dairy cows with fatty livers showed redox imbalance, which was in agreement with a previous report.
Fatty liver disease mainly occurs when fat accumulation is caused by impairing fatty acid oxidation along with increased lipid synthesis [44]. PPARαregulates the lipid oxidation genes expression involved in lipid oxidation, including ACO, CTP1 and CPT2 [45,46]. ACO has been considered as the rate-limiting enzyme for fatty acid oxidation [47]. CTP1 and CPT2 are thought to be the key enzymes in the process of transferring fatty acids into the mitochondria for β-oxidation [45]. In bovine hepatocytes treated 0.15, 0.30 and 0.45 mM non-esterified fatty acids (NEFA) induced the increased PPARα, ACO, CPT1 and CPT2 relative mRNA expression [48]. However, in another vivo study, high-fat diet induced the decreased expression of ACO and CPT2, but had a slight decrease in the CPT2 expression in mice [49]. In the present study, we demonstrated that fatty liver led to a greater reduction of PPARα, ACO, CPT1 and CPT2 protein and mRNA abundance. Our data indicate that hepatic steatosis impaired fatty acid oxidation. PGC-1α plays a crucial role in energy metabolism regulation and stimulates mitochondrial biogenesis via regulating NRF1 and TFAM [50,51]. RXRα was recognized as the receptor of PGC-1α [52]. LCAD, a mitochondrial enzyme, is involved in the branched chain and unsaturated fatty acids oxidation. In this study, the protein and mRNA abundance of hepatic PGC-1α, NRF1, TFAM and RXRα was decreased in fatty liver dairy cows compared with the control group. However, it was reported that the protein levels of PGC-1α decreased in mice with fatty liver followed by reduction of NRF1 and TFAM, the mRNA abundance of PGC-1α increased [53]. The discrepancies between the previous study and our results attribute to different animal species. The mRNA abundance of LCAD had a greater reduction in the dairy cows with fatty livers. These results show that it is highly likely that PGC-1α, NRF1, TFAM and LCAD are associated with fatty liver disease in dairy cows.
SREBP-1c is considered as an important activator of lipid synthesis by regulating lipogenic genes ACSL, ACCα and FAS [54]. ACSL is a key enzyme and involved in the first step of fatty acid metabolism [55]. ACCα is thought to synthesis long chain fatty acids [56]. FAS, a key lipogenic enzyme, catalyzes the long chain fatty acid synthesis [57]. Moreover, the protein and mRNA abundance of SREBP-1c and its downstream gene ACSL, ACCα and FAS were significantly increased, but the phosphorylation of ACCα decreased. In the present study, the mRNA abundance of L-FABP, a lipid transport protein, markedly increased in the dairy cows with fatty liver. ApoE, ApoB100 and MTT are used to the lipid synthesis and VLDL assembly [58]. Otherwise, ApoE and ApoB100 play a key role in cholesterol transport by binding to LDLR [59]. In this study, the protein and mRNA abundance of ApoE and LDLR and the mRNA abundance of MTP and ApoB100 significantly increased in the dairy cows with fatty liver. Our results demonstrated lipid transport was affected after hepatic steatosis happened to dairy cows. It reports that dysregulation of lipid metabolic pathways results in the development of hepatic steatosis and contributes to the development of chronic hepatic inflammation, insulin resistance and liver damage [60]. The aforementioned studies showing that hepatic steatosis decreased SIRT1 activity suggest that the SIRT1-SREBP-1c/PGC-1α signaling pathway could influence oxidative stress. Nevertheless, whether lipid deposition affects the oxidative stress through the SIRT1-SREBP-1c/PGC-1α signaling pathway remains to be investigated in the future study.
Based on these results it can be concluded that SIRT1/PGC-1α/SREBP-1c and redox are involved in fatty liver dairy cows by promoting hepatic fatty acid synthesis, impairing fatty acid β-oxidation and reducing lipid transport. Limitations of the present study is the relatively small sample size. However, this study provides a foundation for future investigations of lipid metabolism disorder disease during the transition period.

5. Conclusions

These results demonstrate that decreased SIRT1 associated with hepatic steatosis promotes hepatic fatty acid synthesis, inhibits fatty acid β-oxidation and reduces lipid transport. Hence, SIRT1 may represent a novel therapeutic target for the treatment of fatty liver disease in dairy cows.

Author Contributions

Performed experiments and drafted the manuscript by Y.L., S.Z. and H.D.; performed experiments and analyzed the data Y.L., S.Z., H.D., N.H., Y.H., and S.F.; contributed to the experimental design and manuscript J.T., J.C., J.L., X.W., and J.W.; conceived the idea, designed the experiment, and finalized the manuscript, X.W., and J.W. All authors have read and agreed to the published version of the manuscript.

Funding

This work was supported by the National Natural Science Foundation of China (Nos. 31873029 and 31502136), the Anhui province Natural Science Foundation of China (1608085QC56), the collection, analysis of this study was supported by the Project of Modern Agricultural Industry and Technology System of Anhui Province (AHCYJSTX-07), Graduate Innovation Fund Project of Anhui Agricultural University (2017yjs-16) and Agricultural Industry Chief Expert Studio of Hefei City (dairy cows farming). The authors would like to thank the staff at the dairy cow farm in Anhui Province for their kind help in conducting the animal part of the present study. We thank the Biotechnology center of Anhui Agricultural University (Hefei, China) and the laboratory team of the Clinical Veterinary Medicine (Anhui Agricultural University, China). Finally, the authors would like to thank Jihong Dong for her assistance in analyzing the real-time PCR and western blot data presented in this paper.

Conflicts of Interest

The authors have no conflicts of interest to declare.

References

  1. Havlin, J.M.; Robinson, P.H.; Garrett, J.E. Niacin feeding to fresh dairy cows: Immediate effects on health and milk production. Anim. Prod. Sci. 2017, 57, 1069–1078. [Google Scholar] [CrossRef]
  2. Li, Y.; Ding, H.; Wang, X.; Liu, L.; Huang, D.; Zhang, R.; Guo, L.; Wang, Z.; Li, X.; Liu, G. High levels of acetoacetate and glucose increase expression of cytokines in bovine hepatocytes, through activation of the NF-κB signalling pathway. J. Dairy Res. 2016, 83, 51–57. [Google Scholar] [CrossRef] [PubMed]
  3. McArt, J.A.A.; Nydam, D.V.; Oetzel, G.R.; Overton, T.R.; Ospina, P.A. Elevated non-esterified fatty acids and β-hydroxybutyrate and their association with transition dairy cow performance. Vet. J. 2013, 198, 560–570. [Google Scholar] [CrossRef] [PubMed]
  4. Birkenfeld, A.L.; Shulman, G.I. Nonalcoholic fatty liver disease, hepatic insulin resistance, and type 2 diabetes. Hepatology 2014, 59, 713–723. [Google Scholar] [CrossRef] [PubMed] [Green Version]
  5. Sun, X.; Yuan, X.; Chen, L.; Wang, T.; Wang, Z.; Sun, G.; Li, X.; Li, X.; Liu, G. Histamine induces bovine rumen epithelial cell inflammatory response via NF-κB pathway. Cell. Physiol. Biochem. 2017, 42, 1109–1119. [Google Scholar] [CrossRef]
  6. Chung, S.W.; Yao, H.W.; Caito, S.; Hwang, J.-W.; Arunachalam, G.; Rahman, I. Regulation of SIRT1 in cellular functions: Role of polyphenols. Arc. Biochem. Biophys. 2010, 501, 79–90. [Google Scholar] [CrossRef] [Green Version]
  7. Cheng, Y.; Takeuchi, H.; Sonobe, Y.; Jin, S.; Wang, Y.; Horiuchi, H.; Parajuli, B.; Kawanokuchi, J.; Mizuno, T.; Suzumura, A. Sirtuin 1 attenuates oxidative stress via upregulation of superoxide dismutase 2 and catalase in astrocytes. J. Neuroimmunol. 2014, 269, 38–43. [Google Scholar] [CrossRef]
  8. Hasegawa, K.; Wakino, S.; Yoshioka, K.; Tatematsu, S.; Hara, Y.; Minakuchi, H.; Washida, N.; Tokuyama, H.; Hayashi, K.; Itoh, H. Sirt1 protects against oxidative stress-induced renal tubular cell apoptosis by the bidirectional regulation of catalase expression. Biochem. Bioph. Res. Co. 2008, 372, 51–56. [Google Scholar] [CrossRef]
  9. Chan, S.-H.; Hung, C.-H.; Shih, J.-Y.; Chu, P.-M.; Cheng, Y.-H.; Lin, H.-C.; Tsai, K.-L. SIRT1 inhibition causes oxidative stress and inflammation in patients with coronary artery disease. Redox Bio. 2017, 13, 301–309. [Google Scholar] [CrossRef]
  10. De, D.; Halder, D.; Shin, I.; Kim, K.K. Small molecule-induced cellular conversion. Chem. Soc. Rev. 2017, 46, 6241–6254. [Google Scholar] [CrossRef]
  11. Wu, D.; Hu, Q.; Liu, X.; Pan, L.; Xiong, Q.; Zhu, Y.Z. Hydrogen sulfide protects against apoptosis under oxidative stress through SIRT1 pathway in H9c2 cardiomyocytes. Nitric Oxide 2015, 46, 204–212. [Google Scholar] [CrossRef] [PubMed]
  12. Du, X.; Shi, Z.; Peng, Z.; Zhao, C.; Zhang, Y.; Wang, Z.; Li, X.; Liu, G.; Li, X. Acetoacetate induces hepatocytes apoptosis by the ROS-mediated MAPKs pathway in ketotic cows. J. Cell. Physiol. 2017, 232, 3296–3308. [Google Scholar] [CrossRef] [PubMed]
  13. Li, Y.; Ding, H.Y.; Wang, X.C.; Feng, S.B.; Li, X.B.; Wang, Z.; Liu, G.W.; Li, X.W. An association between the level of oxidative stress and the concentrations of NEFA and BHBA in the plasma of ketotic dairy cows. J. Anim. Physiol. An. N. 2017, 100, 844–851. [Google Scholar] [CrossRef] [PubMed]
  14. Thakran, S.; Sharma, P.; Attia, R.R.; Hori, R.T.; Deng, X.; Elam, M.B.; Park, E.A. Role of sirtuin 1 in the regulation of hepatic gene expression by thyroid hormone. J. Biol. Chem. 2013, 288, 807–818. [Google Scholar] [CrossRef] [Green Version]
  15. Li, H.; Xu, M.; Lee, J.; He, C.; Xie, Z. Leucine supplementation increases SIRT1 expression and prevents mitochondrial dysfunction and metabolic disorders in high-fat diet-induced obese mice. Am. J. Physiol. Endoc. M. 2012, 303, E1234–E1244. [Google Scholar] [CrossRef] [Green Version]
  16. Jeon, B.T.; Kim, K.E.; Shin, H.J.; Yi, C.-o.; Hah, Y.-S.; Kim, W.-H.; Lee, S.-I.; Roh, G.S. Myeloid-specific deletion of SIRT1 increases hepatic steatosis and hypothalamic inflammation in mice fed a high-fat diet. Metab. Brain Dis. 2014, 29, 635–643. [Google Scholar] [CrossRef]
  17. Rao, Y.; Yu, H.; Gao, L.; Lu, Y.; Xu, Z.; Liu, H.; Gu, L.; Ye, J.; Huang, Z. Natural alkaloid bouchardatine ameliorates metabolic disorders in high-fat diet-fed mice by stimulating the sirtuin 1/liver kinase B-1/AMPK axis. Brit. J. Pharmacol. 2017, 174, 2457–2470. [Google Scholar] [CrossRef]
  18. Deng, X.; Chen, L.; Li, N. The expression of SIRT1 in nonalcoholic fatty liver disease induced by high-fat diet in rats. Liver Int. 2007, 27, 708–715. [Google Scholar] [CrossRef]
  19. Xu, F.; Gao, Z.; Zhang, J.; Rivera, C.A.; Yin, J.; Weng, J.; Ye, J. Lack of SIRT1 (Mammalian Sirtuin 1) activity leads to liver steatosis in the SIRT1+/- mice: A role of lipid mobilization and inflammation. Endocrinology 2010, 151, 2504–2514. [Google Scholar] [CrossRef] [Green Version]
  20. Li, X.; Zhang, S.; Blander, G.; Jeanette, G.T.; Krieger, M.; Guarente, L. SIRT1 deacetylates and positively regulates the nuclear receptor LXR. Mol. Cell 2007, 28, 91–106. [Google Scholar] [CrossRef]
  21. Pfluger, P.T.; Herranz, D.; Velasco-Miguel, S.; Serrano, M.; Tschöp, M.H. Sirt1 protects against high-fat diet-induced metabolic damage. Proc. Natl Acad. Sci. USA 2008, 105, 9793–9798. [Google Scholar] [CrossRef] [PubMed] [Green Version]
  22. Zhu, Y.W.; Guan, Y.; Loor, J.J.; Sha, X.Y.; Coleman, D.N.; Zhang, C.; Du, X.L.; Shi, Z.; Li, X.B.; Wang, Z.; et al. Fatty acid-induced endoplasmic reticulum stress promoted lipid accumulation in calf hepatocytes, and endoplasmic reticulum stress existed in the liver of severe fatty liver cows. J. Dairy Sci. 2019, 102, 7359–7370. [Google Scholar] [CrossRef] [PubMed]
  23. Dong, J.H.; Loor, J.J.; Zuo, R.K.; Chen, X.Y.; Liang, Y.S.; Wang, Y.Z.; Shu, X.; Sun, X.D.; Jia, H.D.; Liu, G.W.; et al. Low abundance of mitofusin 2 in dairy cows with moderate fatty liver is associated with alterations in hepatic lipid metabolism. J. Dairy Sci. 2019, 102, 7536–7547. [Google Scholar] [CrossRef] [PubMed]
  24. Cheng, J.B.; Bu, D.P.; Wang, J.Q.; Sun, X.Z.; Pan, L.; Zhou, L.Y.; Liu, W. Effects of rumen-protected γ-aminobutyric acid on performance and nutrient digestibility in heat-stressed dairy cows. J. Dairy Sci. 2014, 97, 5599–5607. [Google Scholar] [CrossRef] [PubMed] [Green Version]
  25. Cheng, J.; Liu, C.; Hu, K.; Greenberg, A.; Wu, D.; Ausman, L.M.; McBurney, M.W.; Wang, X.-D. Ablation of systemic SIRT1 activity promotes nonalcoholic fatty liver disease by affecting liver-mesenteric adipose tissue fatty acid mobilization. BBA-Mol. Basis Dis. 2017, 1863, 2783–2790. [Google Scholar] [CrossRef] [PubMed]
  26. Pfaffl, M.W. A new mathematical model for relative quantification in real-time RT-PCR. Nucleic Acids Res. 2001, 29, e45. [Google Scholar] [CrossRef]
  27. Ospina, P.A.; McArt, J.A.; Overton, T.R.; Stokol, T.; Nydam, D.V. Using nonesterified fatty acids and β-hydroxybutyrate concentrations during the transition period for herd-level monitoring of increased risk of disease and decreased reproductive and milking performance. Vet. Clin. Food A. 2013, 29, 387–412. [Google Scholar] [CrossRef]
  28. Ntambi, J.M. Hepatic de Novo Lipogenesis and Regulation of Metabolism; Springer: New York, NY, USA, 2015. [Google Scholar]
  29. Cantó, C.; Gerhart-Hines, Z.; Feige, J.N.; Lagouge, M.; Noriega, L.; Milne, J.C.; Elliott, P.J.; Puigserver, P.; Auwerx, J. AMPK regulates energy expenditure by modulating NAD+ metabolism and SIRT1 activity. Nature 2009, 458, 1056–1060. [Google Scholar] [CrossRef]
  30. Han, C.; Wan, H.; Ma, S.; Liu, D.; He, F.; Wang, J.; Pan, Z.; Liu, H.; Li, L.; He, H. RETRACTED: Role of mammalian sirtuin 1 (SIRT1) in lipids metabolism and cell proliferation of goose primary hepatocytes. Mol. Cell. Endocrin. 2014, 382, 282–291. [Google Scholar] [CrossRef]
  31. Purushotham, A.; Schug, T.T.; Xu, Q.; Surapureddi, S.; Guo, X.; Li, X. Hepatocyte-specific deletion of SIRT1 alters fatty acid metabolism and results in hepatic steatosis and inflammation. Cell Metab. 2009, 9, 327–338. [Google Scholar] [CrossRef] [Green Version]
  32. Yu, J.; Auwerx, J. Protein deacetylation by SIRT1: An emerging key post-translational modification in metabolic regulation. Pharmacol. Res. 2010, 62, 35–41. [Google Scholar] [CrossRef] [PubMed] [Green Version]
  33. Wang, R.-H.; Kim, H.-S.; Xiao, C.; Xu, X.; Gavrilova, O.; Deng, C.-X. Hepatic Sirt1 deficiency in mice impairs mTorc2/Akt signaling and results in hyperglycemia, oxidative damage, and insulin resistance. J. Clin. Invest. 2011, 121, 4477–4490. [Google Scholar] [CrossRef] [PubMed] [Green Version]
  34. Ajmo, J.M.; Liang, X.; Rogers, C.Q.; Pennock, B.; You, M. Resveratrol alleviates alcoholic fatty liver in mice. Am. J. Physiol. Gastr. L. 2008, 295, G833–G842. [Google Scholar] [CrossRef] [PubMed] [Green Version]
  35. Baur, J.A.; Pearson, K.J.; Price, N.L.; Jamieson, H.A.; Lerin, C.; Kalra, A.; Prabhu, V.V.; Allard, J.S.; Lopez-Lluch, G.; Lewis, K. Resveratrol improves health and survival of mice on a high-calorie diet. Nature 2006, 444, 337–342. [Google Scholar] [CrossRef] [PubMed]
  36. Shang, J.; Chen, L.-l.; Xiao, F.-x.; Sun, H.; Ding, H.-c.; Xiao, H. Resveratrol improves non-alcoholic fatty liver disease by activating AMP-activated protein kinase. Acta Pharmacol. Sin. 2008, 29, 698–706. [Google Scholar] [CrossRef] [Green Version]
  37. Rodgers, J.T.; Puigserver, P. Fasting-dependent glucose and lipid metabolic response through hepatic sirtuin 1. Proc. Natl. Acad. Sci. USA 2007, 104, 12861–12866. [Google Scholar] [CrossRef] [Green Version]
  38. Satapati, S.; Kucejova, B.; Duarte, J.A.G.; Fletcher, J.A.; Reynolds, L.; Sunny, N.E.; He, T.; Nair, L.A.; Livingston, K.; Fu, X. Mitochondrial metabolism mediates oxidative stress and inflammation in fatty liver. J. Clin. Invest. 2015, 125, 4447–4462. [Google Scholar] [CrossRef] [Green Version]
  39. Du, X.L.; Chen, L.; Huang, D.; Peng, Z.C.; Zhao, C.X.; Zhang, Y.M.; Zhu, Y.W.; Wang, Z.; Li, X.W.; Liu, G.W. Elevated apoptosis in the liver of dairy cows with ketosis. Cell. Physiol. Biochem. 2017, 43, 568–578. [Google Scholar] [CrossRef]
  40. Shaw, J.E.; Sicree, R.A.; Zimmet, P.Z. Global estimates of the prevalence of diabetes for 2010 and 2030. Diabetes Res. Clin. Pr. 2010, 87, 4–14. [Google Scholar] [CrossRef]
  41. Oliveira, C.P.M.S.; da Costa Gayotto, L.C.; Tatai, C.; Della Bina, B.I.; Janiszewski, M.; Lima, E.S.; Abdalla, D.S.P.; Lopasso, F.P.; Laurindo, F.R.M.; Laudanna, A.A. Oxidative stress in the pathogenesis of nonalcoholic fatty liver disease, in rats fed with a choline-deficient diet. J. Cell. Mol. Med. 2002, 6, 399–406. [Google Scholar] [CrossRef]
  42. Lee, J.W.; Davis, J.M. Future applications of antioxidants in premature infants. Curr. Opin. Pediatr. 2011, 23, 161. [Google Scholar] [CrossRef] [PubMed] [Green Version]
  43. Bernabucci, U.; Ronchi, B.; Lacetera, N.; Nardone, A. Influence of body condition score on relationships between metabolic status and oxidative stress in periparturient dairy cows. J. Dairy Sci. 2005, 88, 2017–2026. [Google Scholar] [CrossRef] [Green Version]
  44. Bobe, G.; Young, J.W.; Beitz, D.C. Invited review: Pathology, etiology, prevention, and treatment of fatty liver in dairy cows. J. Dairy Sci. 2004, 87, 3105–3124. [Google Scholar] [CrossRef] [Green Version]
  45. Qiu, L.X.; Wu, X.C.; Chau, J.F.L.; Szeto, I.Y.Y.; Tam, W.Y.; Guo, Z.S.; Chung, S.K.; Oates, P.J.; Chung, S.S.M.; Yang, J.Y. Aldose reductase regulates hepatic peroxisome proliferator-activated receptor α phosphorylation and activity to impact lipid homeostasis. J. Biol. Chem. 2008, 283, 17175–17183. [Google Scholar] [CrossRef] [PubMed] [Green Version]
  46. Sugden, M.C.; Bulmer, K.; Gibbons, G.F.; Knight, B.L.; Holness, M.J. Peroxisome-proliferator-activated receptor-α (PPARα) deficiency leads to dysregulation of hepatic lipid and carbohydrate metabolism by fatty acids and insulin. Biochem. J. 2002, 364, 361–368. [Google Scholar] [CrossRef] [Green Version]
  47. Eaton, S. Control of mitochondrial β-oxidation flux. Prog. Lipid Res. 2002, 41, 197–239. [Google Scholar] [CrossRef]
  48. Li, X.W.; Li, X.B.; Chen, H.; Lei, L.; Liu, J.X.; Guan, Y.; Liu, Z.X.; Zhang, L.; Yang, W.T.; Zhao, C.X.; et al. Non-esterified fatty acids activate the AMP-activated protein kinase signaling pathway to regulate lipid metabolism in bovine hepatocytes. Cell Biochem. Biophy. 2013, 67, 1157–1169. [Google Scholar] [CrossRef]
  49. Noh, H.; Lee, H.; Kim, E.; Mu, L.; Rhee, Y.K.; Cho, C.-W.; Chung, J. Inhibitory effect of a Cirsium setidens extract on hepatic fat accumulation in mice fed a high-fat diet via the induction of fatty acid β-oxidation. Biosci. Biotech. Bioch. 2013, 77, 1424–1429. [Google Scholar] [CrossRef] [Green Version]
  50. Laubenthal, L.; Hoelker, M.; Frahm, J.; Dänicke, S.; Gerlach, K.; Südekum, K.H.; Sauerwein, H.; Häussler, S. Mitochondrial DNA copy number and biogenesis in different tissues of early-and late-lactating dairy cows. J. Dairy Sci. 2016, 99, 1571–1583. [Google Scholar] [CrossRef] [Green Version]
  51. Laubenthal, L.; Ruda, L.; Sultana, N.; Winkler, J.; Rehage, J.; Meyer, U.; Dänicke, S.; Sauerwein, H.; Häussler, S. Effect of increasing body condition on oxidative stress and mitochondrial biogenesis in subcutaneous adipose tissue depot of nonlactating dairy cows. J. Dairy Sci. 2017, 100, 4976–4986. [Google Scholar] [CrossRef]
  52. Schreiber, S.N.; Knutti, D.; Brogli, K.; Uhlmann, T.; Kralli, A. The transcriptional coactivator PGC-1 regulates the expression and activity of the orphan nuclear receptor estrogen-related receptor α (ERRα). J. Biol. Chem. 2003, 278, 9013–9018. [Google Scholar] [CrossRef] [PubMed] [Green Version]
  53. Aharoni-Simon, M.; Hann-Obercyger, M.; Pen, S.; Madar, Z.; Tirosh, O. Fatty liver is associated with impaired activity of PPAR γ-coactivator 1 α (PGC1 α) and mitochondrial biogenesis in mice. Lab. Invest. 2011, 91, 1018–1028. [Google Scholar] [CrossRef] [PubMed] [Green Version]
  54. Porstmann, T.; Griffiths, B.; Chung, Y.-L.; Delpuech, O.; Griffiths, J.R.; Downward, J.; Schulze, A. PKB/Akt induces transcription of enzymes involved in cholesterol and fatty acid biosynthesis via activation of SREBP. Oncogene 2005, 24, 6465–6481. [Google Scholar] [CrossRef] [PubMed] [Green Version]
  55. Coleman, R.A.; Lewin, T.M.; Van Horn, C.G.; Gonzalez-Baró, M.R. Do long-chain acyl-CoA synthetases regulate fatty acid entry into synthetic versus degradative pathways? J. Nutr. 2002, 132, 2123–2126. [Google Scholar] [CrossRef] [PubMed] [Green Version]
  56. Wakil, S.J.; Stoops, J.K.; Joshi, V.C. Fatty acid synthesis and its regulation. Annu. Rev. Biochem. 1983, 52, 537–579. [Google Scholar] [CrossRef] [PubMed]
  57. Postic, C.; Girard, J. Contribution of de novo fatty acid synthesis to hepatic steatosis and insulin resistance: Lessons from genetically engineered mice. J. Clin. Invest. 2008, 118, 829–838. [Google Scholar] [CrossRef] [Green Version]
  58. Greenow, K.; Pearce, N.J.; Ramji, D.P. The key role of apolipoprotein E in atherosclerosis. J. Mol. Med. 2005, 83, 329–342. [Google Scholar] [CrossRef]
  59. Michaely, P.; Zhao, Z.Z.; Li, W.P.; Garuti, R.; Huang, L.J.; Hobbs, H.H.; Cohen, J.C. Identification of a VLDL-induced, FDNPVY-independent internalization mechanism for the LDLR. EMBO J. 2007, 26, 3273–3282. [Google Scholar] [CrossRef]
  60. Fabbrini, E.; Magkos, F. Hepatic steatosis as a marker of metabolic dysfunction. Nutrients 2015, 7, 4995–5019. [Google Scholar] [CrossRef] [Green Version]
Figure 1. Cows with fatty livers exhibit over the induction of hepatic lipid synthesis (A,B). Dairy cows were classified according to the hepatic triglyceride (TG) content into a control group (n = 6) and a fatty liver group (n = 6) dairy cows (B); The data presented are the mean ± SEM. * p < 0.05; ** p < 0.01.
Animals 10 00560 g001
Figure 2. Assessment of hepatic histology in the liver of the control group and fatty liver group. (A,B) Hematoxylin and Eosin staining of liver sections from the control group and fatty liver group. Original magnification: 20× (C,D) Liver sections were stained with Oil Red O and Hematoxylin stain for nuclei. Original magnification: 20×.
Animals 10 00560 g002
Figure 3. Effect of hepatic steatosis on the activities of hepatic sirtuin 1 (SIRT1), sterol regulatory element binding proteins (SREBP-1c), peroxisome proliferator-activated receptor γ coactivator-1 alpha (PGC-1α), catalase (CAT), copper-and zinc-containing superoxide dismutase (Cu/Zn SOD), manganese superoxide dismutase (Mn-SOD), glutathione peroxidase (GSH-Px) and the concentrations of glutathione (GSH), reduce glutathione disulfide (GSSG) and reactive oxygen species (ROS). Effect of lipid deposition on SIRT1, SREBP-1c and PGC-1α concentrations in control (n = 6) and fatty liver (n = 6) group dairy cows (AC); Effect of lipid deposition on antioxidant index concentrations in control (n = 6) and fatty liver (n = 6) group dairy cows (DH); Effect of lipid deposition on oxidative indexes concentrations in dairy cows (HJ). The data presented are the mean ± SEM. * p < 0.05; ** p < 0.01.
Animals 10 00560 g003
Figure 4. Lipid deposition hinders the fatty acid oxidation pathway in cow liver. (AC) Levels of the protein levels of SIRT1, PGC-1α, peroxisome proliferator-activated receptor alpha (PPARα), retinoid X receptor alpha (RXRα), acyl coenzyme A oxidase (ACO), carnitine palmitoyltransferase 1 (CPT1), carnitine palmitoyltransferase 2 (CPT2), nuclear respiratory factor 1 (Nrf1) and transcription factor A (TFAM) in control (n = 6) and fatty liver (n = 6) group dairy cows were determined by western blotting. (D,E) Total RNA was extracted from liver samples and the expressions of genes involved in the fatty acid oxidation pathway in control (n = 6) and fatty liver (n = 6) group dairy cows were determined by real-time RT-PCR. The data presented are the mean ± SEM. * p < 0.05; ** p < 0.01.
Animals 10 00560 g004
Figure 5. Lipid deposition enhances the hepatic lipogenesis pathway in the cow liver. (A,B) Protein levels of SREBP-1c, acyl-CoA synthetase long chain family member 1 (ACSL1), acetyl-CoA carboxylase alpha (ACCα), p-ACCα and fatty acid synthetase (FAS) in control (n = 6) and fatty liver (n = 6) group dairy cows were determined by western blotting. (C) Total RNA was extracted from liver samples and the expressions of the genes involved in free fatty acid (FFA) and triglycerides (TG) biosynthesis in control (n = 6) and fatty liver (n = 6) group dairy cows were determined by real-time RT-PCR. The data presented are the mean ± SEM. * p < 0.05; ** p < 0.01.
Animals 10 00560 g005
Figure 6. Lipid deposition promotes the lipid transport pathway in the cow liver. (A,B) Levels of the proteins apolipoprotein E (ApoE) and low density lipoprotein receptor (LDLR) in control (n = 6) and fatty liver (n = 6) group dairy cows were determined by western blotting. (C) Total RNA was extracted from liver samples and the expressions of the genes involved in the lipid transport pathway in control (n = 6) and fatty liver (n = 6) group dairy cows were determined by real-time RT-PCR. The data presented are the mean ± SEM. * p < 0.05; ** p < 0.01.
Animals 10 00560 g006
Table 1. Clinical observations of control and mild fatty liver cows.
GroupsMilk KetonesFeed IntakeMilk ProductionHealth StatusReproductive PerformanceOther Disease Conditions
Control000000
Mild fatty liver+0
The symbols + and − mean positive and negative association, respectively. The 0 means no association.
Table 2. The basic diet formulation, %.
ItemContent
PrenatalPostpartum
Silage31.440.0
Guinea grass23.4
Corn19.635.0
Wheat bran10.08.0
Soybean meal2.05.0
Sunflower11.58.0
NaCl0.81.0
Premix11.31.8
NaHCO3 1.2
Total100.00100.00
Energy (%) 1
NEL(MJ/Kg) 25.76.7
Crude protein11.315.2
Neutral detergent fiber50.233.45
Acid detergent fiber28.517.2
Ca0.30.7
P0.30.5
NFC Non fiber carbohydrate28.040.4
RDP Neutral detergent fiber7.07.4
NFC/RDP Nonfiber carbohydrate/ Neutral detergent fiber4.05.5
1 The premix provided the following per kg of diets: VA 200,000 IU, VD 70,000 IU, VE 1000 IU, Fe 2000 mg, Cu 600 rng, Zn 2400 mg, Mn 1300 mg, I 6 mg, Se 17 mg, CO 7 mg; 2 NEL was a calculated value and others were measured values.
Table 3. Primers sequences qRT-PCR used in this experiment.
Genes 1Primer Sequences (5′-3′)Gene Bank Accession no.Amplicon
(bp)
Annealing Temperature (°C)
SIRT1Forward: TATGGAGTGACATAGAGTGTGCTXM_015461011.114357
Reverse: GTCGCTACACCACTTCAATCC
SREBP-1cForward:CGACACCACCAGCATCAACCACGNM_001113302.111962
Reverse: GCAGCCCATTCATCAGCCAGACC
ACCαForward: TGCTGAATATCCTCACGGAGCTNM_174224.221260
Reverse: CGACGTTTCGGACAAGATGAGT
FASForward: ACAGCCTCTTCCTGTTTGACGNM_174662.222659
Reverse: CTCTGCACGATCAGCTCGAC
ACSLForward: TCGGAACTGAAGCCATCACCNM_001076085.117363
Reverse: GCCTCGTTCCAGCAGATCAC
CPT-1Forward: ACGCCGTGAAGTATAACCCTNM_001304989.111960
Reverse: CCAAAAATCGCTTGTCCCTT
CPT-2Forward: TGAACATCCTCTCCATCTGGNM_001045889.218858
Reverse: GGTCAACAGCAACTACTACG
ACOForward: TACGGAGGGATGAGGAGTGTNM_001205495.114364
Reverse: TCTCAGGAAGCGAGTTTGG
LCADForward: GGTCCACAGCACAGACTTGGTNM_001076936.115156
Reverse: GGAATTGGCTAGGCTTGTGATC
L-FABPForward: AAGTACCAAGTCCAGACCCAGNM_175817.311161
Reverse: CACGATTTCCGACACCC
LDLRForward: GCTGTTCTGCCTTTCTCCTTNM_001166530.122865
Reverse: ACTTTCTCCCCTGACCCTTG
Apo-100Reverse: GATACTCAGAACGGAGCAATXM_019969506.122258
Forward: GCACCAATCAGATAACAGGA
ApoEReverse: TCCTGAATGACCTGGGTGTTGXM_005219148.321962
Forward: TCTGTGGGTTGCCGTGGTG
MTTPReverse: CAGTTTGCAGCCTTGGTTCTGNM_001101834.120156
Forward: TTCAAAAGCACCGAGAGCGTT
PGC-1αReverse: GACCACAAATGATGACCCTCNM_177945.312360
Forward: GGTTTGGCTTGTAGATGTT
Nrf1Reverse: TTTTAGTAACCCTGATGGCNM_001098002.219857
Forward: GCTTGCGTTGTCTGGATG
TFAMReverse: TGGCACATCACAGGTAAANM_001034016.213763
Forward: GTTCCTCCCAAGATTTCA
MnSODReverse: TTCAATAAGGAGCAGGGACNM_201527.223464
Forward: CAGTGTAAGGCTGACGGTTT
Cu/Zn SODReverse: GAAGAGAGGCATGTTGGAGANM_174615.222160
Forward: CCAATTACACCACGAGCCAA
CATReverse: AGATACTCCAAGGCGAAGGTGNM_001035386.212061
Forward: AAAGCCACGAGGGTCACGAAC
GSH-PxReverse: GCGGGAGCAGGACTTCTACGANM_001101113.213765
Forward: CCCGATAGTGCTGGTCTGTGAA
PPARαReverse: GGGTTTTCTTAGGCTTTTNM_00103403617660
Forward: AGTCCATCCCTGGGTTTG
RXRαReverse: GGCAGATGTTGGTGACGGGNM_00130434316362
Forward: GGCGAGAGCGAGGTGGAGT
β-actinReverse: GCCCTGAGGCTCTCTTCCANM_173979.310159
Forward:GCGGATGTCGACGTCACA
1 SIRT1 = sirtuin 1; SREBP-1c = sterol regulatory element binding transcription factor 1; ACCα = acetyl-CoA carboxylase alpha; FAS = fatty acid synthetase; ACSL = acyl-CoA synthetase long chain family member; CPT1 = carnitine palmitoyltransferase 1; CPT2 = carnitine palmitoyltransferase 2; ACO = acyl coenzyme A oxidase; LCAD = long chain acyl-CoA dehydrogenase; L-FABP = liver fatty acid binding proteins; LDLR = low density lipoprotein receptor; ApoB100 = apolipoprotein B 100; ApoE = apolipoprotein E; MTTP = microsomal triglyceride transfer protein; PGC-1α = peroxisome proliferator-activated receptor γ coactivator-1 alpha; Nrf1 = nuclear respiratory factor 1; TFAM = transcription factor A, mitochondrial; MnSOD = superoxide dismutase 2, mitochondrial; Cu/Zn SOD = superoxide dismutase 1; CAT = catalase; GSH-Px = glutathione peroxidase 7; PPARα = peroxisome proliferator-activated receptor alpha; RXRα = retinoid X receptor alpha.
Table 4. Milk production and milk component of control and fatty liver dairy cows.
ParameterControlFatty Liverp-Value
DMI, kg/d23.17 ± 3.2418.45 ± 2.84<0.01
Milk production, kg/d28 ± 720 ± 6<0.01
Milk component
Fat, %3.48 ± 0.353.33 ± 0.320.39
Protein, %3.25 ± 0.212.91 ± 0.34<0.01
Lactose, %4.96 ± 0.114.88 ± 0.130.91
MUN 1 (mg/100 mL)13.76 ± 1.9111.52 ± 1.430.01
SCC (×103/mL)112.35 ± 20.23365.61 ± 43.25<0.01
1 MUN, milk urea nitrogen; SCC, somatic cell count.
Table 5. Genes mRNA abundance for antioxidation activity of control and fatty liver cows (means ± SEM).
GenesControl (n = 6)Fatty Liver (n = 6)
Cu/Zn SOD1.00 ± 0.120.31 ± 0.09
CAT1.00 ± 0.060.21 ± 0.15 **
GSH-Px1.00 ± 0.200.09 ± 0.06 **
Mn SOD1.00 ± 0.130.06 ± 0.03 **
Note: ** represent p < 0.01.

