A Meta-Analysis of the Effects of Slow-Release Urea Supplementation on the Performance of Beef Cattle


Abstract
:Simple Summary
Abstract
1. Introduction
2. Materials and Methods
2.1. Literature Search and Study Selection
2.2. Data Extraction
2.3. Calculations and Statistical Analysis
2.4. Simulation Analysis
- DM content of diet = 70%
- Ration cost = 0.15 €/kg as-fed. Ration cost was assumed to be similar for the baseline and SRU diets considering that diets can be reformulated with SRU by replacing a portion of the vegetable protein sources, such as soybean meal without changing the feed cost under several circumstances. Thus, no additional cost is attributed to the SRU diet in this scenario.
- AEIAFU = 108 kg CO2-eq per kg of protein. This assumption was based on reported data, which indicated that the global average emission intensity of beef is 300 kg CO2-eq per kg of protein and an average of 36% of beef emissions was attributed to feed use [20]. Data on the global average emission intensity of beef was used because of the vast diversity in the environmental footprint of beef production systems across the world.
- AEINAFU = 192 kg CO2-eq per kg of protein. Based on Assumption (3) above, the remaining component of beef emissions was allocated to non-feed use.
3. Results
3.1. Study Characteristics
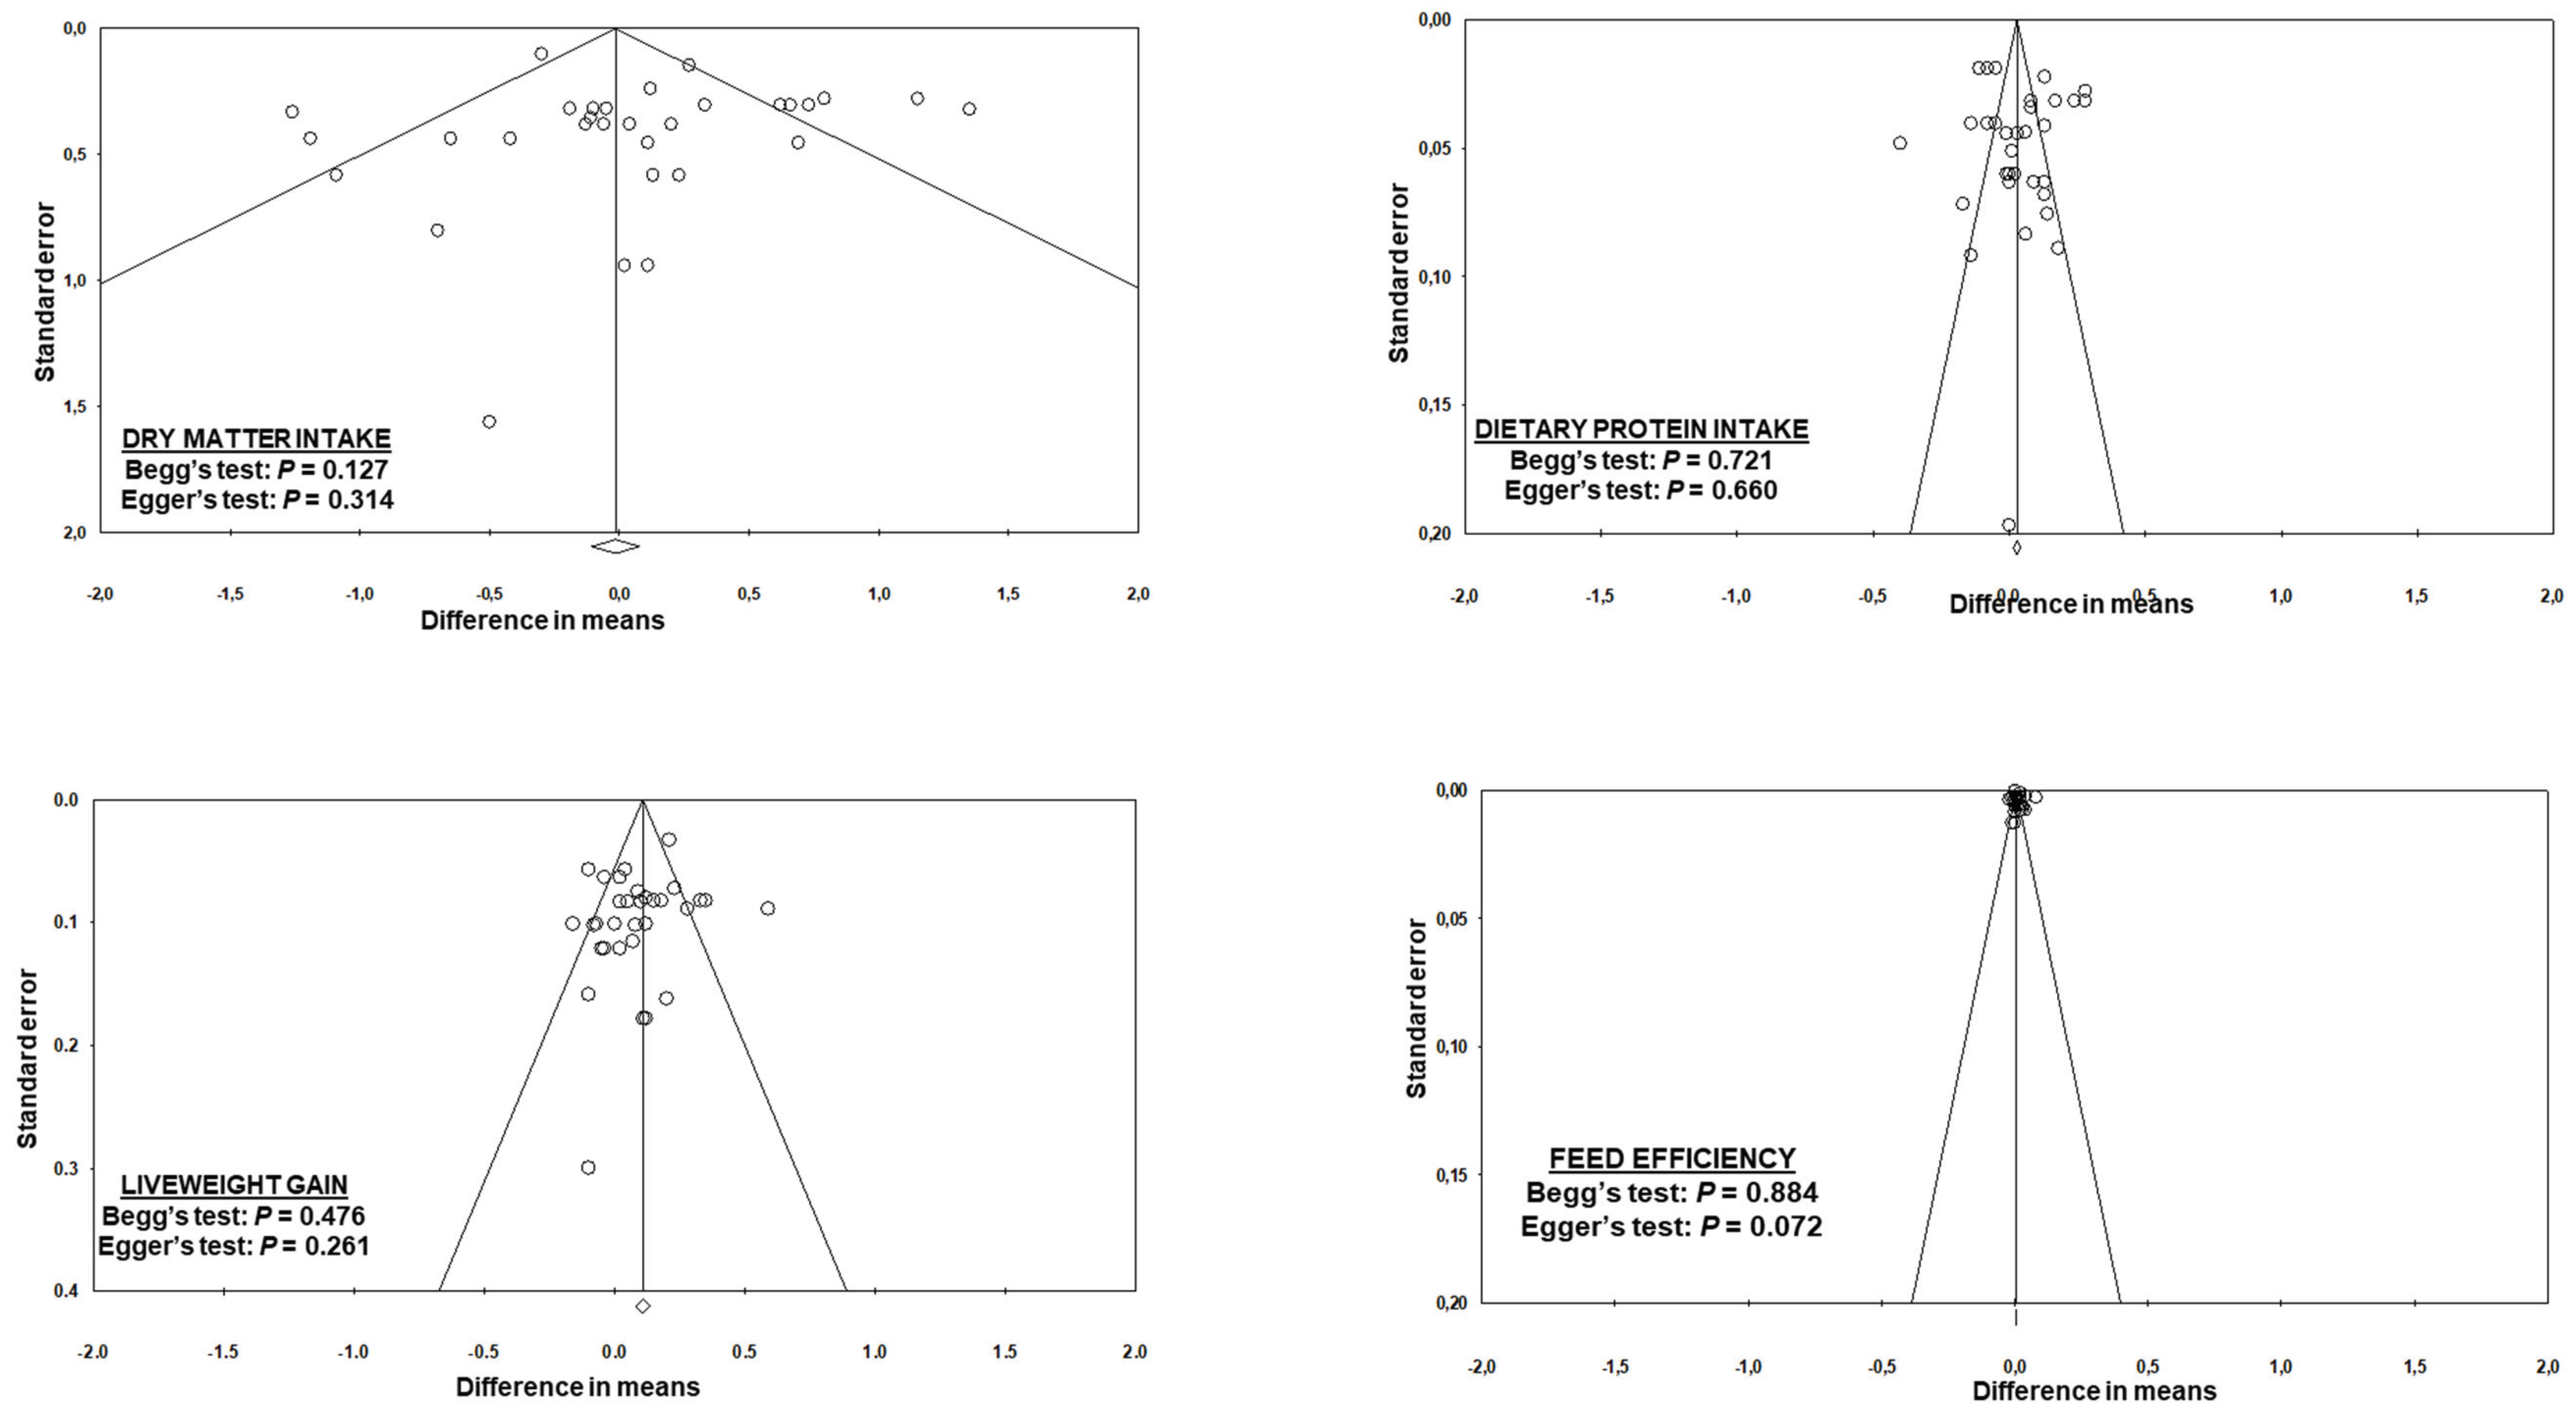
3.2. Effect of Slow-Release Urea on Dry Matter Intake of Beef Cattle
3.3. Effect of Slow-Release Urea on Dietary Protein Intake of Beef Cattle
3.4. Effect of Slow-Release Urea on Live Weight Gain of Beef Cattle
3.5. Effect of Slow-Release Urea on Feed Efficiency of Beef Cattle
3.6. Environmental and Economic Impacts of Feeding Slow-Release Urea in Beef Cattle Production
4. Discussion
5. Conclusions
Supplementary Materials
Author Contributions
Funding
Acknowledgments
Conflicts of Interest
Appendix A

| Reference | Location | Source | Breed | Sex | Feeding Regiment | Production Phase | Grouping Method | SRU Dosage (% DM Diet) | Feeding Period |
|---|---|---|---|---|---|---|---|---|---|
| Agovino et al. [45] | Ireland | Conference poster | Unknown | Heifers | Corn silage-based diet | Finishing | Animal | 0.73 | 80 |
| Cabrita [46] | Portugal | Conference poster | Charolais × Limousine | Heifers | Corn-based diet | Finishing | Animal | 0.45 | 60 |
| Corte et al. [24] | Brazil | Journal | Nellore | Steers | Sugarcane silage and baggase/corn-based diet | Finishing | Animal | 1.80 | 75 |
| Eweedah et al. [25] | Egypt | Journal | Holstein | Steers | Corn silage-based diet | Growing | Animal | 0.61, 0.84 | 105 |
| Ferres et al. [47] | Uruguay | Conference poster | Hereford | Steers | Corn silage-based diet | Finishing | Animal | 0.52 | 65 |
| Kononoff et al. [48] | USA | Journal | Holstein | Heifers | Corn silage/Timothy hay-based diet | Growing | Animal | 1.28, 1.78 | 140 |
| Muro et al. [49] | Argentina | Conference poster | Holstein | Heifers | Corn-based diet/grass hay | Growing | Animal | 1.23 | 60 |
| Pinos-Rodríguez et al. [50] | Mexico | Journal | Brown Swiss × Brahman | Steers | Sorghum-based diet | Finishing | Animal | 1.10 | 48 |
| Sgoifo Rossi et al. [51] | Italy | Conference poster | Charolais | Steers | Corn silage-based diet | Finishing | Animal | 0.42 | 100 |
| Simeone et al. [52] | Uruguay | Conference poster | Hereford | Steers | Sorghum-based diet/ryegrass hay | Growing and finishing | Animal | 1.0, 1.5 | 50 |
| Tedeschi et al. [27] | USA | Journal | Angus crossbred | Steers | Corn silage-based diet | Growing and finishing | Animal | 0.4, 1.2, 0.3, 0.8 | 84 |
| Wahrmund and Hersom [53] | USA | Report | Angus | Steers | Bahiagrass hay | Growing | Animal | 0.27, 0.25 | 42 |
| Holder [54] | USA | PhD thesis | Angus crossbred | Steers | Corn silage-based diet | Finishing | Pen | 0.45, 0.9, 1.35 | 42 |
| Holland and Jennings [55] | USA | Conference poster | British crossbred | Steers | Corn-based diet | Finishing | Pen | 0.43, 0.83 | 117 |
| López-soto et al. [36] | Mexico | Journal | Zebu, Angus, Hereford, Charolais | Steers | Sorghum-based/sudangrass hay/DDGS diet | Finishing | Pen | 0.80 | 70 |
| Taylor-Edwards et al. [26] | USA | Journal | Angus crossbred | Steers | Corn silage-based diet | Growing | Pen | 0.4, 0.8, 1.2, 1.6 | 56 |
| Manella et al. [56] | Brazil | Conference poster | Nellore | Steers | Sugarcane silage-based diet | Finishing | Pen | 1.80 | 80 |
| Item | Baseline | SRU | Difference | % Change |
|---|---|---|---|---|
| Number of cattle | 1000 | 1000 | ||
| Dry matter intake (kg DM/d/head) | 9 | 9 | ||
| Live weight gain (LWG, kg/d/head) 1 | 1.400 | 1.492 | +0.092 | 6.6 |
| Feed efficiency (kg LWG/kg DMI/head) | 0.156 | 0.166 | +0.010 | 6.4 |
| Target live weight gain (kg/head) | 200 | 200 | ||
| Lean meat yield (kg/head) 2 | 82 | 82 | ||
| Beef protein output (kg/head) 3 | 17.2 | 17.2 |

References
- Loor, J.J.; Elolimy, A.A.; McCann, J.C. Dietary impacts on rumen microbiota in beef and dairy production. Anim. Front. 2016, 6, 22–29. [Google Scholar] [CrossRef] [Green Version]
- Cherdthong, A.; Wanapat, M. Development of urea products as rumen slow-release feed for ruminant production: A review. Aust. J. Basic Appl. Sci. 2010, 4, 2232–2241. [Google Scholar]
- Cutrignelli, M.I.; Infascelli, F.; Tudisco, R.; Calabrò, S.; Piccolo, V. Protein Sources in Ruminant Nutrition; INTECH Open Access Publisher: London, UK, 2011. [Google Scholar]
- Lu, Z.; Tian, Y.; Shen, H. Dietary energy level promotes rumen microbial protein synthesis by improving the energy productivity of the ruminal microbiome. Front. Microbiol. 2019, 10, 847. [Google Scholar] [CrossRef] [PubMed]
- Calsamiglia, S.; Ferret, A.; Reynolds, C.; Kristensen, N.B.; Van Vuuren, A. Strategies for optimizing nitrogen use by ruminants. Animal 2010, 4, 1184–1196. [Google Scholar] [CrossRef]
- Cope, R.B. Nonprotein nitrogen (urea) and hyperammonemia. In Veterinary Toxicology; Elsevier: Cambridge, MA, USA, 2018; pp. 1093–1097. [Google Scholar]
- Sinclair, L.; Blake, C.; Griffin, P.; Jones, G. The partial replacement of soybean meal and rapeseed meal with feed grade urea or a slow-release urea and its effect on the performance, metabolism and digestibility in dairy cows. Animal 2012, 6, 920–927. [Google Scholar] [CrossRef] [Green Version]
- Reddy, P.R.K.; Kumar, D.S.; Rao, E.R.; Seshiah, C.V.; Sateesh, K.; Reddy, Y.P.K.; Hyder, I. Assessment of eco-sustainability vis-à-vis zoo-technical attributes of soybean meal (SBM) replacement with varying levels of coated urea in Nellore sheep (Ovis aries). PLoS ONE 2019, 14, 1–20. [Google Scholar]
- Sauvant, D.; Schmidely, P.; Daudin, J.-J.; St-Pierre, N.R. Meta-analyses of experimental data in animal nutrition. Animal 2008, 2, 1203–1214. [Google Scholar] [CrossRef]
- Lean, I.J.; Thompson, J.M.; Dunshea, F.R. A meta-analysis of zilpaterol and ractopamine effects on feedlot performance, carcass traits and shear strength of meat in cattle. PLoS ONE 2014, 9, 1–28. [Google Scholar] [CrossRef]
- Wagner, J.; Engle, T.; Belknap, C.; Dorton, K. Meta-analysis examining the effects of Saccharomyces cerevisiae fermentation products on feedlot performance and carcass traits. PAS 2016, 32, 172–182. [Google Scholar]
- Duffield, T.; Merrill, J.; Bagg, R. Meta-analysis of the effects of monensin in beef cattle on feed efficiency, body weight gain, and dry matter intake. J. Anim. Sci. 2012, 90, 4583–4592. [Google Scholar] [CrossRef]
- Garcia-Gonzalez, R.; Tricarico, J.; Harrison, G.; Meyer, M.; McLeod, K.; Harmon, D.; Dawson, K. Optigen® is a sustained release source of non-protein nitrogen in the rumen. J. Anim. Sci. 2007, 85, 98. [Google Scholar]
- Furukawa, T.A.; Barbui, C.; Cipriani, A.; Brambilla, P.; Watanabe, N. Imputing missing standard deviations in meta-analyses can provide accurate results. J. Clin. Epidemiol. 2006, 59, 7–10. [Google Scholar] [CrossRef] [PubMed]
- Philbrook, H.T.; Barrowman, N.; Garg, A. Imputing variance estimates do not alter the conclusions of a meta-analysis with continuous outcomes: A case study of changes in renal function after living kidney donation. J. Clin. Epidemiol. 2007, 60, 228–240. [Google Scholar] [CrossRef] [PubMed]
- Borenstein, M.; Hedges, L.; Higgins, J.; Rothstein, H. Meta-analysis Methods Based on Direction and p-Values. In Introduction to Meta-Analysis; John Wiley & Sons: Chichester, UK, 2009; pp. 325–330. [Google Scholar]
- Lean, I.; Rabiee, A.; Duffield, T.; Dohoo, I. Invited review: Use of meta-analysis in animal health and reproduction: Methods and applications. J. Dairy Sci. 2009, 92, 3545–3565. [Google Scholar] [CrossRef] [Green Version]
- Begg, C.B.; Mazumdar, M. Operating characteristics of a rank correlation test for publication bias. Biometrics 1994, 1088–1101. [Google Scholar] [CrossRef]
- Egger, M.; Smith, G.D.; Schneider, M.; Minder, C. Bias in meta-analysis detected by a simple, graphical test. Bmj 1997, 315, 629–634. [Google Scholar] [CrossRef] [Green Version]
- Gerber, P.J.; Steinfeld, H.; Henderson, B.; Mottet, A.; Opio, C.; Dijkman, J.; Falcucci, A.; Tempio, G. Tackling climate change through livestock: A global assessment of emissions and mitigation opportunities; Food and Agriculture Organization of the United Nations (FAO): Rome, Italy, 2013. [Google Scholar]
- Akay, V.; Tikofsky, J.; Holtz, C.; Dawson, K.A. Optigen® 1200: Controlled release of non-protein nitrogen in the rumen. In Proceedings of the 20th Alltech Symposium; Lexington, USA, 23–24 May; Alltech Inc.: Nicholasville, KY, USA; pp. 179–185.
- Owens, F.; Qi, S.; Sapienza, D. Invited Review: Applied protein nutrition of ruminants—Current status and future directions. PAS 2014, 30, 150–179. [Google Scholar] [CrossRef]
- Galyean, M. Protein levels in beef cattle finishing diets: Industry application, university research, and systems results. J. Anim. Sci. 1996, 74, 2860–2870. [Google Scholar] [CrossRef]
- Corte, R.; Brito, F.; Leme, P.R.; Pereira, A.S.C.; Freitas, J.; Rennó, F.P.; Silva, S.d.L.; Tedeschi, L.O.; Nogueira Filho, J.C.M. The effects of partial substitution of soybean with urea or slow-release urea on finishing performance, meat quality, and digestion parameters of Nellore steers. Anim. Prod. Sci. 2018, 58, 2242–2248. [Google Scholar] [CrossRef]
- Eweedah, N.; Bassuony, M.; EL-Razik, A.; El-Baky, M. Effect of supplementing different levels of Optigen as a replacer to soybean on the steers’ performance. J. Agric. Res. 2016, 42, 129–143. [Google Scholar]
- Taylor-Edwards, C.; Hibbard, G.; Kitts, S.; McLeod, K.; Axe, D.; Vanzant, E.; Kristensen, N.; Harmon, D. Effects of slow-release urea on ruminal digesta characteristics and growth performance in beef steers. J. Anim. Sci. 2009, 87, 200–208. [Google Scholar] [CrossRef] [Green Version]
- Tedeschi, L.; Baker, M.; Ketchen, D.; Fox, D. Performance of growing and finishing cattle supplemented with a slow-rlease urea product and urea. Can. J. Anim. Sci. 2002, 82, 567–573. [Google Scholar] [CrossRef]
- Galina, M.; Perez-Gil, F.; Ortiz, R.; Hummel, J.; Ørskov, R. Effect of slow release urea supplementation on fattening of steers fed sugar cane tops (Saccharum officinarum) and maize (Zea mays): Ruminal fermentation, feed intake and digestibility. Livest. Prod. Sci. 2003, 83, 1–11. [Google Scholar] [CrossRef]
- Puga, D.; Galina, H.; Pérez-Gil, R.; Sanginés, G.; Aguilera, B.; Haenlein, G. Effect of a controlled-release urea supplement on rumen fermentation in sheep fed a diet of sugar cane tops (Saccharum officinarum), corn stubble (Zea mays) and King grass (Pennisetum purpureum). Small Rumin. Res. 2001, 39, 269–276. [Google Scholar] [CrossRef]
- Xin, H.; Schaefer, D.; Liu, Q.; Axe, D.; Meng, Q. Effects of polyurethane coated urea supplement on in vitro ruminal fermentation, ammonia release dynamics and lactating performance of Holstein dairy cows fed a steam-flaked corn-based diet. Asian-Australas. J. Anim. Sci. 2010, 23, 491–500. [Google Scholar] [CrossRef]
- Ketelaars, J.; Tolkamp, B. Toward a new theory of feed intake regulation in ruminants 1. Causes of differences in voluntary feed intake: Critique of current views. Livest. Prod. Sci. 1992, 30, 269–296. [Google Scholar] [CrossRef]
- Longland, A. Nutritional assessment of forage quality. In Forages and Grazing in Horse Nutrition; Springer: New York, NY, USA, 2012; pp. 65–82. [Google Scholar]
- Sindt, M.; Stock, R.; Klopfenstein, T.; Shain, D. Effect of protein source and grain type on finishing calf performance and ruminal metabolism. J. Anim. Sci. 1993, 71, 1047–1056. [Google Scholar] [CrossRef] [PubMed] [Green Version]
- De Boever, J.; Cottyn, B.; De Brabander, D.; Vanacker, J.; Boucque, C.V. Prediction of the feeding value of maize silages by chemical parameters, in vitro digestibility and NIRS. Anim. Feed Sci. Technol. 1997, 66, 211–222. [Google Scholar] [CrossRef]
- Givens, D.; Rulquin, H. Utilisation by ruminants of nitrogen compounds in silage-based diets. Anim. Feed Sci. Technol. 2004, 114, 1–18. [Google Scholar] [CrossRef]
- López-Soto, M.; Aguilar-Hernández, J.; Dávila-Ramos, H.; Estrada-Angulo, A.; Ríos, F.; Urías-Estrada, J.; Barreras, A.; Calderón, J.; Plascencia, A. Effects of a combining feed grade urea and a slow-release product on performance, dietary energetics and carcass characteristics of steers fed finishing diets. J. Appl. Anim. Res. 2015, 43, 303–308. [Google Scholar] [CrossRef]
- Council, N.R. Urea and other nonprotein nitrogen compounds in animal nutrition; National Academies: Washington, WA, USA, 1976. [Google Scholar]
- Shain, D.; Stock, R.; Klopfenstein, T.J.; Herold, D. Effect of degradable intake protein level on finishing cattle performance and ruminal metabolism. J. Anim. Sci. 1998, 76, 242–248. [Google Scholar] [CrossRef] [PubMed]
- Gerber, P.J.; Mottet, A.; Opio, C.I.; Falcucci, A.; Teillard, F. Environmental impacts of beef production: Review of challenges and perspectives for durability. Meat Sci. 2015, 109, 2–12. [Google Scholar] [CrossRef]
- Waghorn, G.; Hegarty, R. Lowering ruminant methane emissions through improved feed conversion efficiency. Anim. Feed Sci. Technol. 2011, 166, 291–301. [Google Scholar] [CrossRef]
- Kenny, D.; Fitzsimons, C.; Waters, S.; McGee, M. Invited review: Improving feed efficiency of beef cattle–the current state of the art and future challenges. Animal 2018, 12, 1815–1826. [Google Scholar] [CrossRef] [PubMed] [Green Version]
- Kebreab, E.; Liedke, A.; Caro, D.; Deimling, S.; Binder, M.; Finkbeiner, M. Environmental impact of using specialty feed ingredients in swine and poultry production: A life cycle assessment. J. Anim. Sci. 2016, 94, 2664–2681. [Google Scholar] [CrossRef] [PubMed]
- Capper, J.L.; Hayes, D.J. The environmental and economic impact of removing growth-enhancing technologies from US beef production. J. Anim. Sci. 2012, 90, 3527–3537. [Google Scholar] [CrossRef] [Green Version]
- Salami, S.; Luciano, G.; O’Grady, M.; Biondi, L.; Newbold, C.; Kerry, J.; Priolo, A. Sustainability of feeding plant by-products: A review of the implications for ruminant meat production. Anim. Feed Sci. Technol. 2019, 251, 37–55. [Google Scholar] [CrossRef]
- Agovino, M.; Warren, H.; Giggins, G. Effect of Optigen® on finishing heifers. In Scientific poster presented at the 29th Alltech Symposium, Lexington, KY, USA, 19–22 May; Alltech Inc.: Nicholasville, KY, USA, 2013. [Google Scholar]
- Cabrita, R. Optigen® improves performance and profitability in intensive beef cattle production. In Scientific poster presented at the 27th Alltech Symposium, Lexington, KY, USA, 12–25 May; Alltech Inc.: Nicholasville, KY, USA, 2011. [Google Scholar]
- Ferres, A.; Sabbia, J.; Manella, M. Replacement of vegetable protein with Optigen® at a commercial feedlot in Uruguay. In Scientific poster presented at the 26th Alltech Symposium, Lexington, KY, USA, 16–19 May; Alltech Inc.: Nicholasville, KY, USA, 2010. [Google Scholar]
- Kononoff, P.; Heinrichs, A.J.; Gabler, M. The effects of nitrogen and forage source on feed efficiency and structural growth of prepubertal holstein heifers. PAS 2006, 22, 84–88. [Google Scholar] [CrossRef]
- Muro, E.; Delia, C.; Manella, M. Field evaluation of concentrate diets formulated with Optigen® and urea as the main source of crude protein, compared with sunflower mea. In Scientific poster presented at the 27th Alltech Symposium, Lexington, KY, USA, 12–25 May; Alltech Inc.: Nicholasville, KY, USA, 2011. [Google Scholar]
- Pinos-Rodríguez, J.M.; Peña, L.Y.; González-Muñoz, S.S.; Bárcena, R.; Salem, A. Effects of a slow-release coated urea product on growth performance and ruminal fermentation in beef steers. Ital. J. Anim. Sci. 2010, 9, e4. [Google Scholar] [CrossRef] [Green Version]
- Sgoifo Rossi, C.; Compiani, R.; Baldi, G.; Vandoni, S.; Agovino, M. Effects of slow-release nitrogen (Optigen®) in beef cattle. In Scientific poster presented at the 29th Alltech Symposium, Lexington, KY, USA, 19–22 May; Alltech Inc.: Nicholasville, KY, USA, 2013. [Google Scholar]
- Simeone, A.; Beretta, V.; Elizade, J.; Sabbia, J. Replacing sunflower meal with Optigen® in high grain feedlot diets: Response of calves and steers. In Scientific poster presented at the 25th Alltech Symposium, Lexington, KY, USA, 19–22 May; Alltech Inc.: Nicholasville, KY, USA, 2009. [Google Scholar]
- Wahrmund, J.; Hersom, M. Co-product and Rumen Degradable Protein Supplementation of Beef Steers Fed Bahiagrass Forage; 2009 Florida Beef Report; University of Florida: Gainesville, FL, USA, 2009. [Google Scholar]
- Holder, V. The effects of slow release urea on nitrogen metabolism in cattle. PhD Thesis, University of Kentucky, Lexington, KY, USA, October 2012. Available online: https://uknowledge.uky.edu/cgi/viewcontent.cgi?article=1004&context=animalsci_etds (accessed on 15 August 2019).
- Holland, B.; Jennings, J. Using Optigen® to replace soybean meal nitrogen in dry-rolled corn-based finishing diets for beef steers. In Scientific poster presented at the 27th Alltech Symposium, Lexington, KY, USA, 12–25 May; Alltech Inc.: Nicholasville, KY, USA, 2011. [Google Scholar]
- Manella, M.; Matsuda, E.; Carvalho, F. Replacing vegetable protein in supplements with Optigen® II in beef steers fed sugar cane silage as the sole forage. In Scientific poster presented at the 23rd Alltech Symposium, Lexington, KY, USA, 20–23 May; Alltech Inc.: Nicholasville, KY, USA, 2007. [Google Scholar]
- Holland, R.; Loveday, D.; Ferguson, K. How Much Meat to Expect from a Beef Carcass; University of Tennessee Institute of Agriculture: Tennessee, TN, USA, 2014. [Google Scholar]
- Pereira, P.M.d.C.C.; Vicente, A.F.d.R.B. Meat nutritional composition and nutritive role in the human diet. Meat Sci. 2013, 93, 586–592. [Google Scholar] [CrossRef] [Green Version]
- Williams, P. Nutritional composition of red meat. Nutr. Diet. 2007, 64, S113–S119. [Google Scholar] [CrossRef] [Green Version]
| Group/Sub-Group 1 | Number of Comparisons | Effect Size Estimates | Heterogeneity Tests | |||||||
|---|---|---|---|---|---|---|---|---|---|---|
| RMD (95% CI) | SE | p-Value | SMD (95% CI) 3 | SE | p-Value | Q | p-Value | I2 (%) | ||
| All trials | 32 | 0.074 (−0.132, 0.281) | 0.105 | 0.480 | 0.045 (−0.209, 0.299) | 0.129 | 0.728 | 87.70 | <0.001 | 64.65 |
| Production phase | ||||||||||
| Growing | 15 | 0.238 (−0.043, 0.520) | 0.144 | 0.097 | 0.269 (−0.171, 0.709) | 0.225 | 0.231 | 43.82 | <0.001 | 68.05 |
| Finishing | 17 | −0.114 (−0.446, 0.217) | 0.169 | 0.499 | −0.111 (−0.432, 0.210) | 0.164 | 0.498 | 43.49 | <0.001 | 63.21 |
| Peer-review | ||||||||||
| No | 15 | 0.032 (−0.266, 0.330) | 0.152 | 0.833 | 0.030 (−0.264, 0.324) | 0.150 | 0.839 | 36.86 | 0.001 | 62.01 |
| Yes | 17 | 0.111 (−0.186, 0.409) | 0.152 | 0.464 | 0.076 (−0.399, 0.551) | 0.242 | 0.753 | 50.66 | <0.001 | 68.42 |
| Study location | ||||||||||
| North America 2 | 22 | 0.119 (−0.136, 0.374) | 0.130 | 0.362 | 0.135 (−0.178, 0.449) | 0.160 | 0.398 | 41.68 | 0.005 | 49.62 |
| Breed | ||||||||||
| European beef cattle 3 | 25 | 0.134 (−0.126, 0.395) | 0.133 | 0.312 | 0.169 (−0.127, 0.466) | 0.151 | 0.264 | 71.80 | <0.001 | 66.58 |
| Grouping method for feeding | ||||||||||
| Individual | 20 | 0.100 (−0.178, 0.379) | 0.142 | 0.480 | 0.033 (−0.265, 0.332) | 0.152 | 0.826 | 65.733 | <0.001 | 71.10 |
| Pen | 12 | 0.041 (−0.261, 0.343) | 0.154 | 0.791 | 0.077 (−0.441, 0.596) | 0.264 | 0.770 | 21.938 | 0.025 | 49.86 |
| Corn silage in diet | ||||||||||
| No | 14 | −0.157 (−0.427, 0.113) | 0.138 | 0.255 | −0.110 (−0.357, 0.137) | 0.126 | 0.382 | 14.95 | 0.310 | 13.05 |
| Yes | 18 | 0.217 (−0.058, 0.492) | 0.140 | 0.123 | 0.233 (−0.168, 0.635) | 0.205 | 0.255 | 68.74 | <0.001 | 75.27 |
| Feeding period (days) | ||||||||||
| ≤80 | 21 | 0.120 (−0.122, 0.361) | 0.123 | 0.331 | 0.116 (−0.145, 0.377) | 0.133 | 0.384 | 42.22 | 0.003 | 74.90 |
| >80 | 11 | 0.011 (−0.338, 0.360) | 0.178 | 0.950 | −0.070 (−0.658, 0.518) | 0.300 | 0.816 | 39.84 | <0.001 | 52.63 |
| SRU dosage (% DM diet) | ||||||||||
| ≤1.00 | 22 | −0.015 (−0.257, 0.228) | 0.124 | 0.906 | −0.074 (−0.400, 0.252) | 0.166 | 0.656 | 68.84 | <0.001 | 69.49 |
| >1.00 | 10 | 0.298 (−0.034, 0.629) | 0.169 | 0.079 | 0.260 (−0.149, 0.669) | 0.209 | 0.213 | 18.59 | 0.029 | 51.58 |
| Sex | ||||||||||
| Steers | 27 | 0.031 (−0.193, 0.255) | 0.114 | 0.786 | −0.008 (−0.307, 0.291) | 0.152 | 0.958 | 73.41 | <0.001 | 64.58 |
| Group/Sub-Group 1 | Number of Comparisons | Effect Size Estimates | Heterogeneity Tests | |||||||
|---|---|---|---|---|---|---|---|---|---|---|
| RMD (95% CI) | SE | p-Value | SMD (95% CI) | SE | p-Value | Q | p-Value | I2 (%) | ||
| All trials | 32 | 0.033 (−0.020, 0.085) | 0.027 | 0.222 | 0.307 (−0.094, 0.708) | 0.205 | 0.133 | 207.09 | <0.001 | 85.03 |
| Production phase | ||||||||||
| Growing | 15 | 0.080 (0.001, 0.159) | 0.040 | 0.046 | 0.987 (0.201, 1.772) | 0.401 | 0.014 | 113.31 | <0.001 | 87.64 |
| Finishing | 17 | −0.015 (−0.076, 0.046) | 0.031 | 0.634 | −0.110 (−0.544, 0.325) | 0.222 | 0.621 | 80.39 | <0.001 | 80.10 |
| Peer-review | ||||||||||
| No | 15 | −0.022 (−0.084, 0.040) | 0.032 | 0.494 | −0.158 (−0.610, 0.294) | 0.231 | 0.493 | 86.93 | <0.001 | 83.90 |
| Yes | 17 | 0.082 (0.005, 0.160) | 0.040 | 0.038 | 0.978 (0.206, 1.750) | 0.394 | 0.013 | 109.56 | <0.001 | 85.40 |
| Study location | ||||||||||
| North America 2 | 22 | 0.071 (0.013, 0.129) | 0.030 | 0.016 | 0.778 (0.231, 1.325) | 0.279 | 0.005 | 109.31 | <0.001 | 80.79 |
| Breed | ||||||||||
| European beef cattle 3 | 25 | 0.051 (−0.010, 0.112) | 0.031 | 0.101 | 0.590 (0.109, 1.071) | 0.245 | 0.016 | 178.17 | <0.001 | 86.53 |
| Grouping method for feeding | ||||||||||
| Individual | 20 | 0.013 (−0.054, 0.080) | 0.034 | 0.697 | 0.099 (−0.346, 0.544) | 0.227 | 0.663 | 140.00 | <0.001 | 86.43 |
| Pen | 12 | 0.063 (−0.018, 0.144) | 0.041 | 0.126 | 0.904 (−0.091, 1.900) | 0.508 | 0.075 | 62.67 | <0.001 | 82.45 |
| Corn silage in diet | ||||||||||
| No | 14 | 0.035 (−0.005, 0.075) | 0.021 | 0.088 | 0.239 (−0.078, 0.556) | 0.162 | 0.140 | 23.24 | 0.039 | 44.07 |
| Yes | 18 | 0.035 (−0.041, 0.110) | 0.039 | 0.368 | 0.448 (−0.240, 1.136) | 0.351 | 0.202 | 177.14 | <0.001 | 90.40 |
| Feeding period (days) | ||||||||||
| ≤80 | 21 | 0.049 (−0.008, 0.107) | 0.030 | 0.094 | 0.396 (−0.018, 0.809) | 0.211 | 0.061 | 100.63 | <0.001 | 90.06 |
| >80 | 11 | 0.004 (−0.098, 0.106) | 0.052 | 0.938 | 0.087 (−0.927, 1.100) | 0.517 | 0.867 | 102.20 | <0.001 | 80.43 |
| SRU dosage (% DM diet) | ||||||||||
| ≤1.00 | 22 | 0.014 (−0.038, 0.067) | 0.027 | 0.597 | 0.138 (−0.332, 0.608) | 0.240 | 0.564 | 139.59 | <0.001 | 86.27 |
| >1.00 | 10 | 0.071 (−0.035, 0.177) | 0.054 | 0.187 | 0.826 (−0.029, 1.680) | 0.436 | 0.058 | 65.57 | <0.001 | 84.96 |
| Sex | ||||||||||
| Steers | 27 | 0.030 (−0.030, 0.090) | 0.031 | 0.325 | 0.335 (−0.166, 0.837) | 0.256 | 0.190 | 189.85 | <0.001 | 86.31 |
| Group/Sub-Group 1 | Number of Comparisons | Effect Size Estimates | Heterogeneity Tests | |||||||
|---|---|---|---|---|---|---|---|---|---|---|
| RMD (95% CI) | SE | p-Value | SMD (95% CI) | SE | p-Value | Q | p-Value | I2 (%) | ||
| All trials | 33 | 0.092 (0.037, 0.147) | 0.028 | 0.001 | 0.354 (0.126, 0.581) | 0.116 | 0.002 | 72.51 | <0.001 | 55.87 |
| Production phase | ||||||||||
| Growing | 15 | 0.134 (0.036, 0.232) | 0.050 | 0.007 | 0.653 (0.183, 1.123) | 0.240 | 0.006 | 48.23 | <0.001 | 70.97 |
| Finishing | 18 | 0.060 (−0.002, 0.121) | 0.031 | 0.056 | 0.310 (0.088, 0.532) | 0.113 | 0.006 | 23.49 | 0.134 | 27.64 |
| Peer-review | ||||||||||
| No | 16 | 0.073 (0.016, 0.129) | 0.001 | 0.011 | 0.386 (0.193, 0.579) | 0.098 | <0.001 | 18.56 | 0.234 | 19.18 |
| Yes | 17 | 0.115 (0.014, 0.217) | 0.003 | 0.026 | 0.564 (0.076, 1.052) | 0.249 | 0.024 | 52.30 | <0.001 | 69.41 |
| Study location | ||||||||||
| North America 2 | 22 | 0.100 (0.024, 0.177) | 0.039 | 0.010 | 0.435 (0.087, 0.782) | 0.177 | 0.014 | 49.56 | <0.001 | 57.62 |
| Breed | ||||||||||
| European beef cattle 3 | 25 | 0.119 (0.057, 0.181) | 0.032 | <0.001 | 0.491 (0.226, 0.755) | 0.135 | <0.001 | 54.51 | <0.001 | 55.97 |
| Grouping method for feeding | ||||||||||
| Individual | 20 | 0.100 (0.026, 0.174) | 0.038 | 0.008 | 0.327 (0.074, 0.581) | 0.129 | 0.011 | 46.76 | <0.001 | 59.37 |
| Pen | 13 | 0.080 (−0.005, 0.166) | 0.043 | 0.064 | 0.455 (−0.065, 0.976) | 0.266 | 0.086 | 25.62 | 0.012 | 53.16 |
| Corn silage in diet | ||||||||||
| No | 15 | 0.024 (−0.023, 0.071) | 0.024 | 0.311 | 0.141 (−0.080, 0.362) | 0.113 | 0.211 | 10.04 | 0.759 | 0.00 |
| Yes | 18 | 0.142 (0.061, 0.223) | 0.041 | 0.001 | 0.607 (0.247, 0.967) | 0.184 | 0.001 | 52.39 | <0.001 | 67.55 |
| Feeding period (days) | ||||||||||
| ≤80 | 22 | 0.101 (0.044, 0.159) | 0.029 | 0.001 | 0.377 (0.125, 0.630) | 0.129 | 0.003 | 41.71 | 0.005 | 49.65 |
| >80 | 11 | 0.089 (−0.025, 0.203) | 0.058 | 0.128 | 0.338 (−0.151, 0.827) | 0.249 | 0.175 | 27.49 | 0.002 | 63.62 |
| SRU dosage (% DM diet) | ||||||||||
| ≤1.00 | 22 | 0.081 (0.026, 0.137) | 0.028 | 0.004 | 0.399 (0.167, 0.631) | 0.118 | 0.001 | 34.32 | 0.034 | 38.80 |
| >1.00 | 11 | 0.109 (−0.038, 0.256) | 0.075 | 0.145 | 0.403 (−0.107, 0.913) | 0.260 | 0.122 | 32.20 | <0.001 | 68.94 |
| Sex | ||||||||||
| Steers | 28 | 0.091 (0.029, 0.153) | 0.032 | 0.004 | 0.372 (0.098, 0.646) | 0.140 | 0.008 | 64.172 | <0.001 | 57.93 |
| Group/Sub-Group 1 | Number of Comparisons | Effect Size Estimates | Heterogeneity Tests | |||||||
|---|---|---|---|---|---|---|---|---|---|---|
| RMD (95% CI) | SE | p-Value | SMD (95% CI) | SE | p-Value | Q | p-Value | I2 (%) | ||
| All trials | 32 | 0.012 (0.005, 0.019) | 0.003 | <0.001 | 0.908 (0.417, 1.400) | 0.251 | <0.001 | 289.85 | <0.001 | 89.31 |
| Production phase | ||||||||||
| Growing | 15 | 0.018 (0.001, 0.035) | 0.009 | 0.036 | 1.303 (0.366, 2.240) | 0.478 | 0.006 | 150.81 | <0.001 | 90.72 |
| Finishing | 17 | 0.008 (0.002, 0.014) | 0.003 | 0.012 | 0.775 (0.279, 1.271) | 0.253 | 0.002 | 98.08 | <0.001 | 83.69 |
| Peer-review | ||||||||||
| No | 15 | 0.007 (0.000, 0.014) | 0.004 | 0.037 | 0.586 (−0.037, 1.208) | 0.318 | 0.065 | 152.76 | <0.001 | 90.84 |
| Yes | 17 | 0.016 (0.004, 0.029) | 0.006 | 0.008 | 1.372 (0.559, 2.185) | 0.415 | 0.001 | 116.76 | <0.001 | 86.30 |
| Study location | ||||||||||
| North America 2 | 22 | 0.014 (0.002, 0.026) | 0.006 | 0.025 | 0.978 (0.398, 1.557) | 0.296 | 0.001 | 118.72 | <0.001 | 82.31 |
| Breed | ||||||||||
| European beef cattle 3 | 25 | 0.015 (0.006, 0.023) | 0.004 | 0.001 | 1.146 (0.598, 1.695) | 0.280 | <0.001 | 207.53 | <0.001 | 88.44 |
| Grouping method for feeding | ||||||||||
| Individual | 20 | 0.012 (0.003, 0.021) | 0.004 | 0.007 | 0.900 (0.258, 1.542) | 0.327 | 0.006 | 255.00 | <0.001 | 92.55 |
| Pen | 12 | 0.012 (0.004, 0.021) | 0.004 | 0.005 | 0.909 (0.238, 1.581) | 0.342 | 0.008 | 32.43 | 0.001 | 66.09 |
| Corn silage in diet | ||||||||||
| No | 14 | 0.006 (−0.000, 0.012) | 0.003 | 0.054 | 0.469 (−0.147, 1.086) | 0.315 | 0.136 | 80.17 | <0.001 | 83.79 |
| Yes | 18 | 0.017 (0.006, 0.027) | 0.005 | 0.002 | 1.330 (0.614, 2.045) | 0.365 | <0.001 | 180.63 | <0.001 | 90.59 |
| Feeding period (days) | ||||||||||
| ≤80 | 21 | 0.011 (0.005, 0.017) | 0.003 | <0.001 | 0.838 (0.298, 1.378) | 0.276 | 0.002 | 169.44 | <0.001 | 88.20 |
| >80 | 11 | 0.014 (−0.003, 0.031) | 0.009 | 0.114 | 1.269 (0.150, 2.387) | 0.571 | 0.026 | 108.74 | <0.001 | 90.803 |
| SRU dosage (% DM diet) | ||||||||||
| ≤1.00 | 22 | 0.011 | 0.003 | <0.001 | 1.032 (0.531, 1.533) | 0.255 | <0.001 | 141.91 | <0.001 | 85.21 |
| >1.00 | 10 | 0.014 (−0.006, 0.034) | 0.010 | 0.164 | 0.615 (−0.352, 1.582) | 0.493 | 0.212 | 82.89 | <0.001 | 89.14 |
| Sex | ||||||||||
| Steers | 27 | 0.013 (0.005, 0.021) | 0.004 | 0.002 | 0.968 (0.397, 1.540) | 0.292 | 0.001 | 233.31 | <0.001 | 88.85 |
| Item | Baseline | SRU | Difference | % Change |
|---|---|---|---|---|
| Economic impact analysis 1 | ||||
| Ration required to gain 200 kg LW (kg DM/head) | 1282.05 | 1204.82 | −77.23 | 6.0 |
| Days on feed to slaughter (d) | 143 | 134 | −9 | 6.3 |
| Total feed use (kg as-fed/head) | 1831.50 | 1721.17 | −110.33 | 6.0 |
| Feed cost (€/head) | 274.73 | 258.18 | −16.55 | 6.0 |
| Total feed cost (€/1000 head) | 274,730 | 258,180 | −16,550 | 6.0 |
| Environmental impact analysis | ||||
| Emission intensity attributed to feed use (kg CO2-eq per beef protein output per head) 2 | 1857.6 | 1746.1 | 111.5 | 6.0 |
| Emission intensity (kg CO2-eq per beef protein output per head) | 5160 | 5048.5 | 111.5 | 2.2 |
| Total emission intensity (tonnes CO2-eq per beef protein output per 1000 head) | 5160 | 5048.5 | 111.5 | 2.2 |
© 2020 by the authors. Licensee MDPI, Basel, Switzerland. This article is an open access article distributed under the terms and conditions of the Creative Commons Attribution (CC BY) license (http://creativecommons.org/licenses/by/4.0/).
Share and Cite
Salami, S.A.; Moran, C.A.; Warren, H.E.; Taylor-Pickard, J. A Meta-Analysis of the Effects of Slow-Release Urea Supplementation on the Performance of Beef Cattle. Animals 2020, 10, 657. https://doi.org/10.3390/ani10040657
Salami SA, Moran CA, Warren HE, Taylor-Pickard J. A Meta-Analysis of the Effects of Slow-Release Urea Supplementation on the Performance of Beef Cattle. Animals. 2020; 10(4):657. https://doi.org/10.3390/ani10040657
Chicago/Turabian StyleSalami, Saheed A., Colm A. Moran, Helen E. Warren, and Jules Taylor-Pickard. 2020. "A Meta-Analysis of the Effects of Slow-Release Urea Supplementation on the Performance of Beef Cattle" Animals 10, no. 4: 657. https://doi.org/10.3390/ani10040657
APA StyleSalami, S. A., Moran, C. A., Warren, H. E., & Taylor-Pickard, J. (2020). A Meta-Analysis of the Effects of Slow-Release Urea Supplementation on the Performance of Beef Cattle. Animals, 10(4), 657. https://doi.org/10.3390/ani10040657