Effect of Feeding Improved Grass Hays and Eragrostis tef Straw Silage on Milk Yield, Nitrogen Utilization, and Methane Emission of Lactating Fogera Dairy Cows in Ethiopia

 , , , , ,
Simple Summary
Abstract
1. Introduction
2. Materials and Methods
2.1. Experimental Location, Cows, and Design
2.2. Experimental Dietary Treatments and Feed Management
2.3. Measurements and Sample Collection
2.4. Laboratory Analyses and Procedures
2.5. Estimation of Enteric Methane Emission
2.6. Statistical Analysis
3. Results
3.1. Feed Intake and Nutrient Digestibility
3.2. Nitrogen Balance and Utilization Efficiency
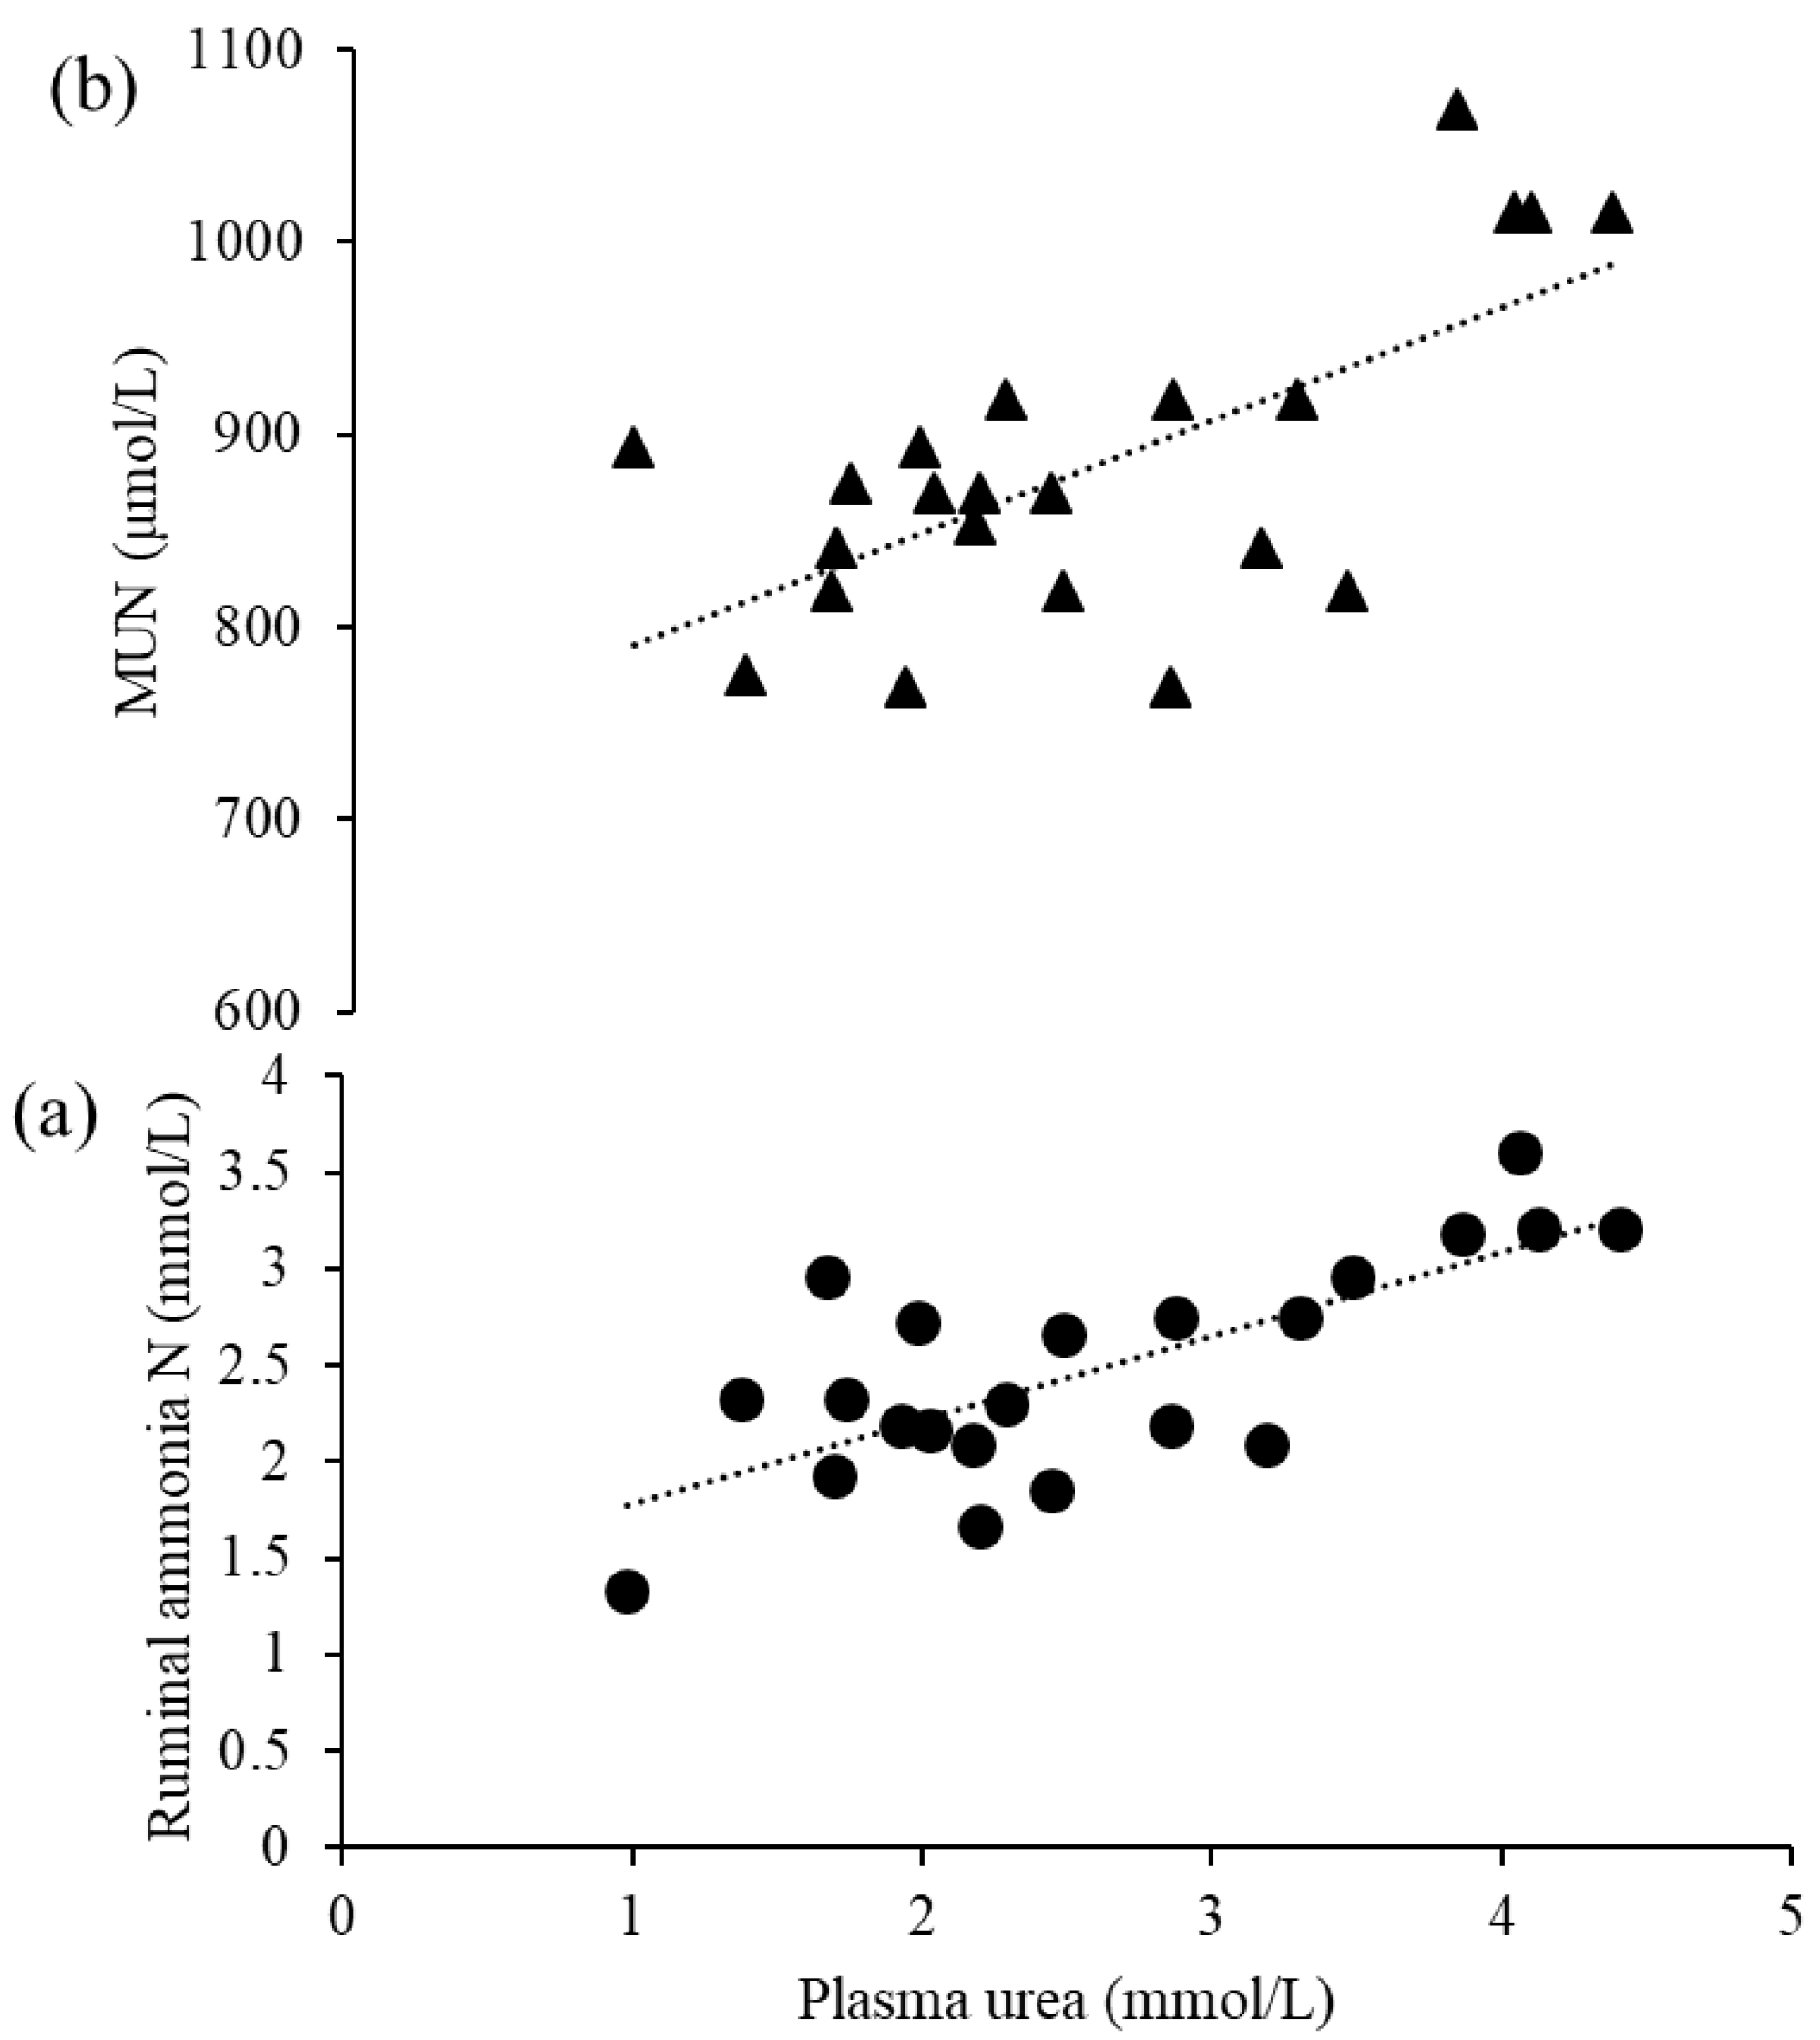
3.3. Plasma Metabolites and Ruminal Fermentation Characteristics
3.4. Milk Yield and Composition
3.5. Estimated Enteric Methane Emission
4. Discussion
4.1. Feed Intake and Nutrient Digestibility
4.2. Nitrogen Excretion and Utilization
4.3. Plasma Metabolites and Rumen NH3 Concentration
4.4. Milk Yield and Methane Emission
5. Conclusions
Author Contributions
Funding
Acknowledgments
Conflicts of Interest
References
- Mediksa, T. Comparison of In Sacco Rumen Dry Matter Degradability and Feeds intake and Digestion of Crossbred Dairy Cows (Holestian Friesian X Horro) Supplemented with Concentrate Diet. Am. J. Biosci. Bioeng. 2017, 5, 121. [Google Scholar] [CrossRef]
- Berihun, M.L.; Tsunekawa, A.; Haregeweyn, N.; Meshesha, D.T.; Adgo, E.; Tsubo, M.; Masunaga, T.; Fenta, A.A.; Sultan, D.; Yibeltal, M. Exploring land use/land cover changes, drivers and their implications in contrasting agro-ecological environments of Ethiopia. Land Use Policy 2019, 87, 104052. [Google Scholar] [CrossRef]
- Kitaba, A.; Tamir, B. Effect of harvesting stage and nutrient levels on nutritive values of natural pasture in central highlands of Ethiopia. Agric. Trop. Subtrop. 2007, 40, 7–12. [Google Scholar]
- Mekasha, A.; Gerard, B.; Tesfaye, K.; Nigatu, L.; Duncan, A.J. Inter-connection between land use/land cover change and herders’/farmers’ livestock feed resource management strategies: A case study from three Ethiopian eco-environments. Agric. Ecosyst. Environ. 2014, 188, 150–162. [Google Scholar] [CrossRef]
- Phelan, P.; Moloney, A.; McGeough, E.; Humphreys, J.; Bertilsson, J.; O’Riordan, E.; O’Kiely, P. Forage legumes for grazing and conserving in ruminant production systems. Crit. Rev. Plant. Sci. 2015, 34, 281–326. [Google Scholar] [CrossRef]
- Ali, A.I.; Wassie, S.E.; Korir, D.; Merbold, L.; Goopy, J.P.; Butterbach-Bahl, K.; Dickhoefer, U.; Schlecht, E. Supplementing tropical cattle for improved nutrient utilization and reduced enteric methane emissions. Animals 2019, 9, 210. [Google Scholar] [CrossRef]
- Garg, M.; Sherasia, P.; Phondba, B.; Makkar, H.P. Greenhouse gas emission intensity based on lifetime milk production of dairy animals, as affected by ration-balancing program. Anim. Prod. Sci. 2018, 58, 1027–1042. [Google Scholar] [CrossRef]
- Central Statistical Agency of Ethiopia. Available online: https://knoema.com/atlas/sources/Central-Statistical-Agency-of-Ethiopia (accessed on 7 June 2020).
- Mesfin, R.; Kebede, G. On-farm experience of feeding urea-molasses treated barley straw to crossbreed dairy cows in Jeldu District, highlands of Ethiopia. Agric. Res. Technol. 2011, 23. [Google Scholar] [CrossRef]
- Nichols, K.; Dijkstra, J.; Van Laar, H.; Pacheco, S.; Van Valenberg, H.; Bannink, A. Energy and nitrogen partitioning in dairy cows at low or high metabolizable protein levels is affected differently by postrumen glucogenic and lipogenic substrates. J. Dairy Sci. 2019, 102, 395–412. [Google Scholar] [CrossRef]
- Berhanu, Y.; Olav, L.; Nurfeta, A.; Angassa, A.; Aune, J.B. Methane emissions from ruminant livestock in Ethiopia: Promising forage species to reduce CH4 emissions. Agriculture 2019, 9, 130. [Google Scholar] [CrossRef]
- Ethiopia Livestock Sector Analysis: A 15 Year Livestock Sector Strategy. Available online: https://hdl.handle.net/10568/92057 (accessed on 5 June 2020).
- Tessema, Z.; Baars, R. Chemical composition, in vitro dry matter digestibility and ruminal degradation of Napier grass (Pennisetum purpureum (L.) Schumach.) mixed with different levels of Sesbania sesban (L.) Merr. Anim. Feed. Sci. Tech. 2004, 117, 29–41. [Google Scholar] [CrossRef]
- Mutimura, M.; Ebong, C.; Rao, I.M.; Nsahlai, I.V. Effects of supplementation of Brachiaria brizantha cultivar Piatá and Napier grass with Desmodium distortum on feed intake, digesta kinetics and milk production by crossbred dairy cows. Anim. Nutr. 2018, 4, 222–227. [Google Scholar] [CrossRef] [PubMed]
- Adnew, W.; Tsegay, B.A.; Tassew, A.; Asmare, B. Assessments of farmers′ perception and utilization status of Brachiaria grass in selected areas of Ethiopia. Biodiversitas J. Biol. Divers. 2018, 19, 955–966. [Google Scholar] [CrossRef]
- Nyambati, E.; Sollenberger, L.; Kunkle, W. Feed intake and lactation performance of dairy cows offered napiergrass supplemented with legume hay. Livest. Prod. Sci. 2003, 83, 179–189. [Google Scholar] [CrossRef]
- Teressa, A.; Teshome, A.; Kumar, A.; Hanson, J.; Jones, C.S. Opportunities for Napier grass (Pennisetum purpureum) improvement using molecular genetics. Agronomy 2017, 7, 28. [Google Scholar] [CrossRef]
- Quick Scan of Kenya’s Forage Sub-Sector. Netherlands East African Dairy Partnership (NEADAP), Working Paper Supplement: Survey Diagrams and Questionare. Available online: https://edepot.wur.nl/511704 (accessed on 6 June 2020).
- Ghimire, S.R.; Njarui, D.; Mutimura, M.; Cardoso, J.; Johnson, L.; Gichangi, E.; Teasdale, S.; Odokonyero, K.; Caradus, J.R.; Rao, I.M. Climate-smart Brachiaria for improving livestock production in East Africa: Emerging opportunities. In Proceedings of the 23rd International Grassland Congress 2015-Keynote Lectures, New Delhi, India, 20–24 November 2015. [Google Scholar]
- Wassie, W.A.; Tsegay, B.A.; Wolde, A.T.; Limeneh, B.A. Evaluation of morphological characteristics, yield and nutritive value of Brachiaria grass ecotypes in northwestern Ethiopia. Agric. Food. Secur. 2018, 7, 89. [Google Scholar] [CrossRef]
- Adinew, W.; Tsegay, B.A.; Tassew, A.; Asmare, B. Evaluation of Brachiaria hybrid Mulato II hay as a basal diet for growing Farta lambs in Ethiopia. Asian. Austral. J. Anim. 2019. [Google Scholar] [CrossRef]
- Valbuena, D.; Erenstein, O.; Tui, S.H.-K.; Abdoulaye, T.; Claessens, L.; Duncan, A.J.; Gérard, B.; Rufino, M.C.; Teufel, N.; van Rooyen, A. Conservation Agriculture in mixed crop–livestock systems: Scoping crop residue trade-offs in Sub-Saharan Africa and South Asia. Field Crop. Res. 2012, 132, 175–184. [Google Scholar] [CrossRef]
- Kashongwe, O.B.; Migwi, P.; Bebe, B.O.; Ooro, P.A.; Onyango, T.A.; Osoo, J.O. Improving the nutritive value of wheat straw with urea and yeast culture for dry season feeding of dairy cows. Trop. Anim. Health. Pro. 2014, 46, 1009–1014. [Google Scholar] [CrossRef]
- Alemu, D.; Tegegne, F.; Mekuriaw, Y. Comparative evaluation of effective microbe–and urea molasses–treated finger millet (Eleusine coracana) straw on nutritive values and growth performance of Washera sheep in northwestern Ethiopia. Trop. Anim. Health Proc. 2020, 52, 123–129. [Google Scholar] [CrossRef]
- Gulilat, L.; Walelign, E. Evaluation of milk production performance of lactating Fogera cows fed with urea and effective micro-organisms treated rice straw as basal diet. Int. J. Sci. Res. Publ. 2017, 7, 111–119. [Google Scholar]
- Saylor, B.; Min, D.; Bradford, B. Productivity of lactating dairy cows fed diets with teff hay as the sole forage. J. Dairy Sci. 2018, 101, 5984–5990. [Google Scholar] [CrossRef] [PubMed]
- Bitew, A.; Taye, M.; Kebede, A.; Mekuriaw, G.; Tassew, A.; Mulugeta, T.; Goshu, G. Milk yield and calf growth performance of cattle under partial suckling system at Andassa Livestock Research Centre, North West Ethiopia. Livest. Res. Rural Dev. 2010, 22, 2010. [Google Scholar]
- Nichols, K.; Bannink, A.; Pacheco, S.; van Valenberg, H.; Dijkstra, J.; van Laar, H. Feed and nitrogen efficiency are affected differently but milk lactose production is stimulated equally when isoenergetic protein and fat is supplemented in lactating dairy cow diets. J. Dairy. Sci. 2018, 101, 7857–7870. [Google Scholar] [CrossRef]
- Denekew, Y.; Tamir, B.; Melaku, S. Effect of harvesting date on composition and yield of natural pasture in northwestern Ethiopia. Trop. Sci. 2005, 45, 19–22. [Google Scholar] [CrossRef]
- Wondimeneh, M.; Biadegelegn, H.; Meseganaw, W.; Tekaba, E.; Mekonnen, T.; Adebabay, K. Selection of Productive Napier Grass Varieties (Pennisetum Purpureum) at Andassa Livestock Research Center, North West Ethiopia. In Proceedings of the 9th Annual Regional Conference on Completed Livestock Research Activities edited by Yeheyis, Likawent; Abegaz, Solomon, Amhara Regional Agricultural Research Institute, Bahir Dar, Ethiopia, 9–20 March 2016. [Google Scholar]
- Menke, K.; Steingass, H. Estimation of the energetic feed value obtained from chemical analysis and in vitro gas production using rumen fluid. Anim. Sci. 1988, 2, 7–55. [Google Scholar]
- Dejene, M.; Siyoum, T.; Kitaw, G.; Assefa, G.; Kehaliw, A. On-farm Evaluation of Urea Molasses Multi-nutrient Block and Concentrate Mixture as Supplement to Crossbred Lactating Dairy Cows. Livestock. Res. 2013, 121. [Google Scholar]
- Castro-Montoya, J.; Gownipuram, R.; Mendoza, M.; Solano, N.; López, F.; Dickhöfer, U.; Corea, E. Effects of feeding tropical forage legumes on nutrients digestibility, nitrogen partitioning and performance of crossbred milking cows. Anim. Feed. Sci. Tech. 2019, 247, 32–40. [Google Scholar] [CrossRef]
- Steiner, S.; Neidl, A.; Linhart, N.; Tichy, A.; Gasteiner, J.; Gallob, K.; Baumgartner, W.; Wittek, T. Randomised prospective study compares efficacy of five different stomach tubes for rumen fluid sampling in dairy cows. Vet. Rec. 2014, 176. [Google Scholar] [CrossRef]
- AOAC. Official Methods of Analysis of AOAC International, 17th ed.; AOAC international: Gaithersburg, MD, USA, 2000; pp. 43–44. [Google Scholar]
- AOAC. Official Methods of Analysis: Changes in Official Methods of Analysis Made at the Annual Meeting. Supplement, 17th ed.; AOAC international: Gaithersburg, MD, USA, 2000. [Google Scholar]
- Goering, H.; Van Soest, J. Forage Fiber Analyses (Apparatus, Reagents, Prcedures, and Some Applications); U.S. Agricultural Research Service: Baltimore, MD, USA, 1970.
- NRC. Nutrient Requirements of Dairy Cattle, Seventh Revised Addition; National Academies Press: Washington, DC, USA, 2001.
- Mekuriaw, S.; Tsunekawa, A.; Ichinohe, T.; Tegegne, F.; Haregeweyn, N.; Nobuyuki, K.; Tassew, A.; Mekuriaw, Y.; Walie, M.; Tsubo, M. Mitigating the anti-nutritional effect of polyphenols on in vitro digestibility and fermentation characteristics of browse species in north western Ethiopia. Trop. Anim. Health Proc. 2019, 1–12. [Google Scholar] [CrossRef]
- De Seram, E.; Penner, G.; Mutsvangwa, T. Nitrogen utilization, whole-body urea-nitrogen kinetics, omasal nutrient flow, and production performance in dairy cows fed lactose as a partial replacement for barley starch. J. Dairy Sci. 2019, 102, 6088–6188. [Google Scholar] [CrossRef]
- De Koster, J.; Salavati, M.; Grelet, C.; Crowe, M.A.; Matthews, E.; O’Flaherty, R.; Opsomer, G.; Foldager, L.; Hostens, M. Prediction of metabolic clusters in early-lactation dairy cows using models based on milk biomarkers. J. Dairy Sci. 2019, 102, 2631–2644. [Google Scholar] [CrossRef]
- Jardstedt, M.; Hessle, A.; Nørgaard, P.; Richardt, W.; Nadeau, E. Feed intake and urinary excretion of nitrogen and purine derivatives in pregnant suckler cows fed alternative roughage-based diets. Livest. Sci. 2017, 202, 82–88. [Google Scholar] [CrossRef]
- Silva, G.G.; Takiya, C.S.; Del Valle, T.A.; de Jesus, E.F.; Grigoletto, N.T.; Nakadonari, B.; Cortinhas, C.S.; Acedo, T.S.; Rennó, F.P. Nutrient digestibility, ruminal fermentation, and milk yield in dairy cows fed a blend of essential oils and amylase. J. Dairy Sci. 2018, 101, 9815–9826. [Google Scholar] [CrossRef] [PubMed]
- Kimura, F.T.; Miller, V. Chromic oxide measurement, improved determination of chromic oxide in cow feed and feces. J. Agric. Food Chem. 1957, 5, 216. [Google Scholar] [CrossRef]
- Smith, F.; Murphy, T. Analysis of Rumen Ammonia & Blood Urea Nitrogen. Available online: https://animalscience.unl.edu/Research/RumNut/RumNutLab/96-bloodureanitrogen.pdf (accessed on 6 June 2020).
- Mutian, N.; Kebreab, E.; Hristov, A.N.; Oh, J.; Arndt, C.; Bannink, A.; Bayat, A.R.; Brito, A.F.; Boland, T.M.; Casper, D.P. Prediction of enteric methane production, yield, and intensity in dairy cattle using an intercontinental database. Glob. Chang. Biol. 2018, 24, 3368–3389. [Google Scholar]
- Appuhamy, J.A.; France, J.; Kebreab, E. Models for predicting enteric methane emissions from dairy cows in North America, Europe, and Australia and New Zealand. Glob. Chang. Biol. 2016, 22, 3039–3056. [Google Scholar] [CrossRef] [PubMed]
- Christensen, R.; Yang, S.; Eun, J.-S.; Young, A.; Hall, J.; MacAdam, J. Effects of feeding birdsfoot trefoil hay on neutral detergent fiber digestion, nitrogen utilization efficiency, and lactational performance by dairy cows. J. Dairy Sci. 2015, 98, 7982–7992. [Google Scholar] [CrossRef]
- Sánchez, N.R.; Spörndly, E.; Ledin, I. Effect of feeding different levels of foliage of Moringa oleifera to creole dairy cows on intake, digestibility, milk production and composition. Livest. Sci. 2006, 101, 24–31. [Google Scholar] [CrossRef]
- Koenig, K.M.; Beauchemin, K.A. Effect of feeding condensed tannins in high protein finishing diets containing corn distillers grains on ruminal fermentation, nutrient digestibility, and route of nitrogen excretion in beef cattle. J. Anim. Sci. 2018, 96, 4398–4413. [Google Scholar] [CrossRef]
- Hymes-Fecht, U.; Broderick, G.; Muck, R.; Grabber, J. Replacing alfalfa or red clover silage with birdsfoot trefoil silage in total mixed rations increases production of lactating dairy cows1. J. Dairy Sci. 2013, 96, 460–469. [Google Scholar] [CrossRef] [PubMed]
- Ghelichkhan, M.; Eun, J.-S.; Christensen, R.G.; Stott, R.D.; MacAdam, J.W. Urine volume and nitrogen excretion are altered by feeding birdsfoot trefoil compared with alfalfa in lactating dairy cows. J. Anim. Sci. 2018, 96, 3993–4001. [Google Scholar] [CrossRef] [PubMed]
- Morales, Á.; Grob, D.; Wittwer, F.; Müller, A.; Balocchi, Ó.; Pulido, R. Evaluation of blood metabolites in dairy cows grazing under two pasture allowances and supplemented with corn silage under restricted grazing conditions. Rev. Bras. Zootech. 2016, 45, 686–692. [Google Scholar] [CrossRef]
- Getahun, D.; Getabalew, M.; Zewdie, D.; Alemneh, T.; Akeberegn, D. Urea Metabolism and Recycling in Ruminants. BJSTR 2019, 20, 14790–14796. [Google Scholar]
- Ospina, P.A.; McArt, J.A.; Overton, T.R.; Stokol, T.; Nydam, D.V. Using nonesterified fatty acids and β-hydroxybutyrate concentrations during the transition period for herd-level monitoring of increased risk of disease and decreased reproductive and milking performance. Vet. Clin. N. Am. Food A 2013, 29, 387–412. [Google Scholar] [CrossRef] [PubMed]
- Djoković, R.; Kurćubić, V.; Ilić, Z.; Cincović, M.; Lalović, M.; Jašović, B.; Bojkovski, J. Correlation between blood biochemical metabolites milk yield, dry matter intake and energy balance in dairy cows during early and mid lactation. ADM 2017, 5, 26–30. [Google Scholar]
- Jorjong, S.; Van Knegsel, A.; Verwaeren, J.; Lahoz, M.V.; Bruckmaier, R.; De Baets, B.; Kemp, B.; Fievez, V. Milk fatty acids as possible biomarkers to early diagnose elevated concentrations of blood plasma nonesterified fatty acids in dairy cows. J. Dairy Sci. 2014, 97, 7054–7064. [Google Scholar] [CrossRef]
- Gruber, S.; Mansfeld, R. Herd health monitoring in dairy farms–discover metabolic diseases. An overview. Tierärztliche Praxis Ausgabe G Großtiere/Nutztiere 2019, 47, 246–255. [Google Scholar] [CrossRef]
- Migliano, M.E.D.A.; Silano, C.; Martins, C.M.d.M.R.; Arcari, M.A.; dos Santos, M.V. Effect of dietary nitrogen source and crude protein content on nitrogen balance and lactating performance of dairy cows. Braz. J. Vet. Res. Anim. Sci. 2016, 53, 72–87. [Google Scholar] [CrossRef][Green Version]
- Prakash, B.; Saha, S.; Khate, K.; Agarwal, N.; Katole, S.; Haque, N.; Rajkhowa, C. Rumen microbial variation and nutrient utilisation in mithun (Bos frontalis) under different feeding regimes. J. Anim. Physiol. Anim. Nutr. 2013, 97, 297–304. [Google Scholar] [CrossRef]
- Vyas, D.; McGeough, E.; McGinn, S.; McAllister, T.; Beauchemin, K. Effect of Propionibacterium spp. on ruminal fermentation, nutrient digestibility, and methane emissions in beef heifers fed a high-forage diet. J. Anim. Sci. 2014, 92, 2192–2201. [Google Scholar] [CrossRef] [PubMed]
- Hussien, R.; Tegegne, F.; Yilma, Z.; Mekuriaw, Z.; Taye, M. Feed Intake, Milk Yield and Milk Composition of Fogera Cows Supplemented with Different Feeds. World’s Vet. J. 2013, 3, 41–45. [Google Scholar] [CrossRef]
- Uyeh, D.D.; Pamulapati, T.; Mallipeddi, R.; Park, T.; Asem-Hiablie, S.; Woo, S.; Kim, J.; Kim, Y.; Ha, Y. Precision animal feed formulation: An evolutionary multi-objective approach. Anim. Feed. Sci. Tech. 2019, 256, 114211. [Google Scholar] [CrossRef]
- Doska, M.C.; Silva, D.F.F.d.; Horst, J.A.; Valloto, A.A.; Rossi Junior, P.; Almeida, R.d. Sources of variation in milk urea nitrogen in Paraná dairy cows. Revista Brasileira de Zootecnia 2012, 41, 692–697. [Google Scholar] [CrossRef]
- Dong, L.; Li, B.; Diao, Q. Effects of Dietary Forage Proportion on Feed Intake, Growth Performance, Nutrient Digestibility, and Enteric Methane Emissions of Holstein Heifers at Various Growth Stages. Animals 2019, 9, 725. [Google Scholar] [CrossRef] [PubMed]


| Feed Ingredient | DM | OM | CP | NDF | ADF | ADL | GE | ME | NEm | NEl |
|---|---|---|---|---|---|---|---|---|---|---|
| Natural pasture hay | 878.61 | 869.88 | 41.75 | 741.79 | 512.08 | 76.47 | 15.52 | 8.02 | 1.44 | 1.27 |
| Treated teff straw silage | 660.73 | 618.34 | 115.50 | 644.18 | 454.28 | 49.79 | 16.23 | 7.03 | 0.98 | 1.03 |
| Napier grass hay | 856.87 | 837.75 | 92.54 | 626.51 | 450.59 | 83.10 | 14.15 | 7.28 | 1.01 | 0.82 |
| Brachiaria grass hay | 822.71 | 817.89 | 135.90 | 564.16 | 362.58 | 44.56 | 15.88 | 8.01 | 1.33 | 0.99 |
| Formulated concentrate | 910.40 | 904.86 | 201.60 | 340.57 | 153.78 | 60.27 | 18.32 | 9.26 | 1.47 | 1.22 |
| Treatment Diets (g/kg DM) | ||||||||||
| NPH | 901.21 | 892.46 | 122.90 | 541.21 | 333.03 | 68.43 | 16.94 | 8.51 | 1.45 | 1.25 |
| TTS | 690.13 | 604.44 | 158.14 | 492.46 | 304.08 | 55.04 | 17.36 | 8.14 | 1.23 | 1.13 |
| NGH | 863.65 | 839.38 | 147.82 | 483.63 | 302.29 | 71.71 | 16.28 | 8.27 | 1.24 | 1.02 |
| BhH | 866.58 | 827.91 | 168.34 | 452.47 | 258.20 | 52.23 | 17.01 | 8.62 | 1.40 | 1.11 |
| Item | Dietary Treatment | SEM | p | |||
|---|---|---|---|---|---|---|
| NPH | TTS | NGH | BhH | |||
| Intake (kg/d) | ||||||
| DM | 6.21 c | 7.71 b | 8.10 b | 8.85 a | 0.56 | 0.01 |
| OM | 5.60 c | 6.26 b | 7.12 ab | 8.01 a | 0.46 | <0.01 |
| N | 0.12 c | 0.20 b | 0.19 b | 0.24 a | 0.15 | 0.01 |
| NDF | 4.31 a | 3.87 b | 2.66 c | 2.78 a | 0.29 | 0.03 |
| ADF | 2.51 a | 2.63 a | 2.01 b | 1.36 c | 0.08 | 0.01 |
| GE (MJ/d) | 104.89 c | 132.80 b | 131.18 b | 150.58 a | 9.43 | <0.01 |
| ME (MJ/d) | 53.38 b | 39.58 b | 41.90 b | 75.87 a | 8.30 | <0.01 |
| DMI, g/kg BW0.75 | 97.95 c | 115.58 b | 124.06 b | 153.97 a | 0.01 | 0.03 |
| ADG ( g/day) | 326.18 c | 446.38 b | 485.71 ab | 627.46 6a | 27.08 | 0.02 |
| Nutrient Digestibility (%) | ||||||
| DM | 64.20 c | 79.60 b | 80.60 b | 87.70 a | 4.95 | 0.03 |
| OM | 58.90 c | 71.47 b | 74.12 ab | 79.39 a | 4.35 | <0.01 |
| N | 59.70 c | 76.24 b | 72.70 b | 83.36 a | 4.94 | <0.01 |
| NDF | 48.14 c | 52.89 b | 54.24 a | 56.65 a | 1.77 | 0.03 |
| ADF | 47.72 c | 49.10 b | 50.45 b | 53.42 a | 1.22 | 0.01 |
| Dietary Treatment | SEM | p | ||||
|---|---|---|---|---|---|---|
| NPH | TTS | NGH | BhH | |||
| Nitrogen Balance (g/d) | ||||||
| N intake, g/d | 120.90 c | 195.59 b | 190.58 b | 238.68 a | 24.1 | <0.01 |
| Fecal N | 48.64 a | 40.50 b | 37.10 c | 35.21 c | 4.5 | 0.01 |
| Urinary N | 25.70 b | 29.33 a | 22.87 c | 23.85 c | 1.9 | 0.04 |
| Milk N | 12.88 c | 19.64 b | 22.86 ab | 27.98 a | 2.3 | 0.02 |
| N retention | 33.68 d | 92.27 b | 87.64 c | 122.65 a | 17.5 | 0.03 |
| Nitrogen Utilization Efficiency (g/g) | ||||||
| Fecal N/N intake | 0.40 a | 0.22 b | 0.27 b | 0.17 c | 0.02 | 0.03 |
| Urinary N/N intake | 0.21 a | 0.15 a | 0.12 b | 0.10 b | 0.02 | 0.04 |
| Urinary N/fecal N | 0.60 a | 0.54 b | 0.39 c | 0.37 c | 0.06 | 0.02 |
| Milk N/N intake | 0.11 | 0.10 | 0.12 | 0.12 | 0.01 | 0.36 |
| N retention/N intake | 0.33 c | 0.47 ab | 0.46 ab | 0.51 | 0.05 | <0.01 |
| Dietary Treatment | SEM | p | ||||
|---|---|---|---|---|---|---|
| NPH | TTS | NGH | BhH | |||
| Plasma urea nitrogen | 2.96 b | 3.36 a | 2.77 b | 2.64 b | 0.23 | 0.02 |
| Plasma glucose | 2.94 b | 2.55 c | 2.70 b | 3.81 a | 0.40 | 0.01 |
| Plasma NEFA | 0.51 a | 0.36 b | 0.32 b | 0.30 b | 0.39 | 0.02 |
| Plasma BHBA | 0.22 a | 0.05 b | 0.05 b | 0.04 b | 0.06 | 0.04 |
| Ruminal ammonia N | 2.29 c | 2.70 b | 3.25 a | 2.91 b | 0.21 | 0.01 |
| Rumen pH | 6.60 | 6.50 | 6.90 | 6.70 | 0.33 | 0.36 |
| Dietary Treatment | SEM | p | ||||
|---|---|---|---|---|---|---|
| NPH | TTS | NGH | BhH | |||
| Yield | ||||||
| Milk (kg/d) | 1.77 c | 2.34 b | 2.71 b | 3.34 a | 0.27 | 0.01 |
| FPCM (kg/d)d | 2.06 c | 2.69 b | 2.91 b | 3.40 a | 0.38 | 0.02 |
| Composition (%) | ||||||
| Fat | 5.49 | 6.38 | 5.68 | 5.40 | 0.13 | 0.16 |
| Protein | 2.76 | 2.76 | 2.88 | 2.78 | 0.16 | 0.06 |
| Lactose | 4.19 c | 4.81 a | 4.59 ab | 4.21 b | 0.23 | 0.04 |
| MUN (μmol/L) | 858.6 b | 975.6 a | 837.2 b | 879.5 b | 37.8 | 0.04 |
| Efficiency | 0.28 b | 0.29 b | 0.35 a | 0.34 a | 0.02 | 0.03 |
| Dietary Treatment | SEM | p | ||||
|---|---|---|---|---|---|---|
| NPH | TTS | NGH | BhH | |||
| CH4 (g/d) | 206.5 d | 226.5 c | 231.7 b | 241.6 a | 7.66 | 0.011 |
| CH4/BW0.75 (g/kg) | 3.0 | 3.2 | 3.3 | 3.4 | 0.08 | 0.21 |
| CH4/feed intake or milk yield (g/kg) | ||||||
| CH4/DM intake | 33.27 a | 29.38 b | 28.61 b | 27.33 b | 1.44 | 0.01 |
| CH4/OM intake | 36.87 a | 32.25 b | 32.17 b | 30.70 b | 1.28 | 0.03 |
| CH4/ GE intake | 8.21 a | 7.12 b | 7.40 b | 6.70 c | 0.33 | 0.03 |
| CH4/milk yield | 116.61 a | 96.89 b | 79.50 c | 71.12 c | 9.09 | 0.02 |
| CH4/FPCM | 84.12 a | 69.61 b | 65.20 b | 38.15 c | 8.85 | 0.02 |
© 2020 by the authors. Licensee MDPI, Basel, Switzerland. This article is an open access article distributed under the terms and conditions of the Creative Commons Attribution (CC BY) license (http://creativecommons.org/licenses/by/4.0/).
Share and Cite
Mekuriaw, S.; Tsunekawa, A.; Ichinohe, T.; Tegegne, F.; Haregeweyn, N.; Kobayashi, N.; Tassew, A.; Mekuriaw, Y.; Walie, M.; Tsubo, M.; et al. Effect of Feeding Improved Grass Hays and Eragrostis tef Straw Silage on Milk Yield, Nitrogen Utilization, and Methane Emission of Lactating Fogera Dairy Cows in Ethiopia. Animals 2020, 10, 1021. https://doi.org/10.3390/ani10061021
Mekuriaw S, Tsunekawa A, Ichinohe T, Tegegne F, Haregeweyn N, Kobayashi N, Tassew A, Mekuriaw Y, Walie M, Tsubo M, et al. Effect of Feeding Improved Grass Hays and Eragrostis tef Straw Silage on Milk Yield, Nitrogen Utilization, and Methane Emission of Lactating Fogera Dairy Cows in Ethiopia. Animals. 2020; 10(6):1021. https://doi.org/10.3390/ani10061021
Chicago/Turabian StyleMekuriaw, Shigdaf, Atsushi Tsunekawa, Toshiyoshi Ichinohe, Firew Tegegne, Nigussie Haregeweyn, Nobuyuki Kobayashi, Asaminew Tassew, Yeshambel Mekuriaw, Misganaw Walie, Mitsuru Tsubo, and et al. 2020. "Effect of Feeding Improved Grass Hays and Eragrostis tef Straw Silage on Milk Yield, Nitrogen Utilization, and Methane Emission of Lactating Fogera Dairy Cows in Ethiopia" Animals 10, no. 6: 1021. https://doi.org/10.3390/ani10061021
APA StyleMekuriaw, S., Tsunekawa, A., Ichinohe, T., Tegegne, F., Haregeweyn, N., Kobayashi, N., Tassew, A., Mekuriaw, Y., Walie, M., Tsubo, M., Okuro, T., Meshesha, D. T., Meseret, M., Sam, L., & Fievez, V. (2020). Effect of Feeding Improved Grass Hays and Eragrostis tef Straw Silage on Milk Yield, Nitrogen Utilization, and Methane Emission of Lactating Fogera Dairy Cows in Ethiopia. Animals, 10(6), 1021. https://doi.org/10.3390/ani10061021