
Quantitative Protein Analysis of ZPB2, ZPB1 and ZPC in the Germinal Disc and a Non-Germinal Disc Region of the Inner Perivitelline Layer in Two Genetic Lines of Turkey Hens That Differ in Fertility

Abstract
:Simple Summary
Abstract
1. Introduction
2. Materials and Methods
2.1. Animals
2.2. Tissue Collection
2.3. Antibodies
2.4. SDS-PAGE and Western Blot Analysis
2.5. Statistical Analysis
3. Results
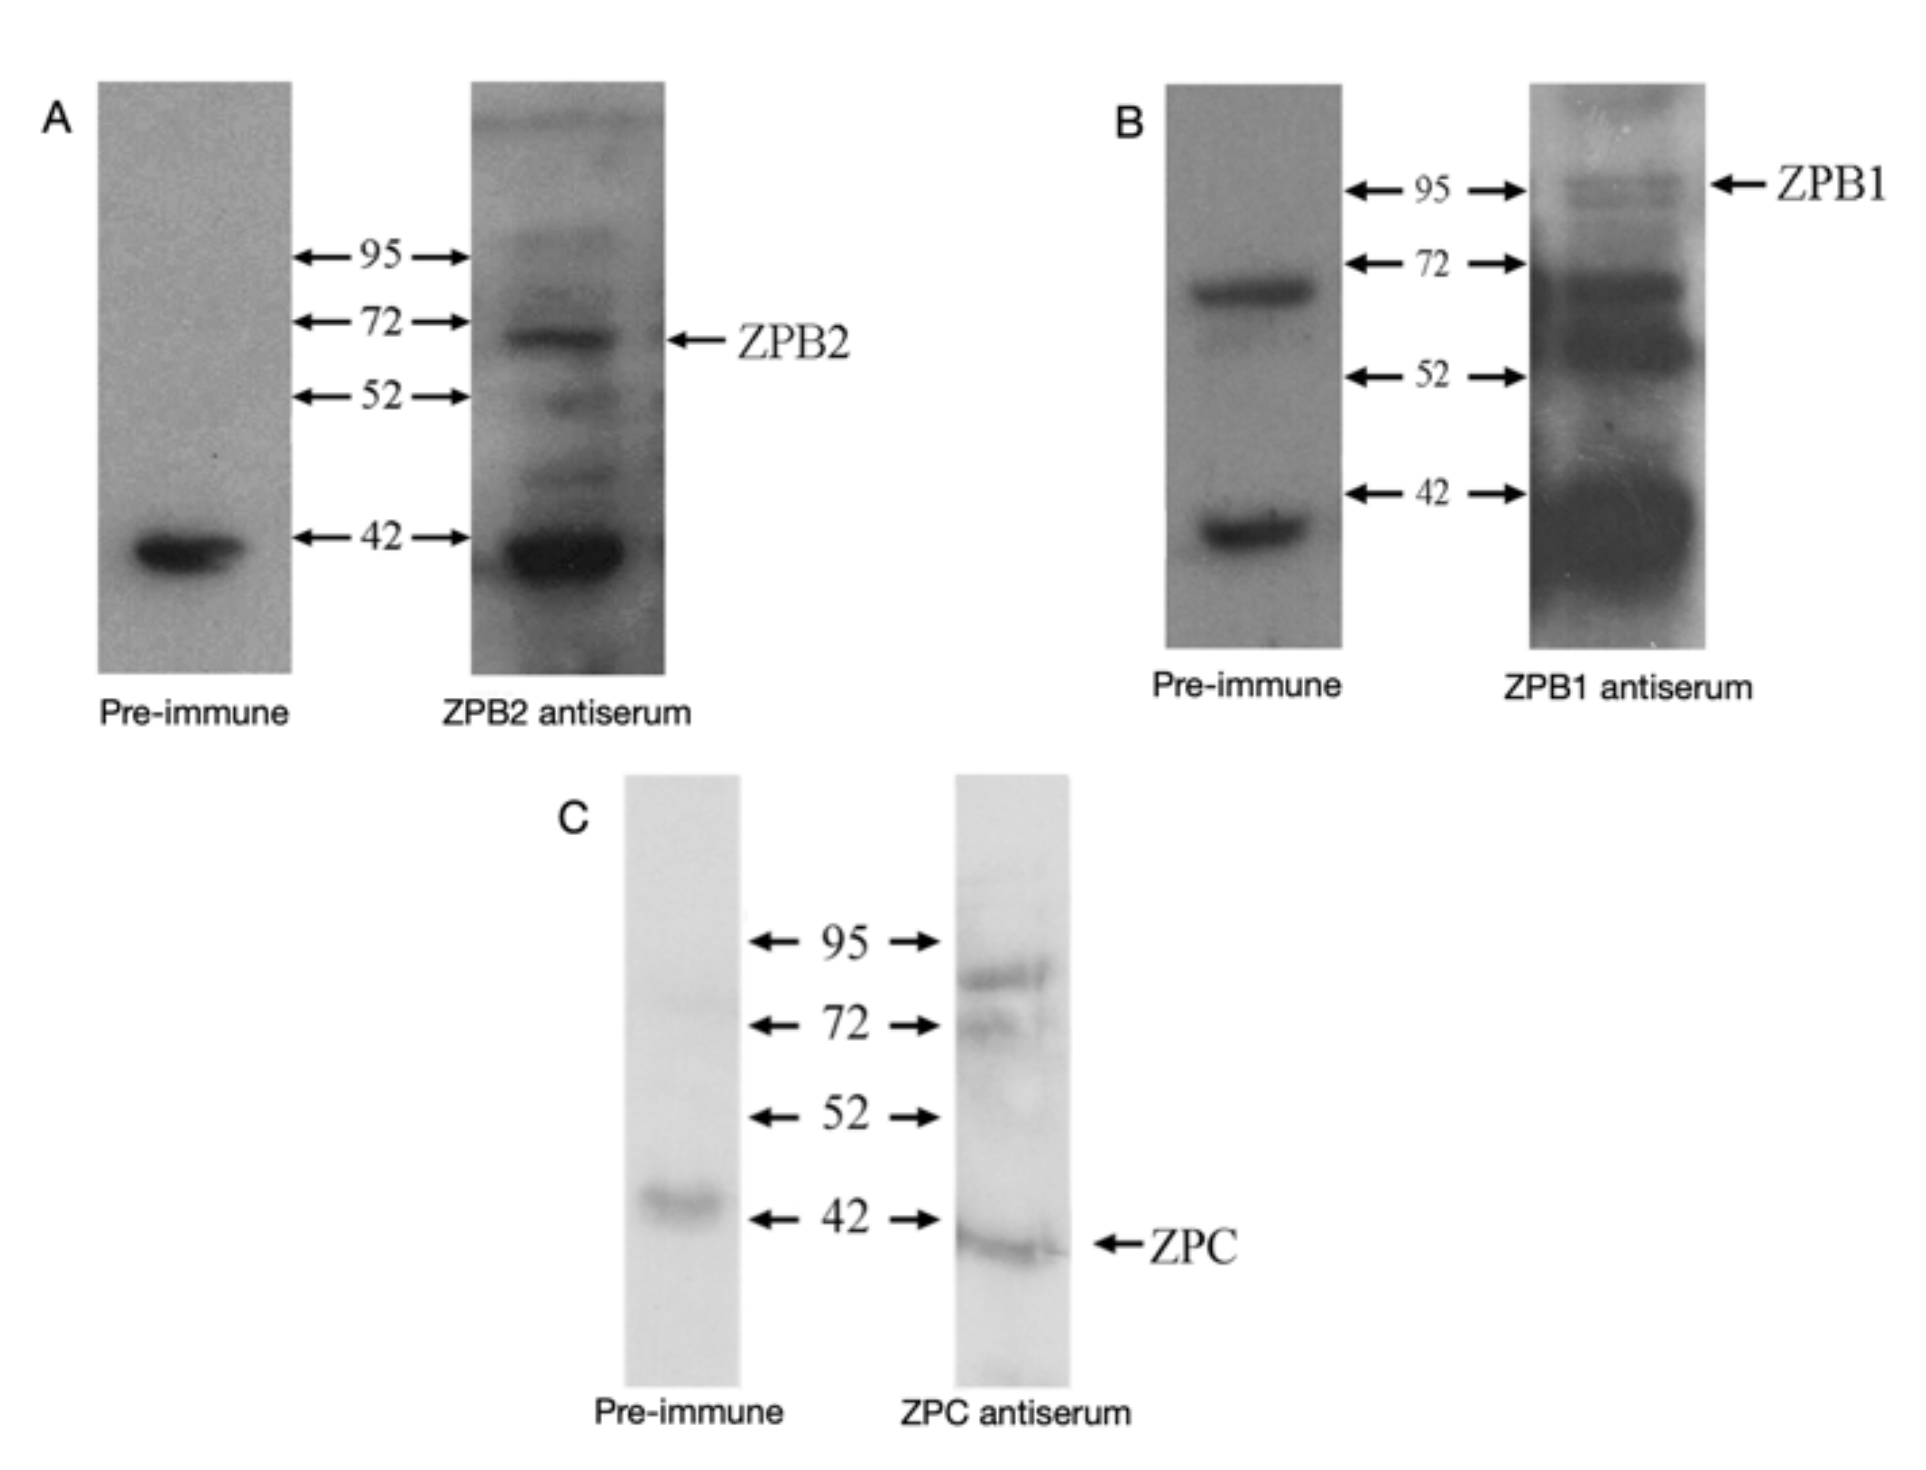
3.1. Antibodies
3.2. ZPB2
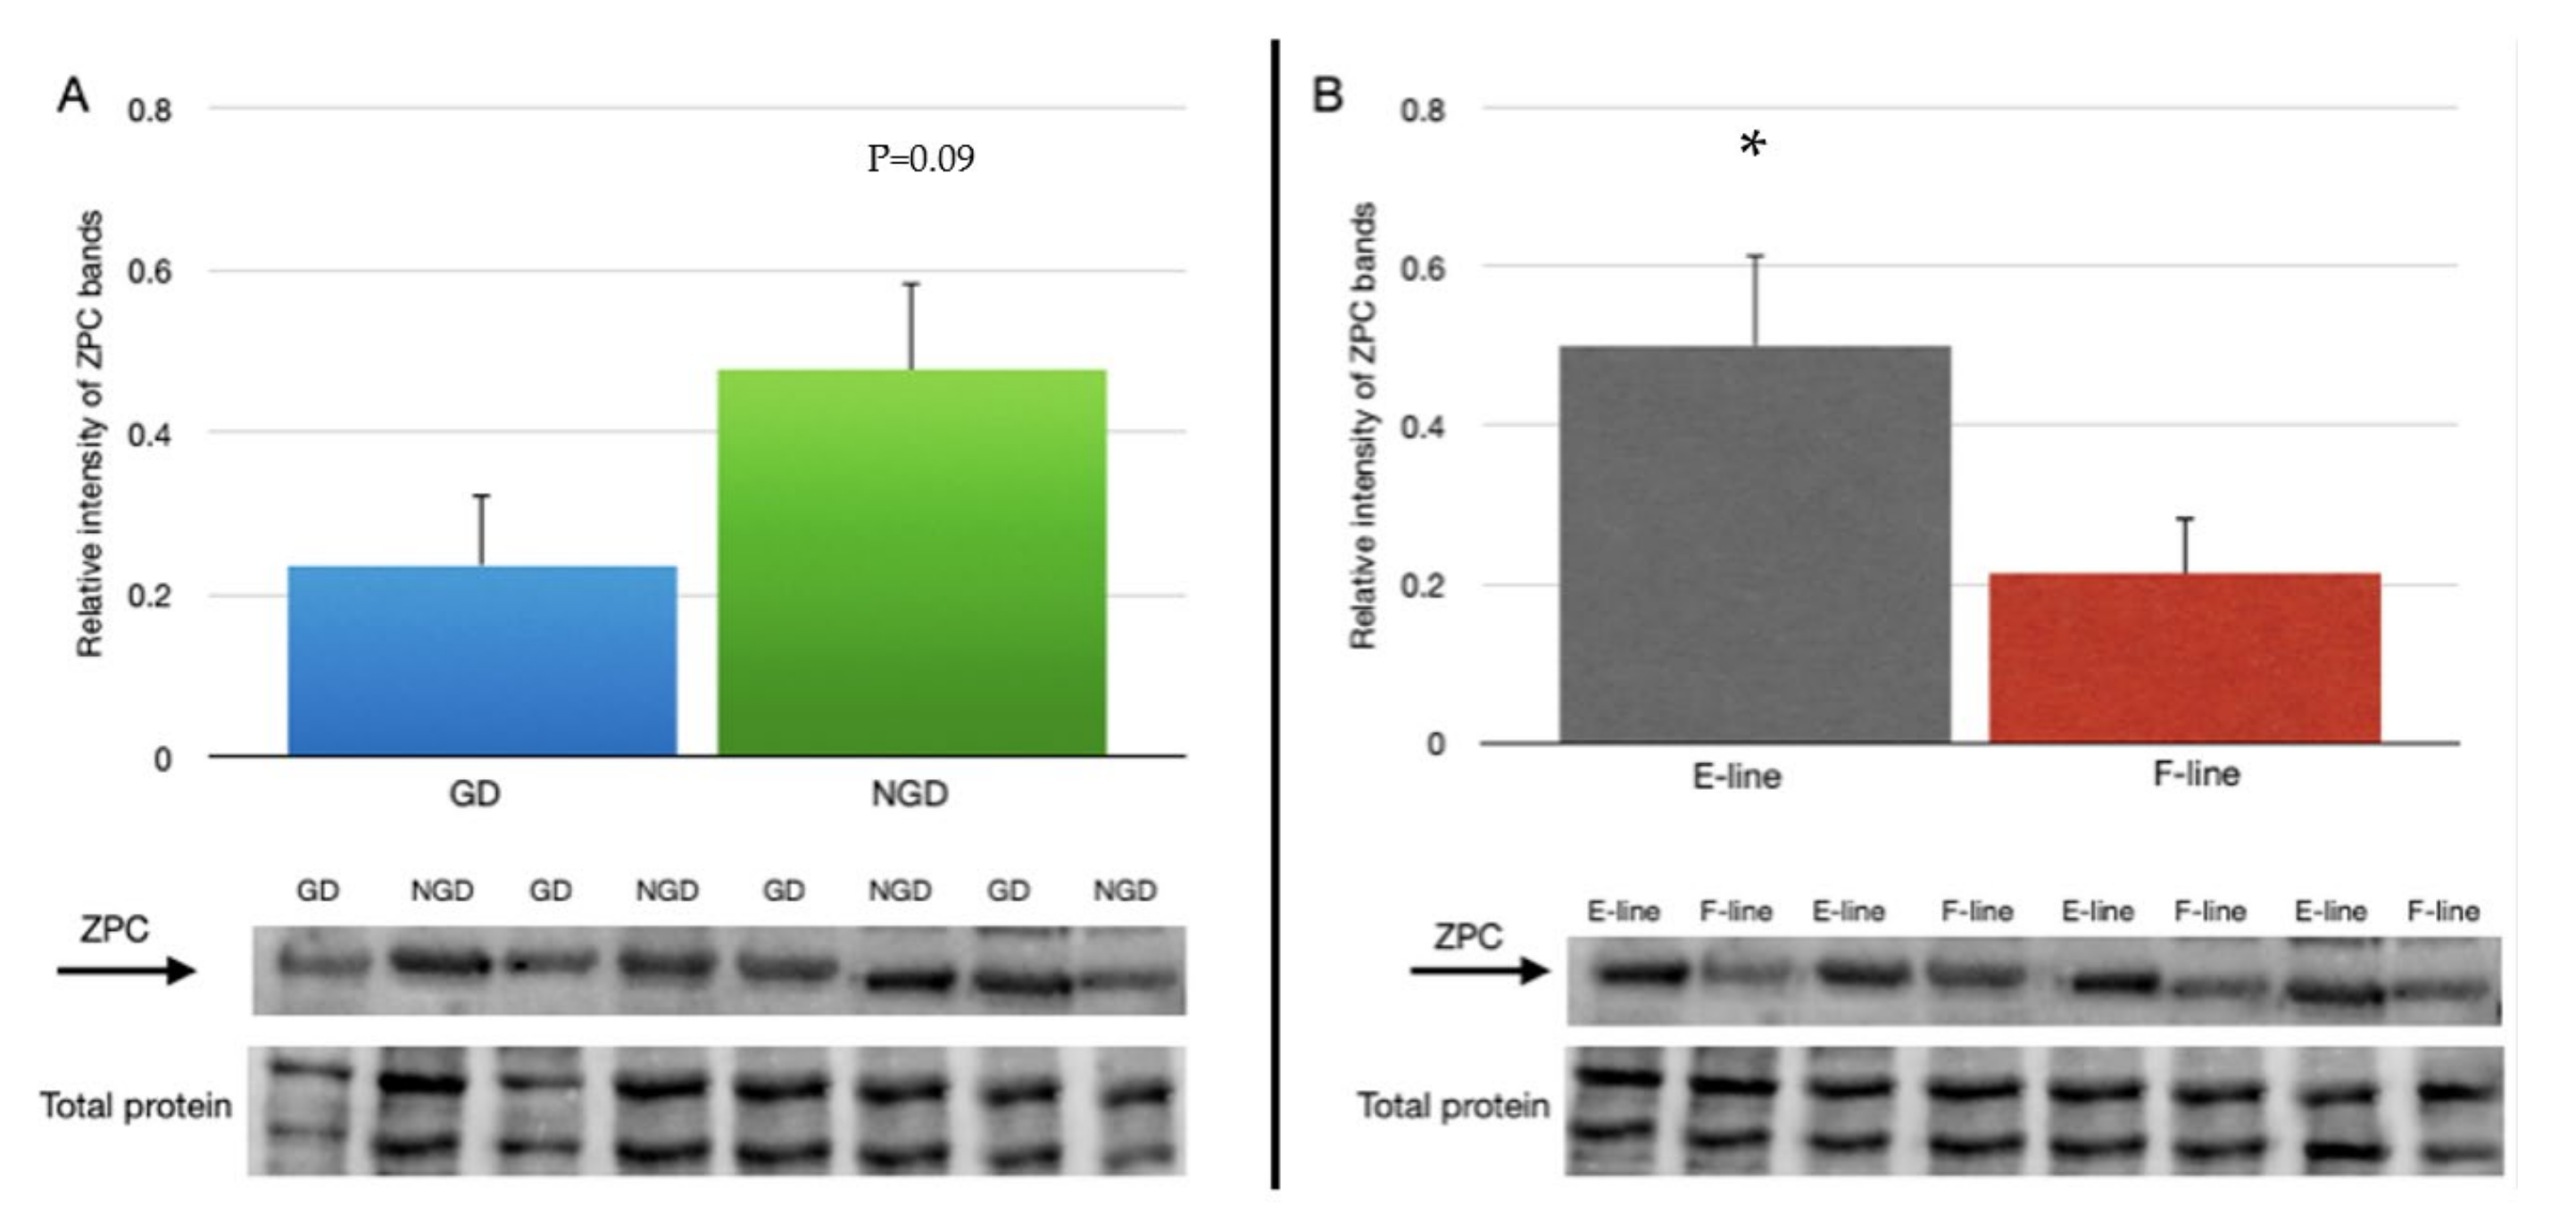
3.3. ZPC
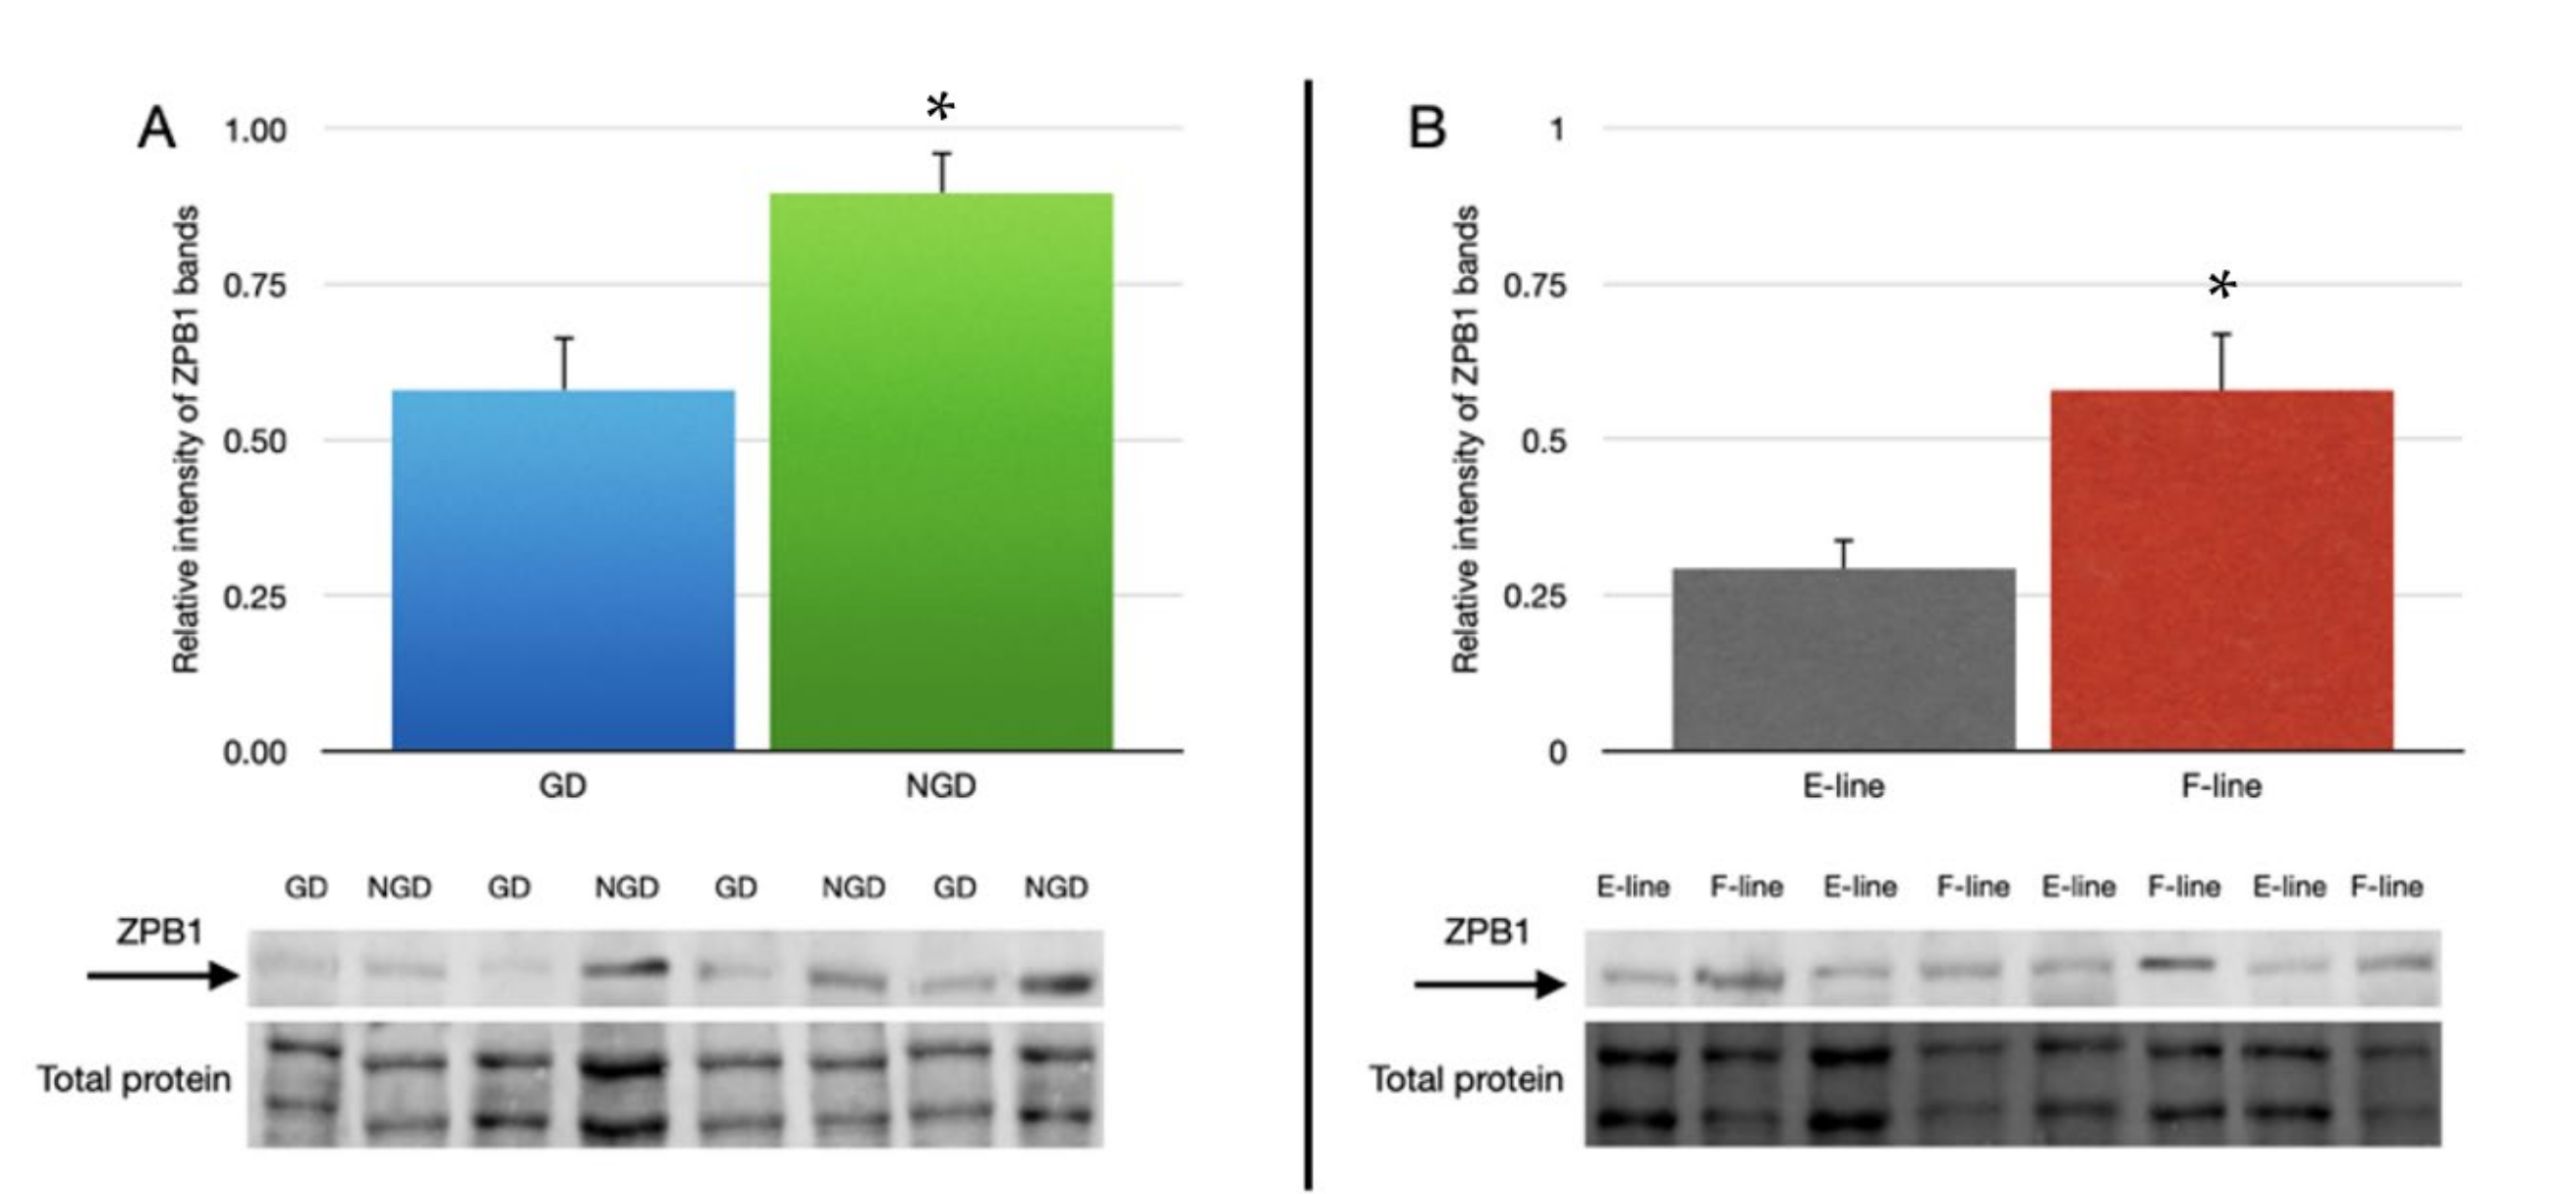
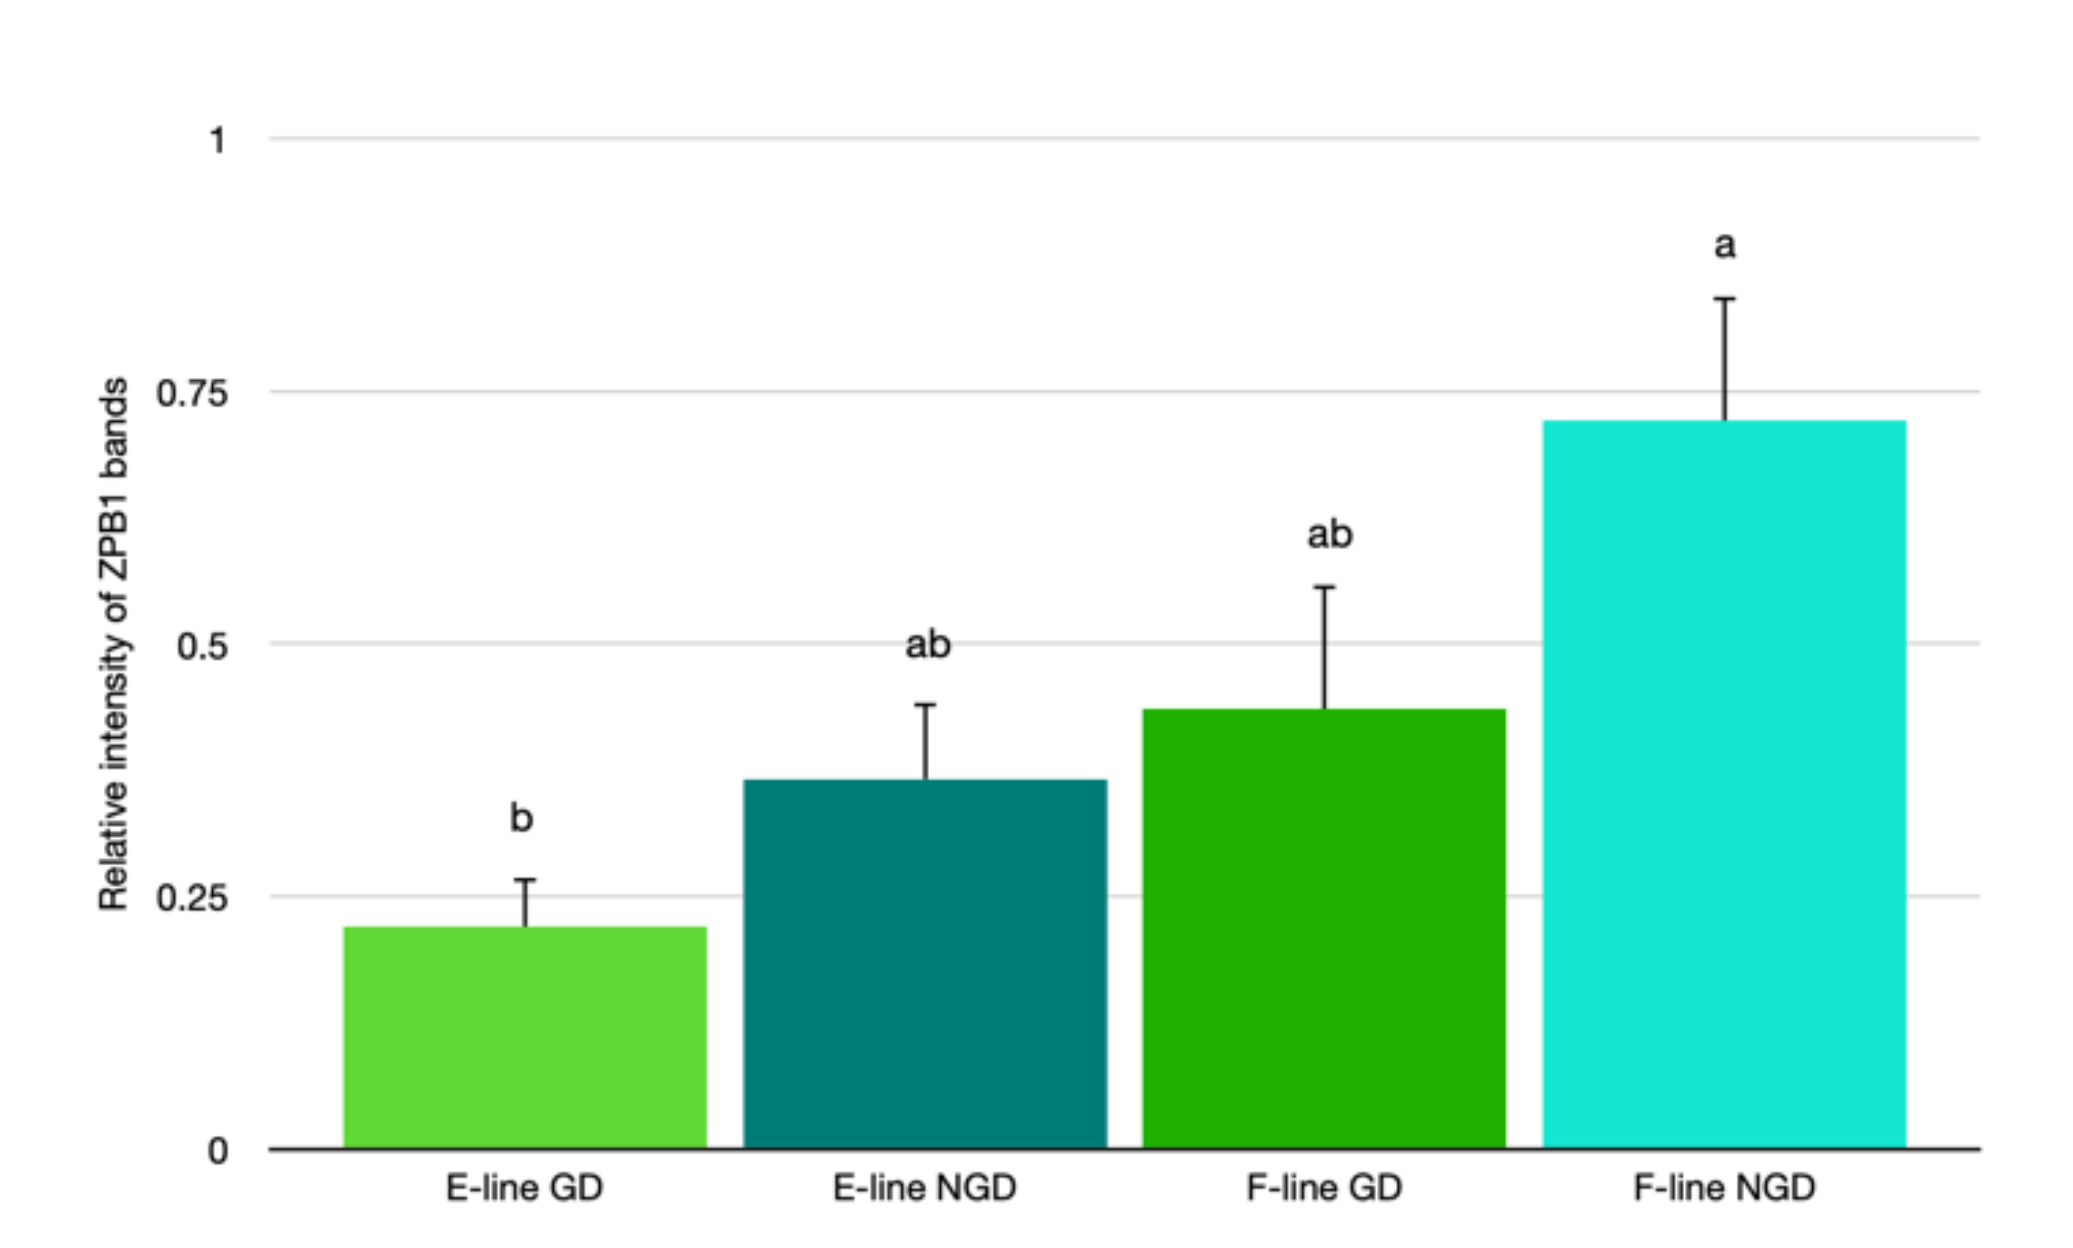
3.4. ZPB1
4. Discussion
5. Conclusions
Author Contributions
Funding
Institutional Review Board Statement
Informed Consent Statement
Conflicts of Interest
References
- Bakst, M.R.; Howarth, B. The fine structure of the hen’s ovum at ovulation. Biol. Reprod. 1977, 17, 361–369. [Google Scholar] [CrossRef] [PubMed] [Green Version]
- Perry, M.M.; Gilbert, A.B.; Evans, A.J. Structure of germinal disk region of hens’ ovarian follicle during rapid growth phase. J. Anat. 1978, 127, 379–392. [Google Scholar] [PubMed]
- Marrone, B.L.; Crissman, H.A. Characterization of the granulosa cell subpopulations from avian preovulatory follicles by multiparameter flow cytometry. Endocrinology 1988, 122, 651–658. [Google Scholar] [CrossRef]
- Marrone, B.L.; Jamaluddin, M.; Hertelendy, F. Regional pattern of cell maturation and progesterone biosynthesis of the avian granulosa cell layer. Biol. Reprod. 1990, 42, 405–412. [Google Scholar] [CrossRef] [PubMed] [Green Version]
- Zhu, G.; Fang, C.; Mo, C.; Wang, Y.; Huang, Y. Transcriptomic analysis of granulosa cell populations proximal and distal to the germinal disc of chicken preovulatory follicles. Sci. Rep. 2021, 11, 4683. [Google Scholar] [CrossRef] [PubMed]
- Okamura, F.; Nishiyama, H. Penetration of spermatozoon into ovum and transformation of sperm nucleus into the male pronucleus in the domestic fowl, Gallus gallus. Cell Tissue Res. 1978, 190, 89–98. [Google Scholar] [CrossRef]
- Howarth, B.; Digby, S.T. Evidence for penetration of vitelline membrane of hens ovum by a trypsin-like acrosomal enzyme. Reproduction 1973, 33, 123–125. [Google Scholar] [CrossRef] [Green Version]
- Bakst, M.R.; Howarth, B. Hydrolysis of the hen’s perivitelline layer by cock sperm in vitro. Biol. Reprod. 1977, 17, 370–379. [Google Scholar] [CrossRef] [Green Version]
- Bramwell, R.K.; Howarth, B. Preferential attachment of cock spermatozoa to the perivitelline layer directly over the germinal disk of the hen’s ovum. Biol. Reprod. 1992, 47, 1113–1117. [Google Scholar] [CrossRef] [Green Version]
- Birkhead, T.R.; Sheldon, B.C.; Fletcher, F. A comparative study of sperm-egg interactions in birds. Reproduction 1994, 101, 353–361. [Google Scholar] [CrossRef] [Green Version]
- Kuroki, M.; Mori, M. Binding of spermatozoa to the perivitelline layer in the presence of a protease inhibitor. Poult. Sci. 1997, 76, 748–752. [Google Scholar] [CrossRef]
- Wishart, G.J. Quantitative aspects of sperm: Egg interaction in chickens and turkeys. Anim. Reprod. Sci. 1997, 48, 81–92. [Google Scholar] [CrossRef]
- Spargo, S.C.; Hope, R.M. Evolution and nomenclature of the zona pellucida gene family. Biol. Reprod. 2003, 68, 358–362. [Google Scholar] [CrossRef] [PubMed] [Green Version]
- Waclawek, M.; Foisner, R.; Nimpf, J.; Schneider, W.J. The chicken homologue of zona pellucida protein-3 is synthesized by granulosa cells. Biol. Reprod. 1998, 59, 1230–1239. [Google Scholar] [CrossRef] [PubMed] [Green Version]
- Bausek, N.; Waclawek, M.; Schneider, W.J.; Wohlrab, F. The major chicken egg envelope protein ZP1 is different from ZPB and is synthesized in the liver. J. Biol. Chem. 2000, 275, 28866–28872. [Google Scholar] [CrossRef] [Green Version]
- Okumura, H.; Kohnon, Y.; Iwata, Y.; Mori, H.; Aoki, N.; Sato, C.; Kitajima, K.; Nadano, D.; Matsuda, T. A newly identified zona pellucida glycoprotein, ZPD, and dimeric ZP1 of chicken egg envelope are involved in sperm activation on sperm-egg interaction. Biochem. J. 2004, 384, 191–199. [Google Scholar] [CrossRef] [Green Version]
- Mann, K. Proteomic analysis of the chicken egg vitelline membrane. Proteomics 2008, 8, 2322–2332. [Google Scholar] [CrossRef]
- Serizawa, M.; Kinoshita, M.; Rodler, D.; Tsukada, A.; Ono, H.; Yoshimura, T.; Kansaku, N.; Sasanami, T. Ocytic expression of zona pellucida protein ZP4 in Japanese quail (Coturnix japonica). Anim. Sci. J. 2011, 82, 227–235. [Google Scholar] [CrossRef] [Green Version]
- Benson, A.P.; Malloy, M.; Steed, J.R.; Christensen, V.L.; Fairchild, B.D.; Davis, A.J. Zona pellucida protein B2 messenger ribonucleic acid varies with follicular development and granulosa cell location. Poult. Sci. 2017, 96, 3414–3421. [Google Scholar] [CrossRef]
- Benson, A.P.; Christensen, V.L.; Fairchild, B.D.; Davis, A.J. The mRNA for zona pellucida proteins B1, C, and D in two genetic lines of turkey hens that differ in fertility. Anim. Reprod. Sci. 2009, 111, 149–159. [Google Scholar] [CrossRef]
- Sasanami, T.; Pan, J.; Mori, M. Expression of perivitelline membrane glycoprotein ZP1 in the liver of Japanese quail (Coturnix japonica) after in vivo treatment with diethylstilbestrol. J. Steroid Biochem. 2003, 84, 109–116. [Google Scholar] [CrossRef]
- Takeuchi, Y.; Nishimura, K.; Aoki, N.; Adachi, T.; Sato, C.; Kitajima, K.; Matsuda, T. A 42-kDa glycoprotein from chicken egg-envelope, an avian homolog of the ZPC family glycoproteins in mammalian zona pellucida - Its first identification, cDNA cloning and granulosa cell-specific expression. Eur. J. Biochem. 1999, 260, 736–742. [Google Scholar] [CrossRef] [PubMed] [Green Version]
- Pan, J.Z.; Sasanami, T.; Kono, Y.; Matsuda, T.; Mori, M. Effects of testosterone on production of perivitelline membrane glycoprotein ZPC by granulosa cells of Japanese quail (Coturnix japonica). Biol. Reprod. 2001, 64, 310–316. [Google Scholar] [CrossRef] [Green Version]
- Kinoshita, M.; Rodler, D.; Sugiura, K.; Matsushima, K.; Kansaku, N.; Tahara, K.; Tsukada, A.; Ono, H.; Yoshimura, T.; Yoshizaki, N.; et al. Zona pellucida protein ZP2 is expressed in the oocyte of Japanese quail (Coturnix japonica). Reproduction 2010, 139, 359–371. [Google Scholar] [CrossRef] [Green Version]
- Nishio, S.; Kohno, Y.; Iwata, Y.; Arai, M.; Okumura, H.; Oshima, K.; Matsuda, T. Glycosylated Chicken ZP2 Accumulates in the Egg Coat of Immature Oocytes and Remains Localized to the Germinal Disc Region of Mature Eggs. Biol. Reprod. 2014, 91, 1–10. [Google Scholar] [CrossRef] [PubMed]
- Rodler, D.; Sasanami, T.; Sinowatz, F. Assembly of the Inner Perivitelline Layer, a Homolog of the Mammalian Zona Pellucida: An Immunohistochemical and Ultrastructural Study. Cells Tissues Organs 2012, 195, 330–339. [Google Scholar] [CrossRef] [Green Version]
- Bausek, N.; Ruckenbauer, H.H.; Pfeifer, S.; Schneider, W.J.; Wohlrab, F. Interaction of sperm with purified native chicken ZP1 and ZPC proteins. Biol. Reprod. 2004, 71, 684–690. [Google Scholar] [CrossRef]
- Ichikawa, Y.; Matsuzaki, M.; Mizushima, S.; Sasanami, T. Egg Envelope Glycoproteins ZP1 and ZP3 Mediate Sperm-Egg Interaction in the Japanese quail. J. Poult. Sci. 2017, 54, 80–86. [Google Scholar] [CrossRef] [Green Version]
- Nestor, K.E.; Noble, D.O. Influence of selection for increased egg-production, bodyweight, and shank width of turkeys on egg composition and the relationship of the egg traits to hatchability. Poult. Sci. 1995, 74, 427–433. [Google Scholar] [CrossRef]
- Nestor, K.E.; Noble, D.O.; Zhu, J.; Moritsu, Y. Direct and correlated responses to long-term selection for increased body weight and egg production in turkeys. Poult. Sci. 1996, 75, 1180–1191. [Google Scholar] [CrossRef]
- Christensen, V.L.; Fairchild, B.D.; Ort, D.T.; Nestor, K.E. Dam and sire effects on sperm penetration of the perivitelline layer and resulting fecundity of different lines of turkeys. J. Appl. Poult. Res. 2005, 14, 483–491. [Google Scholar] [CrossRef]
- de Sousa Abreu, R.; Penalva, O.L.; Marcotte, E.M.; Vogel, C. Global signatures of protein and mRNA expression levels. Mol. Biosyst. 2009, 12, 1512–1526. [Google Scholar] [CrossRef] [PubMed] [Green Version]
- Vogel, C.; de Sousa Abreu, R.; Ko, D.; Le, S.Y.; Shapiro, B.A.; Burns, S.C.; Penalva, L.O. Sequence signatures and mRNA concentration can explain two-thirds of protein abundance variation in a human cell line. Mol. Syst. Biol. 2010, 6, 400–409. [Google Scholar] [CrossRef] [PubMed]
- Gurtler, A.; Kunz, N.; Gomolka, M.; Hornhardt, S.; Friedl, A.; McDonald, K.; Kohn, J.; Posch, A. Stain-free technology as a normalization tool in Western blot analysis. Anal. Biochem. 2013, 433, 105–111. [Google Scholar] [CrossRef]
- McCartney, M.G.; Nestor, K.E.; Harvey, W.R. Genetics of growth and reproduction in turkey. 2. Selection for increased body weight and egg production. Poult. Sci. 1968, 47, 981–988. [Google Scholar] [CrossRef]
- McCartney, M.G. A random bred control population of turkeys. Poult. Sci. 1968, 43, 739–744. [Google Scholar] [CrossRef]
- Nestor, K.E. Genetics of growth and reproduction in turkey. 5. Selection for increased body weight alone and in combination with increased egg production. Poult. Sci. 1977, 56, 337–347. [Google Scholar] [CrossRef]
- Nestor, K.E.; Anderson, J.W.; Patterson, R.A. Genetics of growth and reproduction in the turkey. 14. Changes in genetic parameters over thirty generations of selection for increased body weight. Poult. Sci. 2000, 79, 445–452. [Google Scholar] [CrossRef]
- Anthony, N.B.; Emmerson, D.A.; Nestor, K.E. Genetics of growth and reproduction in the turkey.12. Results of long-term selection for increased 180-day egg production. Poult. Sci. 1991, 70, 1314–1322. [Google Scholar] [CrossRef]
- Wilburn, D.B.; Swanson, W.J. The “ZP” domain is not one, but likely two independent domain. Mol. Biol. Dev. 2017, 84, 284–285. [Google Scholar] [CrossRef]
- Shirley, R.B.; Davis, A.J.; Compton, M.M.; Berry, W.D. The expression of calbindin in chicks that are divergently selected for low or high incidence of tibial dyschondroplasia. Poult. Sci. 2003, 82, 1965–1973. [Google Scholar] [CrossRef] [PubMed]
- Neter, J.; Wasserman, W.; Kutner, M.H. Applied Linear Statistical Models, 3rd ed.; Richard D. Irwin, Inc.: Boston, MA, USA, 1990. [Google Scholar]
- Nishio, S.; Okumura, H.; Matsuda, T. Egg-coat and zona pellucida proteins of the chicken as a typical species of aves. Curr. Top. Dev. Biol. 2018, 130, 307–329. [Google Scholar] [PubMed]
- Hoffman, J.B.; Benson, A.P.; Christensen, V.L.; Fairchild, B.D.; Davis, A.J. Follicular development and expression of the messenger ribonucleic acid for the inhibin/activing subunits in two genetic lines of turkey hens that differ in total egg production. Poult. Sci. 2007, 86, 944–952. [Google Scholar] [CrossRef] [PubMed]
- Rauscher, S.; Baud, S.; Miao, M.; Keeley, F.; Pomes, R. Proline and glycine control protein self-organization into elastomeric or amyloid fibrils. Structure 2006, 14, 1667–1676. [Google Scholar] [CrossRef] [Green Version]


Publisher’s Note: MDPI stays neutral with regard to jurisdictional claims in published maps and institutional affiliations. |
© 2022 by the authors. Licensee MDPI, Basel, Switzerland. This article is an open access article distributed under the terms and conditions of the Creative Commons Attribution (CC BY) license (https://creativecommons.org/licenses/by/4.0/).
Share and Cite
Benson, A.; Steed, J.; Malloy, M.; Davis, A.J. Quantitative Protein Analysis of ZPB2, ZPB1 and ZPC in the Germinal Disc and a Non-Germinal Disc Region of the Inner Perivitelline Layer in Two Genetic Lines of Turkey Hens That Differ in Fertility. Animals 2022, 12, 1672. https://doi.org/10.3390/ani12131672
Benson A, Steed J, Malloy M, Davis AJ. Quantitative Protein Analysis of ZPB2, ZPB1 and ZPC in the Germinal Disc and a Non-Germinal Disc Region of the Inner Perivitelline Layer in Two Genetic Lines of Turkey Hens That Differ in Fertility. Animals. 2022; 12(13):1672. https://doi.org/10.3390/ani12131672
Chicago/Turabian StyleBenson, Andrew, Josh Steed, Mia Malloy, and Adam J. Davis. 2022. "Quantitative Protein Analysis of ZPB2, ZPB1 and ZPC in the Germinal Disc and a Non-Germinal Disc Region of the Inner Perivitelline Layer in Two Genetic Lines of Turkey Hens That Differ in Fertility" Animals 12, no. 13: 1672. https://doi.org/10.3390/ani12131672