Article

Chicken Protein S Gene Regulates Adipogenesis and Affects Abdominal Fat Deposition

1
Lingnan Guangdong Laboratory of Modern Agriculture & State Key Laboratory for Conservation and Utilization of Subtropical Agro-Bioresources, Department of Animal Genetic Breeding and Reproduction, College of Animal Science, South China Agricultural University, Guangzhou 510642, China
2
Guangdong Provincial Key Laboratory of Agro-Animal Genomics and Molecular Breeding, and Key Laboratory of Chicken Genetics, Breeding and Reproduction, Ministry of Agriculture, Guangzhou 510642, China
*
Author to whom correspondence should be addressed.
Animals 2022, 12(16), 2046; https://doi.org/10.3390/ani12162046
Submission received: 24 April 2022 / Revised: 2 August 2022 / Accepted: 9 August 2022 / Published: 11 August 2022
(This article belongs to the Section Poultry)

Abstract

:

Simple Summary

Low-fat meat is increasingly desired by the public due to the growing popularity of healthy diets, and the excessive accumulation of abdominal fat increases costs in the broiler breeding industry, all of which have encouraged breeding changes in the broiler industry. Investigating fat accumulation at a cellular level from a genetic perspective will help us understand gene-mediated abdominal fat accumulation in chickens. This study aimed to explore the role of the PROS1 gene in adipose cells and its application prospect in broiler breeding. Based on our findings, we found that the PROS1 gene can contribute to adipose cell proliferation and can reduce fat deposits at the cellular level, and its mutations are highly correlated with chicken fat traits.

Abstract

(1) Background: Excessive abdominal fat deposition in broilers not only causes feed waste but also leads to a series of metabolic diseases. It has gradually become a new breeding goal of the broiler industry to improve growth rates and to reduce abdominal fat rates. In a previous study, PROS1 was highly expressed in low-abdominal fat broilers, suggesting a potential role in broilers adipogenesis. However, the function of PROS1 in preadipocytes and its association with abdominal fat traits need to be characterized. (2) Methods: qRT-PCR and Western Blot were used to quantify gene expression at the RNA and protein levels; flow cytometry and EdU were carried out to detect cell proliferation; and a GLM analysis was used to determine the association between PROS1 SNPs and carcass traits. (3) Results: PROS1 was downregulated in high-abdominal fat chicken; PROS1 contributed preadipocyte proliferation but suppressed preadipocyte differentiation; and the SNPs in the PROS1 5′ flank were significantly associated with the abdominal fat weight rate. (4) Conclusions: Chicken PROS1 is able to suppress adipogenesis, and its polymorphisms are associated with the abdominal fat weight rate, which can be considered the molecular markers for chicken breeding, indicating that PROS1 is an effective potential gene in regulating abdominal fat deposition.

1. Introduction

As an important agricultural animal, chicken provides most of the world’s population with major sources of protein such as meat and eggs [1]. In addition to this, chicken is an important model organism that bridges the evolutionary gap between mammals and other vertebrates [2,3]. Modern commercial broilers are products that have been intensively selected for their rapid growth and improved muscle mass for generations [4]. This selection, based on a fast-growing phenotype, has also led to the unsatisfactory problem of excessive abdominal fat deposition in chickens [5,6]. The characteristics of abdominal adipose tissue are also closely associated with the meat quality of chickens [7]. There are many studies on the growth and development of chicken skeletal muscle, but less is known about the genetic mechanisms by which fat-related genes regulate chicken fat deposition. It was reported that transcriptional factor peroxisome proliferator-activated receptor gamma (PPARγ) is a very important regulator in chicken preadipocyte differentiation [8]. Additionally, multiple regulators have been identified to control chicken adipogenesis by regulating the PPARγ signal pathway [9,10]. FNIP2 was able to upregulate the PPARγ signal pathway to promote preadipocyte differentiation and to further intensify lipid biosynthesis [9]. Moreover, lncRNA also plays an important role in the proliferation of adipocytes [11]. Although a few studies have contributed to chicken preadipocyte proliferation and differentiation, further studies on their molecular mechanisms would provide more complete insights into chicken abdominal adipose deposition.
PROS1, also known as Protein S, is a well-known gene that encodes a vitamin K-dependent plasma protein. This protein acts as a cofactor of anticoagulant protease, activated protein C (APC), to inhibit blood coagulation [12]. It is present in plasma in either a free, functionally active form or in an inactive form bound to the C4b-binding protein [13]. Over the last few decades, studies concerning PROS1 have focused mainly on its involvement in human cardiovascular disease, with few reports mentioning the role of PROS1 in obesity. A study about mechanisms of weight maintenance under high- and low-protein, low-glycemic index diets revealed that PROS1 levels were indicative of successful body weight maintenance [14]. However, no molecular mechanism of PROS1 regulating adipogenesis has been elucidated so far, whether human, mouse or chicken models. In our preliminary work, we conducted a transcriptome sequencing (PRJNA656618) of abdominal fat in 100-day-old Sanhuang broilers and found that PROS1 mRNA was highly expressed in low-fat individuals, suggesting that PROS1 may have an antagonistic effect on abdominal fat deposition in chickens.

2. Materials and Methods

2.1. Animal Experiments and Ethics Statement

An F2 resource population (Mahuang chickens, n = 288) with growth traits was used in an association analysis between PROS1 SNPs and growth traits. Additionally, all animal experiments in this research were approved by the Animal Welfare Committee of South China Agricultural University (Approved ID: SCAU#2021F074). All animal experiments were conducted complying with the regulations of the People’s Republic of China on the control of experimental animals.

2.2. Cell Culture

DMEM/F12 medium (Gibco, CA, USA) with 15% fetal serum (Gibco, CA, USA) and 1% streptomycin/penicillin (Invitrogen, CA, USA) was used to cultured immortalized chicken precursor adipocytes (ICP-1) at 37 °C with 5% CO2. When the cells grew to 70% confluence, they were transfected with plasmids or oligonucleotides. Lipofectamine 3000 kit (Invitrogen, CA, USA) was used for transfection according to the manufacturer’s instructions. For preadipocyte differentiation induction, the growth medium with 0.2% oleic acid (Sigma, CA, USA) was used when the cells grew to 90% confluence.
5-ethynyl-2′-deoxyuridine (EdU) assay was used to detect cell proliferation activity by using a Cell-Light EdU Apollo567 In Vitro Kit (RiboBio, Guangzhou, China). After 48 h of transfection, the cell culture medium was added to 20 μM 5-ethynyl-20-deoxyuridine (RiboBio, Guangzhou, China) for 2 h of incubation in a cell incubator. Subsequently, the cells were stained with an Apollo567 staining agent and with a Hoechst staining agent after they were washed. Finally, the random views of the cells were captured using a DMi8 microscope (Leica, Wetzlar, Germany). The rate of EdU-stained cells was counted using ImageJ software (1.53k version).
For cell glucose content measurement, the cells were fixed using ORO Fixative (Solarbio, Beijing, China) for 30 min at room temperature after washing. Then, the cells were embathed using 60% isopropanol (Damao, Tianjin, China). ORO Stain agent (Solarbio, Beijing, China) was used for lipid droplet staining for 20 min at room temperature. Finally, the redundant staining agent was washed by water for five times. The isopropanol was used for oil red elution and to transfer the oil red onto a 96-well plate. The absorbance at 450 nm was measured in a Microplate Reader (BioTek, Winooski, VT, USA).
For glycerol content measurement, the cells were collected by 0.25%-EDTA trypsin (Gibco, Carlsbad, CA, USA). The cells were crushed by ultrasonic waves, and then, they were incubated in 95 °C for 20 min. After incubation, they were centrifuged in 8000× g, 25 °C for 10 min. The supernatant was transferred into a new tube for subsequent glucose content and triglyceride content detection. For glucose content measurement, the Glucose Content Kit (Solarbio, Beijing, China) was used following its manufacturer’s protocol. Finally, the absorbance at 620 nm was measured in a Microplate Reader (BioTek, Winooski, VT, USA).
For glycerol content measurement, the Triglyceride Content Detection Kit (Jiancheng, Nanjing, China) was used by following its manufacturer’s protocol. The absorbance at 510 nm was measured in a Microplate Reader (BioTek, Winooski, VT, USA).
For flow cytometry analysis of cell cycle, ICP-1 was collected by using 0.25%-EDTA trypsin (Gibco, Carlsbad, CA, USA) after a 48 h transfection and then fixed in 70% ethanol (Damao, Tianjin, China) for 16 h at −20 °C. Next, centrifugation was performed at 2000× g, 4 °C for 5 min to collect cells from the cell suspension, and 1 mL of ice-cold PBS (Gibco, Carlsbad, CA, USA) was used to wash the cell sediment and cells were stained with 0.5 mL of Propidium iodide (PI) solution (Beyotime, Shanghai, China) at 37 °C in the dark for 30 min. Finally, the cells were analyzed by a CytoFlex instrument (Beckman, Brea, CA, USA).

2.3. Reverse Transcription Reaction and Quantified Real-Time PCR (qRT-PCR)

The MagZol Reagent (Magen, Guangdong, China) was used to extract total RNA following the manufacturer’s protocol. The total RNA was used to synthesize cDNA by HiScript II Q RT SuperMix for qPCR (+gDNA wiper) (Vazyme, Nanjing, China) according to the manufacturer’s protocol. Quantitative PCR (qPCR) was performed using ChamQ Universal SYBR qPCR Master Mix (Vazyme, Nanjing, China) on ABI QuantStudio 5 instrument (Thermo Fisher, Grand Island, NY, USA). The primers used in qRT-PCR were designed by Primer Premier 6.0 software and synthesized by TSINGKE (Beijing, China). The primers are listed in Table S1.

2.4. Plasmid Construction and siRNA Synthesis

The complete CDS of PROS1 (XM_040658752) was cloned onto the XhoI and XbaI sites in the pcDNA3.1 vector (Promega, Madison, WI, USA). Plasmid extraction was conducted using a HiPure Plasmid EF Mini Kit (Magen, Guangzhou, China) following its manufacturer’s protocol. The specific siRNA (5′-GTAAGAATACCCTGGGAAA-3′) of PROS1 was designed and synthesized by RiboBio (Guangzhou, China).

2.5. Western Blot

The protein was extracted from the cells using an ice-cold radio immunoprecipitation (RIPA) lysis buffer (Beyotime, Shanghai, China) with 1 mM phenylmethyl sulfonyl fluoride (Biosharp, Hefei, China). The protein was separated in a 10% SMART-PAGETM Precast Protein gel (SMART, Changzhou, China) under 120 V for 60 min. The protein was transferred onto a polyvinylidene fluoride (PVDF) membrane (BioRad, Hercules, CA, USA). The quick block liquid was used for blocking for 20 min at room temperature. Then, the membrane was incubated with anti-PPARγ (1:1000; bs-0530R, BIOSS), anti-CEBPα (1:1000; LS-B4685, LABIO), or anti-GAPDH antibodies (1:2000; bsm-33033M, BIOSS) at 4 °C overnight. Subsequently, anti-mouse IgG HRP-secondary antibody (1:10,000; 7076P2, CST) or anti-rabbit IgG HRP-secondary antibody (1:10,000; 7074P2, CST) were used to labeled the antibody from mouse or rabbit species. Chromogenic reaction was conducted using an ECL Peroxidase Color Development Kit (Vazyme, Nanjing, China) according its manufacturer’s protocol. Subsequently, protein bands were developed in a cut-out sensitive film in an X-ray Photography Box (YishengBio, Shanghai, China). The protein brands in film were captured in an Odyssey instrument (Li-cor, Lincoln, NE, USA). The gray level was quantified in ImageJ software.

2.6. Polymorphisms in PROS1 and Their Associations with Growth Traits

The 288 DNA samples were used for PCR, and the PCR products were sent for Sanger sequencing in TSINGKE (Guangzhou, China). SnapGene software (6.0.2 version) was used to identify the SNPs of all individuals. The genotypes were divided according to SNPs; then, the allele frequency was counted; and whether they conformed to the Hardy–Weinberg equilibrium was determined. SNPs in accordance with the Hardy–Weinberg equilibrium were analyzed for their associations with growth traits in SPSS 25.0 software based on the following model:
Y = μ + G + D + H + S + e
where Y represents the traits’ phenotypic values, μ is the population mean, G is the effect of genotype, S is the effect of sex, D is the random effect of the dam, and e is the random residual.

2.7. Data Statistics and Analysis

The results in this study are presented as means ± SEM, and the difference between the groups was analyzed by student’s t-test, with *: p < 0.05. Pearson’s correlation coefficient was used to analyze the correlation among growth traits, and correlation significance was analyzed by a two-tailed test, with the confidence interval at 95% and with *: p < 0.05. The LSD test was used to analyze the significance of associations between traits with SNPs, and p < 0.05 was considered the criterion. The traits’ difference among genotypes was analyzed by One-Way ANOVA; significant differences are shown in superscript letters, with different letters representing significant differences.

3. Results

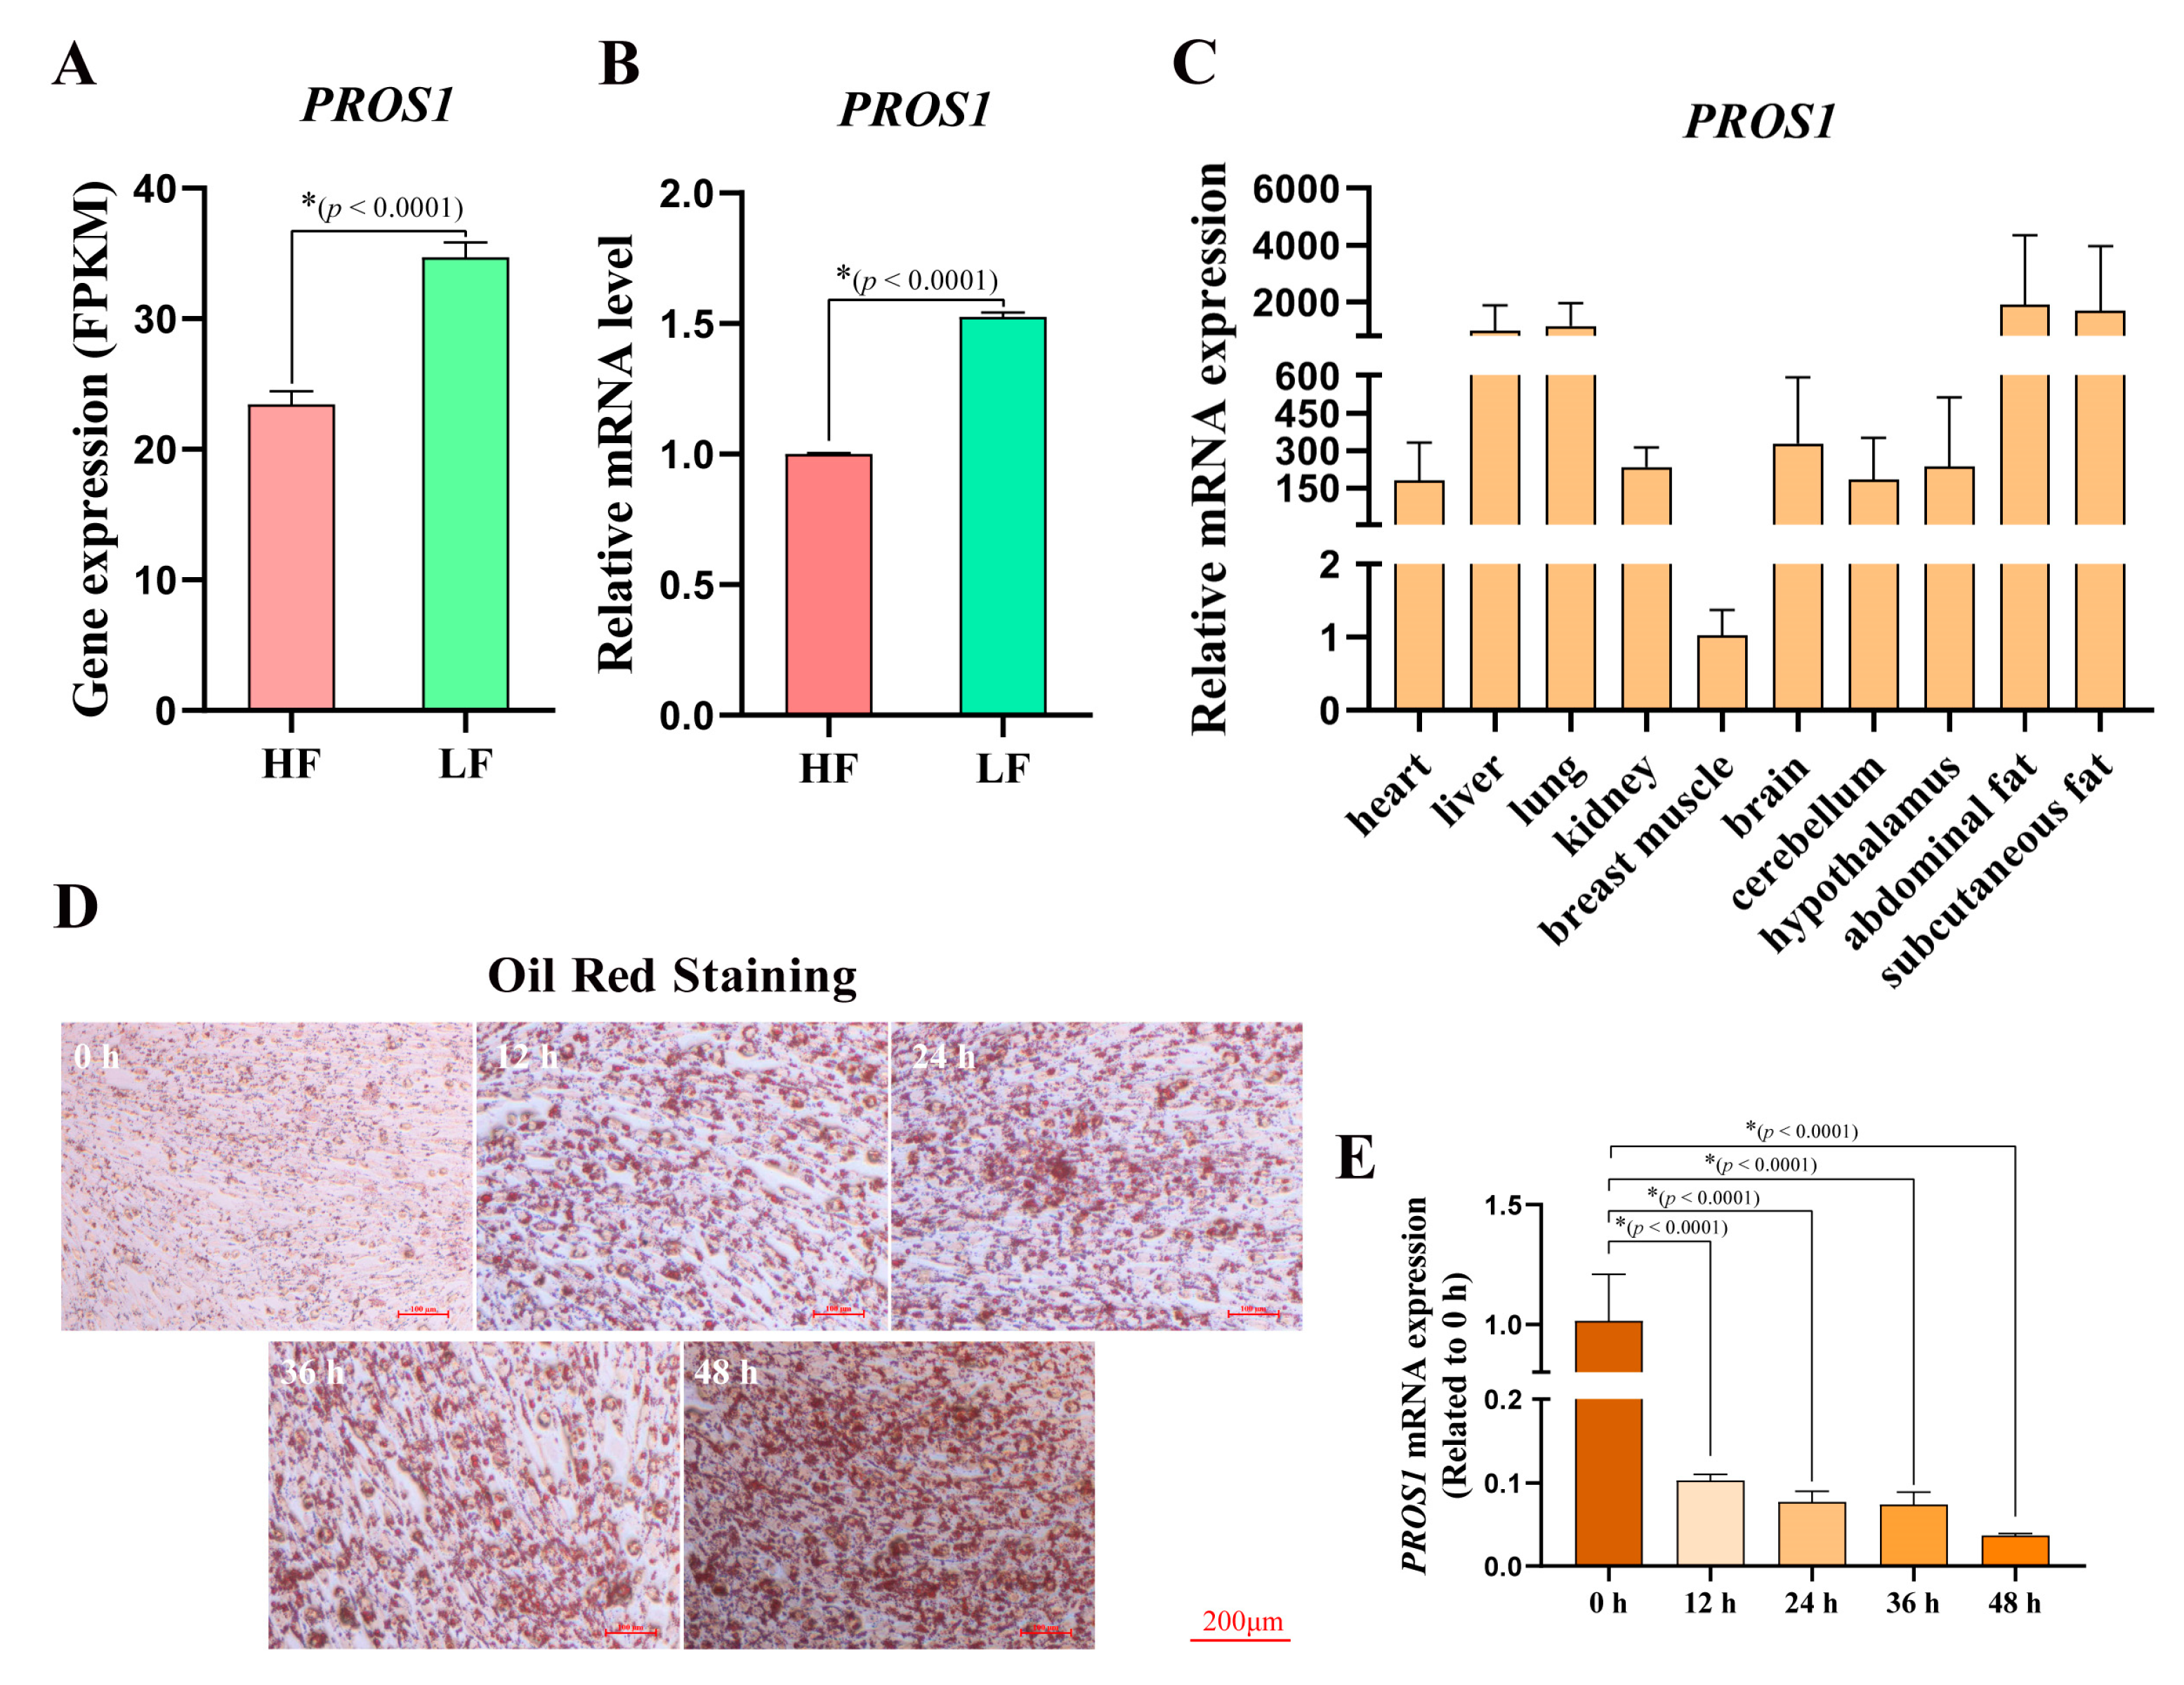
3.1. Aberrant Expression of PROS1 in Broilers with High Abdominal Fat Rate

An accumulation of abdominal fat in chickens is correlated with changes in diet and causes great economic loss to the chicken industry. In our previous study [15], transcriptome sequencing was performed for high and low abdominal fat rates in 100-day-old Sanhuang broilers (accession ID: PRJNA656618), and we found that PROS1 was aberrantly upregulated in the abdominal fat tissues of the low-abdominal fat broilers (Figure 1A). qPCR validation was performed to confirm the difference in mRNA expression of PROS1 in broilers’ abdominal fat between a high abdominal fat ratio and a low abdominal fat ratio (Figure 1B). We constructed a PROS1 expression profile, and it was found that PROS1 was upregulated in fat tissues, including abdominal fat and subcutaneous fat (Figure 1C). The mRNA expression difference suggests that PROS1 may be involved in the fat deposition process in broilers. In addition, we induced the differentiation of ICP-1 cells from preadipocytes to adipocytes. Here, we measured the lipid droplet formation during preadipocyte differentiation using an oil red analysis, and it can be clearly observed that the number of droplets increased during the differentiation process (Figure 1D). The cells were collected for RNA extraction at four time points (12 h, 24 h, 36 h, and 48 h). It is evident that the expression of PROS1 declined substantially during the process of ICP-1 cell differentiation (Figure 1E). This evidence drew our attention to the potential role of PROS1 in the chicken adipogenesis process.

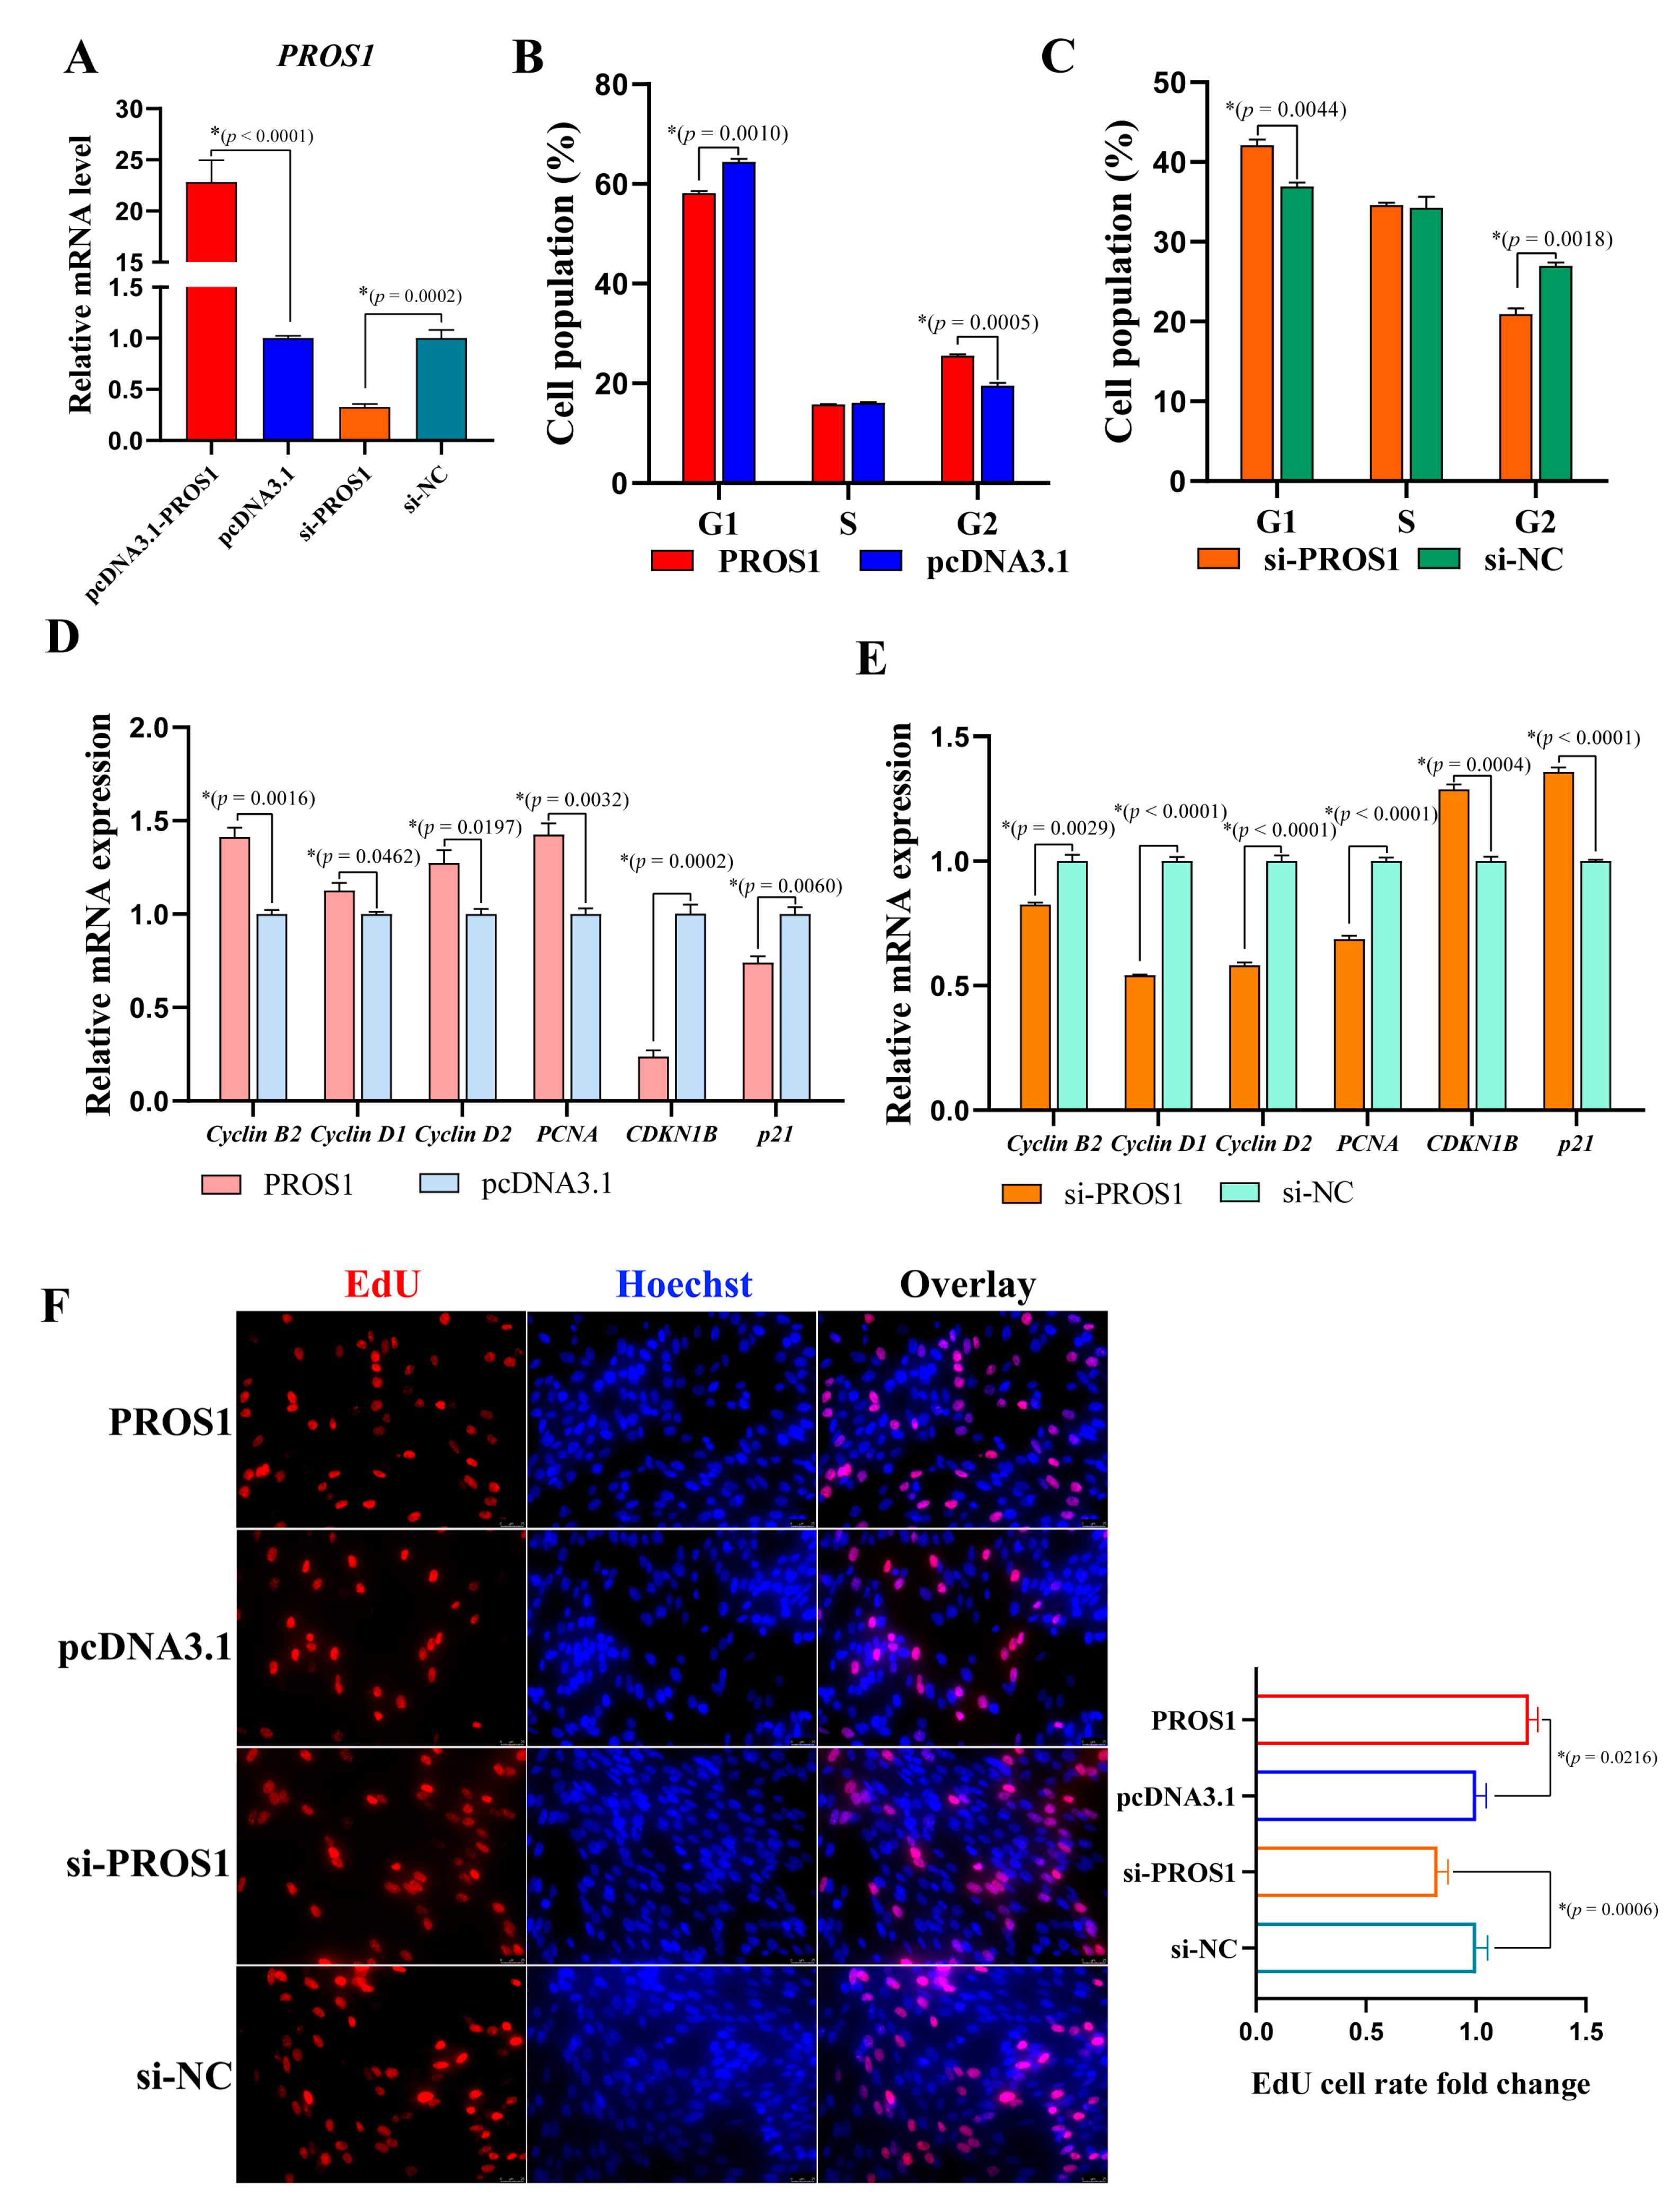
3.2. PROS1 Contributes to Chicken Preadipocyte Proliferation

In order to verify the specific role of PROS1 in preadipocyte, we constructed an overexpression plasmid and synthesized the siRNA to overexpress or knock down PROS1. The transfection efficiency of the pcDNA3.1-PROS1 plasmid and si-PROS1 in ICP-1 cells was validated by qPCR. Additionally, it was shown that the PROS1 mRNA expression could be upregulated more than 50 times and be knocked down by about 70% (Figure 2A). Flow cytometry analysis and EdU assay were conducted to verify whether PROS1 is able to affect preadipocyte proliferation. It was shown that PROS1 could accelerate the cell proportion from G1 phase to G2 phase (Figure 2B,C), suggesting a positive effect of PROS1 in preadipocyte proliferation. We also detected some cell cycle-related gene expression at the mRNA level by qPCR. The mRNA expression of cell cycle-promotion genes (including Cyclin B2, Cyclin D1, Cyclin D2 and PCNA) and cell cycle-inhibition genes (including p21 and CDKN1B) was severely increased or decreased by PROS1 (Figure 2D,E). Moreover, the EdU assay results showed that the EdU cell rate was upregulated by PROS1 (Figure 2F,G), which more intuitively indicates that PROS1 contributes to preadipocyte proliferation.

3.3. PROS1 Suppresses Chicken Preadipocyte Differentiation

Based on the expression difference of PROS1 in preadipocytes before and after differentiation, we speculated that PROS1 may be involved in the regulation of the chicken preadipocyte differentiation process. We performed differentiation induction in preadipocytes treated with PROS1 overexpression or knockdown. After 48 h of the induction treatment, an oil red O assay was performed. As shown in Figure 3A, a high expression of PROS1 inhibited lipid droplet formation, while the knockdown of PROS1 promoted lipid droplet formation. The qPCR results showed that the mRNA expression of preadipocyte differentiation-related genes (including PPARγ, CEBPα, CEBPβ, LPL, and ADIPOR) was downregulated by PROS1, while the low expression of PROS1 increased their mRNA expression (Figure 3B,C). In addition, we performed Western blot to verify whether PROS1 has a regulatory effect on CEBPα and PPARγ protein expression. PROS1 significantly decreased the CEBPα and PPARγ protein levels, which indicates an inhibiting effect of PPARγ pathway activation (Figure 3D). The low expression of PROS1 increased the CEBPα and PPARγ protein levels, suggesting that the low expression of PROS1 contributes to PPARγ pathway activation (Figure 3E). PPARγ pathway activation is involved in glucose metabolism and glycerol metabolism during preadipocyte differentiation. Therefore, we measured the amount of glucose utilization and glycerol production. Glucose consumption increases with the preadipocyte differentiation time. The preadipocytes treated with pcDNA3.1-PROS1 plasmid showed lower glucose consumption (Figure 3F). Moreover, glycerol production increased with differentiation time, and PROS1 overexpression could decrease glycerol production (Figure 3G). Our results indicate that a low expression of PROS1 may affect glucose metabolism and glycerol metabolism by activating a PPARγ signal and by facilitating preadipocyte differentiation.

3.4. Association between SNPs in PROS1 5′ Flanking Region and Chicken Growth Traits

The 5′ flanking region (NC_006088.5: 91130895-91132555) of PROS1, for which the length is 1661 bp, was amplificated to screen for polymorphisms. A total of eight genetic variations were obtained in the PROS1 5′ flanking region from a F2 population of Sanhuang chickens (n = 288). Subsequently, the eight genetic variations were identified in the Ensembl Database (Table 1). The eight genetic variations were all single nucleotide mutations (Figure S2). All genotypes of the alleles were classified according to their mutations. These SNPs’ allele information is listed in Table 1. A chi-square test was used to analysis whether allelic frequency meets the Hardy–Weinberg equilibrium. The allelic frequency of two SNPs (rs736154944 and rs739467563) deviated (p-value < 0.05). We speculated that it was caused by breeding selection.
The carcass traits were measured from the F2 population used in the genotype association analysis, including body weight (BW), dressed weight (DW), full-eviscerated weight (FEW), half-eviscerated weight (HEW), shin length (SL), shin circumference (SC), leg muscle weight (LMW), breast muscle weight (BMW), subcutaneous fat thickness (SFT), intermuscular fat width (IFT), abdominal fat weight (AFW), and abdominal fat weight rate (AFWR). To better understand the correlation among carcass traits, Pearson’s correlation coefficient was calculated. As shown in Table S2, the correlation between BW, DW, FEW, HEW, SL, SC, LMW, and BMW were all significant (p < 0.01), even though the correlation coefficients for SL and SC were lower. The correlation between the traits associated with fat (including SFT, IFW, AFW, and AFWR) were also all significant (p < 0.01). It is worth noting that AFW negatively correlated with BW, DW, FEW, HEW, SL, SC, LMW, and BMW, especially with SL and SC, indicating a potential auxiliary role of SL and SC on AFWR judgment.
Subsequently, an association analysis between the genotypes and carcass traits was performed following the general linear model (GLM) analysis. The SNPs that were significantly associated (p < 0.05) with a trait or that differed between phenotypes are listed in Table 2. As shown in the table, seven SNPs were associated with carcass traits, especially with fat-related traits. Considering a reduction in AFWR in the chicken breeding industry, rs740370863, rs736154944, rs739467563, rs313239277, and rs317295547 were favorable mutations, and rs731399734 and rs317681540 were undesirable mutations. Briefly, the CC genotype in rs740370863; the TT genotype in rs731399734, rs736154944, rs739467563, and rs317681540; and the AA genotype in rs313239277 and rs317295547 showed lower AFWR, indicating a potential benefit of reducing AFWR in chicken breeding.

4. Discussion

Abdominal fat deposition is involved with multiple biological processes, including preadipocyte proliferation and differentiation [16]. In this study, PROS1 was considered the mechanism behind abdominal fat deposition and its specific roles in modulating preadipocyte proliferation and differentiation were characterized. Moreover, the SNPs in the 5′ flanking region showed a significant association with carcass traits.
PROS1 has been widely identified as playing an essential role in the resolution of inflammation together with TAM receptor tyrosine kinases. In fact, the most obvious feature of PROS1 is its TAM receptor-independent anticoagulation [17,18]. In our previous study, PRSO1 was upregulated in abdominal fat tissues from the individuals with low-abdominal fat rates [15], implying its potential role in chicken lipid metabolism. However, no studies on chicken PROS1 have been reported. Here, we report that adipose tissue may be a major expression site for PROS1 in chicken. Resnyk et al. found that the adipogenesis and lipogenesis genes were highly expressed in high-abdominal fat chicken, but the genes involved in the blood-coagulation pathway were highly expressed in low-abdominal fat chicken [19]. In addition, the affection of blood-coagulation protein levels caused by DNA polymorphisms in the blood-coagulation genes of lean chicken may be the main reason for high-expressions of blood-coagulation genes in low-fat chickens [16,20]. As a member involved in the blood-coagulation pathway, PROS1 expression in low-abdominal fat individuals was higher than that in high-abdominal fat individuals, which was in agreement with the viewpoint of Resnyk.
Similarly, PROS1 was reduced during preadipocyte differentiation, which again suggests a potential regulatory role of PROS1 in adipogenesis., Adipocytes are a major source of free fatty acids in mammals, but the liver is the main site for de novo lipogenesis in avian animals [21,22]. However, adipocytes sourced from abdominal fat may contribute more to fatty synthesis in avian than previous perceptions [15,23,24]. T cell proliferation and function could be modulated by PROS1-dependent macrophages [25]. Here, we demonstrated that chicken PROS1 promotes cell cycle progression to promote preadipocyte proliferation in vitro. A high expression of PROS1 may play an essential role in weight maintenance after body weight loss [14], suggesting a negative effect of chicken PROS1 in abdominal fat deposition. Subsequently, we confirmed the inhibition of PROS1 on lipid droplet formation during the differentiation process from preadipocytes to adipocytes. Furthermore, glucose utilization and glycerol production were suppressed in preadipocytes under PROS1 ectopic expression, indicating the substantial inhibition of PROS1 on chicken preadipocyte differentiation. The chicken transcription factors PPARγ and CEBPα are both most important regulatory factors in abdominal fat preadipocyte development [26,27]. PPARγ was upregulated in high-fat chicken compared with low-fat chicken [28], and it was increased during the preadipocyte differentiation process [8]. The downregulation of both PPARγ mRNA and protein levels caused by PROS1 suggests that the inhibition of PROS1 on chicken preadipocyte differentiation may be mediated by the PPARγ signal. In brief, PROS1 could inhibit chicken adipogenesis by downregulating the PPARγ signal.
It was reported that DNA polymorphisms of blood-coagulation genes in leaner chicken could affect their protein levels [16,20]. In this study, we explored the polymorphisms of PROS1 in the 5′ flanking region. Although the SNPs in the gene 5′ flanking region could not cause amino acid sequence changes, synonymous mutations may regulate gene expression by affecting gene transcription by changing the DNA sequence of transcriptional regulatory sites [29,30]. Interestingly, the association between the seven SNPs located in the PROS1 5′ flanking region and abdominal fat traits showed that they may have more important effects on regulating abdominal fat tissue development.

5. Conclusions

In conclusion, the chicken PROS1 gene facilitates preadipocyte proliferation and suppresses preadipocyte differentiation via the PPARγ signal, and the SNPs in the PROS1 5′ flanking region are significantly associated with the chicken abdominal fat weight rate, thereby suggesting a potential role of PROS1 in chicken abdominal fat deposition.

Supplementary Materials

The following supporting information can be downloaded at https://www.mdpi.com/article/10.3390/ani12162046/s1. Figure S1: Original western blot figures for Figure 3D,E; Figure S2: PROS1 5’ flank region DNA polymorphism. The characters on the left represent the genotypes of each SNP. Every SNP site was ringed up by red rectangle; Table S1: Primers’ sequence information; Table S2: Correlation coefficients between carcass traits.

Author Contributions

Conceptualization, L.G. and W.H.; methodology, L.G. and S.Z.; software, L.G., H.X. and Y.H.; validation, L.G., W.H., S.Z. and Y.X.; investigation, R.W., X.F. and H.X.; writing—original draft preparation, L.G.; writing—review and editing, H.X.; supervision, Q.N.; project administration, Q.N. All authors have read and agreed to the published version of the manuscript.

Funding

This research was supported by the Science and Technology Program of Guangzhou, China (202103000084), the Construction Project of Modern Agricultural Science and Technology Innovation Alliance in Guangdong Province (2021KJ128), the Local Innovative and Research Teams Project of Guangdong Province (2019BT02N630), the China Agriculture Research System (CARS-41-G03), and the China Scholarship Council (202108440353).

Institutional Review Board Statement

All animal experiments in this research were approved by the Animal Welfare Committee of South China Agricultural University (approval ID: SCAU# 2021F074). All animal experiments were conducted complying with the regulations of the People’s Republic of China on the control of experimental animals.

Informed Consent Statement

Not applicable.

Data Availability Statement

The data presented in this study are available from the corresponding author upon request.

Acknowledgments

We are grateful to Hui Li from Northeast Agricultural University for provide us the ICP-1 cell.

Conflicts of Interest

The authors declare no conflict of interest.

References

  1. Burt, D.W. The chicken genome. Genome Dyn. 2006, 2, 123–137. [Google Scholar] [CrossRef] [PubMed]
  2. Furlong, R.F. Insights into vertebrate evolution from the chicken genome sequence. Genome Biol. 2005, 6, 207. [Google Scholar] [CrossRef] [PubMed]
  3. Consortium, I.C.G.S. Sequence and comparative analysis of the chicken genome provide unique perspectives on vertebrate evolution. Nature 2004, 432, 695–716. [Google Scholar] [CrossRef]
  4. Wang, G.; Kim, W.K.; Cline, M.A.; Gilbert, E.R. Factors affecting adipose tissue development in chickens: A review. Poult. Sci. 2017, 96, 3687–3699. [Google Scholar] [CrossRef] [PubMed]
  5. Nematbakhsh, S.; Pei, C.P.; Selamat, J.; Nordin, N.; Idris, L.; Razis, A.A. Molecular regulation of lipogenesis, adipogenesis and fat deposition in chicken. Genes 2021, 12, 414. [Google Scholar] [CrossRef] [PubMed]
  6. Suzuki, S.; Kobayashi, M.; Murai, A.; Tsudzuki, M.; Ishikawa, A. Characterization of growth, fat deposition, and lipid Metabolism-Related gene expression in lean and obese Meat-Type chickens. J. Poult. Sci. 2019, 56, 101–111. [Google Scholar] [CrossRef]
  7. Fouad, A.M.; El-Senousey, H.K. Nutritional factors affecting abdominal fat deposition in poultry: A review. Asian-Australas J. Anim. Sci. 2014, 27, 1057–1068. [Google Scholar] [CrossRef]
  8. Zhang, M.; Li, F.; Ma, X.-F.; Li, W.-T.; Jiang, R.-R.; Han, R.-L.; Li, G.-X.; Wang, Y.-B.; Li, Z.-Y.; Tian, Y.-D.; et al. Identification of differentially expressed genes and pathways between intramuscular and abdominal fat-derived preadipocyte differentiation of chickens in vitro. BMC Genom. 2019, 20, 743. [Google Scholar] [CrossRef] [PubMed]
  9. Guo, L.; Chao, X.; Huang, W.; Li, Z.; Luan, K.; Ye, M.; Zhang, S.; Liu, M.; Li, H.; Luo, W.; et al. Whole transcriptome analysis reveals a potential regulatory mechanism of LncRNA-FNIP2/miR-24-3p/FNIP2 axis in chicken adipogenesis. Front. Cell Dev. Biol. 2021, 9, 653798. [Google Scholar] [CrossRef] [PubMed]
  10. Zhang, J.; Cai, B.; Ma, M.; Luo, W.; Zhang, Z.; Zhang, X.; Nie, Q. ALDH1A1 inhibits chicken preadipocytes’ proliferation and differentiation via the PPARgamma pathway in vitro and in vivo. Int. J. Mol. Sci. 2020, 21, 3150. [Google Scholar] [CrossRef]
  11. Chen, Y.; Zhao, S.; Ding, R.; Li, H.; Yang, C.-X.; Du, Z.-Q. Identification of a long noncoding RNA (lncPRDM16) inhibiting preadipocyte proliferation in the chicken. J. Agric. Food Chem. 2022, 70, 1335–1345. [Google Scholar] [CrossRef] [PubMed]
  12. Borgel, D.; Gandrille, S.; Aiach, M. Protein S deficiency. Thromb. Haemost. 1997, 78, 351–356. [Google Scholar] [CrossRef]
  13. Schwarz, H.P.; Muntean, W.; Watzke, H.; Richter, B.; Griffin, J.H. Low total protein S antigen but high protein S activity due to decreased C4b-binding protein in neonates. Blood 1988, 71, 562–565. [Google Scholar] [CrossRef]
  14. Rubio-Aliaga, I.; Marvin-Guy, L.F.; Wang, P.; Wagnière, S.; Mansourian, R.; Fuerholz, A.; Saris, W.H.M.; Astrup, A.; Mariman, E.C.M.; Kussmann, M. Mechanisms of weight maintenance under high- and low-protein, low-glycaemic index diets. Mol. Nutr. Food Res. 2011, 55, 1603–1612. [Google Scholar] [CrossRef]
  15. Chao, X.; Guo, L.; Wang, Q.; Huang, W.; Liu, M.; Luan, K.; Jiang, J.; Lin, S.; Nie, Q.; Luo, W.; et al. MiR-429-3p/LPIN1 Axis Promotes Chicken Abdominal Fat Deposition via PPARgamma Pathway. Front. Cell Dev. Biol. 2020, 8, 595637. [Google Scholar] [CrossRef] [PubMed]
  16. Abdalla, B.A.; Chen, J.; Nie, Q.; Zhang, X. Genomic insights into the multiple factors controlling abdominal fat deposition in a chicken model. Front. Genet. 2018, 9, 262. [Google Scholar] [CrossRef]
  17. Saller, F.; Brisset, A.C.; Tchaikovski, S.N.; Azevedo, M.; Chrast, R.; Fernández, J.A.; Schapira, M.; Hackeng, T.M.; Griffin, J.H.; Angelillo-Scherrer, A. Generation and phenotypic analysis of protein S-deficient mice. Blood 2009, 114, 2307–2314. [Google Scholar] [CrossRef] [PubMed]
  18. Burstyn-Cohen, T.; Heeb, M.J.; Lemke, G. Lack of protein S in mice causes embryonic lethal coagulopathy and vascular dysgenesis. J. Clin. Investig. 2009, 119, 2942–2953. [Google Scholar] [CrossRef]
  19. Resnyk, C.W.; Carré, W.; Wang, X.; Porter, T.E.; Simon, J.; le Bihan-Duval, E.; Duclos, M.J.; Aggrey, S.E.; Cogburn, L.A. Transcriptional analysis of abdominal fat in genetically fat and lean chickens reveals adipokines, lipogenic genes and a link between hemostasis and leanness. BMC Genom. 2013, 14, 557. [Google Scholar] [CrossRef]
  20. De Lange, M.; Snieder, H.; Ariëns, R.A.; Spector, T.D.; Grant, P.J. The genetics of haemostasis: A twin study. Lancet 2001, 357, 101–105. [Google Scholar] [CrossRef]
  21. Han, C.; Wang, J.; Li, L.; Wang, L.; Zhang, Z. The role of LXR alpha in goose primary hepatocyte lipogenesis. Mol. Cell. Biochem. 2009, 322, 37–42. [Google Scholar] [CrossRef] [PubMed]
  22. Leveille, G.A.; Romsos, D.R.; Yeh, Y.-Y.; O’Hea, E.K. Lipid biosynthesis in the chick. A consideration of site of synthesis, influence of diet and possible regulatory mechanisms. Poult. Sci. 1975, 54, 1075–1093. [Google Scholar] [CrossRef] [PubMed]
  23. Chen, J.; Ren, X.; Li, L.; Lu, S.; Chen, T.; Tan, L.; Liu, M.; Luo, Q.; Liang, S.; Nie, Q.; et al. Integrative analyses of mRNA expression profile reveal the involvement of IGF2BP1 in chicken adipogenesis. Int. J. Mol. Sci. 2019, 20, 2923. [Google Scholar] [CrossRef]
  24. Resnyk, C.W.; Chen, C.; Huang, H.; Wu, C.H.; Simon, J.; Le Bihan-Duval, E.; Duclos, M.J.; Cogburn, L. A RNA-Seq analysis of abdominal fat in genetically fat and lean chickens highlights a divergence in expression of genes controlling adiposity, hemostasis, and lipid metabolism. PLoS ONE 2015, 10, e139549. [Google Scholar] [CrossRef] [PubMed]
  25. Maimon, A.; Levi-Yahid, V.; Ben-Meir, K.; Halpern, A.; Talmi, Z.; Priya, S.; Mizraji, G.; Mistriel-Zerbib, S.; Berger, M.; Baniyash, M.; et al. Myeloid cell-derived PROS1 inhibits tumor metastasis by regulating inflammatory and immune responses via IL-10. J. Clin. Investig. 2021, 131, e126089. [Google Scholar] [CrossRef] [PubMed]
  26. Yu, X.; Liu, R.; Zhao, G.; Zheng, M.; Chen, J.; Wen, J. Folate supplementation modifies CCAAT/enhancer-binding protein alpha methylation to mediate differentiation of preadipocytes in chickens. Poult. Sci. 2014, 93, 2596–2603. [Google Scholar] [CrossRef]
  27. Wang, L.; NA, W.; Wang, Y.-X.; Wang, Y.-B.; Wang, N.; Wang, Q.-G.; Li, Y.-M.; Li, H. Characterization of chicken PPARgamma expression and its impact on adipocyte proliferation and differentiation. Yi Chuan 2012, 34, 454–464. [Google Scholar] [CrossRef]
  28. Sun, Y.N.; Gao, Y.; Qiao, S.P.; Wang, S.Z.; Duan, K.; Wang, Y.X.; Li, H.; Wang, N. Epigenetic DNA methylation in the promoters of peroxisome proliferator-activated receptor gamma in chicken lines divergently selected for fatness. J. Anim. Sci. 2014, 92, 48–53. [Google Scholar] [CrossRef]
  29. Chen, S.; Li, K.; Cao, W.; Wang, J.; Zhao, T.; Huan, Q.; Yang, Y.-F.; Wu, S.; Qian, W. Codon-Resolution analysis reveals a direct and Context-Dependent impact of individual synonymous mutations on mRNA level. Mol. Biol. Evol. 2017, 34, 2944–2958. [Google Scholar] [CrossRef]
  30. Hunt, R.; Sauna, Z.E.; Ambudkar, S.V.; Gottesman, M.M.; Kimchi-Sarfaty, C. Silent (synonymous) SNPs: Should we care about them? Methods Mol. Biol. 2009, 578, 23–39. [Google Scholar] [CrossRef]
Figure 1. PROS1 was downregulated in high-fat chicken. (A) The gene expression difference of PROS1 in abdominal fat tissues between high-fat chicken and low-fat chicken shown in our previous RNA-seq. (B) The mRNA expression difference of PROS1 between high-fat chicken and low-fat chicken was detected by qRT-PCR. (C) PROS1 expression profile in different tissues. (D) The oil red O staining of ICP-1 cells treated with differentiation induction at different time points. (E) The PROS1 mRNA expression in ICP-1 cells treated with differentiation induction at different time points. The results are all presented as means ± SEM, * p < 0.05.
Animals 12 02046 g001
Figure 2. PROS1 facilitates chicken preadipocyte proliferation. (A) The overexpression efficiency or knockdown efficiency of pcDNA3.1-PROS1 or si-PROS1. (B,C) The flow cytometry analysis of ICP-1 treated with PROS1 overexpression and knockdown. (D,E) The mRNA levels of cycle-related genes in ICP-1 treated with PROS1 overexpression and knockdown were detected by qTR-PCR. (F) The EdU staining and statistics of ICP-1 treated with PROS1 overexpression and knockdown. The results are all presented as means ± SEM, * p < 0.05.
Animals 12 02046 g002
Figure 3. PROS1 inhibits chicken preadipocyte differentiation. (A) The oil red O staining and statistics of ICP-1 after treating with pcDNA.1-PROS1 plasmid and si-PROS1. (B,C) The mRNA levels of preadipocyte differentiation-related genes in ICP-1 treated with PROS1 overexpression and knockdown were detected by qRT-PCR. (D,E) The protein levels of CEBPα and PPARγ in ICP-1 treated with PROS1 overexpression and knockdown were detected by Western blot. (F) The glucose consumption measure during ICP-1 differentiation. (G) The glycerol production measure during ICP-1 differentiation. The results are all presented as means ± SEM, * p < 0.05. Original western blot figures in Figure S1.
Animals 12 02046 g003
Table 1. The allele information of SNPs in the PROS1 5′ flanking region.
SNPsPosition in GenomeAlleleGenotypes of AllelesAllelic Frequencyp-Value
rs740370863 NC_006088.5: 91131134T→CTT (n = 146) TC (n = 127)CC (n = 15)T = 0.727 C = 0.2730.057
rs731399734NC_006088.5: 91131136T→CTT (n = 50) TC (n = 144)CC (n = 194)T = 0.424 C = 0.5760.685
rs736154944NC_006088.5: 91131140G→TGG (n = 145) GT (n = 128)TT (n = 15)G = 0.726 T = 0.2740.048
rs739467563NC_006088.5: 91131187A→TAA (n = 148) AT (n = 127)TT (n = 13)A = 0.734 T = 0.2660.027
rs317681540NC_006088.5: 91131298T→CTT (n = 13) TC (n = 111)CC (n = 164)T = 0.238 C = 0.7620.284
rs315810115NC_006088.5: 91131319G→AGG (n = 13) GA (n = 111)AA (n = 164)T = 0.238 C = 0.7620.284
rs313239277NC_006088.5: 91131349G→AGG (n = 10) GA (n = 106)AA (n = 172)G = 0.219 A = 0.7810.192
rs317295547NC_006088.5: 91131410G→AGG (n = 144) GA (n = 126)AA (n = 18)G = 0.719 A = 0.2810.163
Table 2. Associations between PROS1 5′ flanking region SNPs and carcass traits.
TraitsGenotypes (Number)p-Value
rs740370863CC (n = 15)TC (n = 127)TT (n = 146)
IFW24.33 ± 10.66 ab24.40 ± 10.10 a28.13 ± 9.73 b0.007
AFW24.83 ± 12.59 a29.79 ± 16.73 a39.31 ± 15.93 b0.000
AFWR1.87 ± 0.91 a2.30 ± 1.22 a3.07 ± 1.215 b0.000
rs731399734CC (n = 94)TC (n = 144)TT (n = 50)
AFW37.31 ± 15.30 a33.67 ± 18.14 ab30.80 ± 15.33 b0.069
AFWR2.93 ± 1.11 a2.61 ± 1.39 ab2.34 ± 1.09 b0.022
rs736154944GG (n = 145)GT (n = 128)TT (n = 15)
IFW28.14 ± 9.66 a24.41 ± 10.18 b24.33 ± 10.66 ab0.007
AFW39.48 ± 15.95 a29.67 ± 16.61 b24.83 ± 12.59 b0.000
AFWR3.08 ± 1.22 a2.29 ± 1.21 b1.87 ± 0.91 b0.000
rs739467563AA (n = 148)AT (n = 127)TT (n = 13)
FEW1246.18 ± 169.95 a1265.13 ± 151.95 ab1346.32 ± 191.57 b0.092
HEW1493.74 ± 196.33 a1509.96 ± 177.35 ab1605.09 ± 227.01 b0.123
SL75.06 ± 5.14 a76.36 ± 5.54 b76.92 ± 4.79 ab0.093
IFW27.81 ± 9.74 a24.53 ± 10.24 b26.02 ± 10.37 ab0.026
AFW38.81 ± 15.74 a30.02 ± 17.18 b26.03 ± 12.98 b0.000
AFWR3.04 ± 1.21 a2.31 ± 1.23 b1.94 ± 0.97 b0.000
rs317681540CC (n = 164)TC (n = 111)TT (n = 13)
FEW1246.18 ± 169.95 a1265.13 ± 151.95 ab1346.32 ± 191.57 b0.092
HEW1493.74 ± 196.33 a1509.96 ± 177.35 ab1605.09 ± 227.01 b0.123
SL75.06 ± 5.14 a76.36 ± 5.54 b76.92 ± 4.79 ab0.093
IFW27.81 ± 9.74 a24.53 ± 10.24 b26.02 ± 10.37 ab0.026
AFW38.81 ± 15.74 a30.02 ± 17.18 b26.03 ± 12.98 b0.000
AFWR3.04 ± 1.21 a2.31 ± 1.23 b1.94 ± 0.97 b0.000
rs313239277AA (n = 176)GA (n = 106)GG (n = 10)
AFWR2.53 ± 1.22 a2.87 ± 1.32 b2.81 ± 1.31 b0.094
rs317295547AA (n = 18)GA (n = 126)GG (n = 144)
IFW25.80 ± 10.45 ab24.15 ± 10.03 a28.21 ± 9.77 b0.004
AFW24.82 ± 11.84 a29.82 ± 16.76 a39.52 ± 15.93 b0.000
AFWR1.90 ± 0.89 a2.30 ± 1.22 a3.08 ± 1.22 b0.000
Note: a significant difference is shown in superscript letters, with different letters representing a significant difference.
Publisher’s Note: MDPI stays neutral with regard to jurisdictional claims in published maps and institutional affiliations.

