2. Materials and Methods
2.1. Ethics Statement
In this experiment, all procedures for animal experiments were approved by the Animal Health Care Committee of Animal Science and Technology College of Jilin Agricultural University (Approval No. GR (J) 18-003).
2.2. Sample Collection
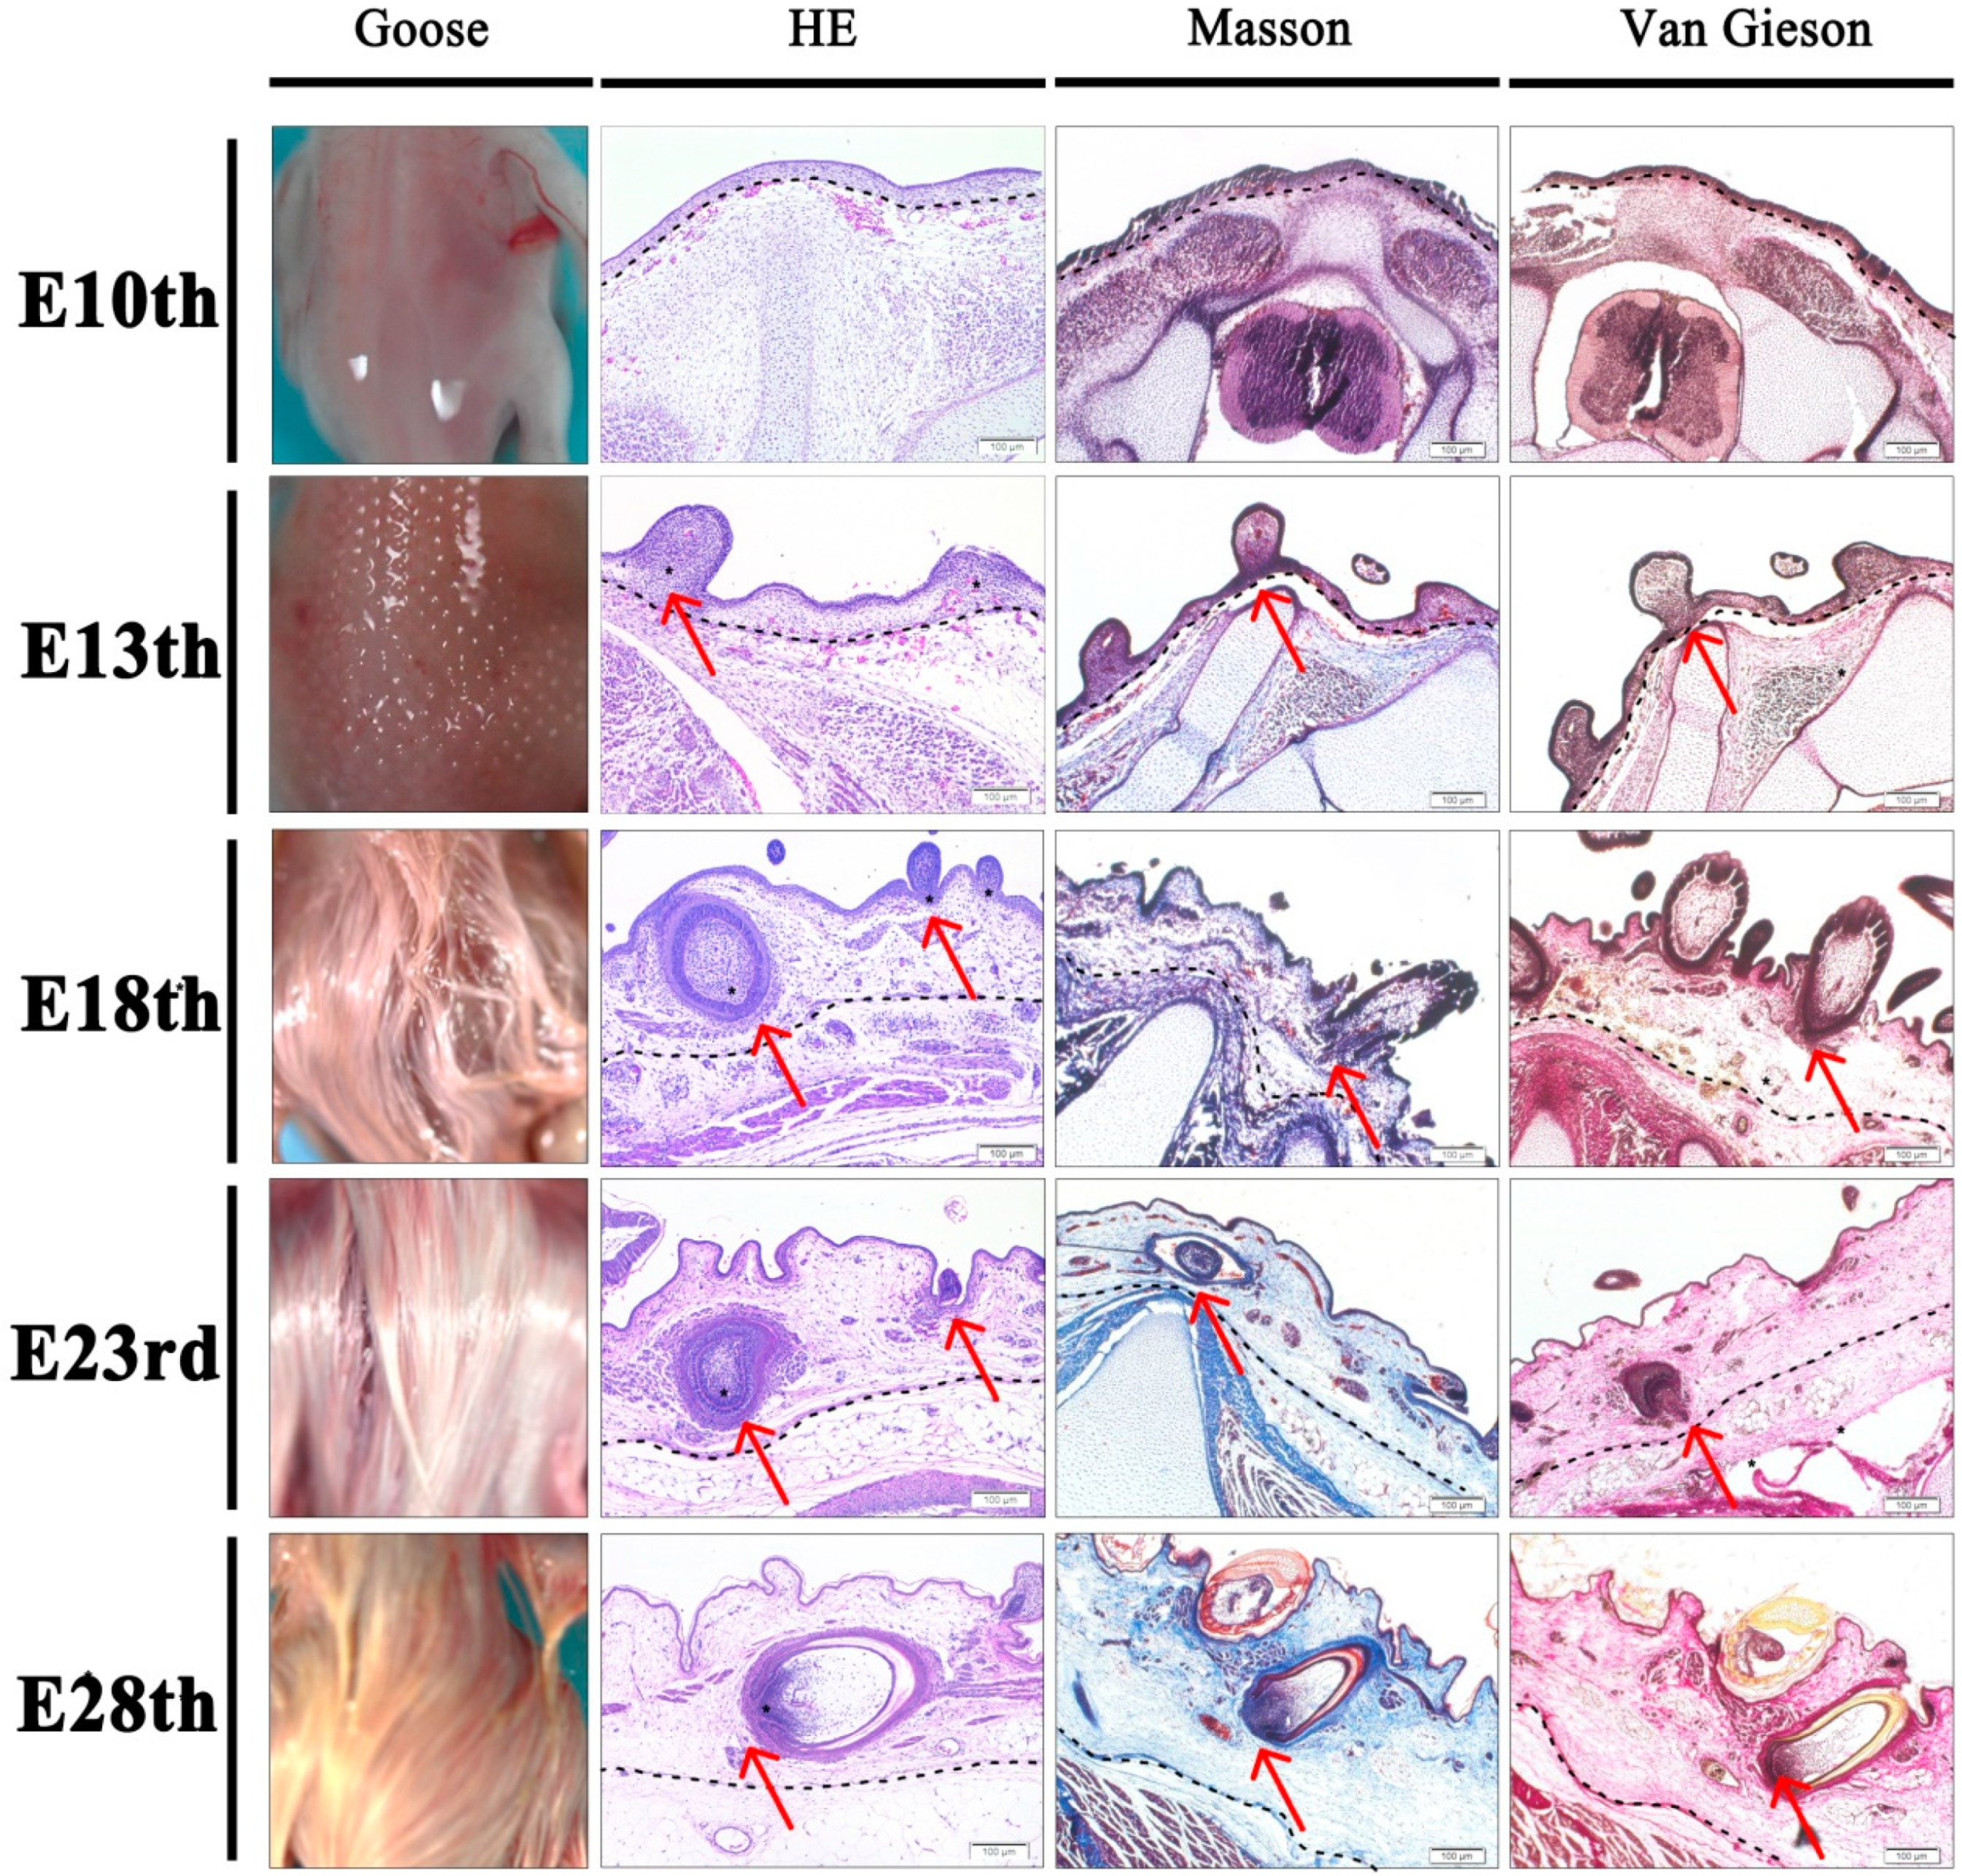
In total, 200 fertilized eggs of Zhedong white geese were hatched in an auto-incubator, and samples were collected on the 10th (E10), 13th (E13), 18th (E18), 23rd (E23), and 28th (E28) days of the embryonic stage, respectively, with 40 eggs collected at each time point, and the geese gender was detected using blood direct amplification PCR. All the samples tested in this study were males. Nine skin samples containing follicles were collected from the dorsum of goose embryos and used to mix samples for RNA-seq and small RNA-seq at each time point, and every three samples were mixed into one. Among them, three samples at each stage were used for RNA extraction and three samples were set with 4% paraformaldehyde (DEPC treatment), dried out, and then embedded after 48 h with a common method for histological staining and in situ hybridization assay.
2.3. Hematoxylin and Eosin Staining
The sections were sequentially placed in xylene for 2 periods of 10 min each for rehydration with different concentrations of ethanol (95%, 90%, 80%, and 70%) for 5 min and then rinsed with distilled water. Thus, the cut slices were stained with Harris hematoxylin solution for 3–8 min, following treatment with 1% hydrochloric acid-ethanol, and then the slides were washed with tap water. The sections were then placed in 1% ammonia to bring them back to blue and rinsed again with water. Subsequently, to remove the excess dye and for onward dehydration, an eosin solution and a graded series of ethanol were used. Thereafter, each slide was sealed with neutral resin after being exposed to xylene for 10 min. Finally, under the Nicon-300 light microscope, the morphological changes in feather follicles were detected (Nicon, Tokyo, Japan).
2.4. Masson Staining
Slides were stained in Weigert’s iron hematoxylin solution for 5–10 min and then rinsed with water, following treatment with 1% hydrochloric acid alcohol differentiation and then washed again with trap water for several minutes. Subsequently, the slides were dyed with Biebrich scarlet acid fuchsin solution for 5–10 min, rinsed with distilled water, incubated in 1% phosphomolybdic acid aqueous solution for 5 min, dyed with aniline blue solution for 5 min, and fixed in 1% glacial acetic acid for 1 min. Consequently, a graded series of ethanol was used to wash out the excess dye and for onward dehydration. Finally, each slide was treated with xylene for 10 min and sealed with neutral resin.
2.5. Van Gieson Staining
Paraffin blocks were deparaffinized and hydrated with distilled water. Subsequently, the sections were stained for 5 min with Weigert’s iron hematoxylin solution and washed with tap water for 5–10 min. After that, the slides were dyed with Van Gieson’s solution for 1–5 min, dehydrated in 95% alcohol rapidly for several seconds, and the dehydration was completed in three changes of absolute alcohol. Thereafter, each slide was sealed with neutral resin after being cleaned with xylene.
2.6. RNA Isolation, Library Creation and Sequencing
Following the manufacturer’s instructions, total RNA was extracted using the TRIzol Reagent kit (Invitrogen Life Technologies, Carlsbad, CA, USA). To remove DNA contamination from RNA samples, DNase I (Ambion, Austin, TX, USA) was used. Using RNase-free agarose gel electrophoresis and the Agilent 2100 Bioanalyzer (Agilent Technologies, Palo Alto, CA, USA), respectively, the quantity and integrity of total RNA were evaluated. Oligo (dT) beads were used to enrich eukaryotic mRNA after total RNA had been extracted, while prokaryotic mRNA was enriched by removing rRNA with the Ribo-ZeroTM Magnetic Kit (Epicentre). Using a fragmentation buffer, the enriched mRNA was fragmented into small fragments and the NEBNext Ultra RNA Library Prep Kit for Illumina (NEB #7530, New England Biolabs, Ipswich, MA, USA) was used to reverse-transcribe it into cDNA. The cDNA fragments were purified using the QiaQuick PCR extraction kit (Qiagen, Hilden, Germany) and then end-repaired, poly (A) was added, and the fragments were ligated to Illumina sequencing adapters after second-strand cDNA synthesis with DNA polymerase I, RNase H, dNTP, and the buffer. The ligation reaction was purified using AMPure XP Beads (1.0×), and the size of the ligation products was determined using polymerase chain reaction (PCR) amplification and agarose gel electrophoresis. The generated cDNA library was sequenced by Gene Denovo Biotechnology Co. (Guangzhou, China) using Illumina Novaseq6000.
2.7. MicroRNA Library Creation and Sequencing
The RNA molecules in the size range of 18–30 nt were enriched by polyacrylamide gel electrophoresis (PAGE) after the total RNA was isolated using the TRIzol Reagent kit (Invitrogen Life Technologies, Carlsbad, CA, USA). Then, the 36–44 nt RNAs were enriched after the 3′ adapters were inserted and the RNAs were also ligated to the 5′ adapters. PCR amplification was used to reverse transcribe the ligation products and the 140–160 bp sized PCR products were then purified to create a cDNA library and sequenced using Illumina HiSeqTM 2500 by Gene Denovo Biotechnology Co. (Guangzhou, China).
2.8. PCA, Quantification, and Analysis of DEGs and Clustering Analysis
The R package gmodels. Available online:
http://www.r-project.org/ (accessed on 11 August 2021) was used to perform principal component analysis (PCA). The StringTie v1.3.1 software was used to compile each sample’s mapped reads into a reference database. For each transcription region, a fragment per kilobase of transcript per million mapped reads (FPKM) value was calculated to quantify its expression abundance and variations using RSEM software. The FPKM approach may directly compare the variation in gene expression between samples by removing the effects of various gene lengths and sequencing data amounts. The DESeq2 software between two separate groups and the edgeR package. Available online:
http://www.r-project.org/ (accessed on 11 August 2021) between two samples were used to identify the DEGs. However, the false discovery rate (FDR) < 0.05 and a |Fold Change| ≥ 2 were assembled to enrich the significant differentially expressed transcripts or genes. After that, the DEGs were used for GO functions and KEGG pathway enrichment analysis. Significantly enriched terms and pathways were those GO terms and KEGG pathways with
p < 0.05. The DEGs were grouped using the Short Time-series Expression Miner software (STEM) to evaluate the expression pattern of all differential genes and then the variables were selected (-pro 20 -ratio 1.0000 [log2 (2) = 1, log2 (1.5) = 0.5849625, log2 (1.2) = 0.2630344]) for trend analysis. Next, GO/KEGG functional enrichment analyses were performed for the genes in each trend, and the
p-value was calculated by hypothesis testing. The
p-value obtained was corrected by FDR, with a
p-value ≤ 0.05 as the minimum, and the GO term and pathway that were significantly enriched in that trend satisfied this condition.
2.9. GO Enrichment Analysis and Pathway Enrichment Analysis
For the identified genes relevant to the development of skin and feather follicles, GO function analysis and KEGG pathway analyses were performed. Gene ontology (GO) enrichment analysis is a systematic approach for annotating gene functions. In the Gene Ontology database. Available online:
http://www.geneontology.org/ (accessed on 7 August 2021), all DEGs were first mapped to GO terms, the numbers of genes for each term were obtained, and the hypergeometric test was used to identify GO terms that were significantly enriched in DEGs as compared to the genome background. The calculated
p-value went through FDR correction, taking FDR ≤ 0.05 as a threshold. GO terms meeting this condition were defined as significantly enriched GO terms in DEGs using the following calculation:
In which N represents the total number of genes with GO annotation, n is the DEGs number in N, M represents the total number of genes annotated to a specific GO term, and m is the DEGs number in M. This approach can identify major biological functions that DEGs perform.
Genes usually interact with each other to play roles in certain biological functions. Pathway-based analysis can be useful to better understand the gene’s biological functions. The main public pathway-related database is the Kyoto Encyclopedia of Genes and Genomes (KEGG). Available online:
http://www.genome.jp/kegg (accessed on 7 August 2021). To further identify the significantly enriched metabolic pathways or signal transduction pathways in DEGs compared with the whole genome background, pathway enrichment analysis should be conducted. Calculations were performed using the same formula that was applied to the GO analysis.
2.10. MicroRNA Target Genes Prediction
MicroRNA targets were predicted using three software, RNAhybrid (Rehmsmeier, Marc and Steffen, Peter and Hoechsmann, Matthias and Giegerich, Robert Fast and effective prediction of microRNA/target duplexes RNA, RNA, 2004. Version 2.1.2) + svm_light (Thorsten Joachims, Developed at University of Dortmund, Informatik, AI-Unit Collaborative Research Center on ‘Complexity Reduction in Multivariate Data’ (SFB475). Version 6.02), Miranda (Version 3.3a), and TargetScan (Version 7.0). The TargetScan website. Available online:
http://www.targetscan.org (accessed on 1 March 2022) provided the microRNA sequences and family information.
2.11. MicroRNA Target Network Construction
The Pearson correlation coefficient (PCC) was used to analyze the expression correlation between miRNA and target. All RNAs were expressed differently in the multi-group, and pairs with PCC < −0.7 and p < 0.05 were chosen negatively as co-expressed miRNA-target pairs.
2.12. RNA Isolation
Tissues were ground in Eppendorf tubes using a hand-held homogenizer, and 1 mL of RNAiso Plus reagent was added to each tube and left to stand at room temperature. The supernatant was taken after centrifugation, and chloroform was added for phase separation following the manufacturer’s instructions. The aqueous phase was taken for isopropanol precipitation, 75% ethanol (DPEC water preparation) was used to wash the precipitate, and finally, the RNA was dissolved with DEPC water.
2.13. Quantitative Real-Time PCR (RT-qPCR) Validation of Sequencing Data
In total, eight DEGs (forkhead box O3, FOXO3; connective tissue growth factor, CTGF; protein parched homolog1, PTCH1; N-Myc down-regulated gene1, NDRG1; fibroblast growth factor binding protein 1, FGFBP1; transcriptional repressor GATA Binding 1, TPRS1; microfibril associated protein 5, MFAP5) and five miRNAs (let-7-y, miR-103-y, miR-107-z, miR-181-y, miR-183-x) related to feather development were selected and validated the accuracy of sequencing data by RT-qPCR. First, the first-strand cDNA synthesis was conducted following the protocol of the reverse transcription kit (Thermo, Waltham, MA, USA), including both genomic DNA removal and reverse transcription reactions. Using the SYBR Green technique (Monad Biotech Co., Ltd., Wuhan, China), the expression of associated genes was found. 18S rRNA and GAPDH were selected as double internal references for the assay, and the quantification of genes was conducted using the 2
−ΔΔCt method. The reverse transcription of miRNA was performed by the stem-loop method (Vazyme, Nanjing, China), and the reverse transcription reaction was completed using specific reverse transcription primers following the protocol. Using both specific and universal primers, the fluorescence quantitative PCR assay was performed with snRNA U6 as the internal control gene. All the used primers are listed in
Table 1.
2.14. Dual-Luciferase Reporter Gene Assay
The design and synthesis of the dual-luciferase reporter gene vectors were carried out by Shanghai Biotech Biotechnology Co. (Shanghai, China). Two vectors, FOXO3-MU and FOXO3-WT, were designed to represent the 3′UTR mutation and wild-type of the FOXO3 gene, respectively. The vectors and the miRNA mimics were co-transfected with HEK 293T cells prepared in advance for transfection into 96-well plates, and four assay groups were obtained by combining NC mimics, miR-144-y, FOXO3-MU, and FOXO3-WT vectors, with three biological replicates in each group. The Promega Dual-Luciferase system was employed to carry out the assay. However, 5× passive lysis buffer (PLB) was diluted to 1× PLB with distilled water, added at 100 μL per well of a 96-well plate and, the cells were dispersed by pipetting with a pipette gun and placed on a shaker for 15 min at room temperature. The cell lysate was aspirated into a 1.5 mL centrifuge tube and centrifuged at 4 °C for 10 min at 12,000 rpm. After 15 min of slow shaking, the supernatant was then collected and placed in a second tube. Then, 100 μL of the Luciferase Assay Reagent II (LAR II) (Luciferase Assay Reagent, Progema) working solution was added to the 96-well plate, 20 μL of cell lysate was added, and the plate was pipetted. The Firefly luciferase value, which is the internal reference value, was measured and recorded after the plate had been mixed 2–3 times. Thereafter, the Renilla luciferase value was measured, which is the reporter gene luminescence value after adding 100 μL of the Stop & Glo® Reagent (Luciferase Assay Reagent, Progema, Madison, WI, USA) and pipetting the plate 2–3 times.
2.15. In Situ Hybridization
Slides (5–10 μm thickness) containing dorsal skin tissue sections embedded in paraffin were baked at 62 °C for 2 h, dewaxed in xylene twice for 15 min each, hydrated in successive grades of alcohol, and then washed with DEPC water. The cut pieces were simmered for 10–15 min in the repair solution and cooled naturally. The slides were blow-dried, then 20 g/mL proteinase K was added, and they were incubated for 20–30 min at 37 °C before being carefully washed with pure water. These slides were additionally cleaned with PBS solution 3 times for 5 min each, and then 3% methanol-H
2O
2 was added dropwise. Subsequently, the sections were placed in PBS (pH 7.4) on a decolorization shaker and incubated at room temperature in the dark for 15 min before being rinsed three times for 5 min each. A prehybridization solution was dropwise added to the slides, and they were then incubated at 37 °C for 1 h. Slices were hybridized overnight at 37 °C at a constant room temperature after the prehybridization solution had been decanted and the probe hybridization solution had been added dropwise. The probe was designed and synthesized by Wuhan Servicebio Technology Co., Ltd. (Wuhan, China). The specific probe sequence was designed by the solid-state phosphite Triester method, which was subjected to a four-step cycle of deprotection, coupling, capping, and oxidation. One nucleotide monomer at a time was attached to the 3′ solid-phase carrier, and the modifications are labeled at the corresponding positions in the process. The synthesized oligonucleotides were chemically cut off from the solid carrier (CPG) and the protective group was removed by ammonia dissociation. After the crude product passed the quality test, the crude product was purified by HPLC, and the target product was prepared by separating impurities with different degrees of separation. The pure product was detected by the LTQ-MS mass spectrometer. The qualified pure product was quantificationally packed with A260 by an enzyme label analyzer, and then the sample was dried to a dry powder by a vacuum dryer (
Table 2). After incubation, the hybridization solution was removed using 2 × SSC, 1 × SSC and 0.5 × SSC at 37 °C for 10 min each time. For 10 min at room temperature, a drop of blocking serum BSA was added and then it was poured off. After that, the slices were added with a drop of anti-DIG-HRP (Jackson, 200-032-156) and incubated at 37 °C for 40 min and washed with PBS for 20 min. Subsequently, the sections were re-stained for 3 min with Harris hematoxylin solution and then were washed with tap water, following the treatment with 1% hydrochloric acid alcohol for a few seconds and the slides were washed again with distilled water. A gradient series of alcohol was then used to wash off the excess dye and for further dehydration after the dye had been turned to blue using ammonia and rinsed with running water. Afterward, each slide had a xylene treatment before being slightly dried and sealed with neutral resin.
2.16. Statistical Analysis
Statistical analyses were conducted using R software (R Core Team (2020). R: A language and environment for statistical computing. R Foundation for Statistical Computing, Vienna, Austria. Version 4.1.3) and Excel software (Microsoft Corporation One Microsoft Way Redmond, WA 98052-7329, USA. Version 2013). GraphPad Prism 8 was used to visualize the data (GraphPad, San Diego, CA, USA). The Pearson correlation between the results of RNA-seq and qPCR was analyzed using data correlation analysis. A two-tailed Student’s t-test was used in the comparison of dual-luciferase reporter gene assay. The significant difference in the results was deemed as p < 0.05. In the figures, the results are presented as mean± Standard Error of the Mean.
4. Discussion
Feathers are an important poultry product with high economic value and serve numerous physiological functions in birds, such as thermoregulation (downy feathers), physical protection, and tactile ability [
21]. During embryogenesis, feather follicle development, and especially the secondary feather follicle, is one of the critical bioprocesses that determine the market value of poultry down feathers [
22]. The Zhedong white goose, which is characterized by high-quality down feather production, makes it a great model for functional genomic studies of poultry. Prior research has shown that between the ages of E12 and E14, goose skin begins to develop short feather buds [
3,
15,
23], but in our study, histomorphological observations of the Zhedong white goose embryonic skin revealed that the formation of short feather buds appeared at E13, proposing that feather bud initiation may be linked to variations in goose breeds or hatching conditions. Additionally, the outcomes of this study demonstrated that feather follicle morphogenesis was finished by E18, which was congruent with earlier findings in chickens at E15 [
24]. Thus, it was hypothesized that feather follicles form earlier in the chick embryo than in the goose, presumably due to the longer embryonic development period in geese (31 d) compared to chickens (21 d). Furthermore, studies have reported that secondary feather follicles develop most fully at 28 days of embryonic age, and at this stage, the dorsal track of embryos is totally covered by feathers [
3,
15,
23], which was clearly observed in our results.
Recently, using high-throughput technologies, several studies have focused on the molecular and regulatory mechanisms involved in skin and feather/hair follicle development [
13,
14,
15,
17,
19,
25,
26,
27,
28,
29]. In the present study, we performed next-generation sequencing (NGS) to discover the intricate molecular processes that underlie the growth of skin and feather follicles in the Zhedong white goose as well as any potential new regulatory factors that might be involved and the transcript profiles were identified at five different development stages (E10, E13, E18, E23, and E28).
The development of the epidermis and different skin appendages, including feather/hair follicles, occurs as a result of the complicated and dynamic process of skin and feather growth [
30]. However, the growth of feather follicles is influenced by changes in a variety of cellular activities in the follicle, which are in turn controlled by several transcription factors, signaling pathways, and epigenetic control. Here, the GO analysis helped to clarify the primary roles of the DEGs, and the KEGG pathway analysis helped to pinpoint the principal pathways in which the DEGs are active. The upregulated DEGs in this profile were abundant in cell parts, cellular processes, catalytic activity, single-organism processes, molecular transducer activity, and binding, and some of them at E10 vs. E13 and E10 vs. E18 were enriched in biological regulation and metabolic processes, which were closely associated with feather follicle development. Similarly, numerous studies have also shown that the results of GO analysis of the DEGs were mostly enriched in those pathways, which are likely related to the development of the skin and feather follicles in
Anser cygnoides and
Anser Anser [
15,
17]. KEGG, as a collective database, is used for a systematic analysis of gene functions [
29]. Cell adhesion molecules (CAMs), the neuroactive ligand–receptor interaction pathway, the ECM–receptor interaction, and the Wnt signaling pathway were the main pathways anticipated in the current study and were in line with the findings in the embryonic skin of chickens and geese [
17,
19,
31]. Most of these signaling pathways are known to control a variety of biological cell functions, including cell proliferation and survival, morphogenesis, the maintenance of structure and function [
32], and skin and hair/feather follicle development in humans [
33], chickens [
6], cashmere goats [
34,
35], and mice [
36]. Along with the typically known signaling pathways in each of the five stages, some additional signaling pathways were enriched according to the developmental stage. These include the cell cycle pathway, the DNA replication pathway (E10 vs. E23 and E10 vs. E28), histidine metabolism, and glycerolipid metabolism (E10 vs. E28), which are widely known to be crucial for the biological process, genetic information processing, lipid metabolism, and cellular processes. DNA replication, one of the most crucial processes in cell division [
37], is also crucial for maintaining the proliferation of several skin cells, including melanocyte proliferation. Furthermore, since the up-regulated DGEs were considerably enriched in DNA replication and cell cycle pathways, it is possible that some of these DEGs are located in the nucleus and participate in cell cycle processes that increase DNA helicase activity in feather follicles and thus promote cell proliferation [
38]. By performing a comprehensive analysis, we were able to confirm that the cell cycle, which includes DNA replication, was a crucial biological process in the development of the skin, particularly at the late stage, suggesting that this pathway may be connected to significant changes in the biological characteristics of the skin during its maturation. The KEGG analysis results showed that ECM–receptor interaction signaling and CAMs pathways were enriched, which was in line with the findings in the chicken and goose embryonic skins [
17,
19,
31]. Several studies demonstrated that hair and feather follicle growth depends on the interaction between CAMs and ECM-receptors and that these pathways play a role in the interaction between the epidermis and dermis [
39]. Further, the ECM–receptor interaction performs an essential function in the morphogenesis of tissues and organs, and their most important features are the upkeep of organ format and functional homeostasis, while additionally regulating several biological processes and gene expression, which include cell adhesion, proliferation, differentiation, migration, cell–cell interactions, and intracellular signaling events, which can also be related to the initiation and the formation of skin parts, which includes hair and feathers [
39]. Research on Cashmere goats revealed that excessive expression of ECM and cell surface proteins was necessary for the fast growth of hair follicles through the anagen phase [
28]. Moreover, we noticed that different sets of signaling pathways, such as histidine metabolism and glycerolipid metabolism and signaling, were enriched. These signaling pathways control lipid and protein synthesis and metabolism, and they have been reported in several studies related to hair and feather follicles [
25,
40]. Similarly, Chen et al. (2017) [
40] demonstrated that besides the signal pathways that are mostly reported, other signal pathways that control lipid synthesis and metabolism, including the phosphatidylinositol signaling system, glycerolipid metabolism, O-glycan biosynthesis, inositol phosphate metabolism, glycerophospholipid metabolism, and biosynthesis of unsaturated fatty acids, occurred during the development of feather follicles in ducks. However, it has been reported that a layer of fat and oil is typically present on the surface of waterfowl feathers, and a specific amount of fat and oil is required to preserve the water-repellent characteristics of these feathers [
25]. On the other hand, histidine was verified to be present in relatively significant concentrations in chicken feathers, as well as in the embryonic epidermis and feathers [
41]. Therefore, we suggest that candidate genes that regulate feather development and quality could be those implicated in signal pathways for lipid and protein synthesis and metabolism.
In addition, the most important secreted genes during feather follicle initiation and development are members of the inhibitors of Wnt signaling, including WIF1 and their receptors, including Frizzled 6 (FZD6), which were also detected as significantly regulated genes in the DEGs dataset. Several studies have argued that many of the DEGs that contribute to the Wnt signal pathway are present in the dorsal tissues of geese from various breeds and at different embryonic days [
15,
16,
17]. The Wnt signaling is known to play a crucial role in regulating follicle formation in the developing avian skin [
42], and is the major pathway that regulates the patterning of skin and controls how adult and embryonic stem cells decide which cell lineages to adopt for the skin and its appendages, in addition to regulating differentiated skin cells activities [
43]. Similarly, a study by Lin et al. (2006) [
5] demonstrated that this pathway controls the growth of the dermis, feather bundles, and buds. Moreover, dermal Wnt signal activation and transmission paternally promote placode formation, and Wnt, with its receptors, is the first signal involved in beginning the feather follicle development program and controlling the cycle of feather follicles [
44]. We noticed that the non-canonical Wnt signaling pathway’s membrane receptor protein, FZD6, was upregulated. Similar results were reported by Gong et al. (2018) [
31] who discovered that the expression of FZD6 increased in chicken embryos during intra-bud morphogenesis. Furthermore, FZD6 is the mediator of the Wnt signaling pathway, and in mouse embryos, its expression in the epidermis is necessary from E11.5 to E12.5. The expression of FZD6 in the epidermis is also required for hair follicle growth [
45]. Surprisingly, WIF1, a gene that inhibits the Wnt signaling pathway, was also expressed, which suggests that WIF1 might play a major part in the Wnt signaling pathway’s antagonism.
In conclusion, the enriched genes associated with cell adhesion, CAMs, the ECM receptor, and Wnt signaling pathways in KEGG and GO analyses suggest that the cells in the goose embryonic back skin are controlled to communicate, proliferate, and differentiate to shape the individual skin compartments from the homogeneous skin layers at the same time, as shown when primary feather follicles were induced in chicken skin or primary wool follicles were induced in sheep skin [
14,
27,
31].
In addition to the signals, genes could be regulated by non-coding RNAs, including miRNAs. MiRNAs are important post-transcriptional factors and transcriptional gene network regulators that play various roles in animal epidermal morphology and hair/feather follicle growth and development and also play a crucial function in the expression of genes in several hair follicle cells lines [
28,
46]. Moreover, miRNAs are crucial for the development of follicles in domesticated animals such as ducks, chickens, goats, and sheep [
20,
30,
47]. Subsequently, miRNA profiling examination of skin and feather follicles of ducks was performed by Zhang et al. (2013) [
48], and they discovered that miRNAs play a key role in the function and evolution of skin. In addition, recent research suggests that controlled miRNA expression is necessary for the normal growth of hair/feather follicles. The regulation of skin and feather follicle growth is significantly influenced by the miRNA/mRNA regulatory relationship. This study examined miRNA–mRNA interaction pairings to identify the major factors involved in feather creation. Based on the integrative regulatory network, a series of DEGs and miRNAs attracted our attention, including CTGF. However, CTGF, also known as CCN2, is a crucial signaling and regulatory molecule that participates in numerous biological processes, including cell growth, angiogenesis, and wound healing [
49]. In our study, the localization of CTGF by in situ hybridization showed that this gene was expressed in the skin epidermis and on the surface of the skin at the early stages of development (E10 and E13). This shows that CTGF is crucial for the development of the epidermis and dermis. Similarly, several studies reported that in the development of the epidermis and dermis in goose embryonic skin as well as the feather bud, CTGF is known to be involved [
14]. Numerous studies have also shown that CTGF functions as a BMP antagonist and promotes TGF signaling during the development of hair placodes [
50]. Moreover, studies in chicks have suggested that CTGF may possibly be involved in the condensation of dermal cells during placode development because it was initially discovered as a chemotactic factor for fibroblasts [
14]. At the skin level, a study conducted by Mou et al. (2006) [
51] on mice reported that Edar is claimed to undergo local autoregulation and signal amplification, activate CTGF, and indirectly up-regulate BMP expression in the dermis. In addition, this indicates that to avoid BMP auto stimulation, which results in an increase in follicle number and density by the end of the primary wave of follicle production, CTGF is the main BMP inhibitor employed by primary hair follicles. Our findings on the location of CTGF and its trend expression encourage these results, in which the growth of goose skin and feather follicles may also be significantly influenced by CTGF.
In our study, we identified PTCH1 as a hub gene that was highly expressed among the developmental stages and was located in skin and feather follicles during embryonic development. The PTCH1 gene is well-known for its regulatory role in embryogenesis, tissue patterning, and cell-fate decisions, acting through the Shh signaling pathway [
52]. This pathway is one of the fundamental signaling pathways that help with hair follicle development and follicular bulge stem cell maintenance, as well as epidermal development, homeostasis, and repair, and PTCH1 is a marker for the SHH pathway [
53]. The hedgehog ligand called Shh binds to the PTCH protein on the surface of cells, and in the absence of SHH, PTCH1 inhibits the activity of a smoothened seven-membrane receptor (SMO). Shh reduces SMO inhibition when it binds to PTCH1, which increases the amount of glioma-associated oncogene homolog (GLI) [
53]. GLI target genes, including PTCH1 and GLIs, are transcribed as a result of GLI transcriptional factors, such as GLI1 and GLI2, being cleaved and transported to the nucleus [
54]. Shh has been discovered to have a role in every stage of feather bud formation, including bud induction, topological shaping, of the feather filament, and feather type determination [
54], and the activation of feather bud development and PTCH1 can control Shh expression. It has also been reported that in the early stages of chicken embryonic development, Shh is expressed, allowing the feather buds of the epidermis to form [
55]. Moreover, Abe et al. (2017) [
56] reported that PTCH1 is expressed in the epithelial and dermal sections of the early hair follicle at the start of the organogenesis phase of mouse hair follicle development, though a rise in PTCH1 expression is seen in the follicular dermal mesenchyme. In addition, Yuan et al. (2020) [
57] showed that among critical module genes involved in skin and feather follicle development in duck embryos, PTCH2, PTCH1, and Shh were identified as hub genes, were significantly expressed at E15, and are enriched in the Hedgehog (HH) signaling pathway. These findings suggest that this gene is highly related to skin and feather follicle formation and is acting through the regulation of the Shh signaling pathway.
In our interaction network, we noted that a high number of small RNAs interact with the transcription factor FOXO3. In large transcriptional networks, Forkhead box, class O (FoxO) transcription factors function as signaling integrators and mediate many crucial biological processes, including DNA repair and embryonic development, and have also been linked to metabolism, cell cycle control, and apoptosis [
58]. According to previous studies, the Forkhead box transcription factor class-O member, FOXO3, is a part of the transcriptional networks in the skin that regulate epidermal development. However, this gene has not been extensively studied in feather follicles, and its function in the development of feather follicles is still unknown. In the current study, the pattern of FOXO3 gene expression and its localization, as well as the growth of skin and feather follicles, were similar. It has been found that FOXO3 is generally expressed in numerous skin cell types, such as epidermal keratinocytes and dermal fibroblasts. In addition, the dermis provides nutrition to the epidermis, and both compartments work together to create skin appendages such as feather/hair follicles and sebaceous glands [
59]. Furthermore, it has been demonstrated that FOXO3 functions as a co-activator of the p53 and Notch signaling pathways, respectively [
60]. Keratinocyte proliferation, differentiation, and maturation must be coordinated by Notch, and Notch signaling in keratinocytes inhibits proliferation and encourages differentiation [
60], and it has been extensively reported that this pathway is deeply implicated in the development of hair and feathers, so we suggest that FOXO3 may also be implicated in the production of skin and feather follicles through the activation of these pathways. Moreover, FOXO3 was detected in several studies in melanocytes, suggesting that it plays another important role in melanin biosynthesis and pigmentation [
61]. In summary, the growth of skin and feather follicles may be increased by FOXO3. However, in situ hybridization assay results confirmed that FOXO3 and miR-144-y have an antagonistic targeting relationship and miR-144-y negatively regulates FOXO3. Therefore, the importance of FOXO3 in the growth of feather follicles cannot be underestimated. Recent research has revealed that several miRNAs regulate and bind to FOXO3, frequently in multiple functions [
62].
The targeting effect between miRNA and its predicted target gene can be demonstrated when the expression of the miRNA is inversely correlated with the expression of the target gene, although this approach has a significant number of false positives. Therefore, we examined the regulatory impact of miR-144-y on the target gene FOXO3 and determined whether it controls FOXO3 expression using the Dual-Luciferase Reporter Gene System. The results showed that miR-144-y directly down-regulated the expression of FOXO3. However, the Dual-Luciferase Reporter assay does not reveal whether miR-144-y inhibits FOXO3 expression at the mRNA level or at the post-transcriptional stage, it only shows that the two are bound to one another. Generally, this offers a theoretical foundation for further investigation into how miR-144-y and FOXO3 control the growth of skin and feather follicles. To precisely understand how this miRNA contributes to the stimulation of goose feather follicles, additional studies are required.


