Article

A Comparative Analysis of Metabolic Profiles of Embryonic Skeletal Muscle from Lantang and Landrace Pigs

1
State Key Laboratory of Livestock and Poultry Breeding & Guangdong Public Laboratory of Animal Breeding and Nutrition & Guangdong Key Laboratory of Animal Breeding and Nutrition, Institute of Animal Science, Guangdong Academy of Agricultural Sciences, Guangzhou 510640, China
2
State Key Laboratory of Biocontrol, School of Life Sciences, Sun Yat-Sen University, Guangzhou 510006, China
*
Authors to whom correspondence should be addressed.
Animals 2022, 12(4), 420; https://doi.org/10.3390/ani12040420
Submission received: 20 December 2021 / Revised: 25 January 2022 / Accepted: 31 January 2022 / Published: 10 February 2022
(This article belongs to the Section Pigs)

Abstract

:

Simple Summary

The pig is one of the most important domesticated meat animals. Some studies have revealed that pigs with low meat production show more intense myogenesis at the early stage of embryonic muscle development than pigs with high meat production. Here, by gas chromatography–mass spectrometry GC–MS based metabolomics, we concluded that the nucleotide metabolism and energy metabolism of the longissimus lumborum (LL) were increased in Lantang pigs compared with Landrace pigs, indicating rapid synthesis of nucleic acids and ATP to meet the material and energy requirements of rapid cell proliferation and differentiation in Lantang pigs.

Abstract

Elucidation of the complex regulation of porcine muscle development is key to increasing pork output and improving pork quality. However, the molecular mechanisms involved in early porcine embryonic muscle development in different pig breeds remain largely unknown. Here, GC–MS based metabolomics and metabolomic profiling was used to examine the longissimus lumborum (LL) of the Lantang (LT) and the Landrace (LR) pig at embryonic day 35 (E35). Metabolites showed clear separation between LT and LR, with 40 metabolites having higher abundances in LT and 14 metabolites having lower abundances in LT compared with LR. In addition, these metabolic changes were mainly associated with nucleotide metabolism and energy metabolism, such as purine metabolism, pyrimidine metabolism, the pentose phosphate pathway, and the TCA cycle. More interestingly, the contents of DNA, RNA, and ATP per unit mass of LL tissues were higher in LT, indicating rapid synthesis of nucleic acids and ATP, to meet both the material and energy requirements of rapid cell proliferation and differentiation. Furthermore, enzyme activity associated with the TCA cycle and pentose phosphate pathway, including α-ketoglutaric dehydrogenase (KGDH), malate dehydrogenase (MDH), pyruvate dehydrogenase (PDH), succinate dehydrogenase (SDH), and glucose-6-phosphate dehydrogenase (G6PDH), were higher in LT. Based on these results, we conclude that there are significant differences in nucleotide metabolism and energy metabolism of LL between LT and LR, and we speculate that the enhanced nucleic acid metabolism and energy metabolism in LT can meet the material and energy requirements of rapid cell proliferation and differentiation, making myogenesis more intense in LT compared to LR which might be the metabolic mechanism underlying the distinct skeletal muscle development in the two breeds.

1. Introduction

The pig is an important domesticated meat animal and it is also a useful model for numerous human muscular diseases, therefore, a more thorough understanding of porcine skeletal muscle development is informative [1,2]. Myogenesis is a highly complex biological process that can be divided into three periods: primary myogenesis from E35 to E64, secondary myogenesis from E54 to E90 [3], and a third generation of fibers around birth [4,5]. Differences in muscle development between pig breeds are associated with their specific qualitative and quantitative traits quality and quantity traits [6,7]. Analysis of global gene expression profiles has identified genes related to porcine meat quality and muscle growth [8,9,10]. It is also known that miRNAs and their muscle-specific targets play a significant role in myogenic differentiation [11,12,13]. In addition, any alteration in intracellular signaling pathways may result in muscular diseases, such as skeletal muscle atrophy and pathological hypertrophy [14,15,16]. Thus, clarification of the complex regulation of porcine muscle development is valuable in the improvement of meat quality and production, and it might also contribute to the prevention and treatment of human muscle diseases.
Lantang (LT) is an indigenous lard-type pig breed grown in southern China, which is characterized by delicious meat, high intramuscular fat content, and early sexual maturity. Landrace (LR) is a commercial meat-type pig breed with high lean meat percentage, fast muscle growth and high body weight [17]. Because of the large differences in muscle development between these two breeds, LT and LR are useful models to study the mechanisms of muscle development between different breeds [18,19,20,21]. In our previous study regarding the contrast in muscle development between LT and LR, the results revealed that primary muscle fibers appear earlier in LT than in LR at E35 and E42, respectively [22]. Recent reports indicated that the process of muscle formation is more intense in Meishan pigs (Chinese indigenous miniature pig) than that in Large White pigs (a European lean breed) at E35 [23]. These studies revealed that pigs with lower levels of meat production showed more intense myogenesis at the early stage of embryonic muscle development than pigs with high meat production, but the mechanisms concerning this phenomenon have not been well elucidated.
Metabolomics has emerged as a powerful tool for exploring metabolic processes, identifying crucial metabolic biomarkers, and revealing metabolic mechanisms during cell growth, development, and senescence [24,25]. Furthermore, metabolic characterization of a well-defined group of patients is beneficial for revealing metabolic signatures to explain muscle weakness in chronic diseases [26]. In addition, some studies have identified metabolites associated with lean mass or body mass index (BMI) [27,28,29]. The association between metabolites and muscle mass in a healthy, elderly Taiwanese population has been explored. The results showed that the higher catabolic rate of amino acids was linked with muscle-mass loss [30]. Studies have revealed that the characteristics of the skeletal muscle metabolome, neuromuscular disease, and daily changes in tissue metabolites during strenuous exercise in humans are associated with daily nutrient levels and aging [31,32]. Metabolic gene signatures associated with different myogenic cell cycle states were also associated with metabolic signatures of mitochondrial function in young and aged mouse muscle satellite cells [33,34]. These studies suggest that metabolic requirements are critically linked to myogenic cell fates and skeletal muscle homeostasis. However, few metabolomics studies have addressed porcine embryonic muscle development.
In the present study, to gain further insight into the mechanism underlying the greater myogenic capacity in LT than in LR at the early embryonic stage, GC–MS based metabolomics was used to analyze metabolic profiles in LL of LT and LR in E35 embryos. Our study aimed to uncover the metabolic mechanisms associated with differences in early embryonic muscle development between LT and LR breeds, which could contribute to the improvement of pork output as well as the treatment and prevention of muscle diseases in humans.

2. Materials and Methods

2.1. Experimental Animals and Tissues

Six purebred LT sows with the same genetic background were inseminated with semen from purebred LT boars, and six purebred LR sows with the same genetic background were artificially inseminated with semen from purebred LR boars. All pigs were allowed ad libitum access to feed and water and were housed under identical conditions. All sows were slaughtered at 35 days after insemination, and all embryos of each sow were collected. There was no visual difference between the embryos or LL tissues of LT and LR at E35. For each sow’s embryo, the LL tissues were dissected. LL tissues from the same sow were cut up and mixed as the experimental samples. These samples were immediately snap-frozen in liquid nitrogen and stored until further use. For GC–MS detection, six biological replicates were used in the LT group and the LR group, each from a sow; for measurement of ATP, NADPH, and enzyme activity, at least three biological replicates were used in the LT group and LR group, each from one sow.

2.2. Metabolite Extraction and Derivatization

For metabolite extraction, we referred to a reported study [35]. In brief, tissue samples were stored at −80 °C and fully ground with a mortar and pestle in liquid nitrogen, and then transferred into 1.5 mL centrifuge tubes. Subsequently, 10 µL of ribitol (0.1 mg per mL) was added into each tube as an internal quantitative standard. From 100 mg samples, metabolites were extracted using 1000 µL cold methanol (100%, Sigma-Aldrich, St. Louis, MO, USA). The mixed samples were vortexed for 1 min, followed by centrifugation for 10 min at 12,000× g. After centrifugation, supernatants were transferred to a new Eppendorf tube and immediately concentrated in a rotary vacuum centrifuge device. For metabolite derivatization, the residue was dissolved in 100 µL methoxyamine pyridine solution (20 mg per mL) and incubated at 37 °C for 120 min in an incubator shaker. Lastly, each mixture sample was treated with 100 µL MSTFA reagent (containing 1% TMCS) and incubated at 37 °C for 30 min. All experiments were repeated using six biological replicates.

2.3. GC–MS Detection

GC–MS detection was performed with a variation on the two-stage technique [36]. By splitless injection, a 1μL derivatized sample was injected into a 30 m × 250 μm × i.d. 0.25 μm PH-5MS column (Agilent Technologies, Santa Clara, CA, USA). Then, analyses were conducted using an Agilent 7890A GC equipped with an Agilent 5975C VL MSD detector (Agilent Technologies, Santa Clara, CA, USA). The gas chromatography (GC) oven was set to an initial temperature of 85 °C for 5 min, then increased 15 °C per min for 5 min to 280 °C, followed by an increase to 310 °C at a rate of 20 °C per min. Helium was selected as the carrier gas, and the flow was maintained at 1 mL per min. MS was conducted in a range of 50–600 m/z.

2.4. Spectra Processing for GC/MS

After mass spectra were acquired, deconvolution and calibration were conducted by AMDIS (Agilent OpenLAB CDS ChemiStation C.01.01). Peaks with a signal-to-noise ratio (S/N) < 30 were excluded to avoid false positives [37]. The retention time was corrected, and compound peaks were aligned using the alkane standards (C11, C12, C13, C14, C15, C16, C17, C18, C19, C20, C22, C24, C26, C28, C30, C32, C34, and C36). Subsequently, artifact peaks were removed by comparing with the blank samples. Metabolites from the GC–MS spectra were identified by retrieval from the NIST 2011 (National Institute of Standards and Technology, Gaithersburg, MD, USA) library according to the National Institute of Standards. Metabolite abundance was calculated by taking the relative peak area value of adonitol as the internal standard [38]. The acquired data array file was used for further multivariate statistical analysis.

2.5. Bioinformatics Analyses

Data transformations and manipulations were performed using Excel, and included two core steps. The first was to convert the abundance of each metabolite from original data of GC–MS detection into an Excel table for subsequent analysis. Second, in the process of data standardization, the data matrix in Excel was calculated, which included the Log transformation, scaling, centraling, and other transformation involved in PCA and OPLS-DA analysis. Differential metabolites were obtained by comparing the two groups using the Mann–Whitney U test (α = 0.05) with SPSS 23.0 (IBM, Chicago, Illinois, USA). Z-value based on the LR was calculated to identify the differential abundance of metabolites of LT compared to LR. The Z-score plot spanned from −10.94 to 24,536.17 in LT. On the Metabo Analyst online website [39,40,41], principal component analysis (PCA) and orthogonal partial least squares-discriminant analysis (OPLS-DA) of the metabolomic data was performed. For Z-score analysis, each metabolite was scaled according to a reference distribution, and a calculation was conducted with the mean and standard deviation of reference sets as a control. Using the distance matrix, a hierarchical cluster analysis (HCA) was performed. Then, the relationships among the samples were tested by PCA and OPLS-DA analyses. Comparative metabolic pathway analysis between LT and LR groups was performed using the Metabo Analyst online website (www.metaboanalyst.ca/) (accessed on 20 February 2021). A hypergeometric test was used to calculate the −log(p) value for reflecting the impact of each metabolic pathway, and pathways with p < 0.05 were retained. Finally, data were represented by histogram and scatter plots using Prism v5.01 (GraphPad, La Jolla, CA, USA). Comparative metabolic pathway analysis between LT and LR was performed using iPath2.0 [42].

2.6. Measurement of Activity of α-Ketoglutaric Dehydrogenase (KGDH), Pyruvate Dehydrogenase (PDH), Malate Dehydrogenase (MDH), and Succinate Dehydrogenase (SDH)

The samples were fully ground in liquid nitrogen, and a 100 mg sample homogenized with 1 mL PBS (pH 7.4) was broken down by sonication (at a 200 W power) for 10 min on ice. The samples were then centrifuged at 12,000 rpm for 10 min to remove insoluble material. The protein concentration of the supernatants was measured by BCA kit (Beyotime Biotechnology, Shanghai, China), then an equivalent amount of proteins in the supernatants was vacuum freeze dried. The vacuum freeze dried powder containing 100 μg proteins were redissolved and transferred to a ketoglutarate dehydrogenase (KGDH) reaction mix (1 mM MgCl2, 0.5 mM MTT, 6.5 mM PMS, 50 mM alpha-ketoglutaric acid potassium salt, 0.2 mM TPP, and 50 mM PBS), pyruvate dehydrogenase (PDH) reaction mix (1 mM MgCl2, 0.5 mM MTT, 6.5 mM PMS, 2 mM sodium pyruvate, 0.2 mM TPP, and 50 mM PBS), succinate dehydrogenase (SDH) reaction mix (0.5 mM MTT, 5 mM sodium succinate, 13 mM PMS, and 50 mM PBS), and malate dehydrogenase (MDH) reaction mix (0.5 mM MTT, 5 mM sodium malate, 13 mM PMS, and 50 mM PBS) to a final volume of 200 µL in a 96-well plate. After incubation at 37 °C for 60 min, each plate was measured at 566 nm for absorbance.

2.7. ATP Measurement

ATP content was quantified using an ATP Assay Kit (Beyotime, Shanghai, China). In brief, samples were lysed followed by sonication (750 W, operating at 40% power, 3 cycles of 5 s on and 5 s off), then centrifuged at 12,000× g for 10 min. The supernatants were used to measure the ATP level according to the manufacturer’s instructions. The produced luminescence was analyzed (Mithras, Mikrowin 2000 software, Berthold Technologies, Thoiry, France). Finally, the luminescence value was plugged into the standard curve to determine the ATP content.

2.8. Measurement of Nicotinamide Adenine Nucleotide Phosphate (NADPH)

NADPH levels were determined using a NADP+/NADPH Detection Kit (Beyotime, Shanghai, China). Tissue samples of 10 to 30 mg were homogenized on ice with 400 μL NADP+/NADPH-extracting solution, then centrifuged at 12,000× g for 10 min at 4 °C and 50 μL supernatants were used to measure NADPH. After being heated in a water bath at 60 °C for 30 min, each supernatant sample was added into 100 μL G6PDH working liquid in a 96-well plate and incubated at 37 °C for 10 min. Following this, color reaction was performed for 30 min. Finally, each plate was measured at 450 nm for the absorbance.

2.9. Measurement of Activity of Glucose-6-Phosphate Dehydrogenase (G6PDH)

G6PDH activity was detected using a G6PDH activity assay kit (Beyotime, Shanghai, China) according to the manufacturer’s instructions. The reduction of NADP was measured spectrophotometrically at 450 nm.

2.10. Statistical Analysis

Measurement of ATP, NADPH, and enzyme activity was repeated at least three times independently, and representative results are shown. SPSS 23.0 (IBM, Chicago, IL, USA) and Prism v5.01 (GraphPad, La Jolla, CA, USA) were utilized for statistical analyses. Differences between groups were assessed for significance with the t-test, and the results are presented as mean ± SEM. Asterisks (*) indicate levels of statistical significance. * p < 0.05; ** p < 0.01; *** p < 0.001.

3. Results

3.1. Metabolomic Profiling of LL in LT and LR at E35

To characterize the metabolic profiling of skeletal muscle in early embryos of local Chinese pigs and foreign lean pigs, we applied an untargeted metabolomic analysis to determine the metabolites in the LDM of LT and LR at E35. Representative total ion current chromatograms from the LT and LR samples are listed in Figure 1A. After removing internal standard ribitol and any known false positive peaks, the same compound was integrated, and the correlation coefficients of the two technique repeats indicated the accuracy of the results (Figure 1B). Using hierarchical cluster analysis, LT and LR were completely separated (Figure 1C). Metabolite profiles of the LT and LR were displayed as a heat map and 129 metabolites with reliable signals were detected in each sample (Figure 1D). Obviously, there were significant differences in the metabolite expression levels between the LT group and the LR group. For example, the levels of glutamine, laminaribiose, and gluconic acid-6-phosphate were higher in the LT group, while the levels of urea, adenosine, and mannitol were higher in the LR group (Figure 1D).

3.2. Differential Metabolomes Responsible for LT and LR LL

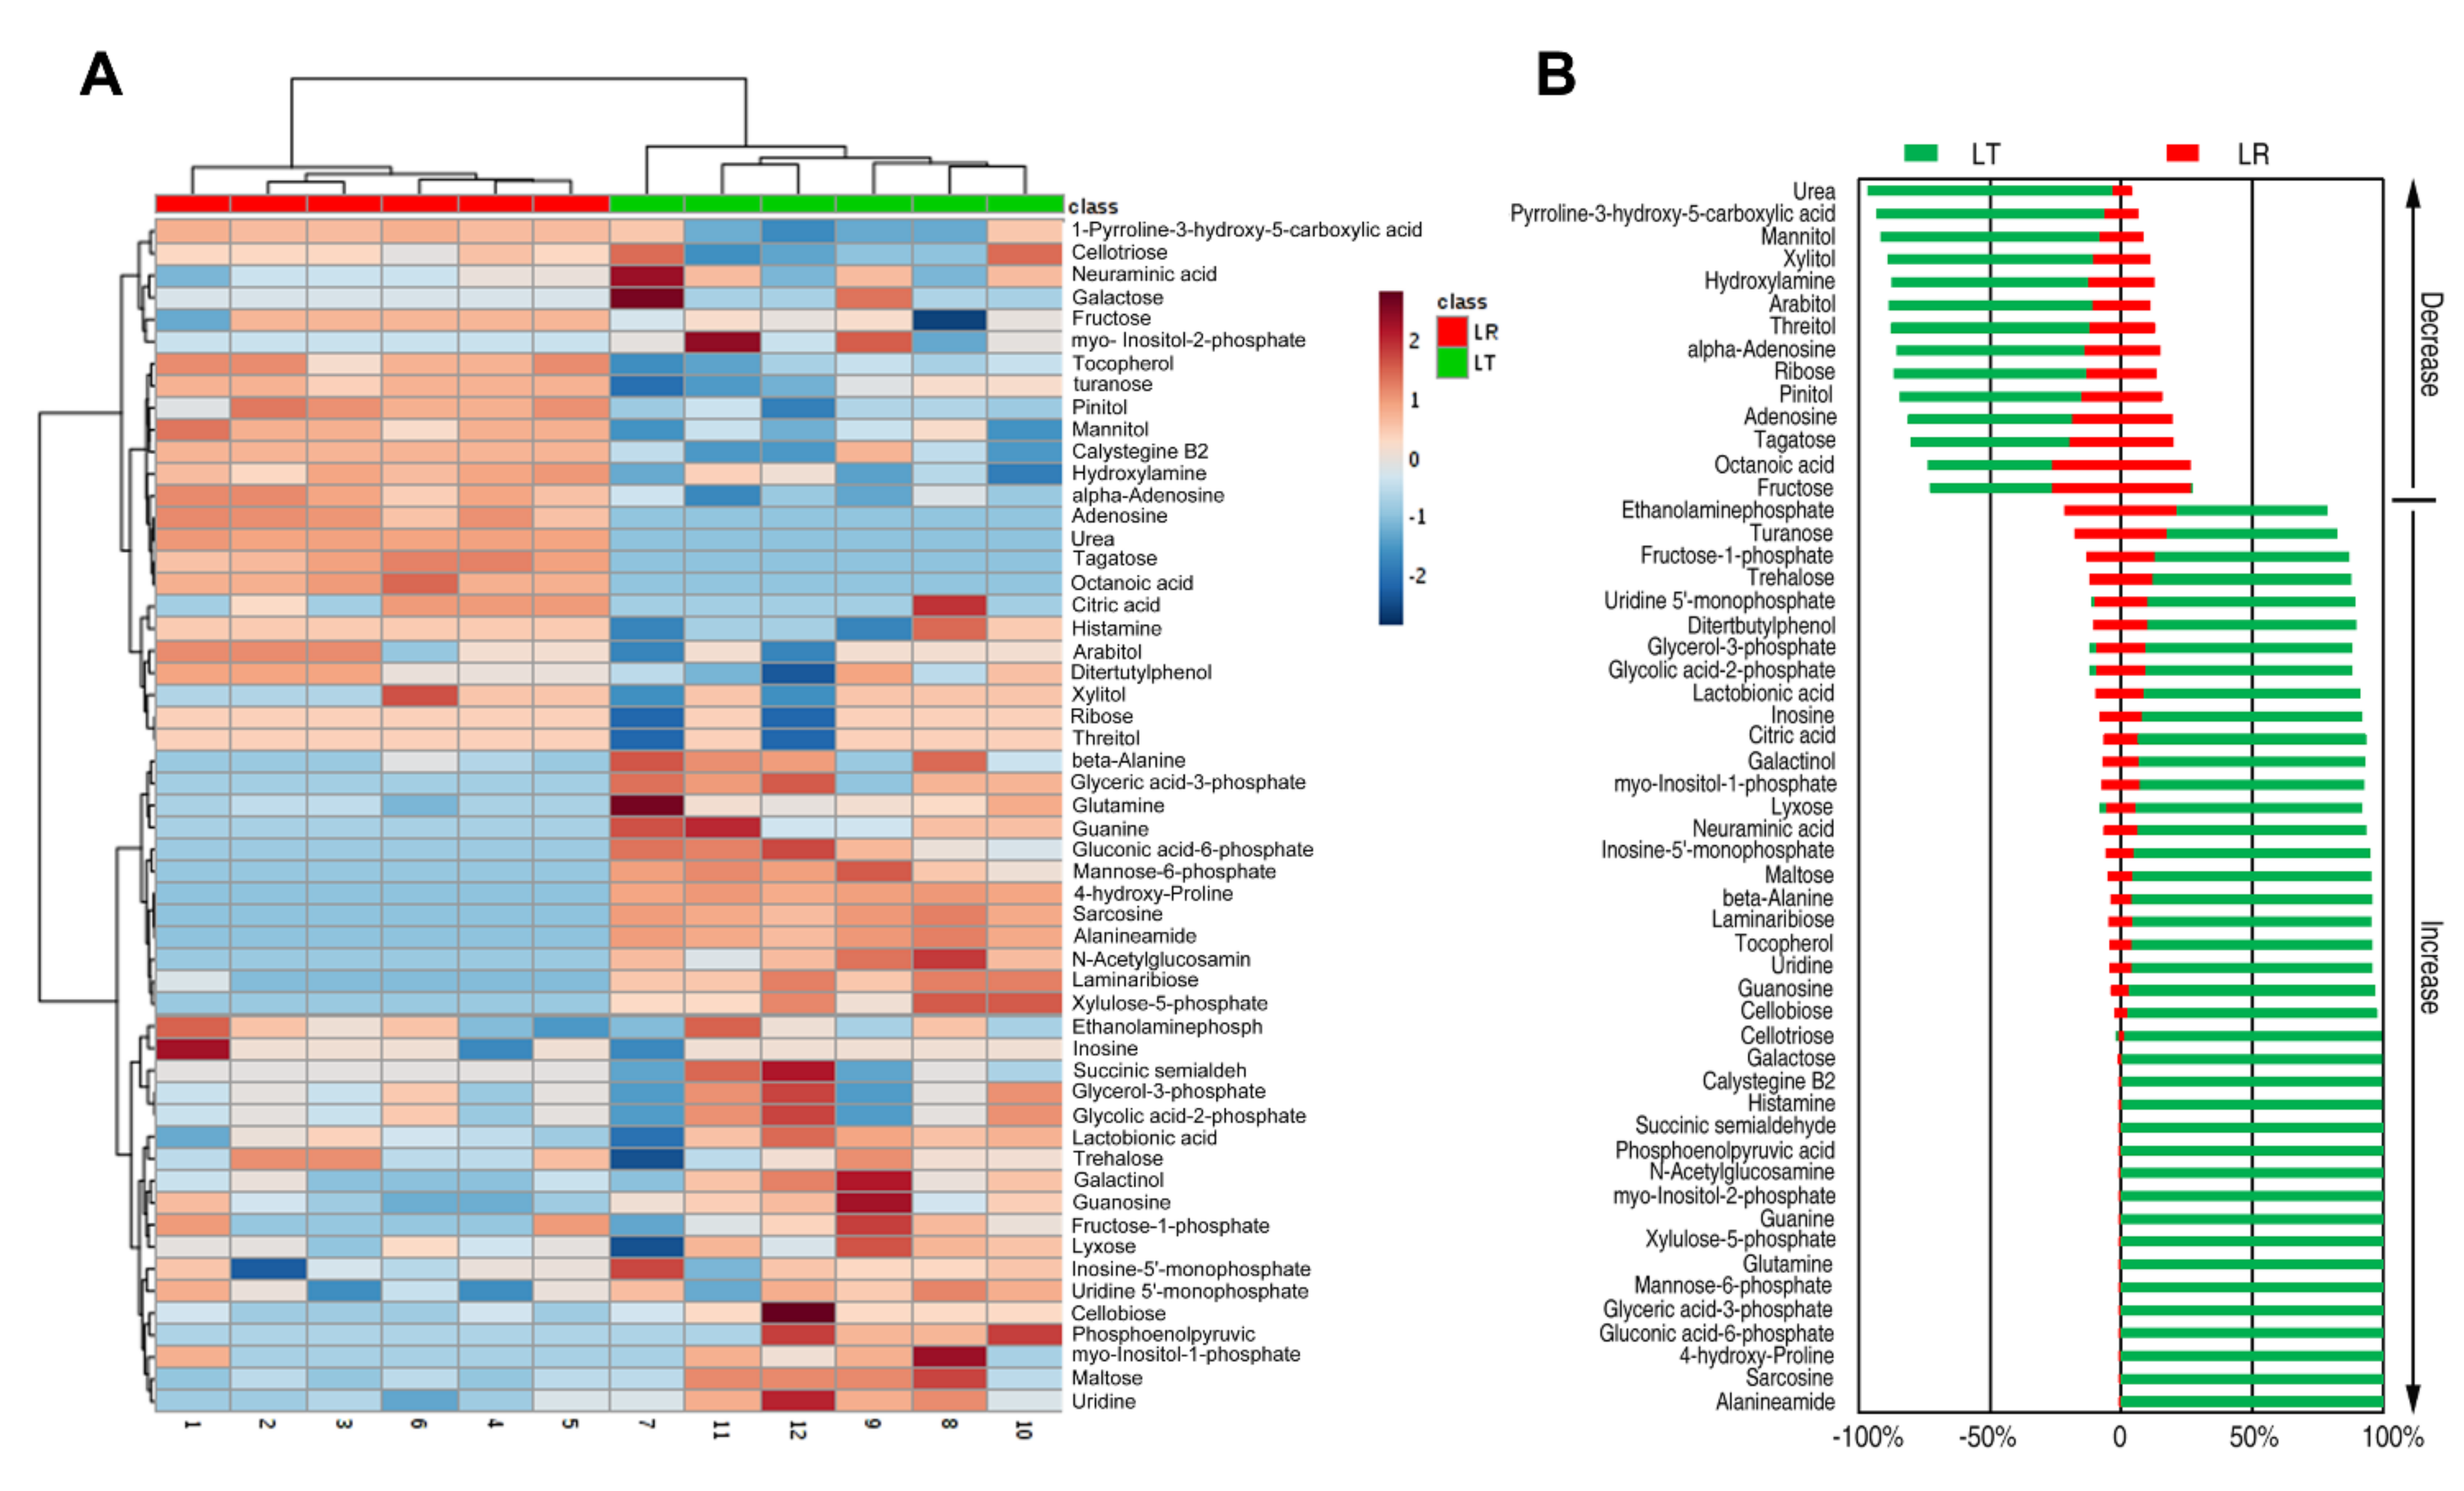
Using the Mann–Whitney U test, we found 54 differential metabolites (p < 0.05). The identified metabolites are shown in Figure 2A as a heat map. Out of the differential metabolites, 40 increased and 14 decreased for LT, and LR was the opposite (Figure 2B). These results suggested that the metabolic differences between LT and LR might be one of the reasons for the differences in embryonic skeletal muscle development between the two breeds.

3.3. Differentially Enriched Pathways Responsible for LT and LR LL

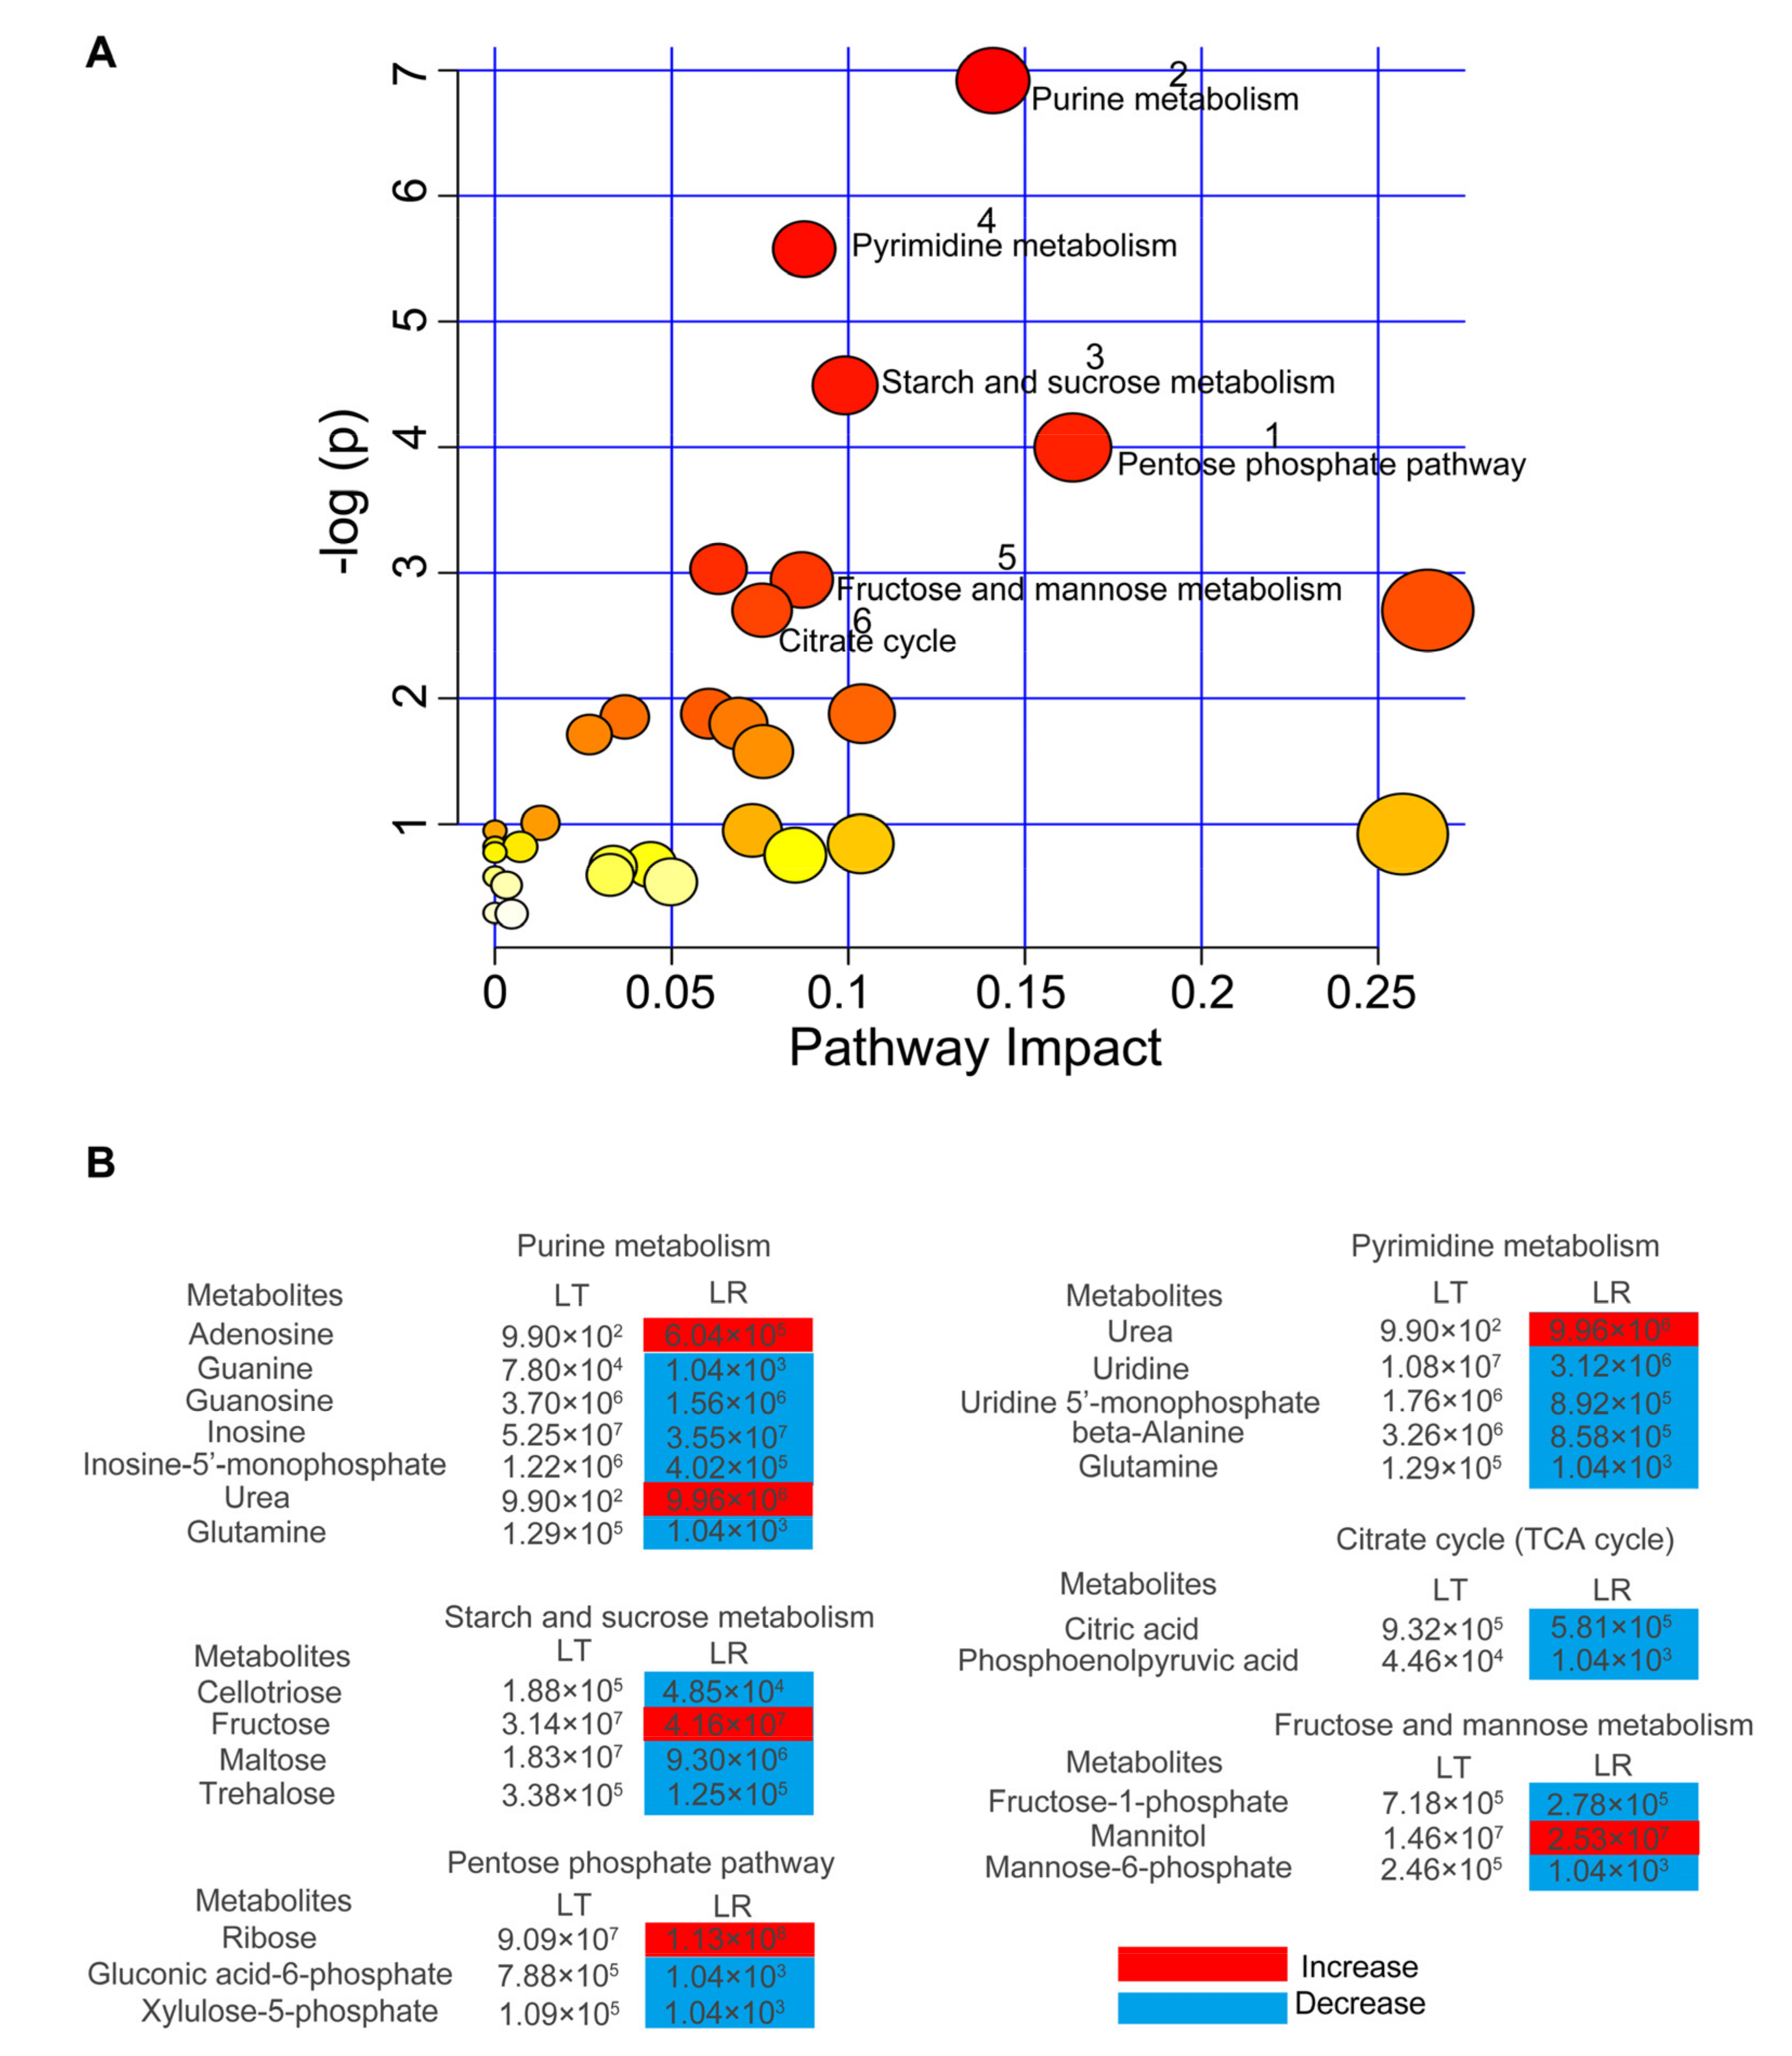
To further understand metabolome alterations, we investigated which pathways were enriched in the differential metabolites between the LT and LR groups. Using a bubble map, this investigation showed that six main pathways were enriched, including the pentose phosphate pathway, purine metabolism, starch and sucrose metabolism, pyrimidine metabolism, fructose and mannose metabolism, and the citrate cycle (TCA cycle) (Figure 3A). Importantly, differential changes of metabolites in these pathways were found. These six pathways included 22 important metabolites, among which the abundance of five metabolites (adenosine, urea, fructose, ribose, and mannitol) were increased in LR and the remaining 17 metabolites were increased in LT (Figure 3B).

3.4. Crucial Metabolites Responsible for LT and LR at E35

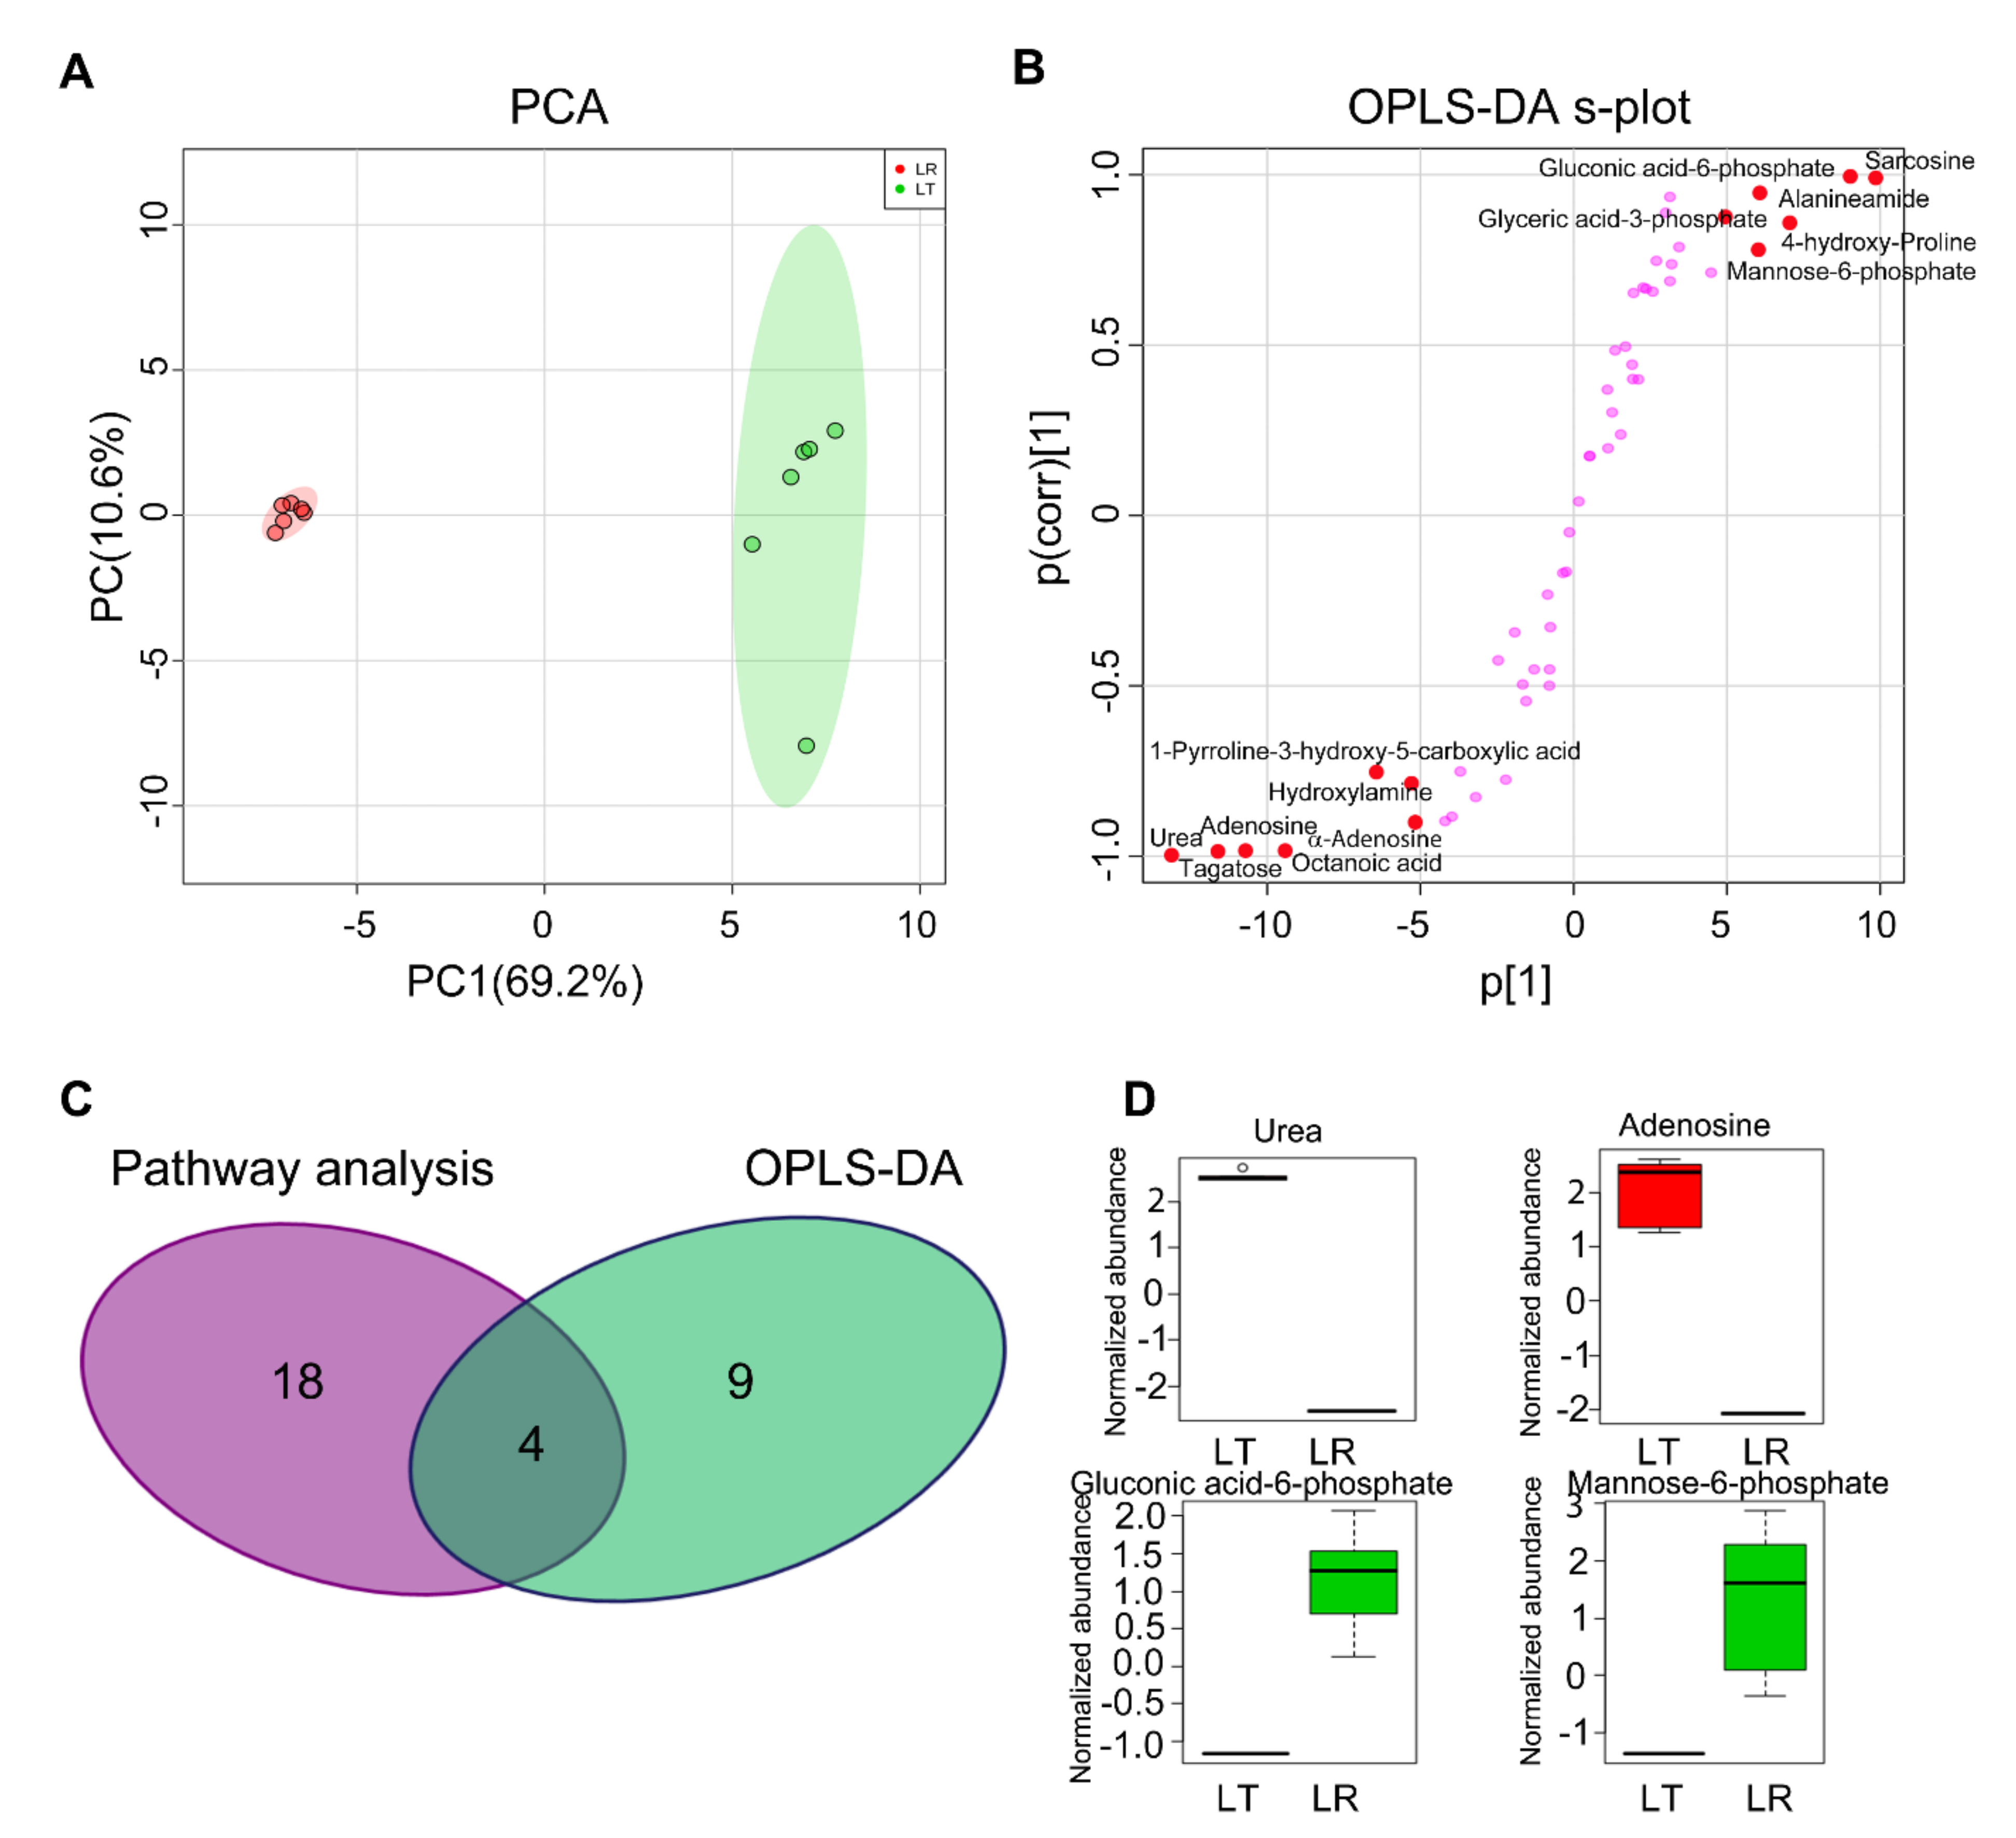
To explore the most crucial metabolites differentiating LT from LR, orthogonal partial least square discriminant analysis (OPLS-DA) was conducted to recognize the sample pattern. Results showed that LT and LR groups were distributed in two separate quarters (R2X = 0.454, R2Y = 0.975, Q2 = 0.949) by Component p [1] (Figure 4A). Discriminating variables were shown with an S-plot (Figure 4B), when the thresholds were set as the absolute values of covariance and correlation coefficients were greater than or equal to 0.05 and 0.5, respectively. Through OPLS-DA analysis, biomarkers screened by component p [1] and p (corr) [1] are shown in Figure 4B and marked in red. In addition, as demonstrated by the Venn diagram, there were four identical biomarkers in both the pathway enrichment analysis and OPLS-DA analysis (Figure 4C). Out of the four crucial metabolites, urea and adenosine were elevated in the LT group, and they had the lowest z-score. Gluconic acid-6-phosphate and mannose-6-phosphate were decreased in the LT group and had the highest z-score (Figure 4D). We speculate that these four compounds may be key metabolites for further study of embryonic muscle development.

3.5. Comparative Metabolic Pathway Analysis between LT and LR

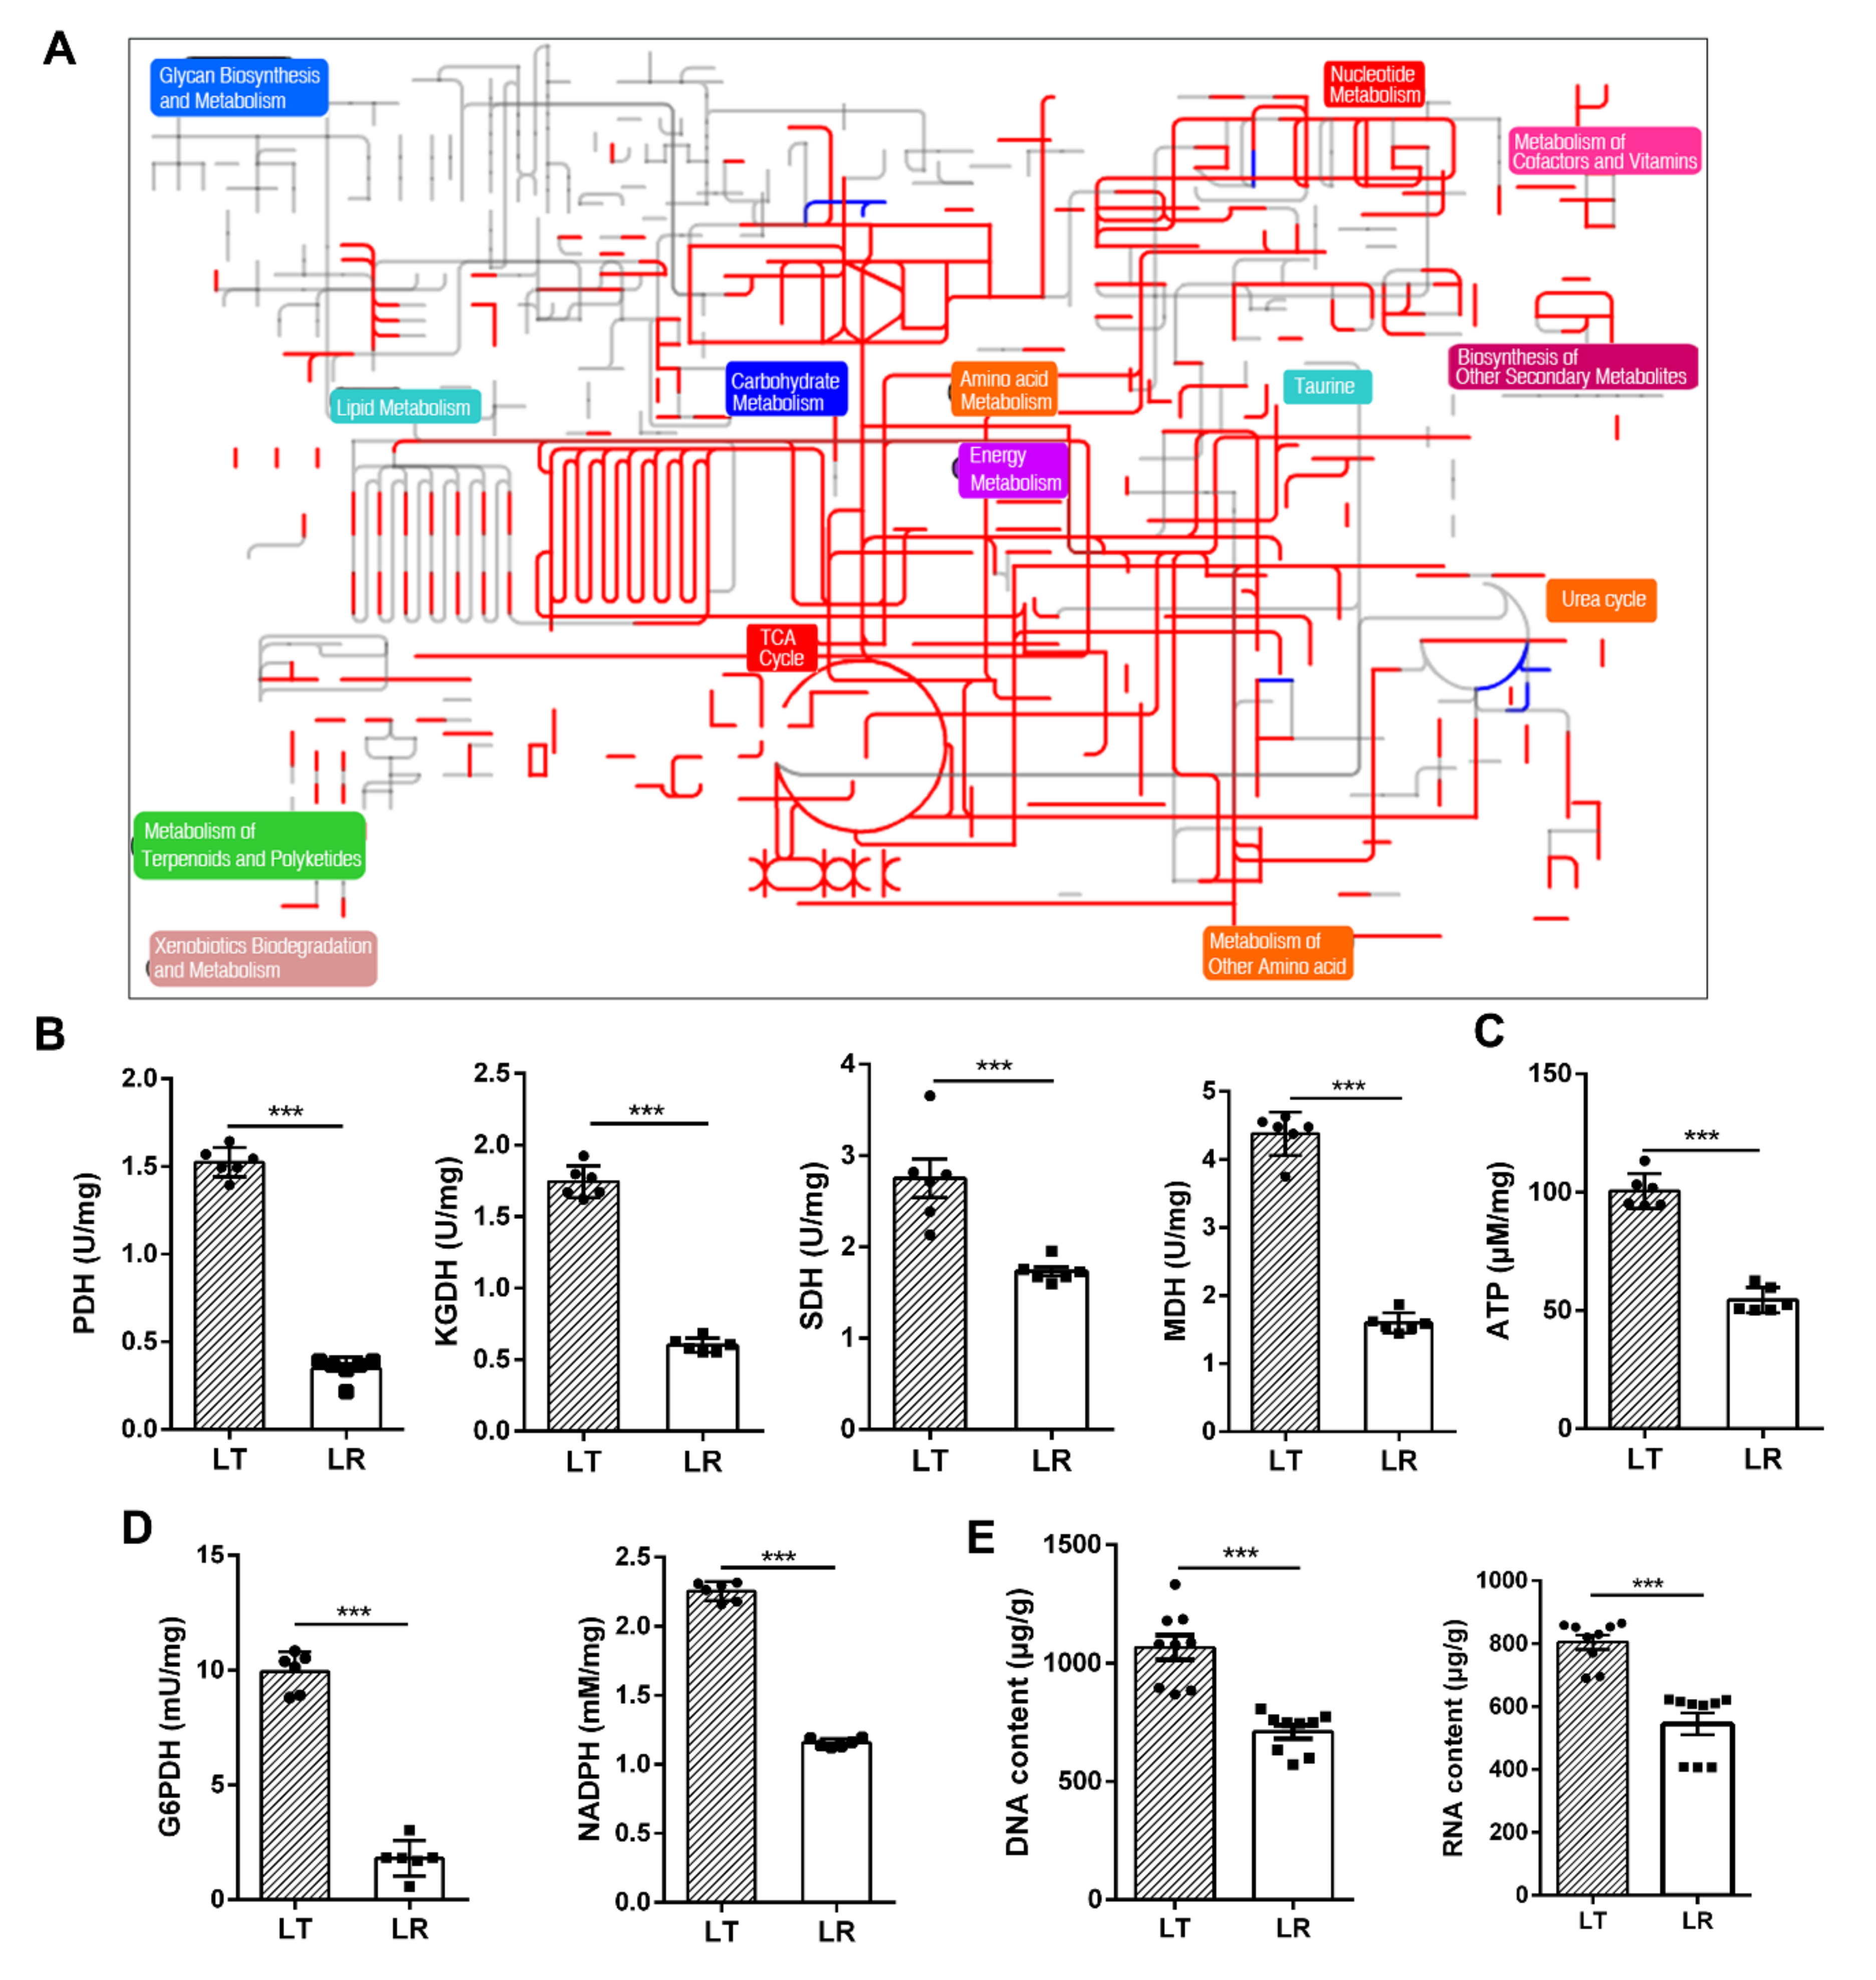
Comparative metabolic pathway analysis between the LT group and the LR group was carried out in iPath. The resulting global overview map provided a better insight into the different metabolic states, where the red line represent increased pathways in LT and the blue line represent increased pathways in LR. We identified that most of the presented pathways were elevated in LT, especially nucleotide metabolism and energy metabolism (Figure 5A). To validate the contributing role of the TCA cycle in LT muscle development, the activity of four key enzymes in the central carbon metabolism of LT and LR LL tissues was measured, including PDH, KGDH, SDH, and MDH. Activity of the four enzymes were elevated in LT compared with LR (p < 0.005, Figure 5B). In line with this, the content of ATP in LT LL was higher than for LR (p < 0.005, Figure 5C). Further, the increased activity of the G6PDH enzyme and the increased content of NADPH indicated that the pentose phosphate pathway was enhanced in LT (p < 0.005, Figure 5D). As shown in Figure 5E (p < 0.005), the content of DNA and RNA in unit weight LL of LT was higher than that of LR, which further proved that LT had boosted nucleotide metabolism.

4. Discussion

Increasing evidence shows that there is a genetic difference in the regulation of muscle development, which leads to distinct early embryonic porcine myogenesis processes between pig breeds [8,9]. Here, GC–MS-based metabolomics was used to analyze metabolic profiles in LT and LR skeletal muscle at E35. Multivariate statistical analysis of skeletal muscle metabolites showed that LT displayed a significant increase in energy metabolism and nucleotide synthesis, which might be related to the rapid myogenic differentiation of LT in the embryonic stage [22,43]. As a result, strong cell proliferation and differentiation ability requiring high energy consumption could take place.
The importance of nutrient utilization and metabolism in the process of muscle cell differentiation has been well described [44,45]. Postnatal growth rate and skeletal muscle fiber type composition of pigs are influenced by metabolic status [46,47]. It has been shown, in vitro, that different metabolic environments seriously affect the proliferation and differentiation of myoblasts [48,49]. In the current study, significant metabolomic differences were found between the LL tissues of LT and LR. Among the differential metabolites, in terms of purine metabolism, the increase in guanine, guanosine, and glutamine reflected a higher accumulation for purine nucleotides synthesis in LT. Likewise, in terms of pyrimidine metabolism, a higher abundance of uridine, uridine-5′-monophosphate, beta-alanine, and glutamine was found in LT. Purine metabolites and pyrimidine metabolites, serving as building blocks for DNA and RNA, are integral to the promotion of cell survival and proliferation [50]. Consistent with this, DNA and RNA content in LL were higher in LT pigs.
Glutamine can be used as a substrate for nucleotide synthesis (purines, pyrimidines, and amino sugars), as well as NADPH and many other biosynthetic pathways involved in the maintenance of cellular integrity and function [51]. Therefore, we speculated that the increase in glutamine might promote nucleic acid synthesis. It has previously been reported that intracellular L-glutamine levels per se play a role in the control of protein content in skeletal muscle myotube, and L-glutamine supplementation improves skeletal muscle cell differentiation [48,52]. Previous studies also report that LT show more intense myogenesis than LR at E35 [22]. Thus, the greater purine metabolism and pyrimidine metabolism could satisfy the large demand for nucleic acid substances for muscle development.
The pentose phosphate pathway (PPP) which produces ribose-5-phosphate for de novo nucleotide biosynthesis also generates NADPH, which is crucial for supporting cell proliferation via the reductive biosynthesis of macromolecules such as lipids [53,54]. In addition, NADPH functions as a reactive oxygen species (ROS) scavenger and plays an important role in cellular antioxidant defense [55]. Therefore, elevated NADPH levels contribute to the rapid proliferation and differentiation of myoblasts and may be a feature of rapid biosynthesis in LT LL, which contributed to the rapid proliferation and differentiation of myogenic cells. Glucose-6-phosphate dehydrogenase (G6PDH) is a rate-limiting enzyme in the PPP; it catalyzes the dehydrogenation of 6-phosphoglucose to form 6-phosphogluconate-δ-lactone [56]. The increased activity of G6PDH further demonstrated that the PPP was enhanced in LT.
The TCA cycle plays a central role in metabolism by completely oxidizing acetyl-CoA, a key product of carbohydrate, fatty acid, and amino acid catabolism, into carbon dioxide, producing ATP and meeting most of the cell’s energy requirements [57]. Metabolome analysis revealed that TCA cycle metabolites such as citric acid were increased in LT. More interestingly, we showed that ATP levels were significantly lower in LR muscle tissue. The TCA cycle consists of a series of biochemical reactions occurring in the mitochondrial matrix, in which some metabolic enzymes are involved [58,59,60]. To further demonstrate that it was boosted and the TCA cycle provided sufficient ATP for intense cell development in LT, the activity of four enzymes involved in the TCA cycle were measured. These enzymes included PDH that transforms pyruvate into acetyl-CoA, KGDH that converts α-ketoglutarate to succinyl-CoA, MDH that catalyzes the reversible conversion between oxaloacetic acid and malate, and SDH that catalyzes the transformation of succinate into fumarate [57]. According to expectations, the activity of these enzymes in LT LL tissue was significantly greater than in LR. These findings revealed that enhanced TCA cycles lead to the rapid generation of ATP, which could meet the energy requirements of rapid cell proliferation and differentiation in LT.
The above shows that different myogenic abilities of LT and LR pigs in early embryogenesis are related to cellular metabolic status. We found that the metabolic profiles of embryonic skeletal muscle of LT was more conducive to the rapid formation of myofiber. Although metabolic regulation of skeletal muscle development has been widely reported, it has not been further verified whether the differences in metabolic profiles between LT and LR at E35 are the cause or consequence of the differences in skeletal muscle development. It is also unclear whether the differences affect muscle mass at a later stage. This is the deficiency of this study. In addition, the mechanism underlying the metabolome differences is unclear; this may be owing to several factors. As the alterations were observed in embryos whose parents were raised under uniform conditions, different levels of metabolism may be linked with a genetic or epigenetic origin. For example, the occurrence of severe obesity is related to differing methylation modification signatures near the gene promoter of several metabolic enzymes, resulting in altered gene expression [61,62]. It has also been hypothesized that post-translational modification (i.e., acetylation and phosphorylation) of metabolic enzymes can impair TCA cycle flux or cause metabolic disorders [63,64]. A limitation of the current study was not directly examining either of these factors. Although we revealed that the activity of several metabolic enzymes involved in the TCA cycle and PPP in LT pigs was significantly stronger than that in LR pigs, the underlying mechanism remains unclear. In addition, the TCA cycle occurs in cell mitochondria, so the increased or decreased content of mitochondria in skeletal muscle cells may contribute to the changed TCA cycle flux [65,66].

5. Conclusions

In conclusion, GC–MS-based metabolomics was adopted to understand the mechanisms by which LT had a more intense myogenic capacity than LR at the early embryonic stage. Results showed that abudances of individual metabolites were clearly different in the LL tissues of LT and LR. Furthermore, comparative metabolic pathway analysis and enzyme activity detection revealed that nucleotide metabolism and energy metabolism, including purine metabolism, pyrimidine metabolism, PPP, and the TCA cycle, were increased in LT, permitting rapid generation of nucleic acids and ATP, to meet the material and energy requirements of rapid cell proliferation and differentiation. By OPLS-DA and pathway enrichment analysis, four crucial biomarkers were identified that may have important effects on porcine muscle development. To our knowledge, this is the first report that reveals the relationship between functional metabolomics and differences in embryonic muscle development among pig breeds. It will provide a new insight for elucidating the regulatory mechanism concerning porcine embryonic muscle development.

Author Contributions

Study design, D.M. and J.L.; data collection and analysis, S.C.; writing—original draft preparation, S.C. and T.D.; writing—review and editing, X.W. and X.T.; data analysis and supervision, C.L., Y.C. and J.L. All authors have read and agreed to the published version of the manuscript.

Funding

This work was supported by the National Natural Science Foundation of China (32072697), China Agriculture Research System (CASR-35), the Guangzhou Science and Technology Planning Project (201707020007), and the Key Research and Development Program of Guangxi (AB19245030).

Institutional Review Board Statement

All animal experiments conformed to the relevant rules and regulations on animal welfare. The experimental animal procedures and protocols used were approved by the Animal Care and Use Committee of Guangdong Province, China. The approval ID or permit numbers are SCXK (Guangdong, China) 2011-0029 and SYXK (Guangdong, China) 2011-0112.

Data Availability Statement

The original data can be obtained by contacting the corresponding author.

Acknowledgments

The authors gratefully acknowledge all the teachers and students in the Laboratory of Animal Genetic Engineering.

Conflicts of Interest

The authors declare no conflict of interest.

References

  1. Rocha, D.; Plastow, G. Commercial pigs: An untapped resource for human obesity research? Drug Discov. Today 2006, 11, 475–477. [Google Scholar] [CrossRef] [PubMed]
  2. Patterson, J.K.; Lei, X.G.; Miller, D.D. The Pig as an Experimental Model for Elucidating the Mechanisms Governing Dietary Influence on Mineral Absorption. Exp. Biol. Med. 2008, 233, 651–664. [Google Scholar] [CrossRef] [PubMed]
  3. Wigmore, P.M.; Strickland, N.C. DNA, RNA and protein in skeletal muscle of large and small pig fetuses. Growth 1983, 47, 67–76. [Google Scholar] [PubMed]
  4. Picard, B.; Lefaucheur, L.; Berri, C.; Duclos, M.J. Muscle fibre ontogenesis in farm animal species. Reprod. Nutr. Dev. 2002, 42, 415–431. [Google Scholar] [CrossRef] [Green Version]
  5. Mascarello, F.; Stecchini, M.L.; Rowlerson, A.; Ballocchi, E. Tertiary myotubes in postnatal growing pig muscle detected by their myosin isoform composition1. J. Anim. Sci. 1992, 70, 1806–1813. [Google Scholar] [CrossRef]
  6. Serrano, M.P.; Valencia, D.G.; Fuentetaja, A.; Lázaro, R.; Mateos, G.G. Influence of feed restriction and sex on growth performance and carcass and meat quality of Iberian pigs reared indoors. J. Anim. Sci. 2009, 87, 1676–1685. [Google Scholar] [CrossRef]
  7. Edwards, D.B.; Bates, R.O.; Osburn, W.N. Evaluation of Duroc- vs. Pietrain-sired pigs for carcass and meat quality measures. J. Anim. Sci. 2003, 81, 1895–1899. [Google Scholar] [CrossRef] [PubMed]
  8. Ropka-Molik, K.; Żukowski, K.; Eckert, R.; Gurgul, A.; Piórkowska, K.; Oczkowicz, M. Comprehensive analysis of the whole transcriptomes from two different pig breeds using RNA-Seq method. Anim. Genet. 2014, 45, 674–684. [Google Scholar] [CrossRef]
  9. Wang, Z.; Li, Q.; Chamba, Y.; Zhang, B.; Shang, P.; Zhang, H.; Wu, C. Identification of Genes Related to Growth and Lipid Deposition from Transcriptome Profiles of Pig Muscle Tissue. PLoS ONE 2015, 10, e0141138. [Google Scholar] [CrossRef] [Green Version]
  10. Ropka-Molik, K.; Żukowski, K.; Eckert, R.; Piórkowska, K.; Oczkowicz, M.; Gurgul, A.; Szmatoła, T. Whole transcriptome analysis of the porcine muscle tissue of breeds differing in muscularity and meat quality traits. Livest. Sci. 2015, 182, 93–100. [Google Scholar] [CrossRef]
  11. Güller, I.; Russell, A.P. MicroRNAs in skeletal muscle: Their role and regulation in development, disease and function. J. Physiol. 2010, 588, 4075–4087. [Google Scholar] [CrossRef] [PubMed] [Green Version]
  12. Liu, N.; Bassel-Duby, R. Regulation of Skeletal Muscle Development and Disease by microRNAs. Results Probl. Cell Differ. 2014, 56, 165–190. [Google Scholar] [CrossRef]
  13. Tang, Z.; Yang, Y.; Wang, Z.; Zhao, S.; Mu, Y.; Li, K. Integrated analysis of miRNA and mRNA paired expression profiling of prenatal skeletal muscle development in three genotype pigs. Sci. Rep. 2015, 5, srep15544. [Google Scholar] [CrossRef] [PubMed] [Green Version]
  14. Yang, Y.; Del Re, D.P.; Nakano, N.; Sciarretta, S.; Zhai, P.; Park, J.; Sayed, D.; Shirakabe, A.; Matsushima, S.; Park, Y.; et al. miR-206 Mediates YAP-Induced Cardiac Hypertrophy and Survival. Circ. Res. 2015, 117, 891–904. [Google Scholar] [CrossRef] [Green Version]
  15. Liang, T.; Liang, T.; Zhou, B.; Shi, L.; Wang, H.; Chu, Q.; Xu, F.; Schinckel, A.P. lncRNA AK017368 promotes proliferation and suppresses differentiation of myoblasts in skeletal muscle development by attenuating the function of miR-30c. FASEB J. 2018, 32, 377–389. [Google Scholar] [CrossRef] [Green Version]
  16. Reza, M.M.; Subramaniyam, N.; Sim, C.M.; Ge, X.; Sathiakumar, D.; McFarlane, C.; Sharma, M.; Kambadur, R. Irisin is a pro-myogenic factor that induces skeletal muscle hypertrophy and rescues denervation-induced atrophy. Nat. Commun. 2017, 8, 1104. [Google Scholar] [CrossRef] [PubMed]
  17. Dai, F.; Feng, D.; Cao, Q.; Ye, H.; Zhang, C.; Xia, W.; Zuo, J. Developmental differences in carcass, meat quality and muscle fibre characteristics between the Landrace and a Chinese native pig. S. Afr. J. Anim. Sci. 2010, 39, 267–273. [Google Scholar] [CrossRef]
  18. Cameron, N.D.; Enser, M.; Nute, G.R.; Whittington, F.M.; Penman, J.C.; Fisken, A.C.; Perry, M.A.; Wood, J.D. Genotype with nutrition interaction on fatty acid composition of intramuscular fat and the relationship with flavour of pig meat. Meat Sci. 2000, 55, 187–195. [Google Scholar] [CrossRef]
  19. Yu, K.; Shu, G.; Yuan, F.; Zhu, X.; Gao, P.; Wang, S.; Wang, L.; Xi, Q.; Zhang, S.; Zhang, Y.; et al. Fatty Acid and Transcriptome Profiling of Longissimus Dorsi Muscles between Pig Breeds Differing in Meat Quality. Int. J. Biol. Sci. 2013, 9, 108–118. [Google Scholar] [CrossRef]
  20. Wang, X.-Q.; Yang, W.-J.; Yang, Z.; Shu, G.; Wang, S.-B.; Jiang, Q.-Y.; Yuan, L.; Wu, T.-S. The Differential Proliferative Ability of Satellite Cells in Lantang and Landrace Pigs. PLoS ONE 2012, 7, e32537. [Google Scholar] [CrossRef] [Green Version]
  21. Xie, S.; Chen, L.; Zhang, X.; Liu, X.; Chen, Y.; Mo, D. An integrated analysis revealed different microRNA-mRNA profiles during skeletal muscle development between Landrace and Lantang pigs. Sci. Rep. 2017, 7, 2516. [Google Scholar] [CrossRef] [PubMed] [Green Version]
  22. Zhao, X.; Mo, D.; Li, A.; Gong, W.; Xiao, S.; Zhang, Y.; Qin, L.; Niu, Y.; Guo, Y.; Liu, X.; et al. Comparative Analyses by Sequencing of Transcriptomes during Skeletal Muscle Development between Pig Breeds Differing in Muscle Growth Rate and Fatness. PLoS ONE 2011, 6, e19774. [Google Scholar] [CrossRef] [PubMed] [Green Version]
  23. He, D.; Zou, T.; Gai, X.; Ma, J.; Li, M.; Huang, Z.; Chen, D. MicroRNA expression profiles differ between primary myofiber of lean and obese pig breeds. PLoS ONE 2017, 12, e0181897. [Google Scholar] [CrossRef] [PubMed]
  24. Newgard, C.B. Metabolomics and Metabolic Diseases: Where Do We Stand? Cell Metab. 2017, 25, 43–56. [Google Scholar] [CrossRef] [Green Version]
  25. Peng, B.; Li, H.; Peng, X.-X. Functional metabolomics: From biomarker discovery to metabolome reprogramming. Protein Cell 2015, 6, 628–637. [Google Scholar] [CrossRef] [Green Version]
  26. Engelen, M.P.; Jonker, R.; Thaden, J.J.; Have, G.A.T.; Jeon, M.S.; Dasarathy, S.; Deutz, N.E. Comprehensive metabolic flux analysis to explain skeletal muscle weakness in COPD. Clin. Nutr. 2020, 39, 3056–3065. [Google Scholar] [CrossRef]
  27. Lustgarten, M.S.; Price, L.L.; Chale, A.; Phillips, E.M.; Fielding, R.A. Branched Chain Amino Acids Are Associated with Muscle Mass in Functionally Limited Older Adults. J. Gerontol. Ser. A 2013, 69, 717–724. [Google Scholar] [CrossRef] [Green Version]
  28. Murphy, R.A.; Moore, S.C.; Playdon, M.; Meirelles, O.; Newman, A.B.; Milijkovic, I.; Kritchevsky, S.B.; Schwartz, A.; Goodpaster, B.H.; Sampson, J.; et al. Metabolites Associated with Lean Mass and Adiposity in Older Black Men. J. Gerontol. Ser. A 2017, 72, 1352–1359. [Google Scholar] [CrossRef] [Green Version]
  29. Newgard, C.B.; An, J.; Bain, J.R.; Muehlbauer, M.J.; Stevens, R.D.; Lien, L.F.; Haqq, A.M.; Shah, S.H.; Arlotto, M.; Slentz, C.A.; et al. A Branched-Chain Amino Acid-Related Metabolic Signature that Differentiates Obese and Lean Humans and Contributes to Insulin Resistance. Cell Metab. 2009, 9, 311–326. [Google Scholar] [CrossRef] [Green Version]
  30. Lo, C.-J.; Ko, Y.-S.; Chang, S.-W.; Tang, H.-Y.; Huang, C.-Y.; Huang, Y.-C.; Ho, H.-Y.; Lin, C.-M.; Cheng, M.-L. Metabolic signatures of muscle mass loss in an elderly Taiwanese population. Aging 2020, 13, 944–956. [Google Scholar] [CrossRef]
  31. Matsuda, R.; Uchitomi, R.; Oyabu, M.; Hatazawa, Y.; Kamei, Y. Metabolomic analysis of C2C12 myoblasts induced by the transcription factor FOXO 1. FEBS Lett. 2019, 593, 1303–1312. [Google Scholar] [CrossRef]
  32. Joseph, J.; Cho, D.S.; Doles, J.D. Metabolomic Analyses Reveal Extensive Progenitor Cell Deficiencies in a Mouse Model of Duchenne Muscular Dystrophy. Metabolites 2018, 8, 61. [Google Scholar] [CrossRef] [Green Version]
  33. Pala, F.; Di Girolamo, D.; Mella, S.; Yennek, S.; Chatre, L.; Ricchetti, M.; Tajbakhsh, S. Distinct metabolic states govern skeletal muscle stem cell fates during prenatal and postnatal myogenesis. J. Cell Sci. 2018, 131, jcs212977. [Google Scholar] [CrossRef] [PubMed] [Green Version]
  34. Ryall, J.G. Simultaneous Measurement of Mitochondrial and Glycolytic Activity in Quiescent Muscle Stem Cells. In Muscle Stem Cells; Humana: New York, NY, USA, 2017; pp. 245–253. [Google Scholar] [CrossRef]
  35. Yang, M.-J.; Cheng, Z.-X.; Jiang, M.; Zeng, Z.-H.; Peng, B.; Peng, X.-X.; Li, H. Boosted TCA cycle enhances survival of zebrafish to Vibrio alginolyticus infection. Virulence 2018, 9, 634–644. [Google Scholar] [CrossRef] [Green Version]
  36. Yang, M.-J.; Xu, D.; Yang, D.-X.; Li, L.; Peng, X.-X.; Chen, Z.-G.; Li, H. Malate enhances survival of zebrafish against Vibrio alginolyticus infection in the same manner as taurine. Virulence 2020, 11, 349–364. [Google Scholar] [CrossRef] [PubMed] [Green Version]
  37. Pezzatti, J.; González-Ruiz, V.; Codesido, S.; Gagnebin, Y.; Joshi, A.; Guillarme, D.; Schappler, J.; Picard, D.; Boccard, J.; Rudaz, S. A scoring approach for multi-platform acquisition in metabolomics. J. Chromatogr. A 2019, 1592, 47–54. [Google Scholar] [CrossRef] [PubMed]
  38. Yang, M.-J.; Jiang, M.; Peng, X.-X.; Li, H. Myo-Inositol Restores Tilapia’s Ability Against Infection by Aeromonas sobria in Higher Water Temperature. Front. Immunol. 2021, 12, 3654. [Google Scholar] [CrossRef] [PubMed]
  39. Chong, J.; Xia, J. MetaboAnalystR: An R package for flexible and reproducible analysis of metabolomics data. Bioinformatics 2018, 34, 4313–4314. [Google Scholar] [CrossRef] [Green Version]
  40. Chong, J.; Soufan, O.; Li, C.; Caraus, I.; Li, S.; Bourque, G.; Wishart, D.S.; Xia, J. Metabo Analyst 4.0: Towards more transparent and integrative metabolomics analysis. Nucleic Acids Res. 2018, 46, W486–W494. [Google Scholar] [CrossRef] [Green Version]
  41. Hummel, J.; Strehmel, N.; Selbig, J.; Walther, D.; Kopka, J. Decision tree supported substructure prediction of metabolites from GC-MS profiles. Metabolomics 2010, 6, 322–333. [Google Scholar] [CrossRef] [Green Version]
  42. Yamada, T.; Letunic, I.; Okuda, S.; Kanehisa, M.; Bork, P. iPath2.0: Interactive pathway explorer. Nucleic Acids Res. 2011, 39, W412–W415. [Google Scholar] [CrossRef] [PubMed] [Green Version]
  43. Zhang, X.; Nie, Y.; Cai, S.; Ding, S.; Fu, B.; Wei, H.; Chen, L.; Liu, X.; Liu, M.; Yuan, R.; et al. Earlier demethylation of myogenic genes contributes to embryonic precocious terminal differentiation of myoblasts in miniature pigs. FASEB J. 2019, 33, 9638–9655. [Google Scholar] [CrossRef] [PubMed] [Green Version]
  44. Kraft, C.S.; LeMoine, C.; Lyons, C.N.; Michaud, D.; Mueller, C.R.; Moyes, C.D. Control of mitochondrial biogenesis during myogenesis. Am. J. Physiol. Physiol. 2006, 290, C1119–C1127. [Google Scholar] [CrossRef] [PubMed]
  45. Wang, X.; Feng, Z.; Wang, X.; Yang, L.; Han, S.; Cao, K.; Liu, J. O-GlcNAcase deficiency suppresses skeletal myogenesis and insulin sensitivity in mice through the modulation of mitochondrial homeostasis. Diabetologia 2016, 59, 1287–1296. [Google Scholar] [CrossRef] [Green Version]
  46. Julien, I.B.; Sephton, C.F.; Dutchak, P.A. Metabolic Networks Influencing Skeletal Muscle Fiber Composition. Front. Cell Dev. Biol. 2018, 6, 125. [Google Scholar] [CrossRef]
  47. Ramsay, T.G.; Stoll, M.J.; Shannon, A.E.; Blomberg, L.A. Metabolomic analysis of longissimus from underperforming piglets relative to piglets with normal preweaning growth. J. Anim. Sci. Biotechnol. 2018, 9, 36. [Google Scholar] [CrossRef]
  48. Girven, M.; Dugdale, H.F.; Owens, D.J.; Hughes, D.C.; Stewart, C.E.; Sharples, A.P. l-glutamine Improves Skeletal Muscle Cell Differentiation and Prevents Myotube Atrophy After Cytokine (TNF-α) Stress Via Reduced p38 MAPK Signal Transduction. J. Cell. Physiol. 2016, 231, 2720–2732. [Google Scholar] [CrossRef] [Green Version]
  49. Gatta, L.; Vitiello, L.; Gorini, S.; Chiandotto, S.; Costelli, P.; Giammarioli, A.M.; Malorni, W.; Rosano, G.; Ferraro, E. Modulating the metabolism by trimetazidine enhances myoblast differentiation and promotes myogenesis in cachectic tumor-bearing c26 mice. Oncotarget 2017, 8, 113938–113956. [Google Scholar] [CrossRef] [Green Version]
  50. Pedley, A.M.; Benkovic, S.J. A New View into the Regulation of Purine Metabolism: The Purinosome. Trends Biochem. Sci. 2017, 42, 141–154. [Google Scholar] [CrossRef] [Green Version]
  51. Curi, R.; Lagranha, C.J.; Doi, S.Q.; Sellitti, D.F.; Procopio, J.; Pithon-Curi, T.C.; Corless, M.; Newsholme, P. Molecular mechanisms of glutamine action. J. Cell. Physiol. 2005, 204, 392–401. [Google Scholar] [CrossRef]
  52. de Vasconcelos, D.A.A.; Giesbertz, P.; Murata, G.M.; de Souza, D.R.; Fiamoncini, J.; Duque-Guimaraes, D.; Pithon-Curi, T.C. Myotube Protein Content Associates with Intracellular L-Glutamine Levels. Cell Physiol. Biochem. 2019, 53, 200–214. [Google Scholar]
  53. Rao, X.; Duan, X.; Mao, W.; Li, X.; Li, Z.; Li, Q.; Yi, W. O-GlcNAcylation of G6PD promotes the pentose phosphate pathway and tumor growth. Nat. Commun. 2015, 6, 8468. [Google Scholar] [CrossRef] [PubMed] [Green Version]
  54. Kroemer, G.; Pouyssegur, J. Tumor cell metabolism: Cancer’s Achilles’ heel. Cancer Cell 2008, 13, 472–482. [Google Scholar] [CrossRef] [PubMed]
  55. Jiang, P.; Du, W.; Wang, X.; Mancuso, A.; Gao, X.; Wu, M.; Yang, X. p53 regulates biosynthesis through direct inactivation of glucose-6-phosphate dehydrogenase. Nat. Cell Biol. 2011, 13, 310–316. [Google Scholar] [CrossRef] [Green Version]
  56. Mihara, S.; Wakao, H.; Yoshida, K.; Higo, A.; Sugiura, K.; Tsuchiya, A.; Nomata, J.; Wakabayashi, K.-I.; Hisabori, T. Thioredoxin regulates G6PDH activity by changing redox states of OpcA in the nitrogen-fixing cyanobacterium Anabaena sp. PCC 7120. Biochem. J. 2018, 475, 1091–1105. [Google Scholar] [CrossRef]
  57. Ciccarone, F.; Vegliante, R.; Di Leo, L.; Ciriolo, M.R. The TCA cycle as a bridge between oncometabolism and DNA transactions in cancer. Semin. Cancer Biol. 2017, 47, 50–56. [Google Scholar] [CrossRef]
  58. Bubber, P.; Haroutunian, V.; Fisch, G.; Blass, J.P.; Gibson, G.E. Mitochondrial abnormalities in Alzheimer brain: Mechanistic implications. Ann. Neurol. 2005, 57, 695–703. [Google Scholar] [CrossRef]
  59. Chen, X.; Dong, X.; Wang, Y.; Zhao, Z.; Liu, L. Mitochondrial engineering of the TCA cycle for fumarate production. Metab. Eng. 2015, 31, 62–73. [Google Scholar] [CrossRef]
  60. Zhang, S.; Hulver, M.W.; McMillan, R.P.; Cline, M.A.; Gilbert, E.R. The pivotal role of pyruvate dehydrogenase kinases in metabolic flexibility. Nutr. Metab. 2014, 11, 10. [Google Scholar] [CrossRef] [Green Version]
  61. Maples, J.M.; Brault, J.J.; Shewchuk, B.M.; Witczak, C.A.; Zou, K.; Rowland, N.; Hubal, M.J.; Weber, T.M.; Houmard, J.A. Lipid exposure elicits differential responses in gene expression and DNA methylation in primary human skeletal muscle cells from severely obese women. Physiol. Genom. 2015, 47, 139–146. [Google Scholar] [CrossRef] [PubMed] [Green Version]
  62. Maples, J.; Brault, J.J.; Witczak, C.A.; Park, S.; Hubal, M.J.; Weber, T.M.; Houmard, J.A.; Shewchuk, B.M. Differential epigenetic and transcriptional response of the skeletal muscle carnitine palmitoyltransferase 1B (CPT1B) gene to lipid exposure with obesity. Am. J. Physiol. Metab. 2015, 309, E345–E356. [Google Scholar] [CrossRef] [PubMed] [Green Version]
  63. Gaster, M. Reduced TCA Flux in Diabetic Myotubes: Determined by Single Defects? Biochem. Res. Int. 2012, 2012, 716056. [Google Scholar] [CrossRef] [PubMed] [Green Version]
  64. Gaster, M. Reduced TCA flux in diabetic myotubes: A governing influence on the diabetic phenotype? Biochem. Biophys. Res. Commun. 2009, 387, 651–655. [Google Scholar] [CrossRef] [PubMed]
  65. Gaster, M.; Nehlin, J.O.; Minet, A.D. Impaired TCA cycle flux in mitochondria in skeletal muscle from type 2 diabetic subjects: Marker or maker of the diabetic phenotype? Arch. Physiol. Biochem. 2012, 118, 156–189. [Google Scholar] [CrossRef] [PubMed]
  66. Houmard, J.A.; Pories, W.J.; Dohm, G.L. Severe obesity: Evidence for a deranged metabolic program in skeletal muscle? Exerc. Sport Sci. Rev. 2012, 40, 204–210. [Google Scholar] [CrossRef] [PubMed] [Green Version]
Figure 1. Experimental design outline and metabolomic profiling of 35 d embryos of Lantang (LT) and Landrace (LR) pigs. (A) Three representative total ion current chromatograms from Lantang (LT) and Landrace (LR), respectively. RT, retention time. (B) Reproducibility of metabolomic profiling platform used in the discovery phase. Metabolite abundances quantified in the samples over two technical replicates are shown. The correlation coefficient between technical replicates approximated to 1 (0.99905 to 0.99998). (C) Hierarchical cluster analysis of 12 samples. (D) Heat map showing the metabolites detected. Light blue and red indicate an increase or decrease in metabolites relative to the median metabolite level, respectively (see color scale).
Animals 12 00420 g001
Figure 2. Varied metabolomes in 35 d embryos between LT and LR. (A) Heat map showing the relative abundance of significantly varied metabolites in LT and LR as indicated, respectively. (B) Z-values (standard deviation from average) of the LT group correspond to data in significant metabolites. Z-value based on the LR was calculated to identify the differential abundance of metabolites of LT compared to LR.
Animals 12 00420 g002
Figure 3. Pathway enrichment and analysis. (A) Pathway enrichment of various metabolites. A hypergeometric test was used to calculate the −log(p) value for reflecting the impact of each metabolic pathway, and pathways with p < 0.05 were retained. Significantly enriched pathways were selected for plotting. According to the impact value, 1 to 6 are, respectively, the pathways of pentose phosphate, purine metabolism, starch and sucrose metabolism, pyrimidine metabolism, fructose and mannose metabolism, and the citrate cycle (TCA cycle). (B) Integrative analysis of metabolites in significantly enriched pathways. Compared with LT, red and blue indicate an increase or decrease of metabolites in LR, respectively. Number shows the relative area of varied metabolites.
Animals 12 00420 g003
Figure 4. Identification of crucial metabolites. (A) PCA analysis of LT and LR groups according to the treatments set. Each dot represents a technological replicate analysis of samples in the plot. PC1 and PC2 used in this plot explain 79.8% of the total variance, which allows confident interpretation of the variation. PC1, principal component 1; PC2, principal component 2. (B) S-plot generated from OPLS-DA (R2X = 0.454, R2Y = 0.975, Q2 = 0.949). Predictive component p [1] and correlation p (corr) [1] differentiate LT from LR. Dots represent metabolites, and candidate biomarkers are highlighted in red. (C) Venn diagram analysis of key metabolites both in pathway enrichment analysis and OPLS-DA. (D) Box plot of urea, adenosine, gluconic acid-6-phosphate, and mannose-6-phosphate.
Animals 12 00420 g004
Figure 5. Comparative metabolic pathway analysis between LT and LR. (A) Analysis of the porcine metabolic profiles provides a better insight into the effects of 54 significant metabolites (p < 0.01) and enzyme activity. Based on the KEGG compound (http://www.kegg.jp/kegg/compound/) (accessed on 6 April 2021), metabolic network pathways are further analyzed with iPath2.0 (http://pathways.embl.de/iPath2.cgi) (accessed on 6 April 2021). Red line represents an increase in LT groups; blue line represents an increase in LT groups. (B) The activity of KGDH, PDH, MDH, and SDH in LL tissues of LT and LR. (C) ATP measurement in LL tissues of LT and LR. (D) The activity of G6PDH and the measurement of NADPH. (E) The content of DNA and RNA per unit mass of LL tissue metabolites in both pathway enrichment analysis and OPLS-DA. Asterisks (*) indicate levels of statistical significance. *** p < 0.001.
Animals 12 00420 g005
Publisher’s Note: MDPI stays neutral with regard to jurisdictional claims in published maps and institutional affiliations.