Article

The Multi-Omics Analysis Revealed a Metabolic Regulatory System of Cecum in Rabbit with Diarrhea

1
College of Animal Science and Technology, Sichuan Agricultural University, Chengdu 611130, China
2
Farm Animal Genetic Resources Exploration and Innovation Key Laboratory of Sichuan Province, Chengdu Campus, Sichuan Agricultural University, Chengdu 611130, China
*
Author to whom correspondence should be addressed.
These authors contributed equally to this work.
Animals 2022, 12(9), 1194; https://doi.org/10.3390/ani12091194
Submission received: 16 March 2022 / Revised: 29 April 2022 / Accepted: 30 April 2022 / Published: 6 May 2022
(This article belongs to the Section Animal Physiology)

Abstract

:

Simple Summary

In July 2020, China completely banned the addition of antibiotics to feed, which had a huge impact on animal husbandry, such as the increased incidence of some intestinal diseases. In this study, the pathogenesis of diarrhea in rabbits fed with antibiotic-free diet was studied by multi-omics analysis. The study found that the relative abundances of Firmicutes and Proteobacteria in the cecum of diarrhea-afflicted rabbits changed significantly. Most of the differential expression genes identified were related to cecum inflammation and immune response, and a total of 652 differential metabolites were identified, mainly involved in inflammation-related metabolic pathways such as bile secretion, folic acid resistance, and tryptophan metabolism. In addition, Fournierella was positively correlated with myricetin and ursolic acid; thus, it might further cause bile secretion and tryptophan metabolism disorders, aggravate intestinal inflammation, change intestinal permeability, reduce host immunity, and lead to diarrhea in rabbits.

Abstract

With the comprehensive prohibition of antibiotics in the feed industry in China, the incidence of diarrhea in rabbits increased, such as loss of appetite, vomiting, and excretion of atheromatous feces. In order to explore the pathological and the molecular mechanisms of the diarrhea in the rabbitry fed with antibiotic-free diet, we used microbial metagenomics, transcriptome, and non-targeted metabolomics sequencing. The results showed that the Firmicutes level was significantly decreased (p < 0.001) and the Proteobacteria level was significantly increased (p < 0.05). The functional enrichment of cecum revealed that most differentially expressed genes (DEGs) were expressed in immune, inflammatory, and metabolic processes. The enrichment of the cecal fecal metabolites focused on the bile secretion, antifolate resistance, and tryptophan metabolism pathways, which are mainly associated with inflammation. The results of correlation analysis showed that Fournierella was positively correlated with myricetin, ursolic acid, and furtherly might cause bile secretion and tryptophan metabolism disorder, aggravate intestinal inflammation, change intestinal permeability, and reduce host immunity, leading to diarrhea in rabbits. This study provides a theoretical basis for illustrating the reason for diarrhea and developing new feeds for the health of rabbits.

1. Introduction

Antibiotics have played an important role in animal feed since their discovery [1]. Antibiotics in animal feed could maintain animal intestinal health and reduce animal mortality [2,3]. However, overuse of antibiotics not only leads to drug resistance in animals, but also affects consumer health in animal products [4,5]. After the African swine fever, consumers have paid more attention to the abuse of antibiotics in feed. July 2020, China completely prohibited the addition of antibiotics in feed. Subsequently, a lot of rabbits developed diarrhea and loss of appetite, vomiting, and excretion of atheromatous feces [6], which caused reduced feed utilization, low immunity, reduced performance, and even death [7,8], which seriously affects the efficiency of rabbit production.
For animals, the gut is a multifunctional organ that carries microbes that interact with host nutrition, metabolism, and immune function [9,10,11]. The intestinal structure of rabbits is quite different from that of domestic animals such as pigs and chickens [12]. The cecum plays an important role in the digestive and immune functions of rabbits. Cecum microorganisms can secrete various digestive enzymes to improve the digestive ability, and also synthesis of mycoprotein by nitrogen-containing, which could be used again by rabbits [13,14,15]. If the balance of microorganisms is imbalanced, it will not only cause inflammation and oxidative stress, but also reduce the metabolites of microorganisms such as acetic acid and butyric acid, and many metabolites produced by microorganisms that have inhibitory effects on the growth and reproduction of pathogenic bacteria [16,17]. Furthermore, intestinal microbes also have the ability to activate macrophages, promote cytokine-mediated secretion, and enhance host disease resistance [9].
With the updating of biotechnology, multi-omics combined analysis can be verified and interpreted from different levels, which is more conducive to reveal the complex regulation mechanisms of animal growth and development [18,19,20]. Diarrhea in rabbits might cause intestinal flora disorder, change intestinal permeability, and then cause intestinal inflammation and metabolic dysfunction [21].Some studies, through multi-omit techniques discovery, found that intestinal microorganisms are involved in host nutrient uptake, transport, and metabolic process [22,23]. However, there are few studies on the multi-omics characteristics and differentially expressed genes of gut microbes and metabolites in rabbits with diarrhea. Thus, the aim of this study was to explore the metabolites related to diarrhea by exploring the differential microorganisms in cecum, and identify the differential immune factors, and establishment of a metabolic regulatory network in diarrhea with feeding of antibiotic-free diet. This research might provide a theoretical basis for further understanding the pathogenesis of diarrhea in rabbits and the preparation of new feeds with health effects.

2. Materials and Methods

2.1. Ethics Statement

This study was approved and conducted in accordance with the ethical standards of the Institutional Animal Care and Use Committee of the College of Animal Science and Technology, Sichuan Agricultural University, Sichuan, 611130, China.

2.2. Animals and Feeding Conditions

The study was carried out in a rabbitry in Leibo County, Sichuan Province. All rabbits were raised under the conventional feeding conditions in the rabbitry. Each rabbit was raised in a clean rabbit cage (600 × 600 × 500 mm), with free drinking water, and fed local commercial rabbit feed. In July 2020, the rabbitry used the antibiotic-free diet based on the national regulation. Subsequently, the rabbits showed typical diarrhea symptoms, such as decreased appetite, thin feces, and mixed blood and jelly-like mucus in feces.

2.3. Sample Collection

Twelve 40-day-old Hyplus female rabbits with similar body weight and no kinship within three generations were selected, including six rabbits with typical diarrhea symptoms (Dia_Ce) and six healthy rabbits (Con_Ce). After fasting for 24 h, the rabbits were slaughtered with conventional methods. Then, the cecum and its contents were collected immediately. Six microbial samples, transcriptome samples, and metabolome samples were collected separately from each rabbit, and all samples were stored in liquid nitrogen until they were sent to Novogene (Beijing) for sequencing.

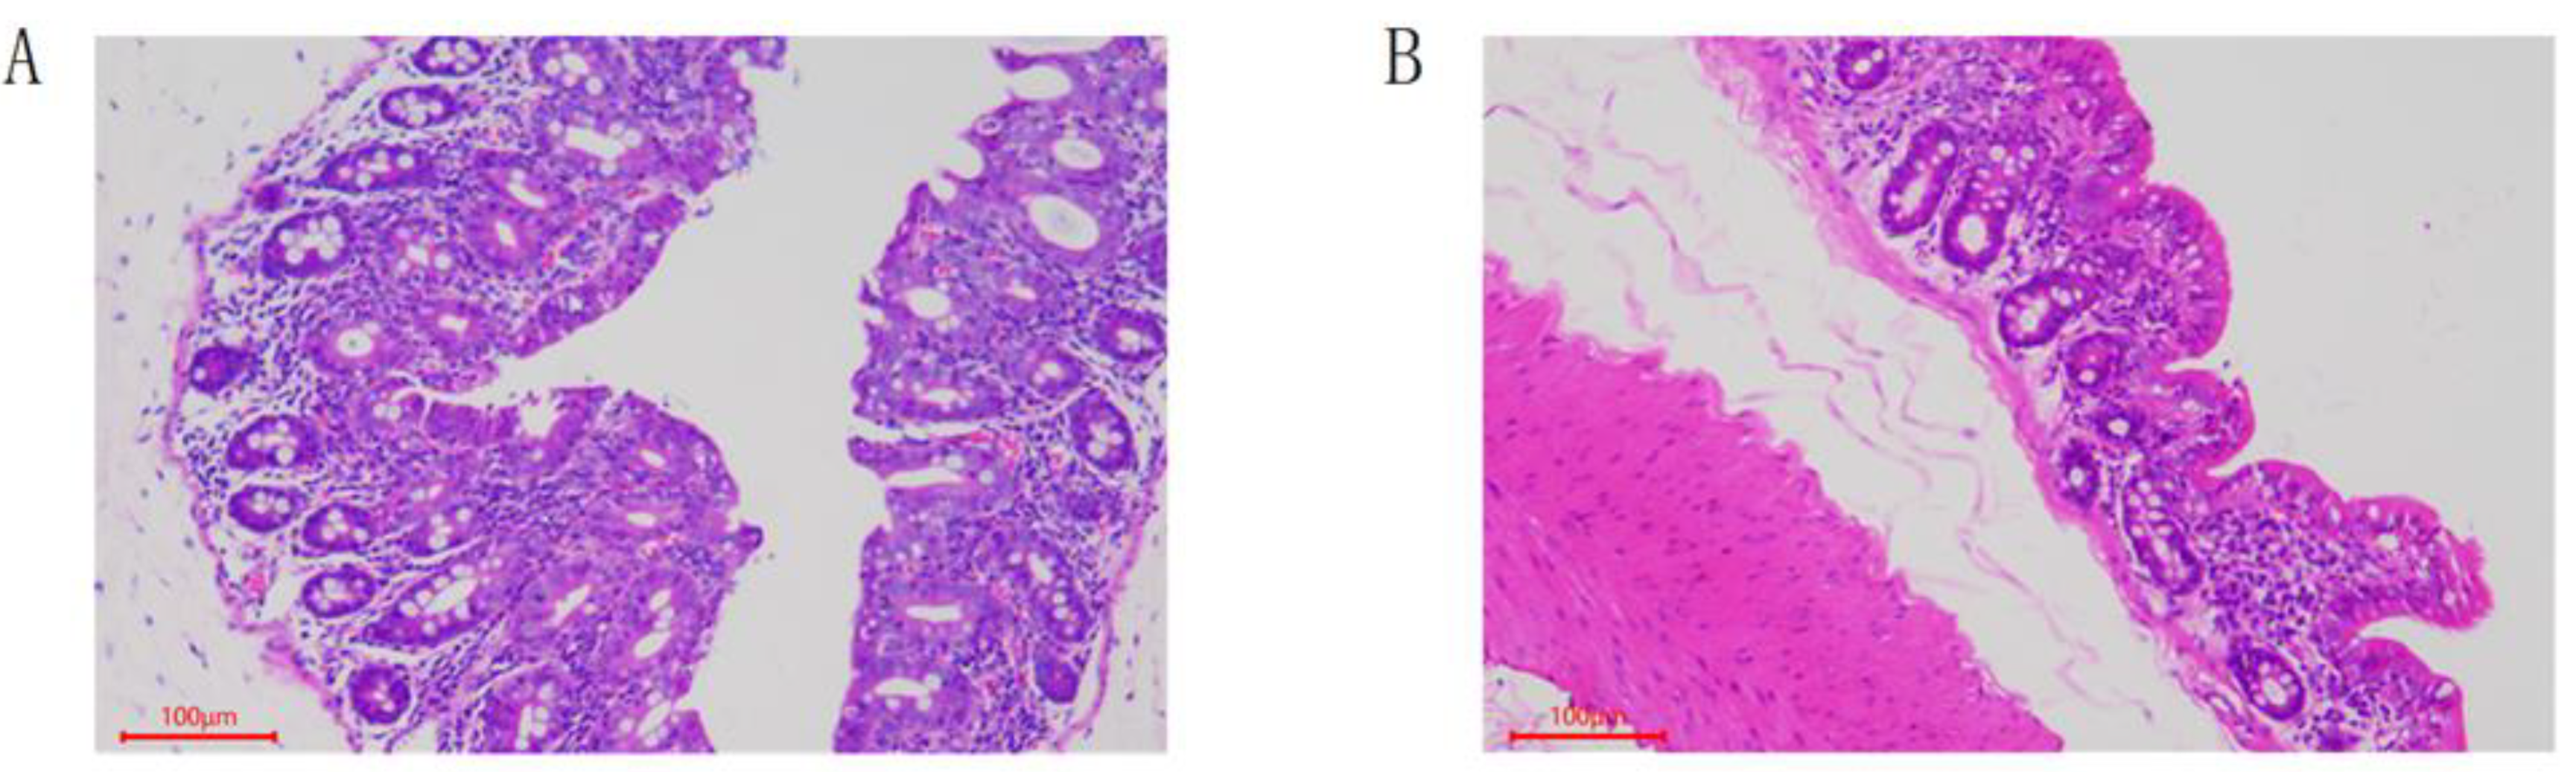
2.4. Pathological Analysis

In this study, six rabbits with typical diarrhea symptoms and six normal rabbits were selected for observation of cecum morphology. After dehydration and paraffin embedding, the cecum tissue samples were sliced by RM2235 microtome (Leica, Germany). After xylene dewaxing, they were water washed for 20 min and stained with hematoxylin and eosin (HE). The histopathological features, using CX22 microscope (OLMPUS, Japan), were observed and photographed using Leica microscopic imaging system (DM1000, Leica, Germany).

2.5. DNA Extraction, 16S rRNA Sequencing, and Sequence Analysis

Total genome DNA from cecum feces was extracted using CTAB/SDS method [24]. Construction of library and sequencing was performed according to conventional methods. Sequence analysis was performed using UPARSE [25]. Sequences with similarity ≥97% were assigned to the same OTUs, and the chimeric sequences were determined by UCHIME [26]. Then, mothur method and SILVA SSUrRNA database were used to annotate the species classification information of each OTUs representative sequence [27,28]. Finally, the data of each sample were homogenized and analyzed by bioinformatics.
Alpha diversity is applied in analyzing complexity of species diversity for a sample through indices, including Chao1, Shannon, and Simpson et al.; all of these indices in our samples were calculated with QIIME (Version1.9.1, Novogene, Beijing, China) and displayed with R software (Version 2.15.3, Novogene, Beijing, China). We used a Venn map to identify the number of unique and common OTUs in different groups. LEfSe software was used for linear discriminant analysis (LDA) and effect size (LEfSe) analysis to identify different bacterial groups in different groups, and high-dimensional biomarkers were found. The screening value of LDA score was set as 4 by default to determine the most identifiable bacterial group.

2.6. Transcriptome Sequencing and Differentially Expressed Genes Analysis

RNA extraction, library construction, and sequencing were performed by Novogene (Beijing). To ensure the quality and reliability of data analysis, we needed to filter the original data (mainly including the removal of low-quality reads, reads containing N (N means undetermined base information), and reads with adapters) and calculate the contents of Q20, Q30, and GC in the clean data. Then, HISAT2 was used to compare the paired clean reads with the reference genome of rabbits to obtain the localization information of reads on the reference genome [29]. Differentially expressed genes (DEGs) were analyzed using DESeq2 [30] and edgeR [31] software. The p-values were adjusted using the Benjamini and Hochberg method. Corrected p-value of 0.05 and absolute foldchange of 2 were set as the threshold for significantly differential expression. ClusterProfile software was used for GO functional enrichment analysis and KEGG pathway enrichment analysis of differential gene sets. A p-value < 0.05 was used as the threshold of significant enrichment for both GO and KEGG enrichment analysis.

2.7. UHPLC-MS/MS-Based Non-Targeted Metabolomics Analysis

The metabolites in cecum contents were extracted with 80% methanol aqueous solution. Each sample was detected by LC–MS with 20 μL for quality control (QC). UHPLC–MS/MS analysis was completed in Novogene (Beijing). The raw data files generated by UHPLC–MS/MS were processed using the Compound Discoverer 3.1 (CD3.1, Thermo Fisher, Wilmington, DE, USA) to perform peak alignment, peak picking, and quantitation for each metabolite [32].
Principal component analysis (PCA) and partial least squares discriminant analysis (PLS-DA) [33] were performed at metaX [34]. We applied univariate analysis (t-test) to calculate the statistical significance (p-value). The metabolites with VIP (variable importance in the projection) > 1 and p-value < 0.05 and FC (fold change) ≥ 2 or FC ≤ 0.5 were considered to be differential metabolites [35,36,37]. Volcano plots were used to filter metabolites of interest which were based on log2 (fold change) and −log10 (p-value) of metabolites. Finally, the functions of these metabolites and metabolic pathways were studied using the KEGG database; when p-value of metabolic pathway < 0.05, metabolic pathway was considered as statistically significant enrichment.

2.8. Association Analysis

Pearson correlation analysis was employed to measure the correlation between microbial community diversity and metabolites in cecum feces samples, and the correlation coefficient (r) was (−1, 1). Two experimental factors were negatively correlated when r < 0; when r > 0, two experiment factors were positively correlated. If r = 0, there was no correlation between two experiment factors. All the obtained differential genes and differential metabolites were mapped to the KEGG pathway database to obtain their common pathway information.

2.9. Statistical Analysis

Statistical analyses were performed using SPSS 27.0 software (IBM, Chicago, IL, USA), and the significant difference analysis between the two groups were performed with t-test. A p-value < 0.05 showed significant difference, and p-value < 0.01 showed extremely significant difference.

3. Results

3.1. Pathological Features

The HE-staining result of the cecum tissue sections is shown in Figure 1. The cecum mucosal layer of the Dia_Ce group was hyperemia, the cells fell off locally in the epithelium, and the lymphocytes increased in the lamina propria. Conversely, the cecum physiological structure of the Con_Ce group was complete, and the cells were arranged neatly, without obvious histopathological damage.

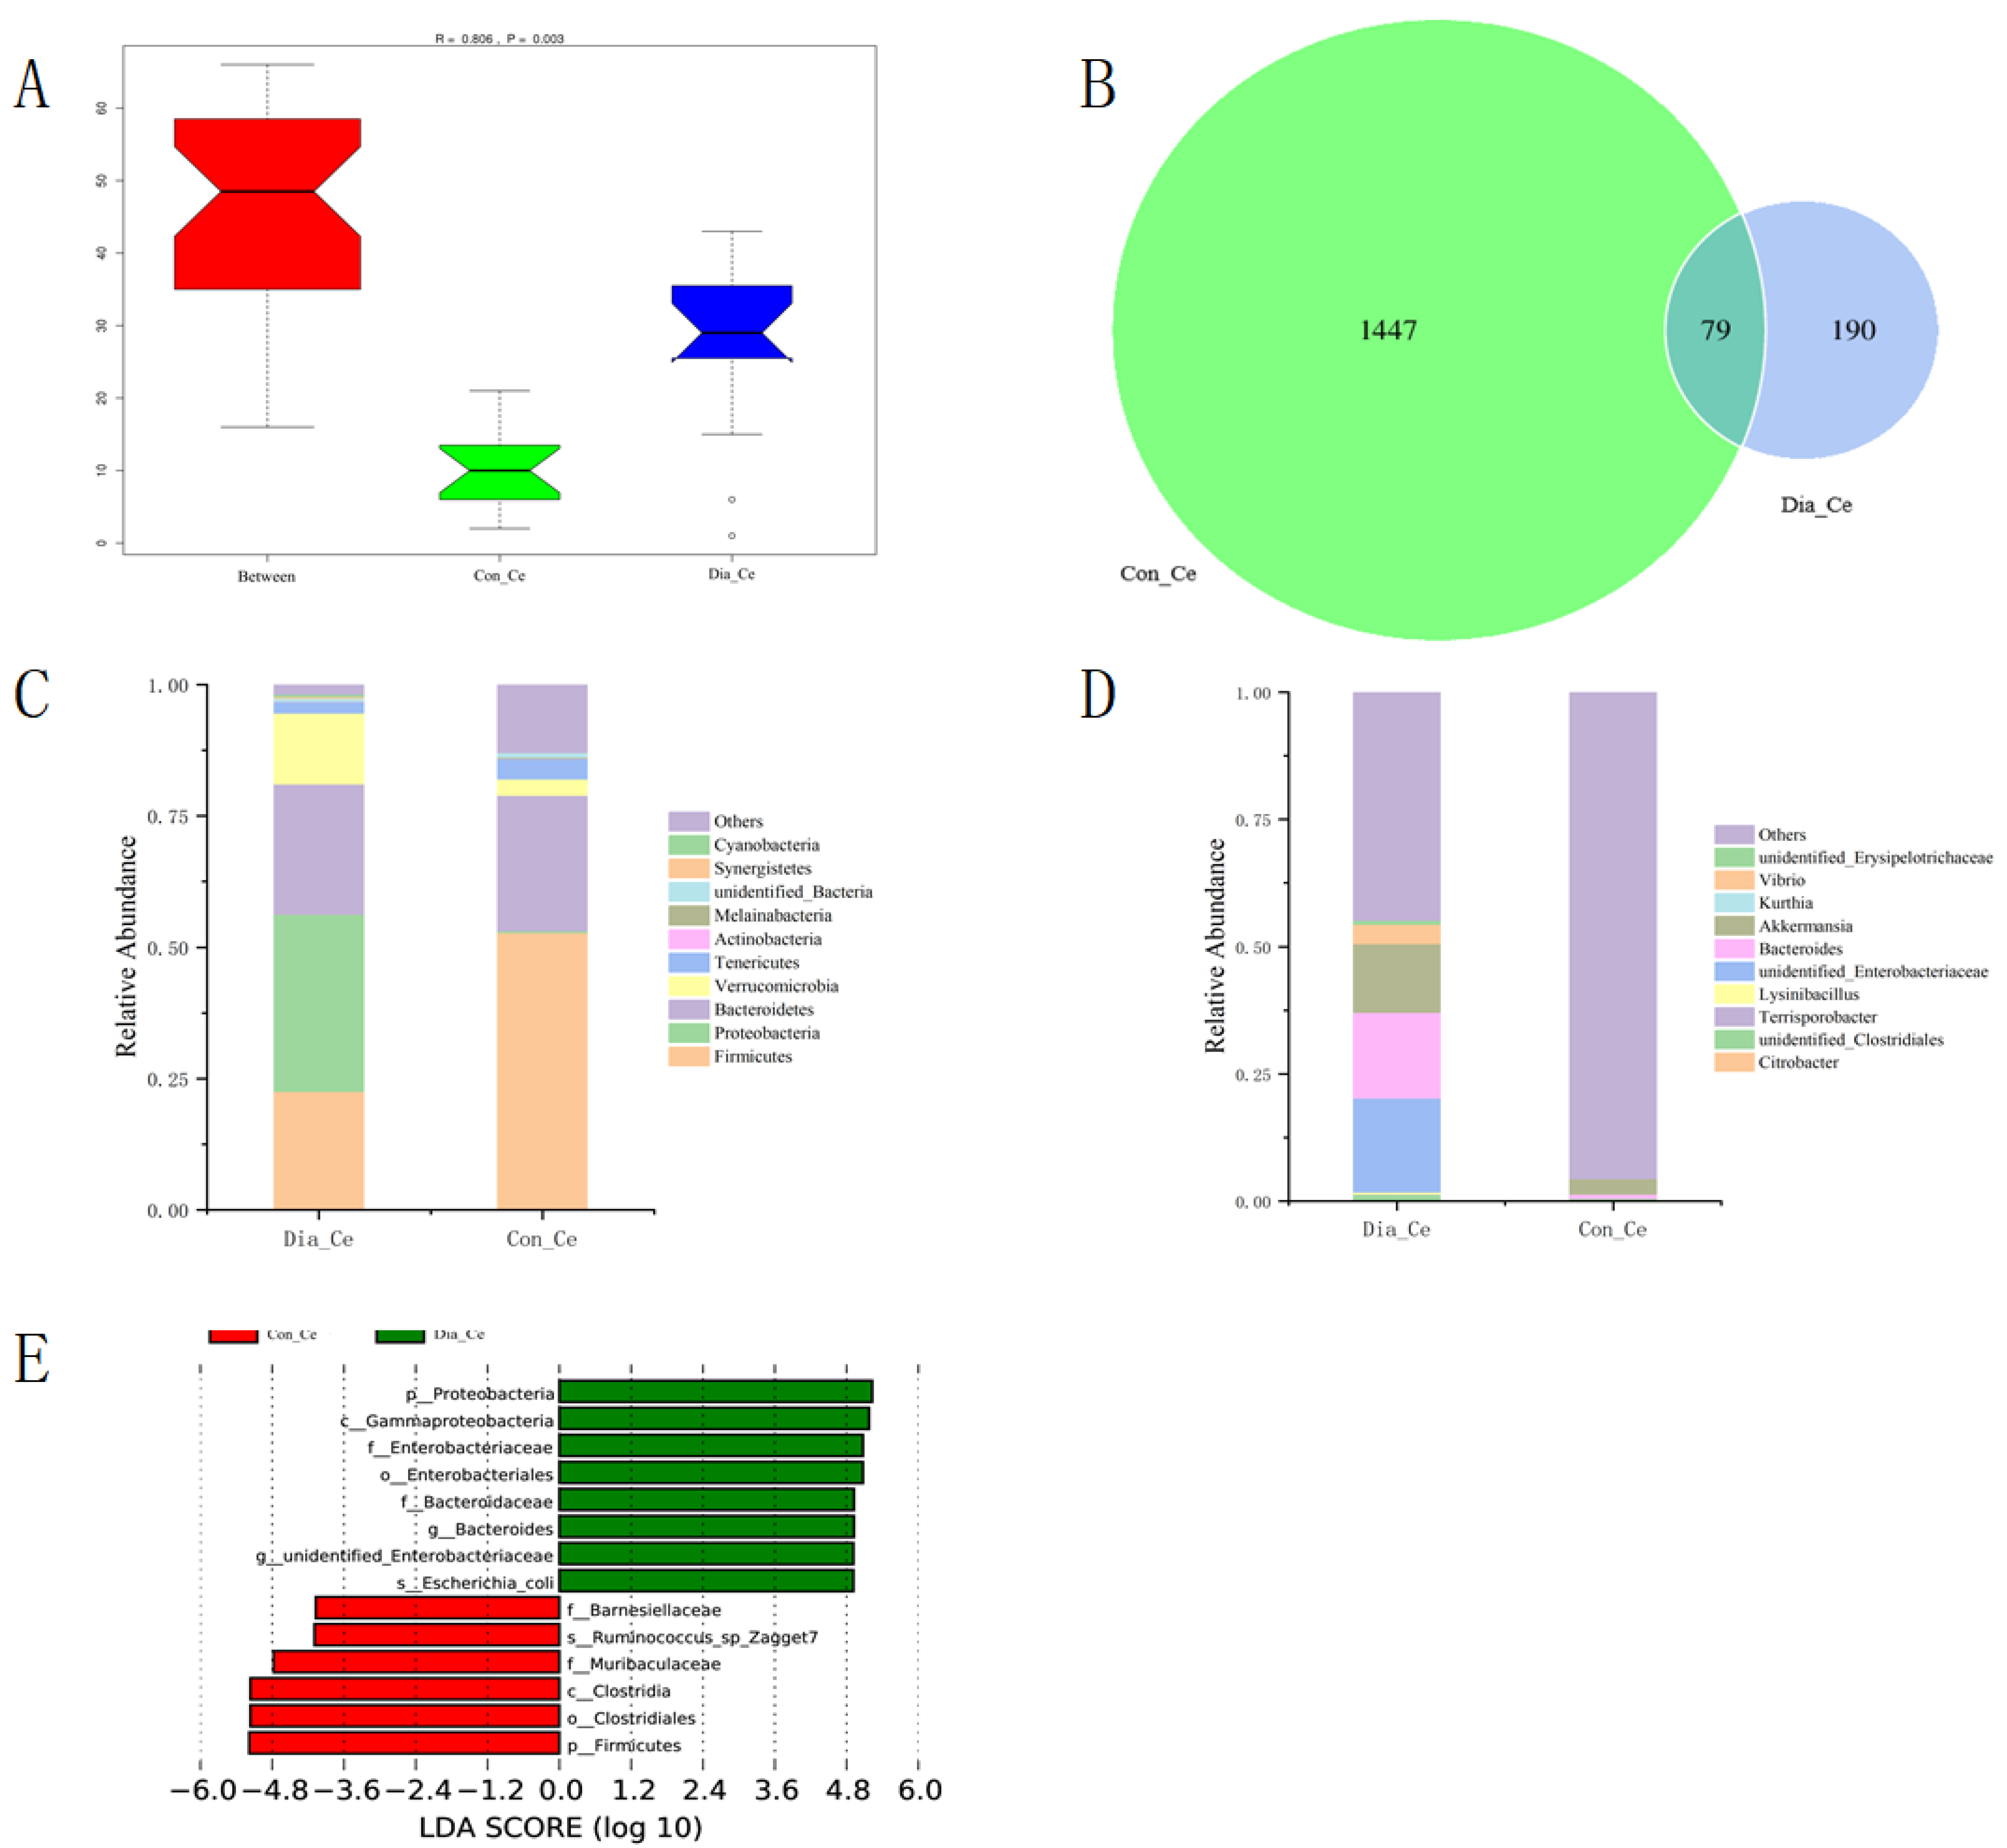
3.2. The Diversity of Fecal Microflora

A total of 79,069 clean reads were obtained, with an average of 1098 reads per sample (Table S1). Then we used ANOSIM (Figure 2A) to visualize the differences between different groups. There were significant differences in microbial composition between the two groups. The Chao1 index, Shannon index, and Simpson index were significantly decreased in Dia_Ce (Table 1). Unique OUT in Dia_Ce was significantly lower than that in Con_Ce (Figure 2B).
The dominant groups of cecum bacteria were basically the same, which were Firmicutes, Bacteroidetes, and Proteobacteria (accounting for 78.89~81.05% of the total bacteria) (Table S2), but its abundance showed difference between the two groups. At the phylum level, the relative abundance of Firmicutes decreased significantly (p < 0.01), while the relative abundance of Proteobacteria increased significantly (p < 0.05). In addition, the relative abundance of Verrucomicrobia, Synergistetes, and Cyanobacteria increased in the Dia_Ce group, while the relative abundance of Actinobacteria and Bacteroidetes decreased (Figure 2C). At the order level, the microbial flora in Dia_Ce was mainly Enterobacteriales (26.47%), while the microbial flora in Con_Ce were mainly Clostridiales and Bacteroidia, and their relative abundances reached 49.30% and 25.71%, respectively (Table 2). The microbial composition of the two groups showed similar differences at genus level (Figure 2D). Then, the differences of bacterial groups were analyzed by LEfSe, and the characteristics of diarrhea-related bacteria were discussed, which can be used as biomarkers. A total of 14 phylum types were identified from phylum to species, and LDA score > 4 was a high-dimensional biomarker (Figure 2E). It is noteworthy that the biomarkers of Dia_Ce group were Enterobacteriales, Bacteroides, unidentified_Enterobacteriaceae, and Escherichia_coli, while the biomarkers of Con_Ce group were Muribaculaceae, Ruminococcus_sp_Zagget7, and Barnesiellaceae.

3.3. The Transcriptome of Rabbits with Diarrhea

With optimization and quality control, a total of 234.069 GB high-quality readings were obtained. The average amount of data for each sample was about 6.75 GB, and the Q30 (%) of all samples was greater than 88%. The GC content in two groups was about 44~57% (Table S3), which met the requirements of transcriptome sequencing and further analysis and statistics, and in 36 sequencing samples, the number of reads that can be mapped to the genome accounted for more than 84% of all sequencing samples, indicating no pollution during sequencing (Table 3).
A total of 334 differential expression genes (DEGs) were screened out in the Dia_Ce group (p < 0.05), including 155 upregulated genes and 179 downregulated genes (Figure 3A). In order to further study the functional distribution of 334 differentially expressed genes (DEGs), GO enrichment analysis results showed that a total of 2803 GO terms were mapped to differential expression genes (DEGs), of which 34 GO terms were mapped. The biological processes (BP) were mainly “cellular response to cytokine stimulus”, “response to cytokines”, “response to external biotic stimulus”, and “response to other organisms” (Figure 3B). In addition, DEGs were further analyzed by KEGG pathway, and the upregulated DEGs were mainly related to IL-17 signaling pathway, hematopoietic cell lineage, and viral protein interaction with cytokines and cytokine receptor (Figure 3C). Particularly, IL-17 signaling pathway and related genes MMP1, S100A9, and CXCL8 were significantly upregulated in Dia_Ce, and downregulated DEGs were mainly associated with vascular smooth muscle contraction and oxytocin signaling pathway.

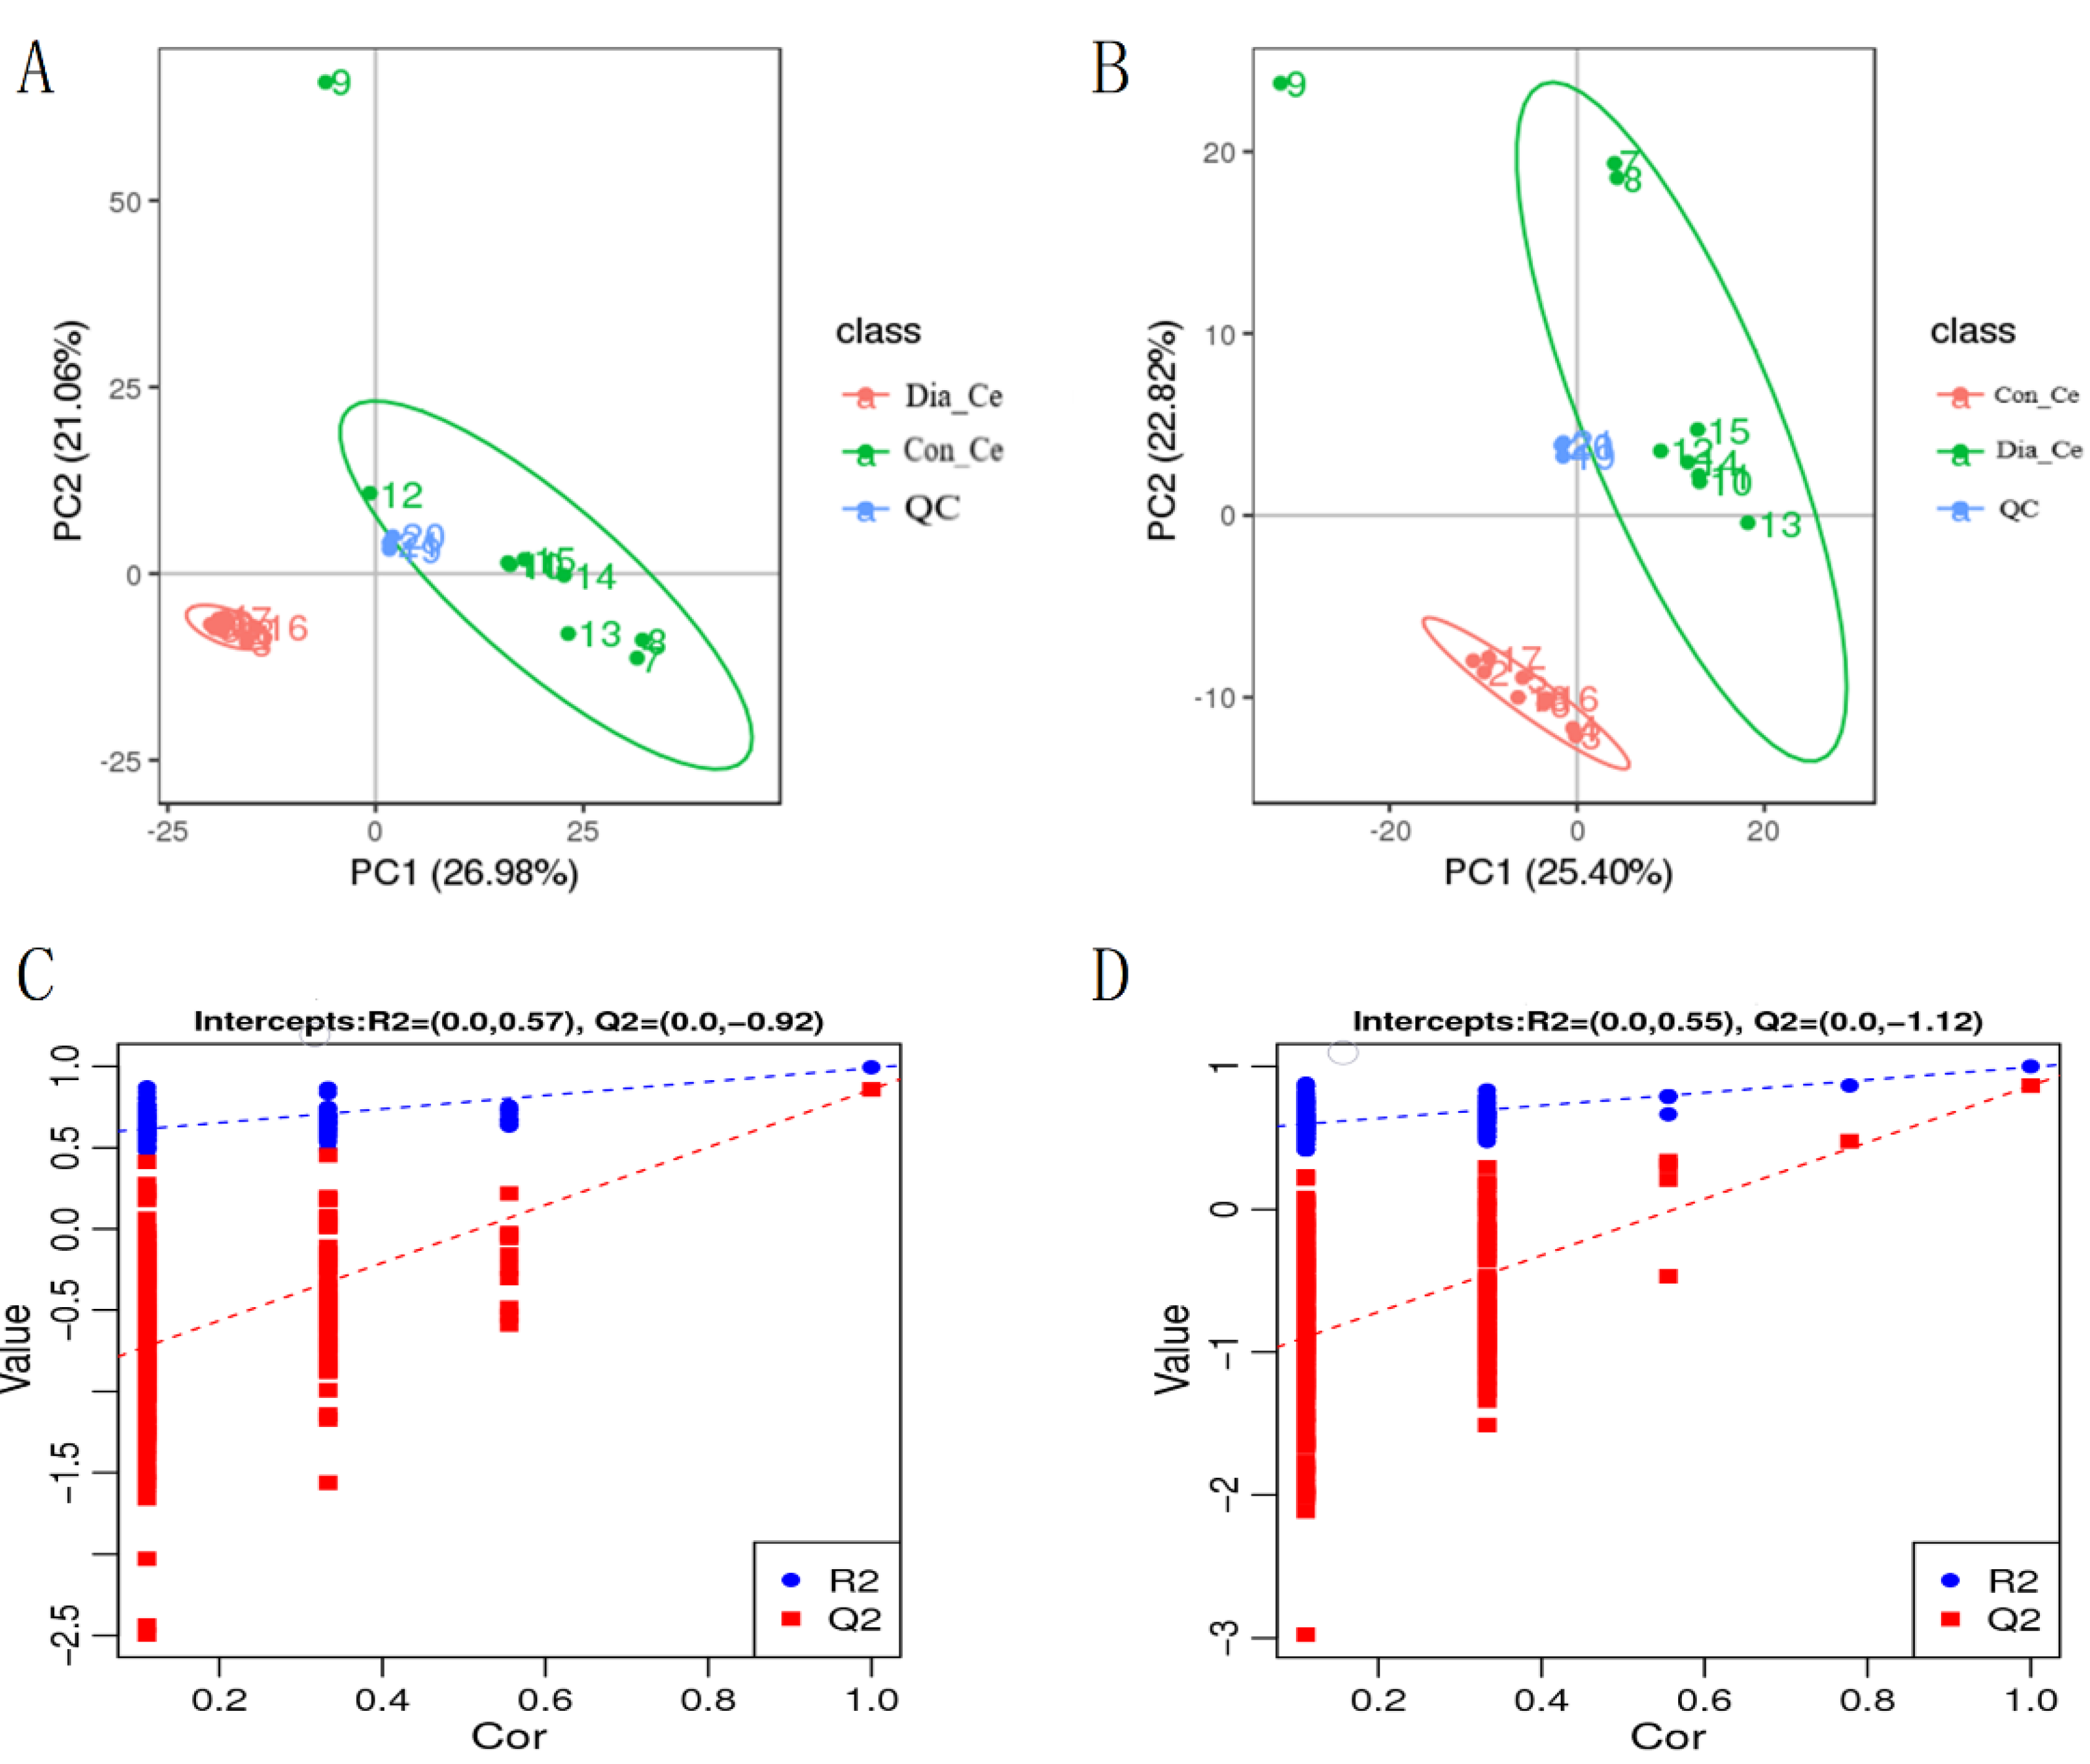
3.4. Analysis of Differential Metabolites

The PCA analysis showed that metabolites were well separated into two groups (Figure 4A,B), and the QC samples were closely assembled in positive and negative ion modes, indicating that the repeatability of this experiment was good. In addition, the PLS-DA comparison diagram showed that there were significant differences between the two groups under positive and negative ion modes (Figure 4C,D).
Using endogenous substances with thresholds of VIP > 1.0, FC > 1.5, or FC < 0.667 and p-value < 0.05, a total of 652 metabolites were identified in Dia_Ce, among which 485 differential metabolites were identified in the positive ion mode, including 307 upregulation and 178 downregulation (Table 4). There were 167 differential metabolites in negative ion mode, including 102 upregulated and 65 downregulated (Figure 5A,B). The KEGG enrichment results are shown in Table 5. Bile secretion and amino sugar and nucleotide sugar metabolism were the most enriched pathways in Dia_Ce under positive ion mode (Figure 5C). In anion mode, the most enriched pathways were antifolate resistance, taste transduction, and alpha-linolenic acid metabolism (Figure 5D).

3.5. Correlation Analysis of DMs and the Cecum Bacteria and DEGs

In the positive and negative ion mode, a total of 20 metabolites (including myricetin, ursolic acid, etc.) were positively correlated with the changes of Fournierella, and eight metabolites ((phenyl) methanone oxime, 4−oxo−4,5,6,7−tetrahydrobenzo [38] furan−3−carboxylic acid, spiculisporic acid, etc.) were negatively correlated (Figure 6A,B). According to the KEGG pathway annotation information for different genes and metabolites, most differential metabolites and DEGs are enriched in PI3K-Akt signaling pathway, vitamin digestion and absorption, and bile secretion (Figure 6C,D).

4. Discussion

Diversity of gut microbes plays an important role in adaptation to environment and stable production performance of livestock and poultry [39,40]. In the study, 16S rRNA sequencing analysis showed that the alpha diversity index of microbial flora in the diarrhea group was significantly reduced, indicating that feeding with non-resistant diets reduced the disease resistance of rabbits [41,42], which is consistent with previous studies showing that the growth performance and immune performance of livestock depend on the stability of intestinal microbial flora structure [43,44]. The relative abundance of Proteobacteria was significantly different between the two groups. Antibiotics might reduce the contribution of Proteobacteria to host metabolism and digestion, while antibiotic-free diets may enhance its effect on host. Bacteroides and Firmicutes were involved in fermentation, and provide nutrition for the host [45,46]. Firmicutes and Bacteroidetes could promote energy metabolism and collection by increasing carbohydrate metabolism and improving lipid metabolism [47,48]. The relative abundances of Firmicutes and Bacteroidetes decreased in varying degrees, and the ratio of Firmicutes/Bacteroidetes showed a downward trend in the Dia_Ce group, indicating that the lack of antibiotics might reduce the intestinal ability to absorb nutrients and convert energy.
At the genus level, several dominant genera showed significant differences between the two groups, among which, Enterobacteriales was more abundant in the intestine of diarrheal rabbits. Previous studies showed that the abundance of Enterobacteriales was associated with low intestinal barrier function, which allows antigens from diet or bacteria to enter the circulation and activate the immune system [49]; it is speculated that Enterobacteriaceae might be involved in immune and metabolic defects in diarrhea.
The results showed that the relative abundance of Firmicutes in Con_Ce was significantly higher than that in Dia_Ce, and the LDA score was higher. Increased relative abundance of Firmicutes produced more short-chain fatty acids (SCFAs). Some studies showed that SCFAs might affect anti-inflammatory ability by regulating immune cell chemotaxis and reactive oxygen species release, inhibiting the production of proinflammatory cytokines TNF-α, IL1β, and nitric oxide, and the activity of NF-κB [50,51]. In short, the environment of the cecum of rabbit is complex, and its flora balance is easily damaged by stimulation. Diarrhea destroys the integrity of tight junction structure and physiological function between cecum epithelial cells, and increases cecum permeability, which reduces the abundance of beneficial bacteria and increases the probability of intestinal diseases.
Interestingly, most DEGs (including FABP6, S100A9, TNFAIP3, etc.) were enriched in stress and inflammatory responses by functional enrichment analysis. Downregulation of FABP6 expression occurred in Dia_Ce. As is known, FABP6 is part of the bile acid recovery system transported in the intestine. Intracellular bile acid binding protein FABP6 [52] and deletion of FABP6 gene in mice can lead to poor bile acid absorption [53], resulting in decreased immunity. S100A9 participates in innate immunity and mediates inflammatory response caused by infection [54]. TNFAIP3 (also known as A20) is a ubiquitin-modifying enzyme [55]. Some diseases related to TNFAIP3, such as inflammatory bowel diseases, involve the function of intestinal barrier [56,57,58]. Many studies have shown that TNFAIP3 is a protein related to intestinal diseases and can promote the function of intestinal barrier [59]. In the study, TNFAIP3 was abnormally expressed in the cecum tissues of diarrheal rabbits, indicating that diarrhea might cause damage to cecum barrier function and adversely affect autoimmunity in rabbits. In addition, some studies reported that IL-17 is a cytokine family (A–F) composed of six members, including inducing cytokines and chemokines involved in inflammatory reactions [60,61]. The abnormal expression of IL-17 family members would lead to autoimmune diseases and inflammation. In the study, CXCL8, CXCL5, CASP3, and other EDGs enriched in IL-17 signaling pathway were significantly upregulated, which might be related to the inflammatory and immune response of the cecum of diarrheal rabbits.
Due to the severe influence of intestinal microflora on intestinal metabolism, flora imbalance changes host metabolism [62]. Non-targeted metabolomics analysis of cecal feces further proved that diarrhea changed the metabolic function of the rabbits. There were significant differences in metabolites in two groups, which should be related to the different composition of cecum microorganisms. Some studies have found that myricetin has beneficial anticancer, antiviral, cell protection, treatment of cardiovascular disease, antioxidant, anti-inflammatory, and anti-obese effects [63,64,65]. In the study, myricetin was significantly downregulated in Dia_Ce, leading to the occurrence of cecum inflammation in rabbits, which was consistent with the results of previous transcriptome analysis. Bile acid could promote the digestion and absorption of lipids and vitamins in the intestinal tract, improve the immune function of the body, and maintain the health of the body [66,67]. BA regulates BA metabolism through binding to the related receptors, and it could be used as a key signal molecule to regulate glucose, lipids, and energy metabolism [68,69]. BAs might play a role in the enhancement of epithelial permeability associated with intestinal diseases [70], and rabbit intestinal inflammation is associated with bile acid levels [21].
Moreover, lithocholic acid is a kind of bile acid that protects intestinal epithelial barrier [71]. Studies [72] have found that the core of lithocholic acid AAA-10 is an effective tool to inhibit bile salt hydrolase activity and regulate bile acid pool composition in vivo. The use of anti-free diet reduced the content of lithocholic acid in the bile secretion metabolic pathway in the cecum of the rabbits, which might cause the metabolic disorders in the cecum of the host and reduce the immunity of the body.
The metabolic balance of the host is closely related to the stability of intestinal flora [73]. In the study, the changes of myricetin and ursolic acid were positively correlated with the level of Fournierella, and ursolic acid was enriched in tryptophan metabolism. Tryptophan metabolic disorder could cause intestinal microbial metabolic disorder and induce intestinal inflammation in rabbits [21,74]. In addition, Fournierella is a newly discovered genus in recent years that is sensitive to antibiotics such as amoxicillin, erythromycin, gentamicin, and penicillin G [75]. Combined with the previous description, we speculate that Fournierella might be involved in the bile secretion and the tryptophan metabolism in diarrhea-afflicted rabbits. In addition, we found that PI3K-Akt signaling pathway, vitamin digestion and absorption, and bile secretion had common pathways for the enrichment of most differential metabolites and DEGs.

5. Conclusions

The study found that the relative abundances of Firmicutes and Proteobacteria changed significantly in diarrhea-afflicted rabbits, and the differential metabolites were enriched and upregulated in bile secretion and tryptophan metabolism, which led to the decrease of nutrient absorption and energy-conversion ability in rabbits, and also caused the imbalance of intestinal mucosal immunity and inflammatory response and metabolic process. It is speculated that Fournierella might be one important reason for diarrhea in rabbits. Further research should be carried out to verify the function of DEGs in rabbit.

Supplementary Materials

The following supporting information can be downloaded at: The following are available online at https://www.mdpi.com/article/10.3390/ani12091194/s1, Table S1: Summary statistics of the 16S rRNA gene sequencing results. Table S2: Relative abundances of the top 11 components of the microbiota at the phylum level. Table S3: Summary statistics of the RNA sequencing results.

Author Contributions

J.W. and S.L.: conception of the research; S.X., H.F., Y.C., M.W. and Z.K.: collection of data for analysis; K.Z. wrote the manuscript; J.W. revised the manuscript. All authors have read and agreed to the published version of the manuscript.

Funding

This study was funded by high quality and characteristic rabbit breeding materials and method innovation and new variety breeding (breeding research project), key R&D project of Sichuan Province (2021YFYZ0033); National rabbit industry technology system meat rabbit variety improvement (CARS-43-A-2).

Institutional Review Board Statement

The authors confirm that this study was performed in accordance with the Guidelines of Good Experimental Practices adopted by the Institute of Animal Science of the Sichuan Agricultural University, Chengdu, China. All experimental protocols involving animals were approved by the Animal Care and Use Committee for Biological Studies, Sichuan Province, China (DKY-B2019302083).

Informed Consent Statement

Not applicable.

Data Availability Statement

All the figures and tables used to support the results of this study are included.

Acknowledgments

We thank other authors for help for this study. All authors read and approved the final manuscript.

Conflicts of Interest

The authors declare no conflict of interest.

References

  1. Tang, Y.Q.; Ye, Q.; Zheng, W.Y. Research Status and Development of Antibiotics. World Notes Antibiot. 2019, 40, 295–301. [Google Scholar]
  2. Rosen, G.D. Applications of antibacterials in pig and poultry nutrition. Feed Comp. 1995, 15, 35–37. [Google Scholar]
  3. Danzeisen, J.L.; Kim, H.B.; Isaacson, R.E.; Tu, Z.J.; Johnson, T.J. Modulations of the Chicken Cecal Microbiome and Metagenome in Response to Anticoccidial and Growth Promoter Treatment. PLoS ONE 2011, 6, e27949. [Google Scholar] [CrossRef]
  4. Low, C.; Tan, L.; Ab Mutalib, N.-S.; Pusparajah, P.; Goh, B.-H.; Chan, K.-G.; Letchumanan, V.; Lee, L.-H. Unveiling the Impact of Antibiotics and Alternative Methods for Animal Husbandry: A Review. Antibiotics 2021, 10, 578. [Google Scholar] [CrossRef]
  5. Mingmongkolchai, S.; Panbangred, W. Bacillus probiotics: An alternative to antibiotics for livestock production. J. Appl. Microbiol. 2018, 124, 1334–1346. [Google Scholar] [CrossRef]
  6. Beltz, K.M.; Rosales, M.M.; Morales, E. Histological and ultrastructural findings in commercial bred rabbits exhibiting severe diarrhea. Scand. J. Lab. Anim. Sci. 2005, 32, 243–250. [Google Scholar]
  7. Prud′Hon, M.; Bel, L.J. Early weaning of young rabbits and reproduction in does. Ann. Zootech. 1968, 17, 23–30. [Google Scholar]
  8. Chen, Y.; Yan, S.; Zhu, C.; Yu, T.; Huang, W.; Huang, J.; Kong, Q.; Shi, J.; Chen, Z.; Liu, Q.; et al. Studying the Differences of Bacterial Metabolome and Microbiome in the Colon between Landrace and Meihua Piglets. Front. Microbiol. 2017, 8, 1812. [Google Scholar]
  9. Umesaki, Y.; Setoyama, H. Structure of the intestinal flora responsible for development of the gut immune system in a rodent model. Microbes and Infection 2000, 2, 1343–1351. [Google Scholar] [CrossRef]
  10. Tremaroli, V.; Bäckhed, F. Functional interactions between the gut microbiota and host metabolism. Nature 2012, 489, 242–249. [Google Scholar] [CrossRef]
  11. Murphy, K.; Bloom, S.R. Gut hormones and the regulation of energy homeostasis. Nature 2006, 444, 854–859. [Google Scholar] [CrossRef]
  12. García, J.; Nicodemus, N.; Carabaño, R.; De Blass, J.C. Effect of inclusion of defatted grape seed meal in the diet on digestion and performance of growing rabbits. J. Anim. Sci. 2002, 80, 162–170. [Google Scholar] [CrossRef]
  13. Salisu, I.B.; Shahid, A.A.; Yaqoob, A.; Gul, A.; Rao, A.Q. Evaluation the effect of subchronic feeding of transgenic cotton line (CKC1) on the faecal microbiota of albino rabbits. J. Anim. Physiol. Anim. Nutr. 2021, 105, 354–363. [Google Scholar] [CrossRef] [PubMed]
  14. Delgado, R.; Nicodemus, N.; Guaman, R.M.A.; Saste, J.; Menoyo, D.; Carabano, R.; Garcia, J. Effect of dietary soluble fibre and n-6/n-3 fatty acid ratio on growth performance and nitrogen and energy retention efficiency in growing rabbits. Anim. Feed Sci. Technol. 2018, 239, 44–54. [Google Scholar] [CrossRef]
  15. Crespo, R.; Alfonso, C.; del Barrio, A.S.; García-Ruiz, A.I.; Marco, M.; Nicodemus, N. Effect of feed restriction on performance, carcass yield and nitrogen and energy balance in growing rabbits. Livest. Sci. 2020, 241, 104278. [Google Scholar] [CrossRef]
  16. Zorn, A.M.; Wells, J.M. Vertebrate Endoderm Development and Organ Formation. Annu. Rev. Cell Dev. Biol. 2009, 25, 221–251. [Google Scholar] [CrossRef] [Green Version]
  17. Peterson, L.W.; Artis, D. Intestinal epithelial cells: Regulators of barrier function and immune homeostasis. Nat. Rev. Immunol. 2014, 14, 141–153. [Google Scholar] [CrossRef]
  18. Malmuthuge, N.; Liang, G.; Guan, L.L. Regulation of rumen development in neonatal ruminants through microbial metagenomes and host transcriptomes. Genome Biol. 2019, 20, 172. [Google Scholar] [CrossRef] [Green Version]
  19. Wang, J.; Chen, L.; Li, P.; Li, X.; Zhou, H.; Wang, F.; Li, D.; Yin, Y.; Wu, G. Gene Expression Is Altered in Piglet Small Intestine by Weaning and Dietary Glutamine Supplementation. J. Nutr. 2008, 138, 1025–1032. [Google Scholar] [CrossRef] [Green Version]
  20. Hu, C.H.; Xiao, K.; Luan, Z.S.; Song, J. Early weaning increases intestinal permeability, alters expression of cytokine and tight junction proteins, and activates mitogen-activated protein kinases in pigs. J. Anim. Sci. 2013, 91, 1094–1101. [Google Scholar] [CrossRef] [Green Version]
  21. Tang, T.; Li, Y.; Wang, J.; Elzo, M.; Shao, J.; Li, Y.; Xia, S.; Fan, H.; Jia, X.; Lai, S. Untargeted Metabolomics Reveals Intestinal Pathogenesis and Self-Repair in Rabbits Fed an Antibiotic-Free Diet. Animals 2021, 11, 1560. [Google Scholar] [CrossRef] [PubMed]
  22. Meng, Q.; Luo, Z.; Cao, C.; Sun, S.; Ma, Q.; Li, Z.; Shi, B.; Shan, A. Weaning Alters Intestinal Gene Expression Involved in Nutrient Metabolism by Shaping Gut Microbiota in Pigs Frontiers in Microbiology. Front. Microbiol. 2020, 11, 694. [Google Scholar] [CrossRef] [PubMed]
  23. Su, Y.; Li, X.; Li, D.; Sun, J. Fecal Microbiota Transplantation Shows Marked Shifts in the Multi-Omic Profiles of Porcine Post-weaning Diarrhea. Front. Microbiol. 2021, 12, 619460. [Google Scholar] [CrossRef] [PubMed]
  24. Zhou, J.; Bruns, M.A.; Tiedje, J.M. DNA recovery from soils of diverse composition. Appl. Environ. Microbiol. 1996, 62, 316–322. [Google Scholar] [CrossRef] [PubMed] [Green Version]
  25. Edgar, R.C. UPARSE: Highly accurate OTU sequences from microbial amplicon reads. Nat. Methods 2013, 10, 996–998. [Google Scholar] [CrossRef] [PubMed]
  26. Edgar, R.C.; Haas, B.J.; Clemente, J.C.; Christopher, Q.; Knight, R. UCHIME improves sensitivity and speed of chimera detection. Bioinformatics 2011, 27, 2194–2200. [Google Scholar] [CrossRef] [Green Version]
  27. Wang, Q.; Garrity, G.M.; Tiedje, J.M.; Cole, J.R. Naive Bayesian classifier for rapid assignment of rRNA sequences into the new bacterial taxonomy. Appl. Environ. Microbiol. 2007, 73, 5261–5267. [Google Scholar] [CrossRef] [Green Version]
  28. Quast, C.; Pruesse, E.; Yilmaz, P.; Gerken, J.; Schweer, T.; Yarza, P.; Peplis, J.; Glockner, F.O. The SILVA ribosomal RNA gene database project: Improved data processing and web-based tools. Nucl. Acids Res. 2013, 41, D590–D596. [Google Scholar] [CrossRef]
  29. Mortazavi, A.; Williams, B.A.; McCue, K.; Schaeffer, L.; Wold, B. Mapping and quantifying mammalian transcriptomes by RNA-Seq. Nat. Methods 2008, 5, 621–628. [Google Scholar] [CrossRef]
  30. Love, M.I.; Huber, W.; Anders, S. Moderated estimation of fold change and dispersion for RNA-seq data with DESeq2. Genome Biol. 2014, 15, 550. [Google Scholar] [CrossRef] [Green Version]
  31. Robinson, M.D.; McCarthy, D.J.; Smyth, G.K. EdgeR: A Bioconductor package for differential expression analysis of digital gene expression data. Bioinformatics 2010, 26, 139–140. [Google Scholar] [CrossRef] [PubMed] [Green Version]
  32. Dai, W.; Xie, D.; Lu, M.; Li, P.; Lv, H.; Yang, C.; Peng, Q.; Zhu, Y.; Guo, L.; Zhang, Y.; et al. Characterization of white tea metabolome: Comparison against green and black tea by a nontargeted metabolomics approach. Food Res. Int. 2017, 96, 40–45. [Google Scholar] [CrossRef] [PubMed]
  33. Anne-Laure, B.; Strimmer, K. Partial least squares: A versatile tool for the analysis of high-dimensional genomic data. Brief. Bioinf. 2007, 8, 32–44. [Google Scholar]
  34. Wen, B.; Mei, Z.; Zeng, C.; Liu, S. metaX: A flexible and comprehensive software for processing metabolomics data. BMC Bioinform. 2017, 18, 183. [Google Scholar] [CrossRef] [Green Version]
  35. Heischmann, S.; Quinn, K.; Cruickshank-Quinn, C.; Liang, L.-P.; Reisdorph, R.; Reisdorph, N.; Patel, M. Exploratory Metabolomics Profiling in the Kainic Acid Rat Model Reveals Depletion of 25-Hydroxyvitamin D3 during Epileptogenesis. Sci. Rep. 2016, 6, 31424. [Google Scholar] [CrossRef] [Green Version]
  36. Haspel, J.A.; Chettimada, S.; Shaik, R.S.; Chu, J.-H.; Raby, B.A.; Cernadas, M.; Carey, V.; Process, V.; Hunninghake, G.M.; Ifedigbo, E.; et al. Circadian rhythm reprogramming during lung inflammation. Nat. Commun. 2014, 5, 4753. [Google Scholar] [CrossRef]
  37. Sreekumar, A.; Poisson, L.M.; Rajendiran, T.M.; Khan, A.P.; Cao, Q.; Yu, J.; Laxman, B.; Mehra, R.; Lonigro, R.J.; Li, Y.; et al. Metabolomic profiles delineate potential role for sarcosine in prostate cancer progression. Nature 2009, 457, 910–914. [Google Scholar] [CrossRef] [Green Version]
  38. Salazar-Martinez, E.; Romano-Riquer, P.; Yanez-Marquez, E.; Longnecker, M.P.; Hernandez-Avila, M. Anogenital distance in human male and female newborns: A descriptive, cross-sectional study. Environ. Health 2004, 3, 8. [Google Scholar] [CrossRef] [Green Version]
  39. Abdelqader, A.; Al-Fataftah, A.-R.; Das, G. Effects of dietary Bacillus subtilis and inulin supplementation on performance, eggshell quality, intestinal morphology and microflora composition of laying hens in the late phase of production. Anim. Feed Sci. Technol. 2013, 179, 103–111. [Google Scholar] [CrossRef]
  40. Mountzouris, K.C.; Tsitrsikos, P.; Palamidi, I.; Arvaniti, A.; Mohnl, M.; Schatzmayr, G.; Fegeros, K. Effects of probiotic inclusion levels in broiler nutrition on growth performance, nutrient digestibility, plasma immunoglobulins, and cecal microflora composition. Poult. Sci. 2010, 89, 58–67. [Google Scholar] [CrossRef]
  41. Zhang, Y.; Ma, W.; Zhang, Z.; Liu, F.; Wang, J.; Yin, Y.; Wang, Z. Effects of Enterococcus faecalis on egg production, egg quality and caecal microbiota of hens during the late laying period. Arch. Anim. Nutr. 2019, 73, 208–221. [Google Scholar] [CrossRef] [PubMed]
  42. Hansen, J.; Gulati, A.; Sartor, R.B. The role of mucosal immunity and host genetics in defining intestinal commensal bacteria. Curr. Opin. Gastroenterol. 2010, 26, 564–571. [Google Scholar] [CrossRef] [PubMed]
  43. Dietert, R.R. The Microbiome in Early Life: Self-Completion and Microbiota Protection as Health Priorities. Birth Defects Res. Part B Dev. Reprod. Toxicol. 2014, 101, 333–340. [Google Scholar] [CrossRef]
  44. Sleator, R.D. The human superorganism—Of microbes and men. Med. Hypotheses 2010, 74, 214–215. [Google Scholar] [CrossRef] [PubMed]
  45. Huffnagle, G.B. Chapter 40—Gastrointestinal Microbial Ecology with Perspectives on Health and Disease. In Physiology of the Gastrointestinal Tract; Elsevier Inc.: Amsterdam, The Netherlands, 2012. [Google Scholar]
  46. Wexler, M.H. Bacteroides: The Good, the Bad, and the Nitty-Gritty. Clin. Microbiol. Rev. 2007, 20, 593–621. [Google Scholar] [CrossRef] [PubMed] [Green Version]
  47. Shin, N.-R.; Whon, T.W.; Bae, J.-W. Proteobacteria: Microbial signature of dysbiosis in gut microbiota. Trends Biotechnol. 2015, 33, 496–503. [Google Scholar] [CrossRef]
  48. Turnbaugh, P.J.; Hamady, M.; Yatsunenko, T.; Cantarel, B.L.; Duncan, A.; Ley, R.E.; Sogin, M.L.; Jones, W.J.; Roe, B.A.; Affourtit, J.P.; et al. A core gut microbiome in obese and lean twins. Nature 2009, 457, 480–484. [Google Scholar] [CrossRef] [Green Version]
  49. Pedersen, C.; Ijaz, U.Z.; Gallagher, E.; Horton, F.; Ellis, R.J.; Jaiyeola, E.; Duparc, T.; Russell-Jones, D.; Hinton, P.; Cani, P.D.; et al. Fecal Enterobacteriales enrichment is associated with increased invivo intestinal permeability in humans. Physiol. Rep. 2018, 6, e13649. [Google Scholar] [CrossRef]
  50. Saemann, M.D.; Bohmig, G.A.; Osterreicher, C.H.; Burtscher, H.; Parolini, O.; Diakos, C.; Stockl, J.; Horl, W.H.; Zlabinger, G.J. Anti-inflammatory effects of sodium butyrate on human monocytes: Potent inhibition of IL-12 and up-regulation of IL-10 production. FASEB J. 2000, 14, 2380–2382. [Google Scholar] [CrossRef]
  51. Cavaglieri, C.R.; Nishiyama, A.; Fernandes, L.C.; Curi, R.; Miles, E.A.; Calder, P.C. Differential effects of short-chain fatty acids on proliferation and production of pro- and anti-inflammatory cytokines by cultured lymphocytes. Life Sci. 2003, 73, 1683–1690. [Google Scholar] [CrossRef]
  52. Zwicker, B.L.; Agellon, L.B. Transport and biological activities of bile acids. Int. J. Biochem. Cell Biol. 2013, 45, 1389–1398. [Google Scholar] [CrossRef] [PubMed]
  53. Praslickova, D.; Torchia, E.C.; Sugiyama, M.G.; Magrane, E.J.; Zwicker, B.L.; Kolodzieyski, L.; Agellon, L.B. The Ileal Lipid Binding Protein Is Required for Efficient Absorption and Transport of Bile Acids in the Distal Portion of the Murine Small Intestine. PLoS ONE 2012, 7, e50810. [Google Scholar] [CrossRef] [PubMed] [Green Version]
  54. Okada, K.; Arai, S.; Itoh, H.; Adachi, S.; Hayashida, M.; Nakase, H.; Ikemoto, M. CD68 on rat macrophages binds tightly to S100A8 and S100A9 and helps to regulate the cells’ immune functions. J. Leukoc. Biol. 2016, 100, 1093–1104. [Google Scholar] [CrossRef] [Green Version]
  55. Vereecke, L.; Beyaert, R.; van Loo, G. The ubiquitin-editing enzyme A20 (TNFAIP3) is a central regulator of immunopathology. Trends Immunol. 2009, 30, 383–391. [Google Scholar] [CrossRef] [PubMed]
  56. Li, M.-Y.; Zhu, M.; Zhu, B.; Wang, Z.-Q. Cholera Toxin Suppresses Expression of Ubiquitin Editing Enzyme A20 and Enhances Transcytosis. Cell. Physiol. Biochem. 2013, 31, 495–504. [Google Scholar] [CrossRef]
  57. Vereecke, L.; Vieira-Silva, S.; Billiet, T.; Van Es, J.H.; Mc Guire, C.; Slowicka, K.; Sze, M.; Born, M.V.D.; De Hertogh, G.; Clevers, H.; et al. A20 controls intestinal homeostasis through cell-specific activities. Nat. Commun. 2014, 5, 5103. [Google Scholar] [CrossRef] [Green Version]
  58. Vereecke, L.; Sze, M.; Mc Guire, C.; Rogiers, B.; Chu, Y.; Schmidt-Supprian, M.; Pasparakis, M.; Beyaert, R.; van Loo, G. Enterocyte-specific A20 deficiency sensitizes to tumor necrosis factor–induced toxicity and experimental colitis. J. Exp. Med. 2010, 207, 1513–1523. [Google Scholar] [CrossRef] [Green Version]
  59. Kolodziej, L.E.; Lodolce, J.P.; Chang, J.E.; Schneider, J.R.; Grimm, W.A.; Bartulis, S.J.; Zhu, X.; Messer, J.S.; Murphy, S.F.; Reddy, N.; et al. TNFAIP3 Maintains Intestinal Barrier Function and Supports Epithelial Cell Tight Junctions. PLoS ONE 2011, 6, e26352. [Google Scholar] [CrossRef] [Green Version]
  60. Nakashima, T.; Jinnin, M.; Yamane, K.; Honda, N.; Kajihara, I.; Makino, T.; Masuguchi, S.; Fukushima, S.; Okamoto, Y.; Hasegawa, M.; et al. Impaired IL-17 Signaling Pathway Contributes to the Increased Collagen Expression in Scleroderma Fibroblasts. J. Immunol. 2012, 188, 3573–3583. [Google Scholar] [CrossRef] [Green Version]
  61. Iwakura, Y.; Ishigame, H. The IL-23/IL-17 axis in inflammation. J. Clin. Investig. 2006, 116, 1218. [Google Scholar] [CrossRef] [Green Version]
  62. Ahmed, I.; Roy, B.C.; Khan, S.A.; Septer, S.; Umar, S. Microbiome, Metabolome and Inflammatory Bowel Disease. Microorganisms 2016, 4, 20. [Google Scholar] [CrossRef] [PubMed] [Green Version]
  63. Choi, H.-N.; Kang, M.-J.; Lee, S.-J.; Kim, J.-I. Ameliorative effect of myricetin on insulin resistance in mice fed a high-fat, high-sucrose diet. Nutr. Res. Pr. 2014, 8, 544–549. [Google Scholar] [CrossRef] [PubMed] [Green Version]
  64. Ding, Y.; Zhang, Z.-F.; Dai, X.-Q.; Li, Y. Myricetin Protects Against Cytokine-Induced Cell Death in RIN-m5f β Cells. J. Med. Food 2012, 15, 733–740. [Google Scholar] [CrossRef] [PubMed]
  65. He, D.; Gu, D.; Huang, Y.; Ayupbek, A.; Yang, Y.; Aisa, H.A.; Ito, Y. Separation and Purification of Phenolic Acids and Myricetin from Black Currant by High-Speed Countercurrent Chromatography. J. Liq. Chromatogr. Relat. Technol. 2009, 32, 3077–3088. [Google Scholar] [CrossRef] [PubMed]
  66. Huang, S.; Ma, S.; Ning, M.; Yang, W.; Ye, Y.; Zhang, L.; Shen, J.; Leng, Y. TGR5 agonist ameliorates insulin resistance in skeletal muscles and improves glucose homeostasis in diabetic mice. Metabolism 2019, 99, 45–56. [Google Scholar] [CrossRef]
  67. Lazarevi, S.; Danic, M.; Golocorbin-Kon, S.; Al-Salami, H.; Mikov, M. Semisynthetic bile acids: A new therapeutic option for metabolic syndrome. Pharmacol. Res. 2019, 146, 104333. [Google Scholar] [CrossRef]
  68. Song, P.; Rockwell, C.E.; Cui, J.Y.; Klaassen, C.D. Individual bile acids have differential effects on bile acid signaling in mice. Toxicol. Appl. Pharmacol. 2015, 283, 57–64. [Google Scholar] [CrossRef]
  69. STanimirov, B.; Stankov, K.; Mikov, M. Bile acid signaling through farnesoid X and TGR5 receptors in hepatobiliary and intestinal diseases. Hepatobil. Pancreat. Dis. Int. 2015, 14, 18–33. [Google Scholar] [CrossRef]
  70. Münch, A.; Ström, M.; Söderholm, J.D. Dihydroxy bile acids increase mucosal permeability and bacterial uptake in human colon biopsies. Scand. J. Gastroenterol. 2007, 42, 1167–1174. [Google Scholar] [CrossRef]
  71. Ward, J.B.J.; Lajczak, N.K.; Kelly, O.B.; O’Dwyer, A.M.; Giddam, A.K.; Gabhann, J.N.; Franco, P.; Tambuwala, M.M.; Jefferies, C.A.; Keely, S.; et al. Ursodeoxycholic acid and lithocholic acid exert anti-inflammatory actions in the colon. Am. J. Physiol. Liver Physiol. 2017, 312, G550–G558. [Google Scholar] [CrossRef] [Green Version]
  72. Adhikari, A.A.; Ramachandran, D.; Chaudhari, S.N.; Powell, C.E.; Li, W.; McCurry, M.D.; Banks, A.S.; Devlin, A.S. A Gut-Restricted Lithocholic Acid Analog as an Inhibitor of Gut Bacterial Bile Salt Hydrolases. ACS Chem. Biol. 2021, 16, 1401–1412. [Google Scholar] [CrossRef] [PubMed]
  73. Levy, M.; Blacher, E.; Elinav, E. Microbiome, metabolites and host immunity. Curr. Opin. Microbiol. 2017, 35, 8–15. [Google Scholar] [CrossRef] [PubMed]
  74. Cheng, Y.; Jin, U.-H.; Allred, C.D.; Jayaraman, A.; Chapkin, R.S.; Safe, S. Aryl Hydrocarbon Receptor Activity of Tryptophan Metabolites in Young Adult Mouse Colonocytes. Drug Metab. Dispos. 2015, 43, 1536–1543. [Google Scholar] [CrossRef] [PubMed] [Green Version]
  75. Togo, A.; Durand, G.; Khelaifia, S.; Armstrong, N.; Robert, C.; Cadoret, F.; Di Pinto, F.; Delerce, J.; Levasseur, A.; Raoult, D.; et al. Fournierella massiliensis gen. nov., sp. nov., a new human-associated member of the family Ruminococcaceae. Int. J. Syst. Evol. Microbiol. 2017, 67, 1393–1399. [Google Scholar] [CrossRef] [PubMed]
Figure 1. Pathological observation of cecum tissue in rabbits by microscope (HE-staining, 100×). (A) Dia_Ce. (B) Con_Ce.
Animals 12 01194 g001
Figure 2. Comparison of fecal flora in cecum between Dia_Ce and Con_Ce. (A) ANOSIM analysis: R > 0, significant difference in two groups. (B) The number of unique and common OTUs between the two groups shown in the Venn diagram. (C) Relative abundance histogram of species at phylum level. (D) Relative abundance histogram of species at genus level. (E) LDA score of LEfSe–PICRUSt.
Animals 12 01194 g002
Figure 3. Differentially expressed genes in cecum of diarrhea-afflicted rabbits. (A) Volcano map of DEGs in cecum tissue of Con_Ce and Dia_Ce. (B) GO terms of Dia_Ce vs. Con_Ce. (C) KEGG pathways of Dia_Ce vs. Con_Ce.
Animals 12 01194 g003
Figure 4. PCA and PLS-DA of fecal metabolites in cecum. (A,B) PCA score graph between Dia_Ce and Con_Ce; (C,D) permutation test from PLS-DA models. Note: (A,C): cationic mode; (B,D): anion mode.
Animals 12 01194 g004
Figure 5. Differential metabolites and metabolic pathways in cecal feces of diarrhea-afflicted rabbits. (A,B) Volcano of metabolites with significant differences between Dia_Ce and Con_Ce, where A is a positive ion mode and B is a negative ion mode. (C,D) KEGG enrichment bubble diagram, where C is a positive ion mode and D is a negative ion mode.
Animals 12 01194 g005
Figure 6. Correlation of DM with cecum bacteria and DEGs. (A,B) Correlation analysis results of metabolites top20 and 16S differential bacteria top10. (C,D) KEGG enrichment analysis of metabolism and transcription. Note: (A,C) are positive ion modes; (B,D) are negative ion modes.
Animals 12 01194 g006
Table 1. Alpha diversity of intestinal microbial of rabbits.
GroupObservedChao1ShannonSimpsonCoverage (%)
Dia_Ce75.50112.873.620.7896.43
Con_Ce336.331304.056.590.9571.68
SEM98.794619.3890.8020.05911,246
p-value0.0250.0830.0040.01630.052
Table 2. Cecum microflora taxonomic composition at order level.
GroupClostridialesEnterobacterialesBacillalesBacteroidalesVerrucomicrobialesErysipelotrichales
Dia_Ce0.2054040.2647390.0056690.2431970.1349210.013228
Con_Ce0.493008000.2569920.030990.00737
SEM0.0870.1490.0040.1830.0920.005
p-value0.0090.1060.1640.8990.2830.273
Table 3. Statistical table of comparison results between sample sequencing data and selected reference genome sequences.
SampleTotal ReadsTotal MapUnique MapMulti MapPositive MapNegative Map
Dia_Ce_14707970841,829,313
(88.85%)
36,717,519
(77.99%)
5,111,794
(10.86%)
18,315,048
(38.9%)
18,402,471
(39.09%)
Dia_Ce_24070551636,216,676
(88.97%)
33,688,313
(82.76%)
2,528,363
(6.21%)
16,836,322
(41.36%)
16,851,991
(41.4%)
Dia_Ce_34440651038,983,466
(87.79%)
36,626,529
(82.48%)
2,356,937
(5.31%)
18,271,015
(41.14%)
18,355,514
(41.34%)
Con_Ce_14358423038,754,099
(88.92%)
34,649,374
(79.5%)
4,104,725
(9.42%)
17,294,670
(39.68%)
17,354,704
(39.82%)
Con_Ce_24028515634,846,494
(86.5%)
31,066,590
(77.12%)
3,779,904
(9.38%)
15,488,047
(38.45%)
15,578,543
(38.67%)
Con_Ce_34665176839,602,947
(84.89%)
37,114,380
(79.56%)
2,488,567
(5.33%)
18,502,785
(39.66%)
18,611,595
(39.89%)
Table 4. Screening results of metabolites differences.
Compared SamplesNum. of
Total Ident.
Num. of
Total Sig.
Num. of
Sig. Up
Num. of
Sig. Down
Dia_Ce. vs. Con_Ce. pos 1251 485 307 178
Dia_Ce. vs. Con_Ce. neg 493 167 102 65
Table 5. KEGG enrichment analysis of differential metabolites in Hyplus rabbit cecum feces samples from diarrheal rabbits (Dia_Ce) and healthy rabbits (Con_Ce) 1.
Map IDMap Titlep-ValueNMeta IDs
ESI-map04976Bile secretion0.07369105Salicylic acid, Reduced glutathione, Thromboxane B2, Lithocholic Acid, Chenodeoxycholic Acid, Deoxycholic acid
map00520Amino sugar and nucleotide sugar metabolism0.098581105L-Fucose, N-Acetylneuraminic acid, N-Acetyl-α-D-glucosamine 1-phosphate
map00380Tryptophan metabolism0.244399105Quinolinic acid, Picolinic acid
map04152AMPK signaling pathway0.32381105NAD+
ESI+map01523Antifolate resistance0.072914182Folic acid, Guanosine monophosphate, Adenosine 5′-monophosphate, 7,8-Dihydrofolate
map04742Taste transduction0.072914182Serotonin, Guanosine monophosphate, D-Phenylalanine, Adenosine 5′-monophosphate
map00592alpha-Linolenic acid metabolism0.146621182Jasmonic acid, Traumatic acid
1 ESI+: cationic mode; ESI-: Anion mode. Map ID = ID of enriched KEGG pathway; Map Title = Name of enriched KEGG pathway; and N = Number of backg.
Publisher’s Note: MDPI stays neutral with regard to jurisdictional claims in published maps and institutional affiliations.

