
Evaluating Overall Performance in High-Level Dressage Horse–Rider Combinations by Comparing Measurements from Inertial Sensors with General Impression Scores Awarded by Judges

 ,
,  , , , and
Abstract
:Simple Summary
Abstract
1. Introduction
2. Materials and Methods
2.1. Participants
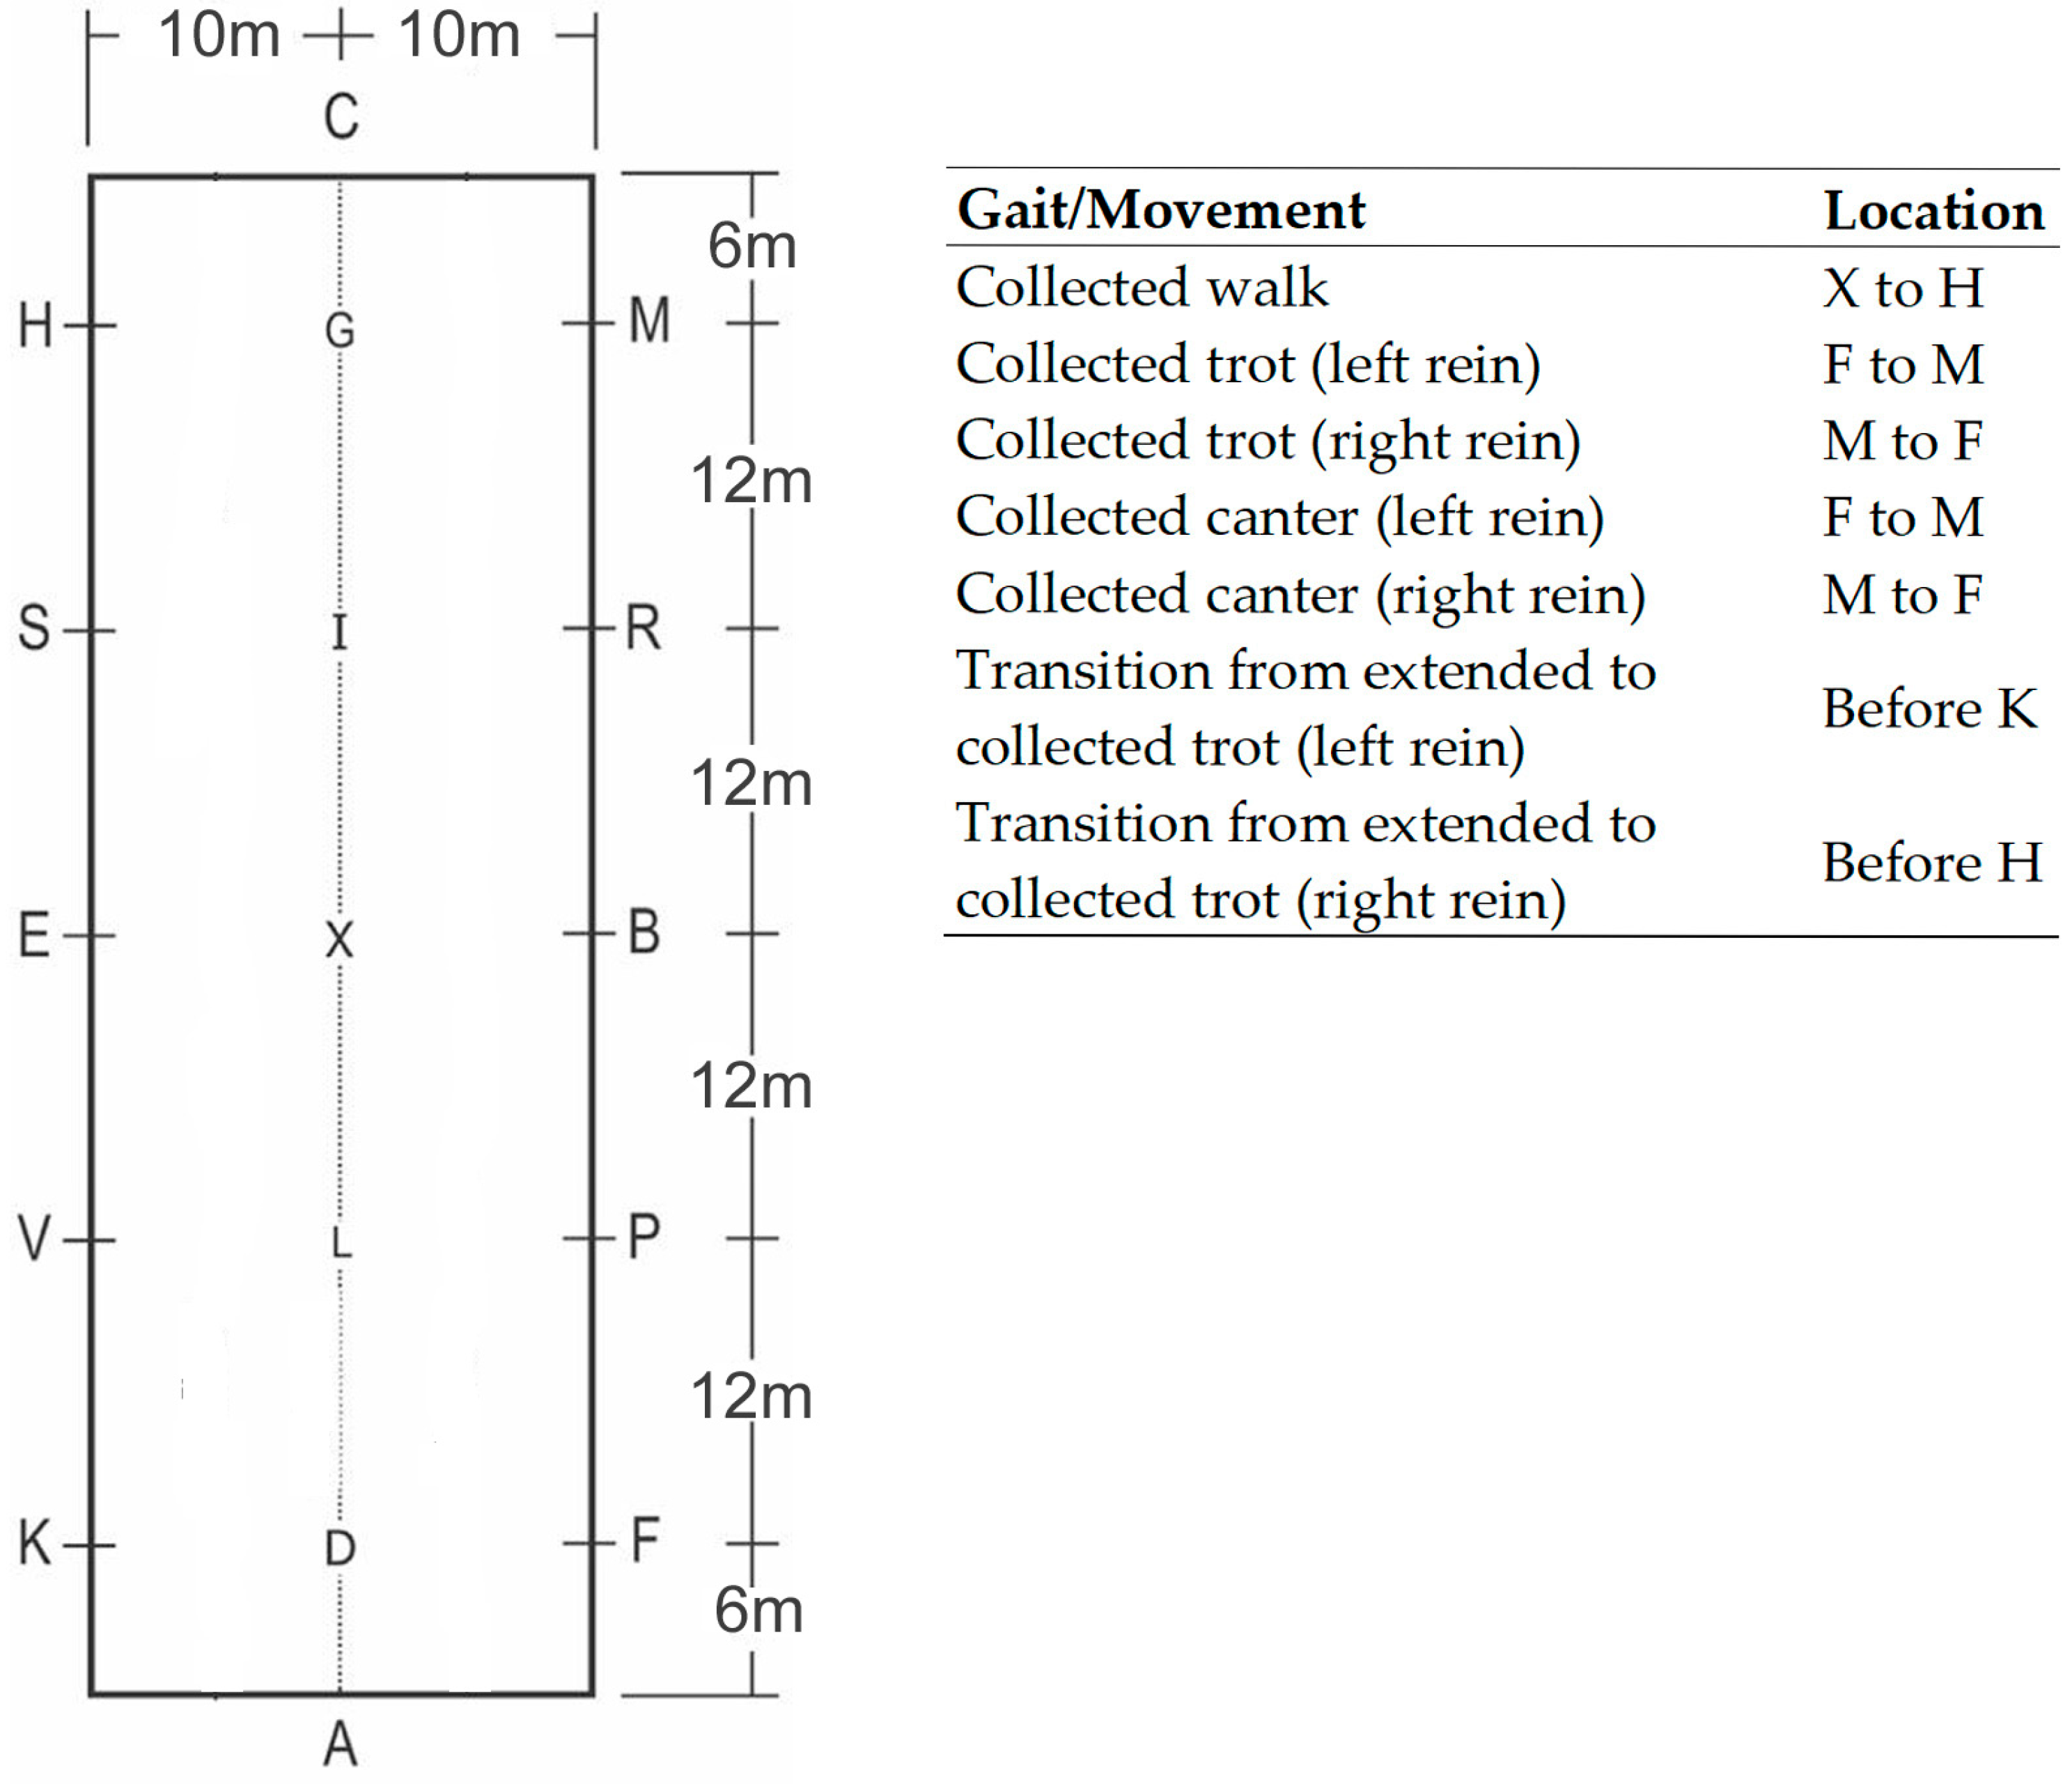
2.2. Procedures
- the rider’s position and seat;
- the use of discreet and effective aids to influence the horse;
- the overall impression of harmony between the rider and the horse.
2.3. Performance Variables
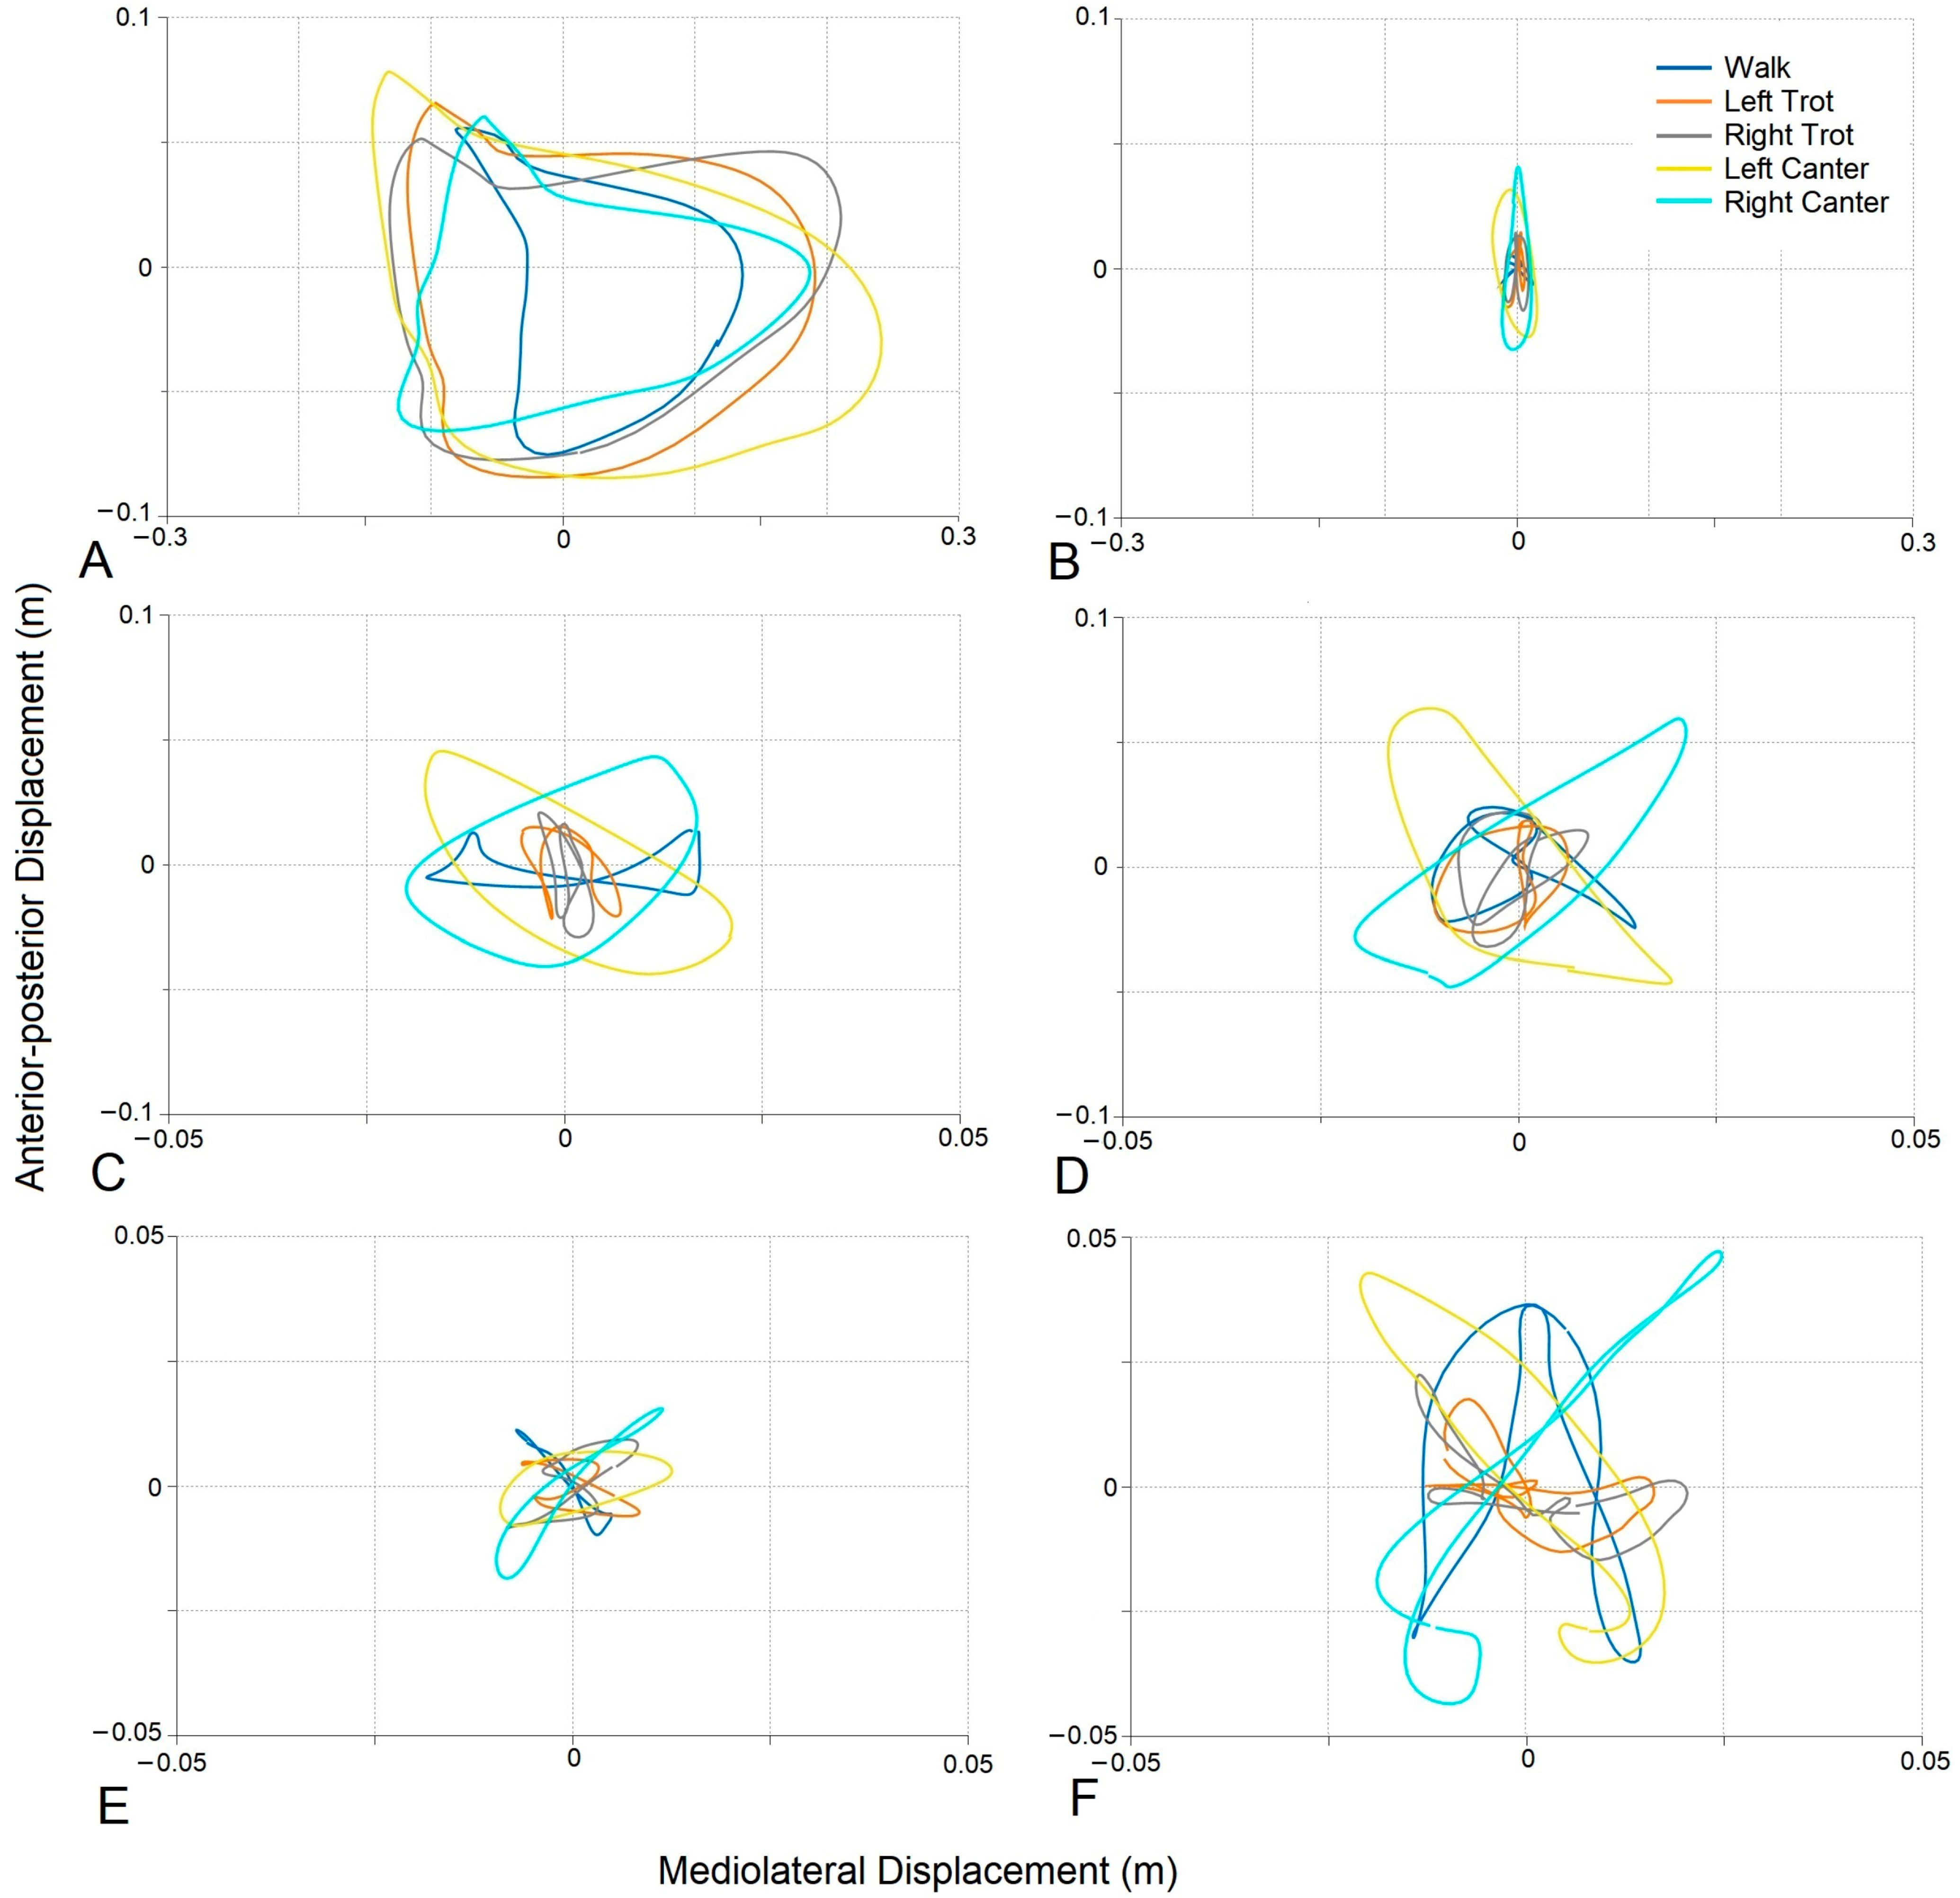
2.3.1. Rider Stability
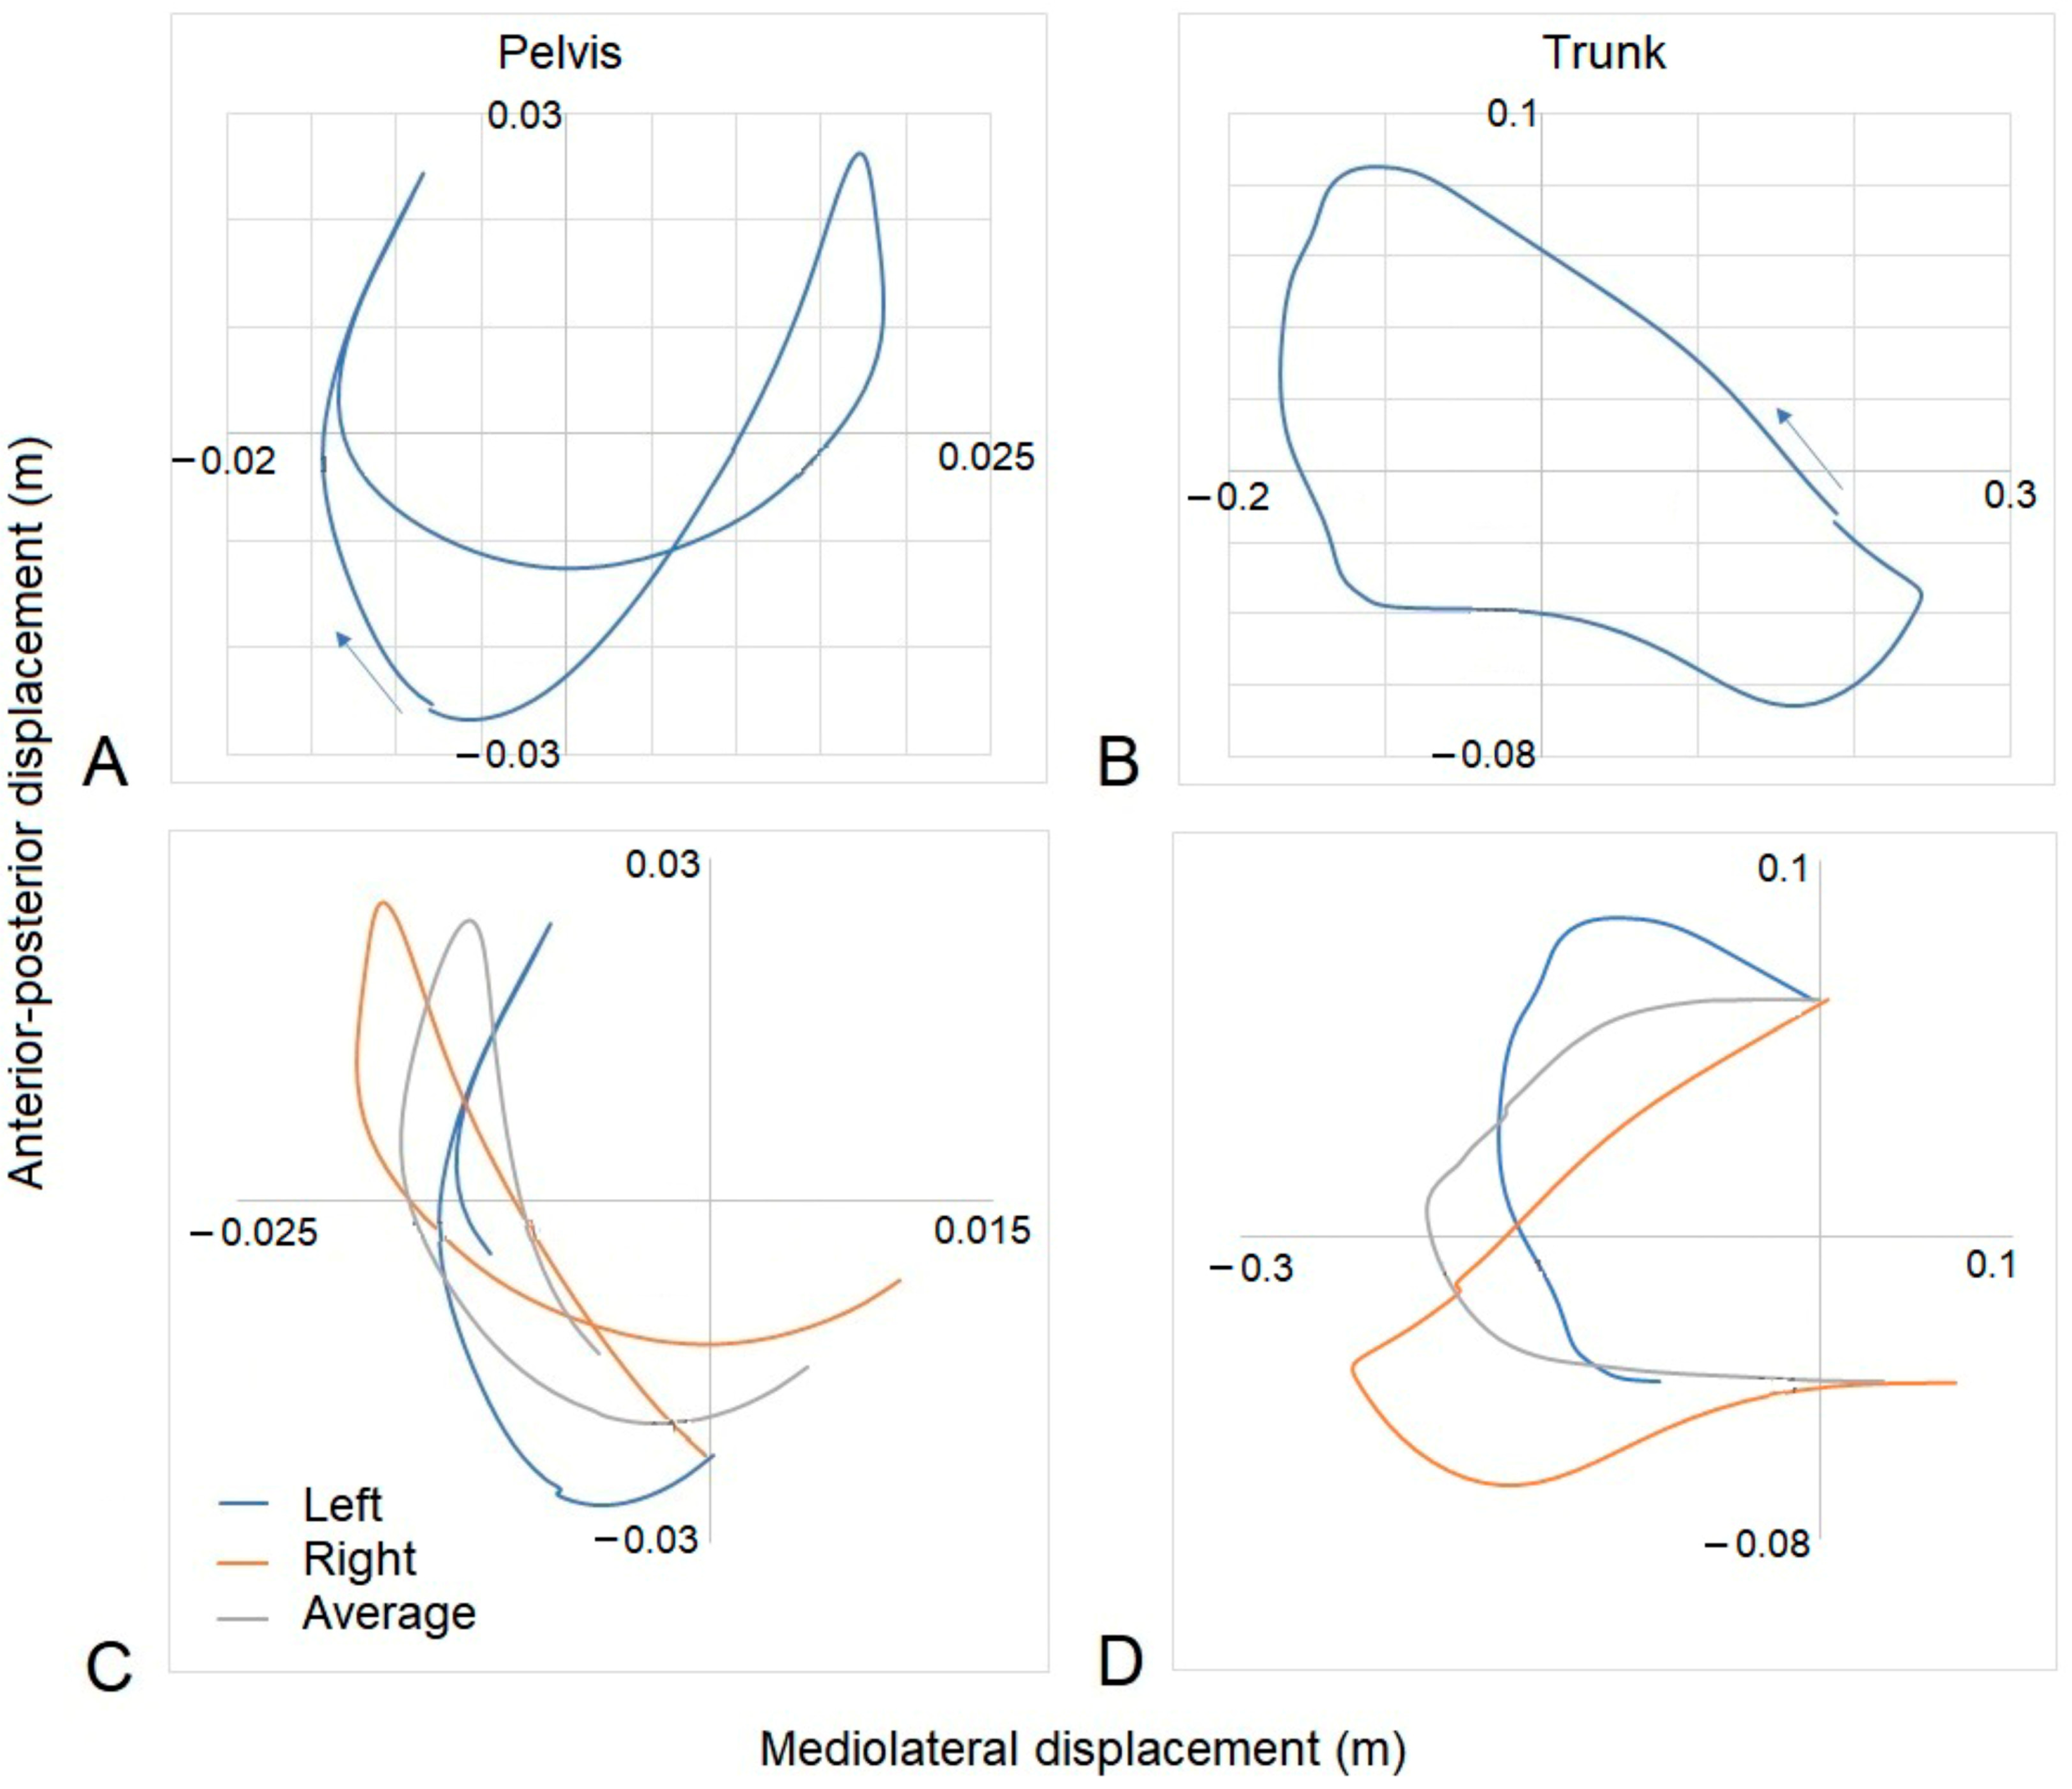
2.3.2. Rider Coordination
2.3.3. Rider Transverse Dynamic Symmetry
- Yi = the mediolateral position (left/right) at that timepoint;
- Zi = the anterior-posterior position (left/right) at that timepoint;
- Yave and Zave = the calculated average positions at that timepoint.
2.4. Statistical Analysis
3. Results
4. Discussion
5. Conclusions
Supplementary Materials
Author Contributions
Funding
Institutional Review Board Statement
Informed Consent Statement
Data Availability Statement
Acknowledgments
Conflicts of Interest
References
- Fédération Equestre Internationale. Dressage Scoring: The Basics. Available online: https://www.fei.org/stories/lifestyle/teach-me/dressage-scoring-basics (accessed on 25 May 2023).
- Fédération Equestre Internationale. FEI Dressage & FEI Para Dressage Guidelines on Use of Tack, Equipment and Dress. Available online: https://inside.fei.org/content/fei-dressage-fei-para-dressage-guidelines-use-tack-equipment-and-dress (accessed on 25 May 2023).
- The Official Instruction Handbook of the German National Equestrian Federation; Completely Revised Edition; Kenilworth: Buckingham, UK, 1997; ISBN 978-1872082936.
- Eckardt, F.; Witte, K. Horse–Rider Interaction: A New Method Based on Inertial Measurement Units. J. Equine Vet. Sci. 2017, 55, 1–8. [Google Scholar] [CrossRef]
- Münz, A.; Eckardt, F.; Witte, K. Horse-rider interaction in dressage riding. Hum. Mov. Sci. 2014, 33, 227–237. [Google Scholar] [CrossRef] [PubMed]
- Wilkins, C.A.; Nankervis, K.; Protheroe, L.; Draper, S.B. Static pelvic posture is not related to dynamic pelvic tilt or competition level in dressage riders. Sports Biomech. 2020, 1–13. [Google Scholar] [CrossRef]
- Baillet, H.; Thouvarecq, R.; Vérin, E.; Tourny, C.; Benguigui, N.; Komar, J.; Leroy, D. Human Energy Expenditure and Postural Coordination on the Mechanical Horse. J. Mot. Behav. 2017, 49, 441–457. [Google Scholar] [CrossRef] [PubMed]
- Kang, O.-D.; Ryu, Y.-C.; Ryew, C.-C.; Oh, W.-Y.; Lee, C.-E.; Kang, M.-S. Comparative analyses of rider position according to skill levels during walk and trot in Jeju horse. Hum. Mov. Sci. 2010, 29, 956–963. [Google Scholar] [CrossRef]
- Eckardt, F.; Witte, K. Kinematic Analysis of the Rider According to Different Skill Levels in Sitting Trot and Canter. J. Equine Vet. Sci. 2016, 39, 51–57. [Google Scholar] [CrossRef]
- Hobbs, S.J.; Baxter, J.; Broom, L.; Rossell, L.-A.; Sinclair, J.; Clayton, H.M. Posture, flexibility and grip strength in horse riders. J. Hum. Kinet. 2014, 42, 113–125. [Google Scholar] [CrossRef] [Green Version]
- Terada, K. Comparison of Head Movement and EMG Activity of Muscles between Advanced and Novice Horseback Riders at Different Gaits. J. Equine Sci. 2000, 11, 83–90. [Google Scholar] [CrossRef] [Green Version]
- Byström, A.; Roepstroff, L.; Geser-von Peinen, K.; Weishaupt, M.A.; Rhodin, M. Differences in rider movement pattern between different degrees of collection at the trot in high-level dressage horses ridden on a treadmill. Hum. Mov. Sci. 2015, 41, 1–8. [Google Scholar] [CrossRef]
- Engell, M.T.; Clayton, H.M.; Egenvall, A.; Weishaupt, M.A.; Roepstorff, L. Postural changes and their effects in elite riders when actively influencing the horse versus sitting passively at trot. Comp. Exerc. Physiol. 2016, 12, 27–33. [Google Scholar] [CrossRef] [Green Version]
- Bosch, S.; Serra Bragança, F.; Marin-Perianu, M.; Marin-Perianu, R.; van der Zwaag, B.J.; Voskamp, J.; Back, W.; van Weeren, R.; Havinga, P. EquiMoves: A Wireless Networked Inertial Measurement System for Objective Examination of Horse Gait. Sensors 2018, 18, 850. [Google Scholar] [CrossRef] [Green Version]
- Moorman, V.J.; Reiser, R.F.; McIlwraith, C.W.; Kawcak, C.E. Validation of an equine inertial measurement unit system in clinically normal horses during walking and trotting. Am. J. Vet. Res. 2012, 73, 1160–1170. [Google Scholar] [CrossRef]
- Rhodin, M.; Persson-Sjodin, E.; Egenvall, A.; Serra Bragança, F.M.; Pfau, T.; Roepstorff, L.; Weishaupt, M.A.; Thomsen, M.H.; van Weeren, P.R.; Hernlund, E. Vertical movement symmetry of the withers in horses with induced forelimb and hindlimb lameness at trot. Equine Vet. J. 2018, 50, 818–824. [Google Scholar] [CrossRef]
- Serra Bragança, F.M.; Roepstorff, C.; Rhodin, M.; Pfau, T.; van Weeren, P.R.; Roepstorff, L. Quantitative lameness assessment in the horse based on upper body movement symmetry: The effect of different filtering techniques on the quantification of motion symmetry. Biomed. Signal Process. Control 2020, 57, 101674. [Google Scholar] [CrossRef]
- Pfau, T.; Stubbs, N.C.; Kaiser, L.J.; Brown, L.E.A.; Clayton, H.M. Effect of trotting speed and circle radius on movement symmetry in horses during lunging on a soft surface. Am. J. Vet. Res. 2012, 73, 1890–1899. [Google Scholar] [CrossRef]
- Schöllhorn, W.I.; Peham, C.; Licka, T.; Scheidl, M. A pattern recognition approach for the quantification of horse and rider interactions. Equine Vet. J. Suppl. 2006, 38, 400–405. [Google Scholar] [CrossRef]
- Peham, C.; Licka, T.; Kapaun, M.; Scheidl, M. A new method to quantify harmony of the horse-rider system in dressage. Sports Eng. 2001, 4, 95–101. [Google Scholar] [CrossRef]
- Fruehwirth, B.; Peham, C.; Scheidl, M.; Schobesberger, H. Evaluation of pressure distribution under an English saddle at walk, trot and canter. Equine Vet. J. 2004, 36, 754–757. [Google Scholar] [CrossRef]
- Greve, L.; Dyson, S.J. The interrelationship of lameness, saddle slip and back shape in the general sports horse population. Equine Vet. J. 2014, 46, 687–694. [Google Scholar] [CrossRef]
- Guire, R.; Mathie, H.; Fisher, M.; Fisher, D. Riders’ perception of symmetrical pressure on their ischial tuberosities and rein contact tension whilst sitting on a static object. Comp. Exerc. Physiol. 2017, 13, 7–12. [Google Scholar] [CrossRef]
- Kuhnke, S.; Dumbell, L.; Gauly, M.; Johnson, J.L.; McDonald, K.; von Borstel, U.K. A comparison of rein tension of the rider’s dominant and non-dominant hand and the influence of the horse’s laterality. Comp. Exerc. Physiol. 2010, 7, 57–63. [Google Scholar] [CrossRef]
- Schils, S.J.; Greer, N.L.; Stoner, L.J.; Kobluk, C.N. Kinematic analysis of the equestrian—Walk, posting trot and sitting trot. Hum. Mov. Sci. 1993, 12, 693–712. [Google Scholar] [CrossRef]
- Olivier, A.; Faugloire, E.; Lejeune, L.; Biau, S.; Isableu, B. Head Stability and Head-Trunk Coordination in Horseback Riders: The Contribution of Visual Information According to Expertise. Front. Hum. Neurosci. 2017, 11, 11. [Google Scholar] [CrossRef] [PubMed] [Green Version]
- Wolframm, I.A.; Bosga, J.; Meulenbroek, R.G.J. Coordination dynamics in horse-rider dyads. Hum. Mov. Sci. 2013, 32, 157–170. [Google Scholar] [CrossRef]
- Baxter, J.; Hobbs, S.J.; Alexander, J.; George, L.S.; Sinclair, J.; Chohan, A.; Clayton, H.M. Rider Skill Affects Time and Frequency Domain Postural Variables When Performing Shoulder-in. J. Equine Vet. Sci. 2022, 109, 103805. [Google Scholar] [CrossRef]
- Hardeman, A.M.; Serra Bragança, F.M.; Swagemakers, J.H.; van Weeren, P.R.; Roepstorff, L. Variation in gait parameters used for objective lameness assessment in sound horses at the trot on the straight line and the lunge. Equine Vet. J. 2019, 51, 831–839. [Google Scholar] [CrossRef] [Green Version]
- Bragança, F.M.; Bosch, S.; Voskamp, J.P.; Marin-Perianu, M.; van der Zwaag, B.J.; Vernooij, J.C.M.; van Weeren, P.R.; Back, W. Validation of distal limb mounted inertial measurement unit sensors for stride detection in Warmblood horses at walk and trot. Equine Vet. J. 2017, 49, 545–551. [Google Scholar] [CrossRef] [Green Version]
- Pfau, T.; Witte, T.H.; Wilson, A.M. A method for deriving displacement data during cyclical movement using an inertial sensor. J. Exp. Biol. 2005, 208, 2503–2514. [Google Scholar] [CrossRef] [Green Version]
- Biau, S.; Barrey, E. Relationships between stride characteristics and scores in dressage tests. Pferdeheilkunde Equine Med. 2004, 20, 140–144. [Google Scholar] [CrossRef] [Green Version]
- Heebner, N.R.; Akins, J.S.; Lephart, S.M.; Sell, T.C. Reliability and validity of an accelerometry based measure of static and dynamic postural stability in healthy and active individuals. Gait Posture 2015, 41, 535–539. [Google Scholar] [CrossRef]
- Hausdorff, J.M.; Mitchell, S.L.; Firtion, R.; Peng, C.K.; Cudkowicz, M.E.; Wei, J.Y.; Goldberger, A.L. Altered fractal dynamics of gait: Reduced stride-interval correlations with aging and Huntington’s disease. J. Appl. Physiol. 1985 1997, 82, 262–269. [Google Scholar] [CrossRef]
- Peham, C.; Licka, T.; Girtler, D.; Scheidl, M. The influence of lameness on equine stride length consistency. Vet. J. 2001, 162, 153–157. [Google Scholar] [CrossRef]
- Müller-Quirin, J.; Dittmann, M.T.; Roepstorff, C.; Arpagaus, S.; Latif, S.N.; Weishaupt, M.A. Riding Soundness-Comparison of Subjective With Objective Lameness Assessments of Owner-Sound Horses at Trot on a Treadmill. J. Equine Vet. Sci. 2020, 95, 103314. [Google Scholar] [CrossRef]
- Graham, J.H.; Raz, S.; Hel-Or, H.; Nevo, E. Fluctuating Asymmetry: Methods, Theory, and Applications. Symmetry 2010, 2, 466–540. [Google Scholar] [CrossRef] [Green Version]
- Byström, A.; Rhodin, M.; von Peinen, K.; Weishaupt, M.A.; Roepstorff, L. Kinematics of saddle and rider in high-level dressage horses performing collected walk on a treadmill. Equine Vet. J. 2010, 42, 340–345. [Google Scholar] [CrossRef]
- Terada, K.; Clayton, H.M.; Kato, K. Stabilization of wrist position during horseback riding at trot. Equine Comp. Exerc. Physiol. 2006, 3, 179–184. [Google Scholar] [CrossRef]
- Gardner-Morse, M.G.; Stokes, I.A. The effects of abdominal muscle coactivation on lumbar spine stability. Spine 1998, 23, 86–91; discussion 91–92. [Google Scholar] [CrossRef]
- Reeves, N.P.; Everding, V.Q.; Cholewicki, J.; Morrisette, D.C. The effects of trunk stiffness on postural control during unstable seated balance. Exp. Brain Res. 2006, 174, 694–700. [Google Scholar] [CrossRef]
- Clayton, H.M.; Kaiser, L.J.; de Pue, B.; Kaiser, L. Center-of-pressure movements during equine-assisted activities. Am. J. Occup. Ther. 2011, 65, 211–216. [Google Scholar] [CrossRef] [Green Version]
- St George, L.; Thetford, C.; Clayton, H.M.; Hobbs, S.J. An exploration of stakeholder perceptions to inform the development of an evidence-based classification system in para dressage. J. Sports Sci. 2022, 40, 459–469. [Google Scholar] [CrossRef]
- Bronner, S.; Shippen, J. Biomechanical metrics of aesthetic perception in dance. Exp. Brain Res. 2015, 233, 3565–3581. [Google Scholar] [CrossRef] [PubMed]
- Vinken, P.M.; Heinen, T. How does the amount of movement and observer expertise shape the perception of motion aesthetics in dance? Hum. Mov. 2022, 23, 46–55. [Google Scholar] [CrossRef]
- Bard, C.; Fleury, M.; Carrière, L.; Hallé, M. Analysis of gymnastics judges’ visual search. Res. Q. Exerc. Sport 1980, 51, 267–273. [Google Scholar] [CrossRef] [PubMed]
- Vinken, P.M.; Stirling, V.; Heinen, T. The aesthetics of the experts—On the relationship of observers’ and performers’ expertise when perceiving motion aesthetics in freerunning skills. J. Hum. Sport Exerc. 2022, 17, 782–795. [Google Scholar] [CrossRef]
- Schiffers, H. What Are They Looking at? Visual Search Behaviour of Grand Prix Judges. Bachelor’s Thesis, University of Applied Science Van Hall Larenstein, Wageningen, The Netherlands, 2011. [Google Scholar]
- Skyrme, D. A Comparison of Visual Scan Patterns for an Elite Judge, Elite Coach and Novice Judge in Dressage. Master’s Thesis, University of Chester, Chester, UK, 2013. [Google Scholar]
- Hobbs, S.J.; St George, L.; Reed, J.; Stockley, R.; Thetford, C.; Sinclair, J.; Williams, J.; Nankervis, K.; Clayton, H.M. A scoping review of determinants of performance in dressage. PeerJ 2020, 8, e9022. [Google Scholar] [CrossRef]
- Leach, D.; Cymbaluk, N.F. Relationships between stride length, stride frequency, velocity, and morphometrics of foals. Am. J. Vet. Res. 1986, 47, 2090–2097. [Google Scholar]
- Back, W.; Barneveld, A.; Schamhardt, H.C.; Bruin, G.; Hartman, W. Longitudinal development of the kinematics of 4-, 10-, 18- and 26-month-old Dutch Warmblood horses. Equine Vet. J. 1994, 26, 3–6. [Google Scholar] [CrossRef]
- Barrey, E.; Desliens, F.; Poirel, D.; Biau, S.; Lemaire, S.; Rivero, J.L.L.; Langlois, B. Early evaluation of dressage ability in different breeds. Equine Vet. J. Suppl. 2002, 34, 319–324. [Google Scholar] [CrossRef]
- Heglund, N.C.; Taylor, C.R.; McMahon, T.A. Scaling stride frequency and gait to animal size: Mice to horses. Science 1974, 186, 1112–1113. [Google Scholar] [CrossRef] [Green Version]
- Gunst, S.; Dittmann, M.T.; Arpagaus, S.; Roepstorff, C.; Latif, S.N.; Klaassen, B.; Pauli, C.A.; Bauer, C.M.; Weishaupt, M.A. Influence of Functional Rider and Horse Asymmetries on Saddle Force Distribution During Stance and in Sitting Trot. J. Equine Vet. Sci. 2019, 78, 20–28. [Google Scholar] [CrossRef] [Green Version]


| Rider | Horse | |||
|---|---|---|---|---|
| GP | Small Tour | GP | Small Tour | |
| Number of participants | 12 | 5 | 9 | 11 |
| Age | 46 (12) | 43 (17) | 13 (3) | 10 (2) |
| Mass | 64.2 (7.4) | 65.4 (8.4) | ||
| Height (m) | 1.68 (0.07) | 1.69 (0.10) | 1.65 (0.10) | 1.69 (0.05) |
| Male | 1 | 8 | 9 | |
| Female | 11 | 5 | 1 | 2 |
| GP | Small Tour | ||
|---|---|---|---|
| Stride Frequency (Hz) 1.3 (0.3) |  |  | p = 0.717 1.3 (0.3) |
| TDS Trunk (m) 3.47 (1.8) |  | 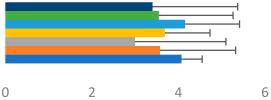 | p = 0.481 3.63 (1.8) |
| TDS Pelvis (m) 1.1 (0.9) | 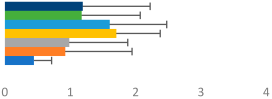 |  | p = 0.923 1.0 (0.9) |
| DVar (rad) 0.3 (0.2) | 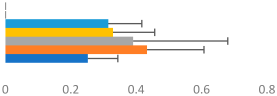 | 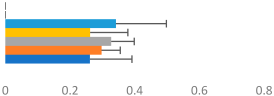 | p = 0.250 0.3 (0.1) |
| Stability Trunk (ratio) —3.6 (3.2) | 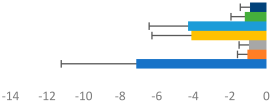 | 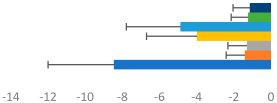 | p = 0.783 —4.0 (3.5) |
| Stability Pelvis (ratio) —0.3 (0.3) |  |  | p = 0.201 —0.2 (0.3) |
| Judge Gait Score (0–10) 6.54 (0.81) |  |  | p = 0.193 6.18 (0.60) |
Key:  | |||
| GP | Small Tour | ||
|---|---|---|---|
| Stride Frequency (Hz) 1.3 (0.3) |  | 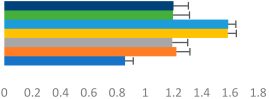 | p = 0.678 1.3 (0.3) |
| TDS Trunk (m) 4.1 (1.9) | 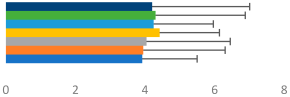 | 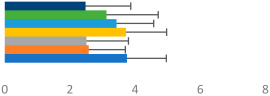 | p = 0.094 3.2 (1.3) |
| TDS Pelvis (m) 1.3 (1.0) |  | 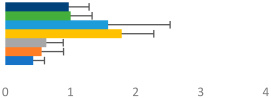 | p = 0.304 1.0 (0.8) |
| DVar (rad) 0.29 (0.10) | 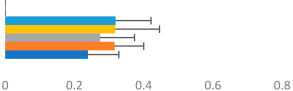 |  | p = 0.148 0.36 (0.19) |
| Stability Trunk (ratio) —3.5 (3.4) | 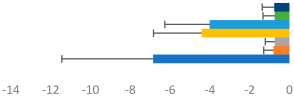 | 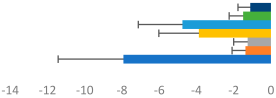 | p = 0.091 —3.8 (3.3) |
| Stability Pelvis (ratio) —0.25 (0.28) | 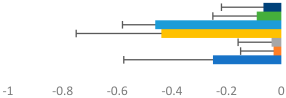 |  | p = 0.134 —0.36 (0.36) |
| Judge Gait Score (0–10) 6.46 (0.94) | 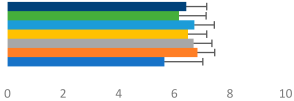 | 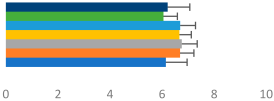 | p = 0.635 6.59 (0.63) |
Key:  | |||
| Judged Score | GP | Small Tour | p-Value | |
|---|---|---|---|---|
| Rider Level | Position | 7.0 (0.4) | 6.7 (0.3) | 0.124 |
| Harmony | 6.7 (0.5) | 6.0 (0.8) | 0.027 * | |
| Aids | 6.4 (0.5) | 5.5 (0.7) | 0.012 * | |
| Horse Level | Position | 6.9 (0.5) | 7.0 (0.4) | 0.618 |
| Harmony | 6.4 (0.9) | 6.6 (0.5) | 0.681 | |
| Aids | 6.1 (0.8) | 6.2 (0.7) | 0.935 |
| Judged Score | Regression Model and Predictor(s) | R-Value | R2 | Significance | Durbin–Watson Statistic |
|---|---|---|---|---|---|
| Position | (1) TDS Trunk | −0.421 | 0.178 | <0.001 | 2.213 |
| (2) TDS Trunk Stability Pelvis | −0.485 | 0.235 | <0.001 | ||
| Harmony | (1) TDS Trunk | −0.271 | 0.074 | 0.009 | 2.204 |
| Aids | (1) TDS Trunk | −0.369 | 0.136 | <0.001 | 1.811 |
| (2) TDS Trunk Stability Pelvis | −0.460 | 0.212 | <0.001 | ||
| Gait Scores | (1) Stride Frequency | −0.252 | 0.063 | 0.015 | 2.096 |
| (2) Stride Frequency TDS Trunk | −0.361 | 0.131 | 0.002 |
Disclaimer/Publisher’s Note: The statements, opinions and data contained in all publications are solely those of the individual author(s) and contributor(s) and not of MDPI and/or the editor(s). MDPI and/or the editor(s) disclaim responsibility for any injury to people or property resulting from any ideas, methods, instructions or products referred to in the content. |
© 2023 by the authors. Licensee MDPI, Basel, Switzerland. This article is an open access article distributed under the terms and conditions of the Creative Commons Attribution (CC BY) license (https://creativecommons.org/licenses/by/4.0/).
Share and Cite
Hobbs, S.J.; Serra Braganca, F.M.; Rhodin, M.; Hernlund, E.; Peterson, M.; Clayton, H.M. Evaluating Overall Performance in High-Level Dressage Horse–Rider Combinations by Comparing Measurements from Inertial Sensors with General Impression Scores Awarded by Judges. Animals 2023, 13, 2496. https://doi.org/10.3390/ani13152496
Hobbs SJ, Serra Braganca FM, Rhodin M, Hernlund E, Peterson M, Clayton HM. Evaluating Overall Performance in High-Level Dressage Horse–Rider Combinations by Comparing Measurements from Inertial Sensors with General Impression Scores Awarded by Judges. Animals. 2023; 13(15):2496. https://doi.org/10.3390/ani13152496
Chicago/Turabian StyleHobbs, Sarah Jane, Filipe Manuel Serra Braganca, Marie Rhodin, Elin Hernlund, Mick Peterson, and Hilary M. Clayton. 2023. "Evaluating Overall Performance in High-Level Dressage Horse–Rider Combinations by Comparing Measurements from Inertial Sensors with General Impression Scores Awarded by Judges" Animals 13, no. 15: 2496. https://doi.org/10.3390/ani13152496