Article

The Different Fate of the Pyrenean Desman (Galemys pyrenaicus) and the Eurasian Otter (Lutra lutra) under Climate and Land Use Changes

by
Luca Francesco Russo
1,
Ángel Fernández-González
2,
Vincenzo Penteriani
3,
María del Mar Delgado
4,
Santiago Palazón
5,6,
Anna Loy
1 and
Mirko Di Febbraro
1,*
1
EnvixLab, Department of Biosciences and Territory, Università degli Studi del Molise, 86090 Pesche, Italy
2
BIOSFERA Consultoría Medioambiental S.L., C/Candamo n°5., 33012 Oviedo, Spain
3
National Museum of Natural Sciences (MNCN), Department of Evolutionary Ecology, Spanish National Research Council (CSIC), c/José Gutiérrez Abascal 2, 28006 Madrid, Spain
4
Biodiversity Research Institute (IMIB), CSIC/UO/PA, Campus de Mieres, Edificio de Investigación, 33600 Mieres, Spain
5
Direcció General de Polítiques Ambientals i Medi Natural, Generalitat of Catalonia, Carrer del Foc, 57, 08038 Barcelona, Spain
6
Grupo Nutria, Sociedad Española Para la Conservación y Estudio de los Mamíferos (SECEM), 29080 Málaga, Spain
*
Author to whom correspondence should be addressed.
Animals 2023, 13(2), 274; https://doi.org/10.3390/ani13020274
Submission received: 29 November 2022 / Revised: 23 December 2022 / Accepted: 5 January 2023 / Published: 13 January 2023
(This article belongs to the Section Ecology and Conservation)

Abstract

:

Simple Summary

In the last century, hundreds of species have gone extinct or have undergone a decline in population size due to climate and land use change. Species can respond to these alterations in different ways, with some species facing extinction while others benefit from these changes. Here, we investigate the effects of climate and land use change on two semi-aquatic mammals, the Pyrenean desman (Galemys pyrenaicus) and the Eurasian otter (Lutra lutra), and how climate and land use change might affect the interaction between these two species. We found that the otters will take advantage of these environmental alterations, while desmans will undergo a drastic reduction of their suitable habitats. In addition, the availability of overlapped range margins between the two species might increase, exposing desmans to a potential increased predation risk by otters.

Abstract

Climate and land use change can affect biodiversity in different ways, e.g., determining habitat loss, altering reproduction periods or disrupting biotic interactions. Here, we investigate the effects of climate and land use change on the spatial distribution of two semi-aquatic mammals, the Pyrenean desman (Galemys pyrenaicus) and the Eurasian otter (Lutra lutra). We first modeled the current potential distribution of the desman and the otter in the Iberian Peninsula, considering topographic, climatic and land use variables. Second, we predicted their potential distribution in 2050 under climate and land use change scenarios. We calculated the percentage of range gain/loss and shift predicted for the two species under such scenarios and quantified the present and future spatial overlap between the two species distribution. Irrespective of the scenario, desman models show loss of suitable habitat, whereas the otter will undergo an opposite trend. Aside from a preponderant habitat loss, the desman is predicted to increase its spatial overlap with otter range under the optimistic scenarios, potentially meaning it will face an exacerbated predation by otters. The potential increase of both habitat loss and otters’ predation might represent a major threat for the desman, which may affect the long-term persistence of this endemic species in the Iberian Peninsula.

1. Introduction

In the last century, hundreds of species have gone extinct or have undergone a decline in population size due to global change drivers [1,2], with endangered and endemic species being the most threatened due to their small range of distribution and numbers [3]. However, species can respond in different ways to the alterations posed by climate and land use change, with some species facing extinction while others benefit from these changes [1,4,5]. Increasing temperatures, reduced precipitations and alterations in land use will entail a decline in habitat availability [6]. In response to these alterations, species can shift their distribution, adapt to the new environment or decline to extinction [7,8,9,10].
Climate and land use changes can also lead to an alteration of species interactions [11]. For example, the alterations in prey–predator interactions can influence the likelihood of encounter, mortality and predation risk [12,13]. Changes in the availability and distribution of the prey might also cause a shift in the predator diet and impact different species [14]. For example: in the Nepalese Himalayas, climate change could alter the niche overlap between the snow leopard (Panthera uncia) and the blue sheep (Pseudois nayaur), hampering the snow leopard’s availability of its preferred prey [15]; Bastille-Rousseau et al. [16] found that future climate conditions could increase the predation of caribou (Rangifer tarandus) by the coyote and decrease the predation of caribou by the black bear (Ursus americanus); and Penteriani et al. [17] showed that future climate change scenarios will reduce the distribution of seven plant species that are part of the diet of brown bears (Ursus arctos), resulting in a reduction in this species distribution and a shifting towards a more carnivorous diet.
In this context, it is particularly relevant to assess how climate and land use change may affect the availability of environmental conditions where the predator–prey interaction can occur, i.e., the modifications of spatial overlap between prey and predator species under future scenarios. For instance, a prey species might undergo, in parallel, a reduction in its distribution and an increase in spatial overlap with occasional predators as a consequence of global change habitat alterations, thus suffering from multiple threats at the same time. Having set this scenario, we investigated the effects of climate and land use changes on the potential predator–prey interaction of two semi-aquatic mammals, the Pyrenean desman (Galemys pyrenaicus, hereafter desman) and the Eurasian otter (Lutra lutra, hereafter otter) in the Iberian Peninsula. The desman is a small mammal of the Talpidae family, occurring only in the Pyrenees, northern and central Spain and northern Portugal [18]. As a semi-aquatic mammal that prefers fast-flowing streams, this species has suffered a serious decline in recent years due to habitat loss and fragmentation, waterways pollution, persecution by fishermen and introduction of invasive species [18]. It is classified as Endangered on the IUCN red list and listed on the EU Habitats and Species Directive (Annexes II and IV) and Bern Convention (Appendix II).
Furthermore, due to its specialist habits and low dispersal abilities, this species seems to be particularly vulnerable to global change, with a likely sizeable loss of suitable habitat even under the more optimistic future change scenarios [19,20]. The otter is a mammal of the Mustelidae family widely distributed in Eurasia and part of Africa [21] and is also considered a semi-aquatic mammal able to tolerate different types of aquatic environments [22]. The diet of this species is mainly composed of fish [23,24,25], although it can also prey on other species such as the desman [26,27,28].
The desman underwent a severe decline in the last century in most of Europe, caused by habitat fragmentation and loss, hunting for fur and pollution of waterways. However, following legal protection, habitat restoration and banning of harmful pollutants, the desman is now recovering in its former range [21]. The otter is considered as Near Threatened on the IUCN red list and listed in Appendix II of the Berne Convention, Annexes II and IV of the EU Habitat Directive (43/92/CEE) and Appendix I of CITES. Due to its environmental flexibility, this species seems not to be globally affected by climate and land use changes, with even predicted positive effects of climate change on habitat suitability [29,30]. Since it is known that desmans share their habitat [31,32] and are occasionally preyed [26,27,28] on by otters, we explored if and to what extent the above-mentioned changes in climate and land use change may determine an alteration of the spatial overlap between the two species distributions, and, hence, a potential increase in otter predation rates on desman.
To better understand how global change drivers could alter the geographic distribution of the potential otter–desman predation areas, we (i) modelled the current potential distribution of desman and otter in the Iberian Peninsula, considering topographic, climatic and land use variables; (ii) predicted their potential distribution in 2050 under climate and land use change scenarios explicitly accounting for their dispersal capabilities; (iii) calculated the percentage range of gain/loss and shift predicted for the two species under such scenarios; and (iv) quantified the present and future spatial overlap between the two species’ distribution.

2. Materials and Methods

2.1. Occurrence Data

We collected the desman presence data during seven campaigns of sampling held in Spain and Portugal from 2013 to 2018. Specifically, as desman scats are easy to recognize when fresh [33], we searched latrines through 200 m transects placed inside the hydrographic network. We also gathered 113 presence data of desman, with spatial uncertainty of less than 250 m radius, obtained from the “Mammals in Portugal” open source repository, which stores data of all the mammal species occurring in Portugal [34]. From both strategies, we collected 412 occurrence data for the desman from 2013 to 2020. Otter presence data were obtained from the Spanish National Otter Monitoring initiative [35]. In this case, we considered 5879 presence data, which had a spatial uncertainty of less than 250 m radius. Since citizen science data are often used to build suitability models, i.e., [36,37], we also retrieved 835 otter presence data from the iNaturalist portal (www.inaturalist.org (accessed on 20 June 2022)), as well as 301 data from the “Mammals in Portugal” repository [34]. Also for these data, we retained only the records with a spatial uncertainty of less than 250 m radius. In total, we collected 7015 otter occurrence data from 2000 to 2020.
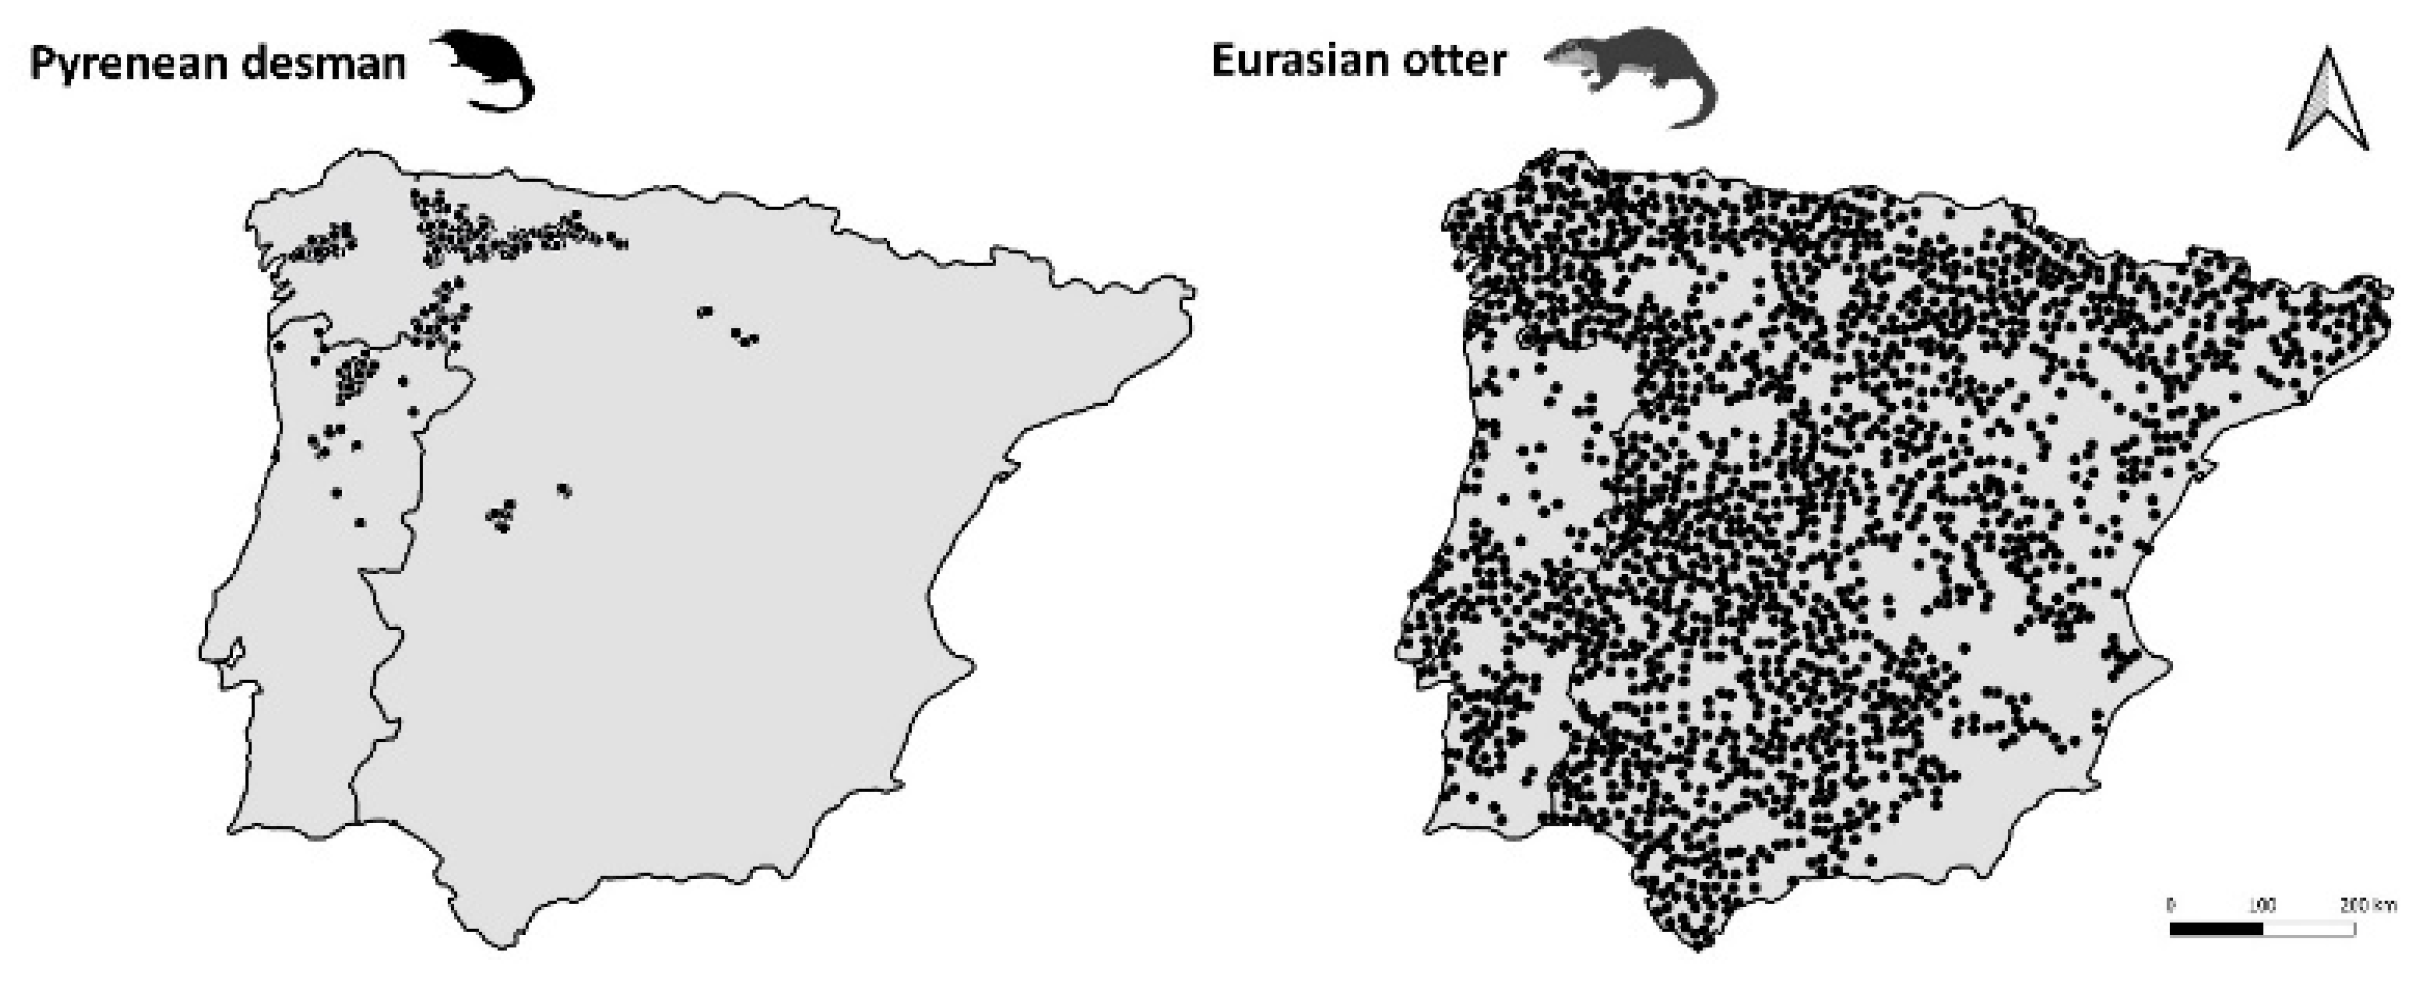
To avoid spatial autocorrelation in occurrences data, we used the “spThin” R package [38], with thinning points laying closer than 20 km for otter and 2 km for the desman. We used these distances because they correspond to the dispersal distances of the two species [39,40,41]. After the thinning procedure, we retained 1912 otter occurrence records and 251 for desman (Figure A1).

2.2. Environmental Variables

We initially considered the 19 bioclimatic variables (Table A1) from the CHELSA database [42], rasterized at ca. 1 km spatial resolution. In addition, we included elevation [43], slope and roughness (the last two were calculated from the elevation map). We also considered the following six land use categories rasterized at ca. 1 km spatial resolution: forests, grasslands, farmlands, urban areas, water bodies and barren, gathered from Li et al. [44]. Specifically, each of the six categories was transformed from categorical to continuous by calculating the Euclidean distance from each pixel [45]. We focused on climate, land use and topographic variables as they are known to be important environmental drivers in freshwater ecosystems [46] and have already been considered in other studies describing both otter [30] and desman [19] habitat characteristics. Since the two study species are water-dependent mammals [18,22], all the eco-variables were clipped within a 1 km radius buffer around the hydrographic network derived from Schneider et al. [47]. To avoid correlation between the variables, we dropped predictors reporting a variance inflation factor > 5 [48,49]. After checking for multicollinearity, we retained the following 14 variables for SDM calibration: isothermality (BIO3), temperature seasonality (BIO4), mean temperature of wettest quarter (BIO8), mean temperature of driest quarter (BIO9), precipitation seasonality (BIO15), precipitation of coldest quarter (BIO19), slope, elevation and all the six land use categories.

2.3. Species Distribution Models

Relying on species occurrences and the above-mentioned environmental variables, we predicted otter and desman distribution by using an ‘ensemble forecasting approach’, as implemented in the “biomod2” R package [50]. Specifically, the following algorithms were used: generalized linear models (GLM), generalized additive models (GAM), generalized boosted models (GBM), random forest (RF) and Maxent. For each of the two species, we randomly placed 10,000 background points over an area identified by all the WWF Terrestrial Ecoregions [51] encompassing species records, according to the “BAM” framework by Barve et al. [52]. Since spatial partitioning cross-validation approaches to evaluate SDM predictive accuracy proved useful in assessing model transferability [53] and penalizing models based on biologically meaningless predictors [54], we used the “checkerboard2” strategy implemented in the “ENMeval” R package [55]. According to this strategy, data are partitioned into four binds along two hierarchical levels of spatial aggregation (further details are provided in Muscarella et al. [56]). For GLM, GAM, GBM and RF algorithms, we used the settings provided in Pio et al. [57] as a recommended configuration. For Maxent, we used the “ENMeval” package to test different setting configurations, so as to optimize the trade-off between goodness-of-fit and overfitting [56]. In particular, we tested regularization values between 0.5 and 4 (with 0.5 steps), along with the following feature classes: linear (L), linear + quadratic (LQ), hinge (H), linear + quadratic + hinge (LQH), linear + quadratic + hinge + product (LQHP) and linear + quadratic + hinge + product + threshold (LQHPT). Among the resulting 48 setting combinations, we chose the one reporting the lowest Akaike Information Criterion (AICc), a commonly used metric to perform model selection [58]. To evaluate SDM predictive performance, we used the area under the receiver operating characteristic curve (AUC; [59]) and the true skill statistic (TSS; [60]). Specifically, for AUC, prediction accuracy can be considered excellent (AUC > 0.90), good (0.80 > AUC < 0.90), fair (0.70 > AUC < 0.80) and poor (AUC < 0.60; [61]). As for TSS, prediction accuracy can be excellent (TSS > 0.75), good (0.40 > AUC < 0.75) and poor (TSS < 0.40; [62]). Moreover, only the models reporting AUC values ≥ 0.70 were considered in the subsequent analyses [63]. Ensemble models were obtained by calculating a weighted average of the individual model predictions with their AUC scores as weights [64].

2.4. Climate and Land Use Change Scenarios

All the models were projected over four climate and land use change scenarios forecasted to 2050. In particular, we considered the most optimistic (RCP2.6) and pessimistic (RCP8.5) climate change scenarios from the IPCC [65] in terms of the amount of greenhouse gas emissions. Specifically, these scenarios refer to Representative Concentrations Pathways (RCPs), with RCP2.6 indicating low greenhouse gas emissions, while RCP8.5 assumes a drastic increase in greenhouse gas emissions in the next decades. Climate change scenarios are elaborated from different meteorological research centers using models of the dynamics of physical components of the atmosphere and ocean circulation, called global circulation models (GCM). Since there is a certain variation in the GCM that can lead to differences in SDM projections [66], we used three alternative versions of the RCP scenarios [29], i.e., CCSM4, IPSL-CM5A-LR and MIROC-ESM-CHEM GCM. We selected these GCM since they provide non-redundant information about future climate modifications [67]. For land use change, we used a pessimistic scenario (A2) with a high alteration of land cover due to human population growth and a more optimistic scenario (B1) with low forecasted human population growth and reduced modification in land use [44]. By combining the four different forecasts, we obtained four possible scenarios in 2050, describing mild (RCP2.6 and LUC.B1), two intermediate (RCP2.6 and LUC.A2; RCP8.5 and LUC.B1) and extreme (RCP8.5 and LUC.A2) global change magnitude (further details are provided in Table A2). Since different binarization schemes can affect model results, we considered alternative thresholds [68]. Specifically, each model projection was binarized according to “equalize sensitivity and specificity”, “maximize TSS”, “mean occurrence probability” and “minimize receiver operating characteristic plot distance” thresholds.
When predicting future habitat suitability, we accounted for the ability of the studied species to disperse in future favorable environments. For this purpose, we used the “MigClim” R package [69], a cellular automaton model that takes into account species-specific restrictions in future projections in global change scenarios. Starting from current and future binary maps (0 = absence, 1 = presence), MigClim allows us to predict which cells might be colonized or decolonized in a given period, considering the limitations in dispersion such as the dispersal capacity of the species, reproductive maturity and potential barriers. Following Sales et al. [70], we considered SDM binary predictions clipped along the species IUCN range as the starting maps. Subsequently, we gathered information on reproductive age and dispersal capacity of the two species [39,40,41], considering 20 km for otter and 2 km for desman dispersal distance. Since the dispersion capacity of the desman is influenced by geographic basins and by the presence of dams [39], we included these two factors as barriers.
For each species and future scenarios, we applied two metrics of global change effects on the binary maps generated by MigClim, i.e., the net change and the geographical shift. Net change is calculated as the percentage that is gained/lost between current and future ranges (with respect to the stable portion), while the geographical shift was calculated as a percentage of overlap between current and future range maps [71]. Finally, for each threshold, period and scenario, we calculated the percentage of area overlap between otter and desman distribution.

3. Results

3.1. Species Distribution Models

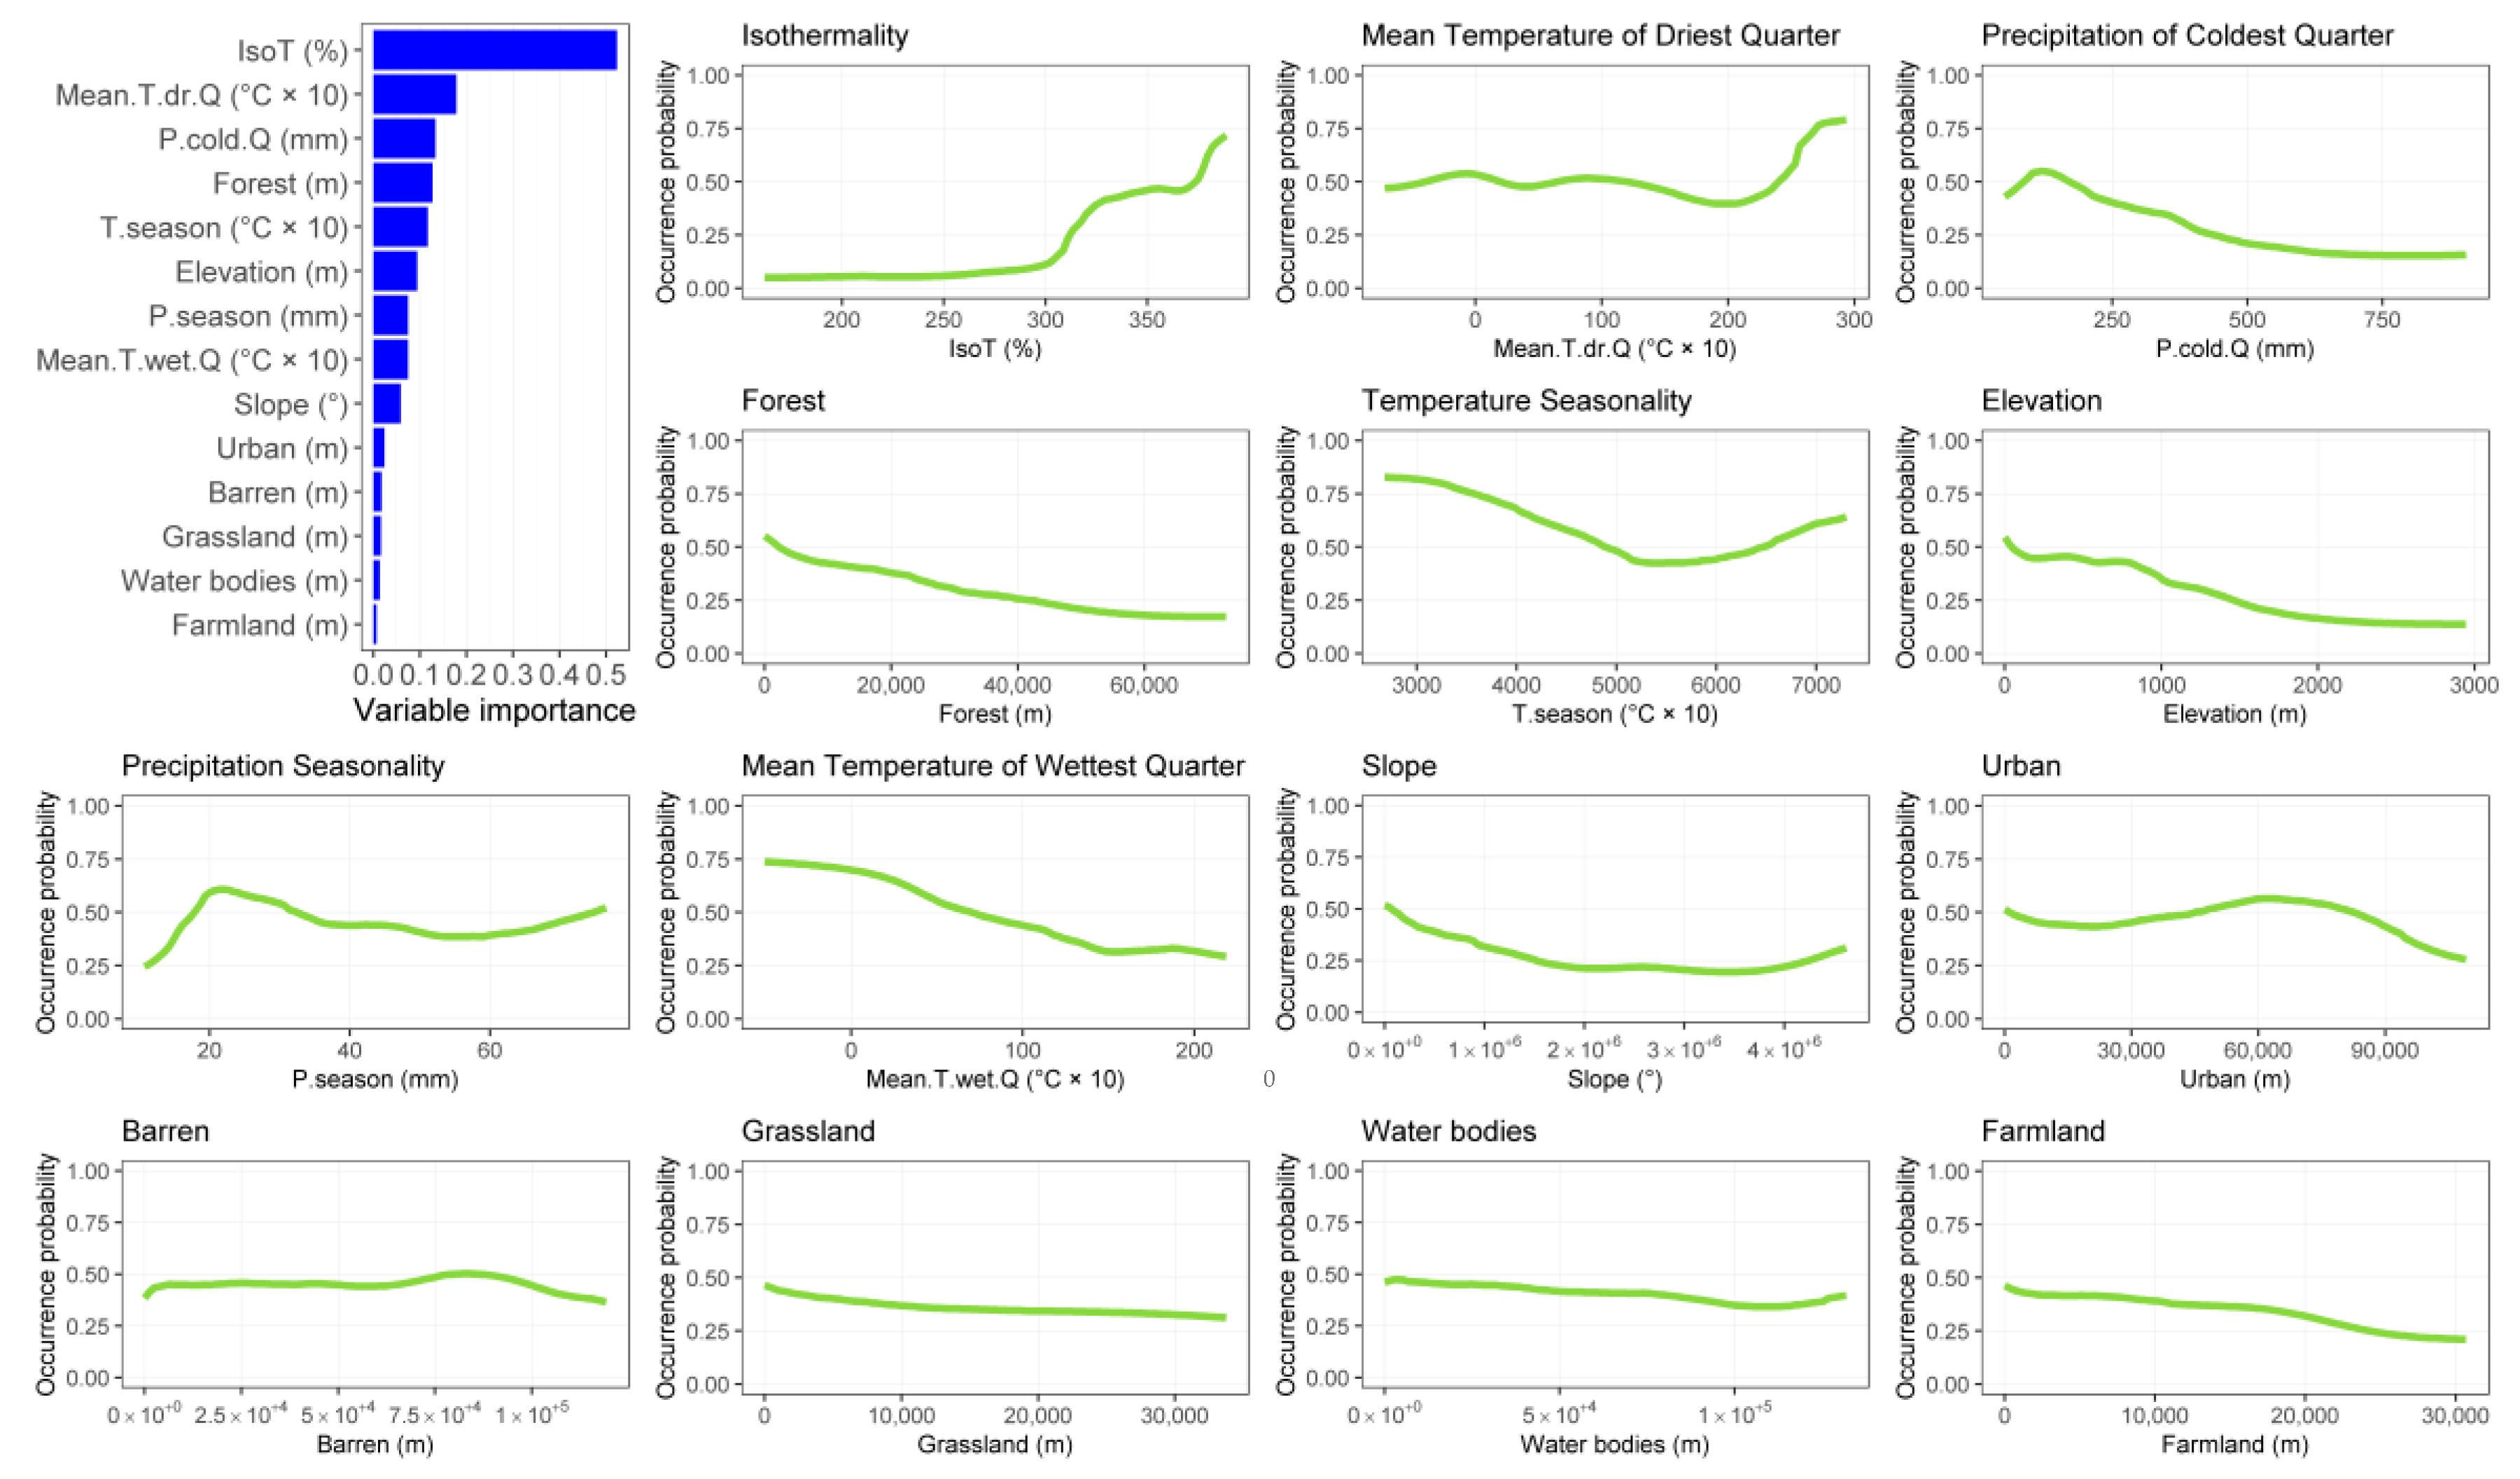
Desman and otter SDMs achieved good-to-excellent predictive performances sensu Swets [61], with the former species reporting a mean AUC = 0.98 (SD = ±0.003) and a mean TSS = 0.88 (SD = ±0.020) and the latter a mean AUC = 0.84 (SD = ±0.005) and a mean TSS = 0.52 (SD = ±0.010). Desman habitat suitability is mostly shaped by distance from forests, isothermality and seasonality in temperatures and precipitations (Figure 1). Specifically, the most suitable habitats for the species are close to forests and characterized by high isothermality values, low seasonality in temperatures and intermediate seasonality in precipitations (Figure 1). As for otters, isothermality has the most important effect on the species habitat suitability, along with mean temperature of driest quarter and distance from forests (Figure 2). In particular, the species found suitable habitats close to forests with high values of isothermality and temperature during the dry season (Figure 2).

3.2. Effect of Global Change Drivers on Species Distribution

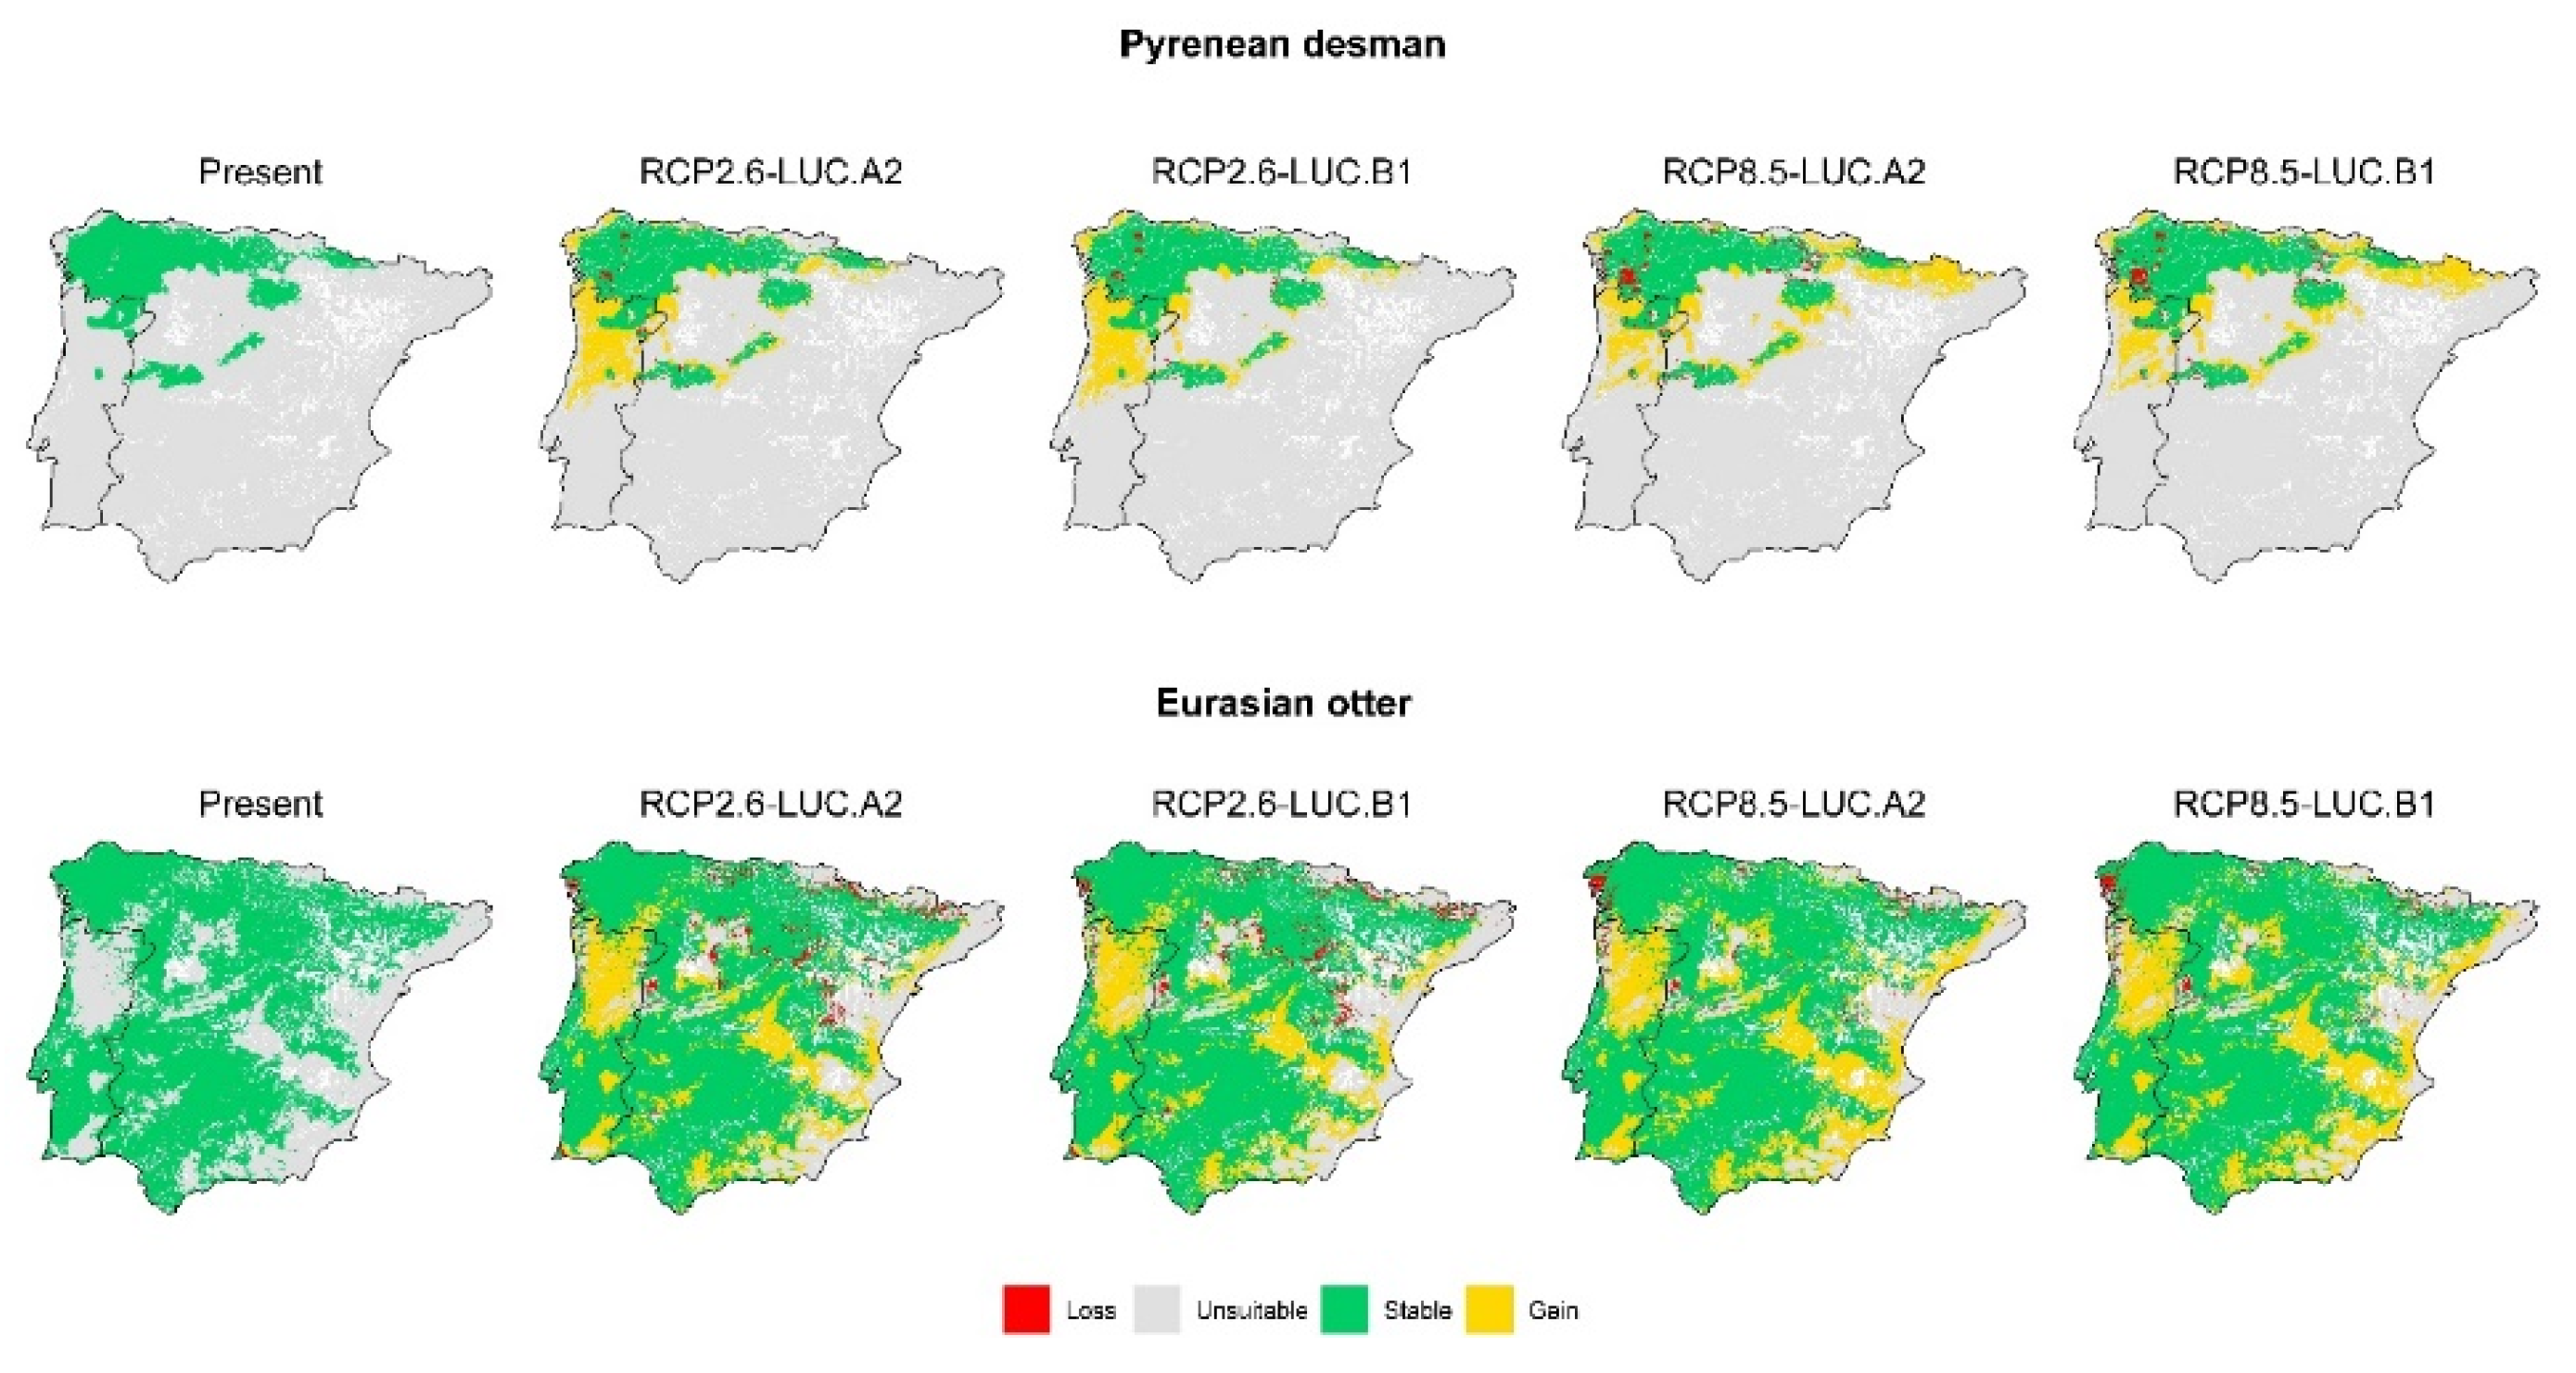
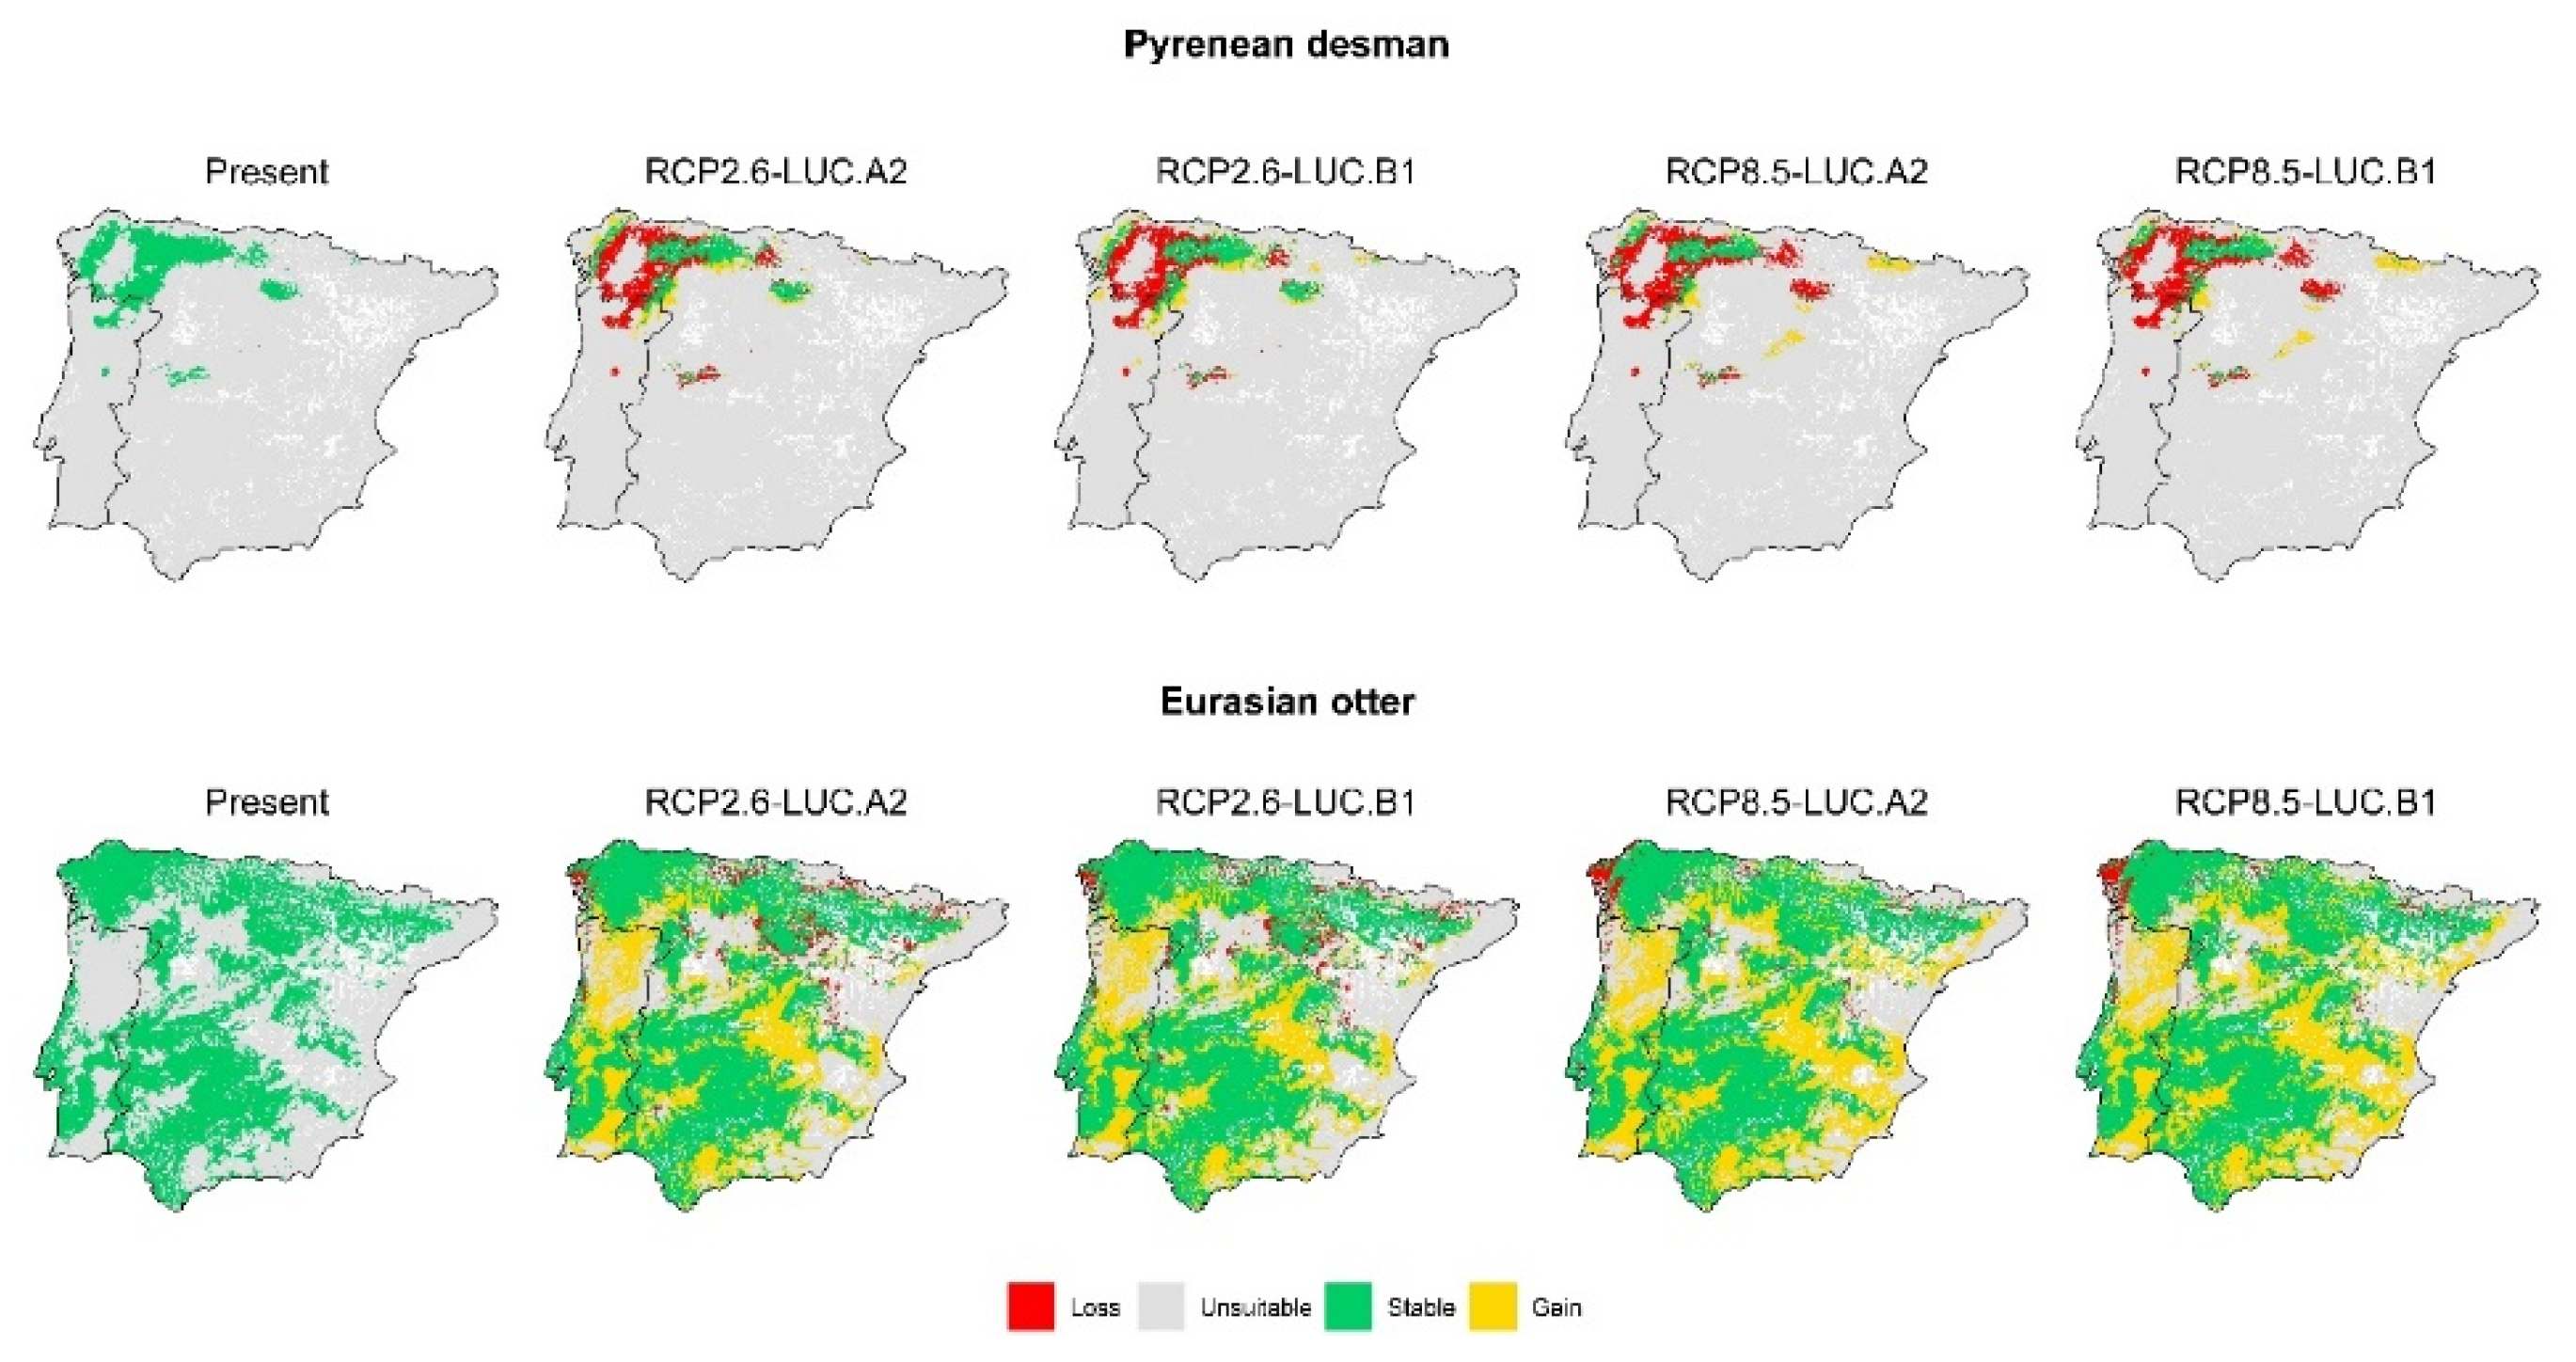
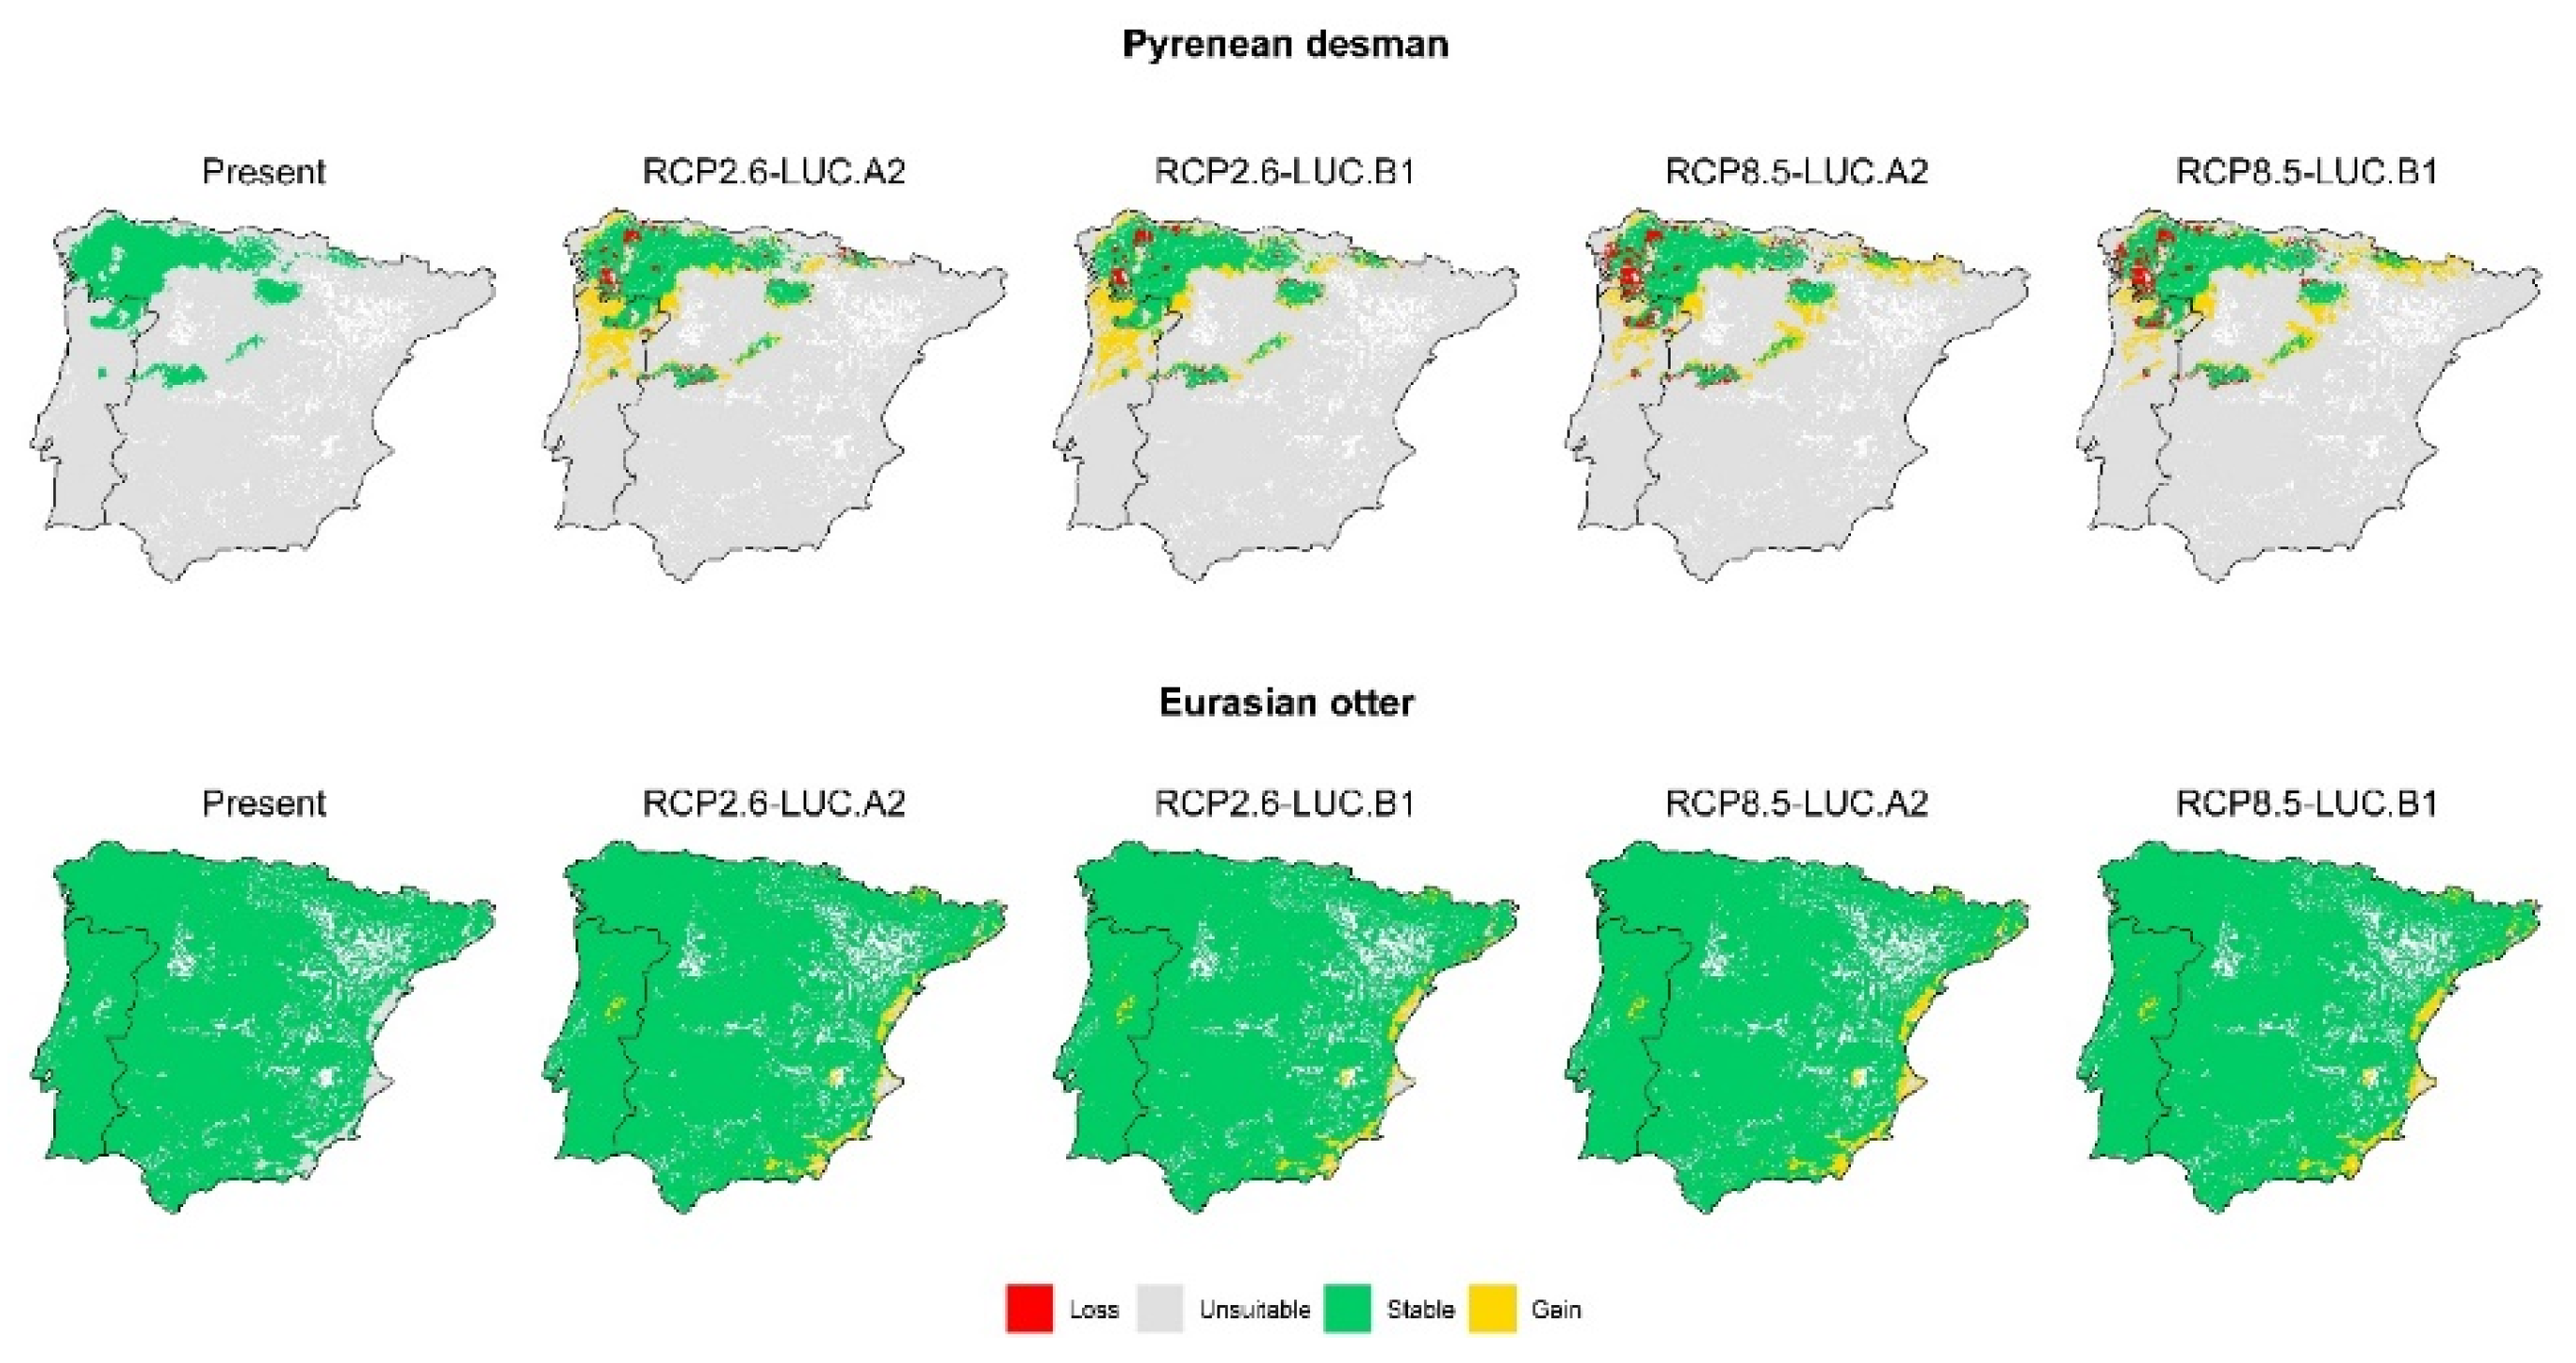
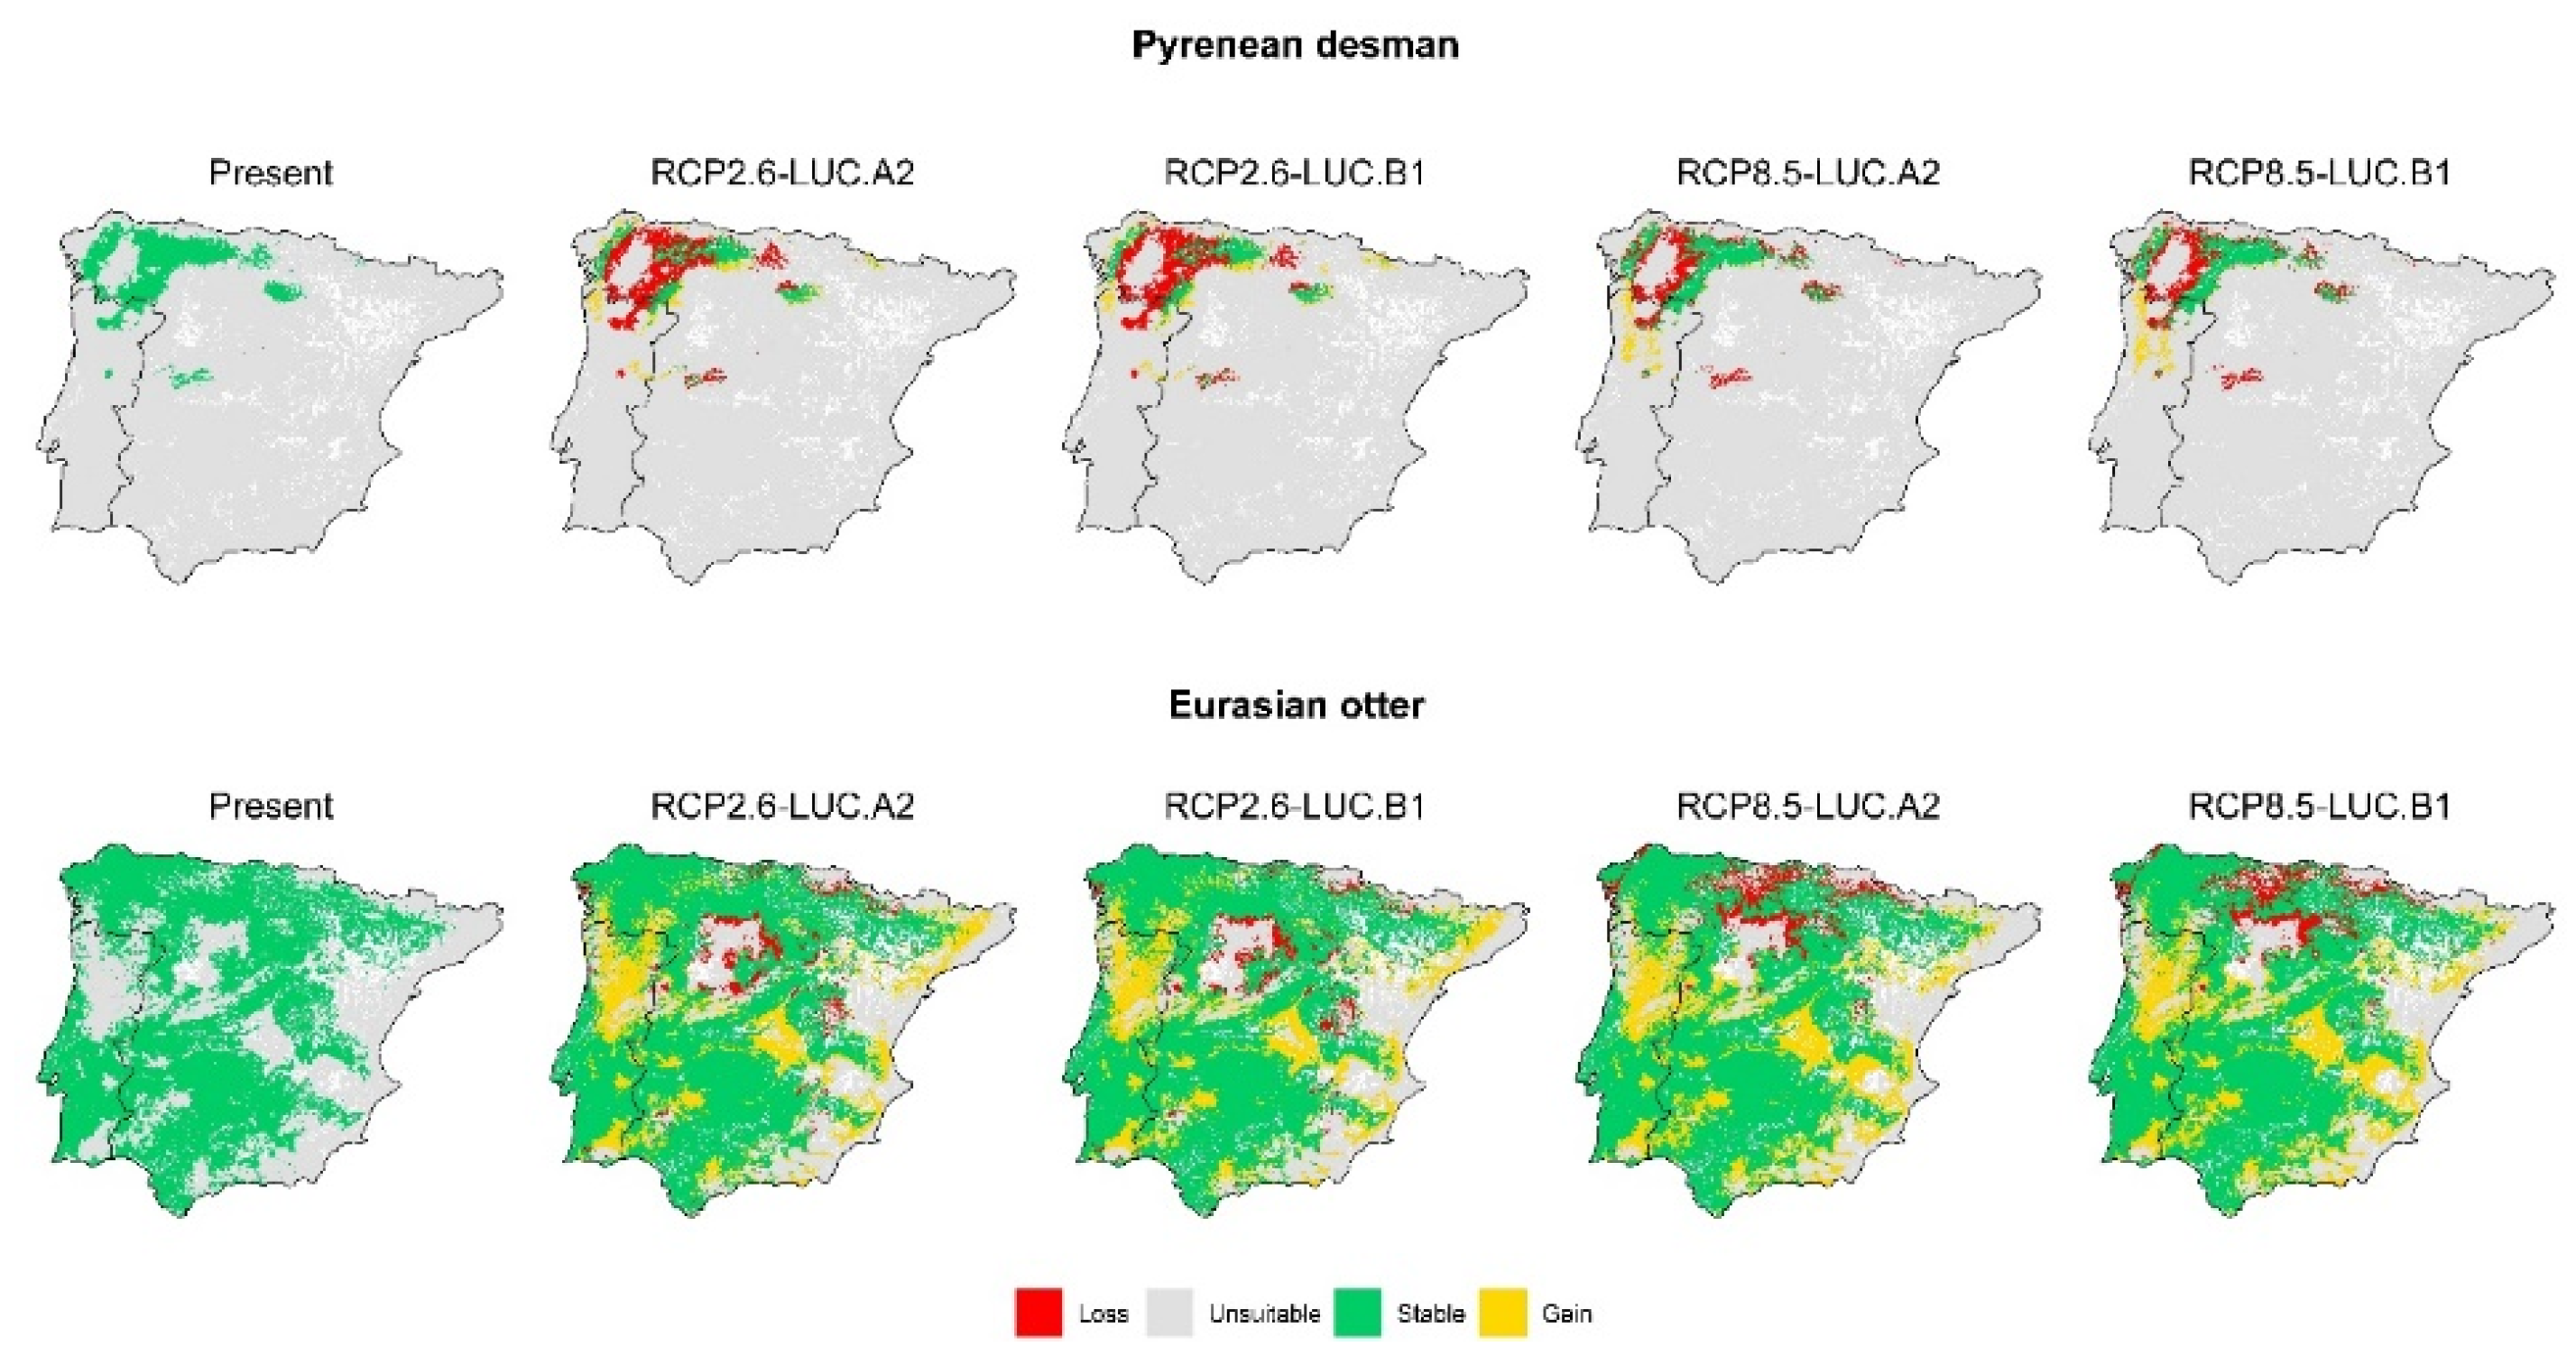
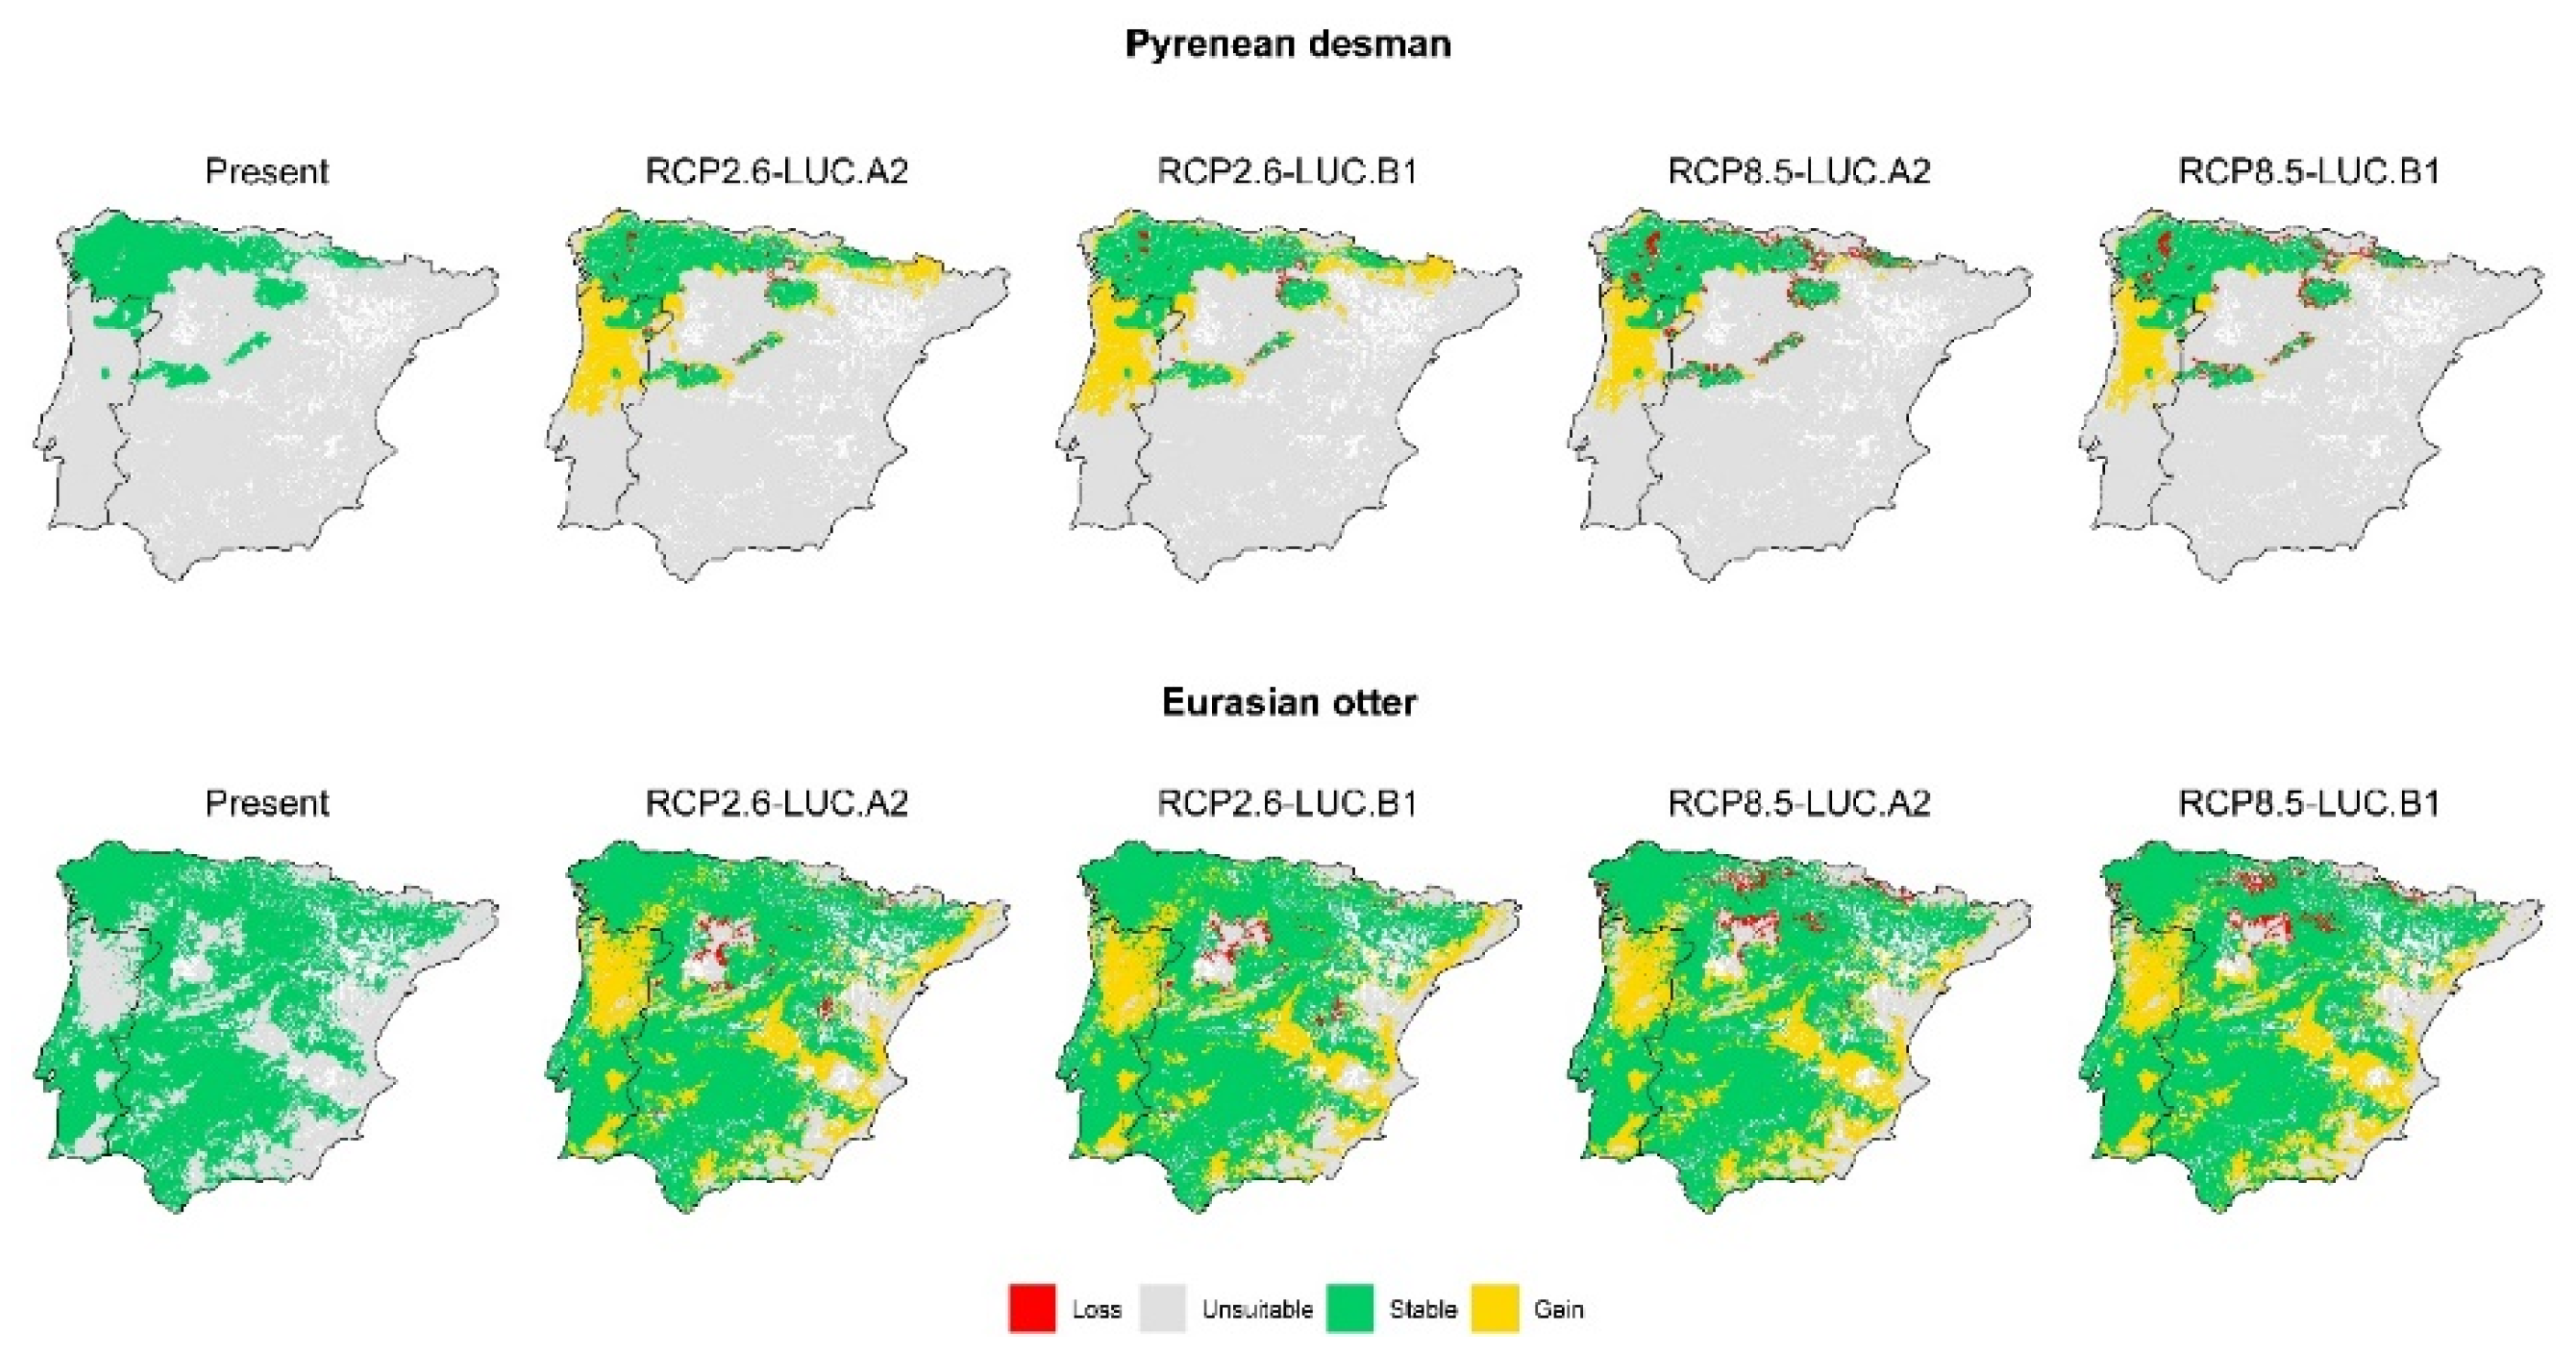
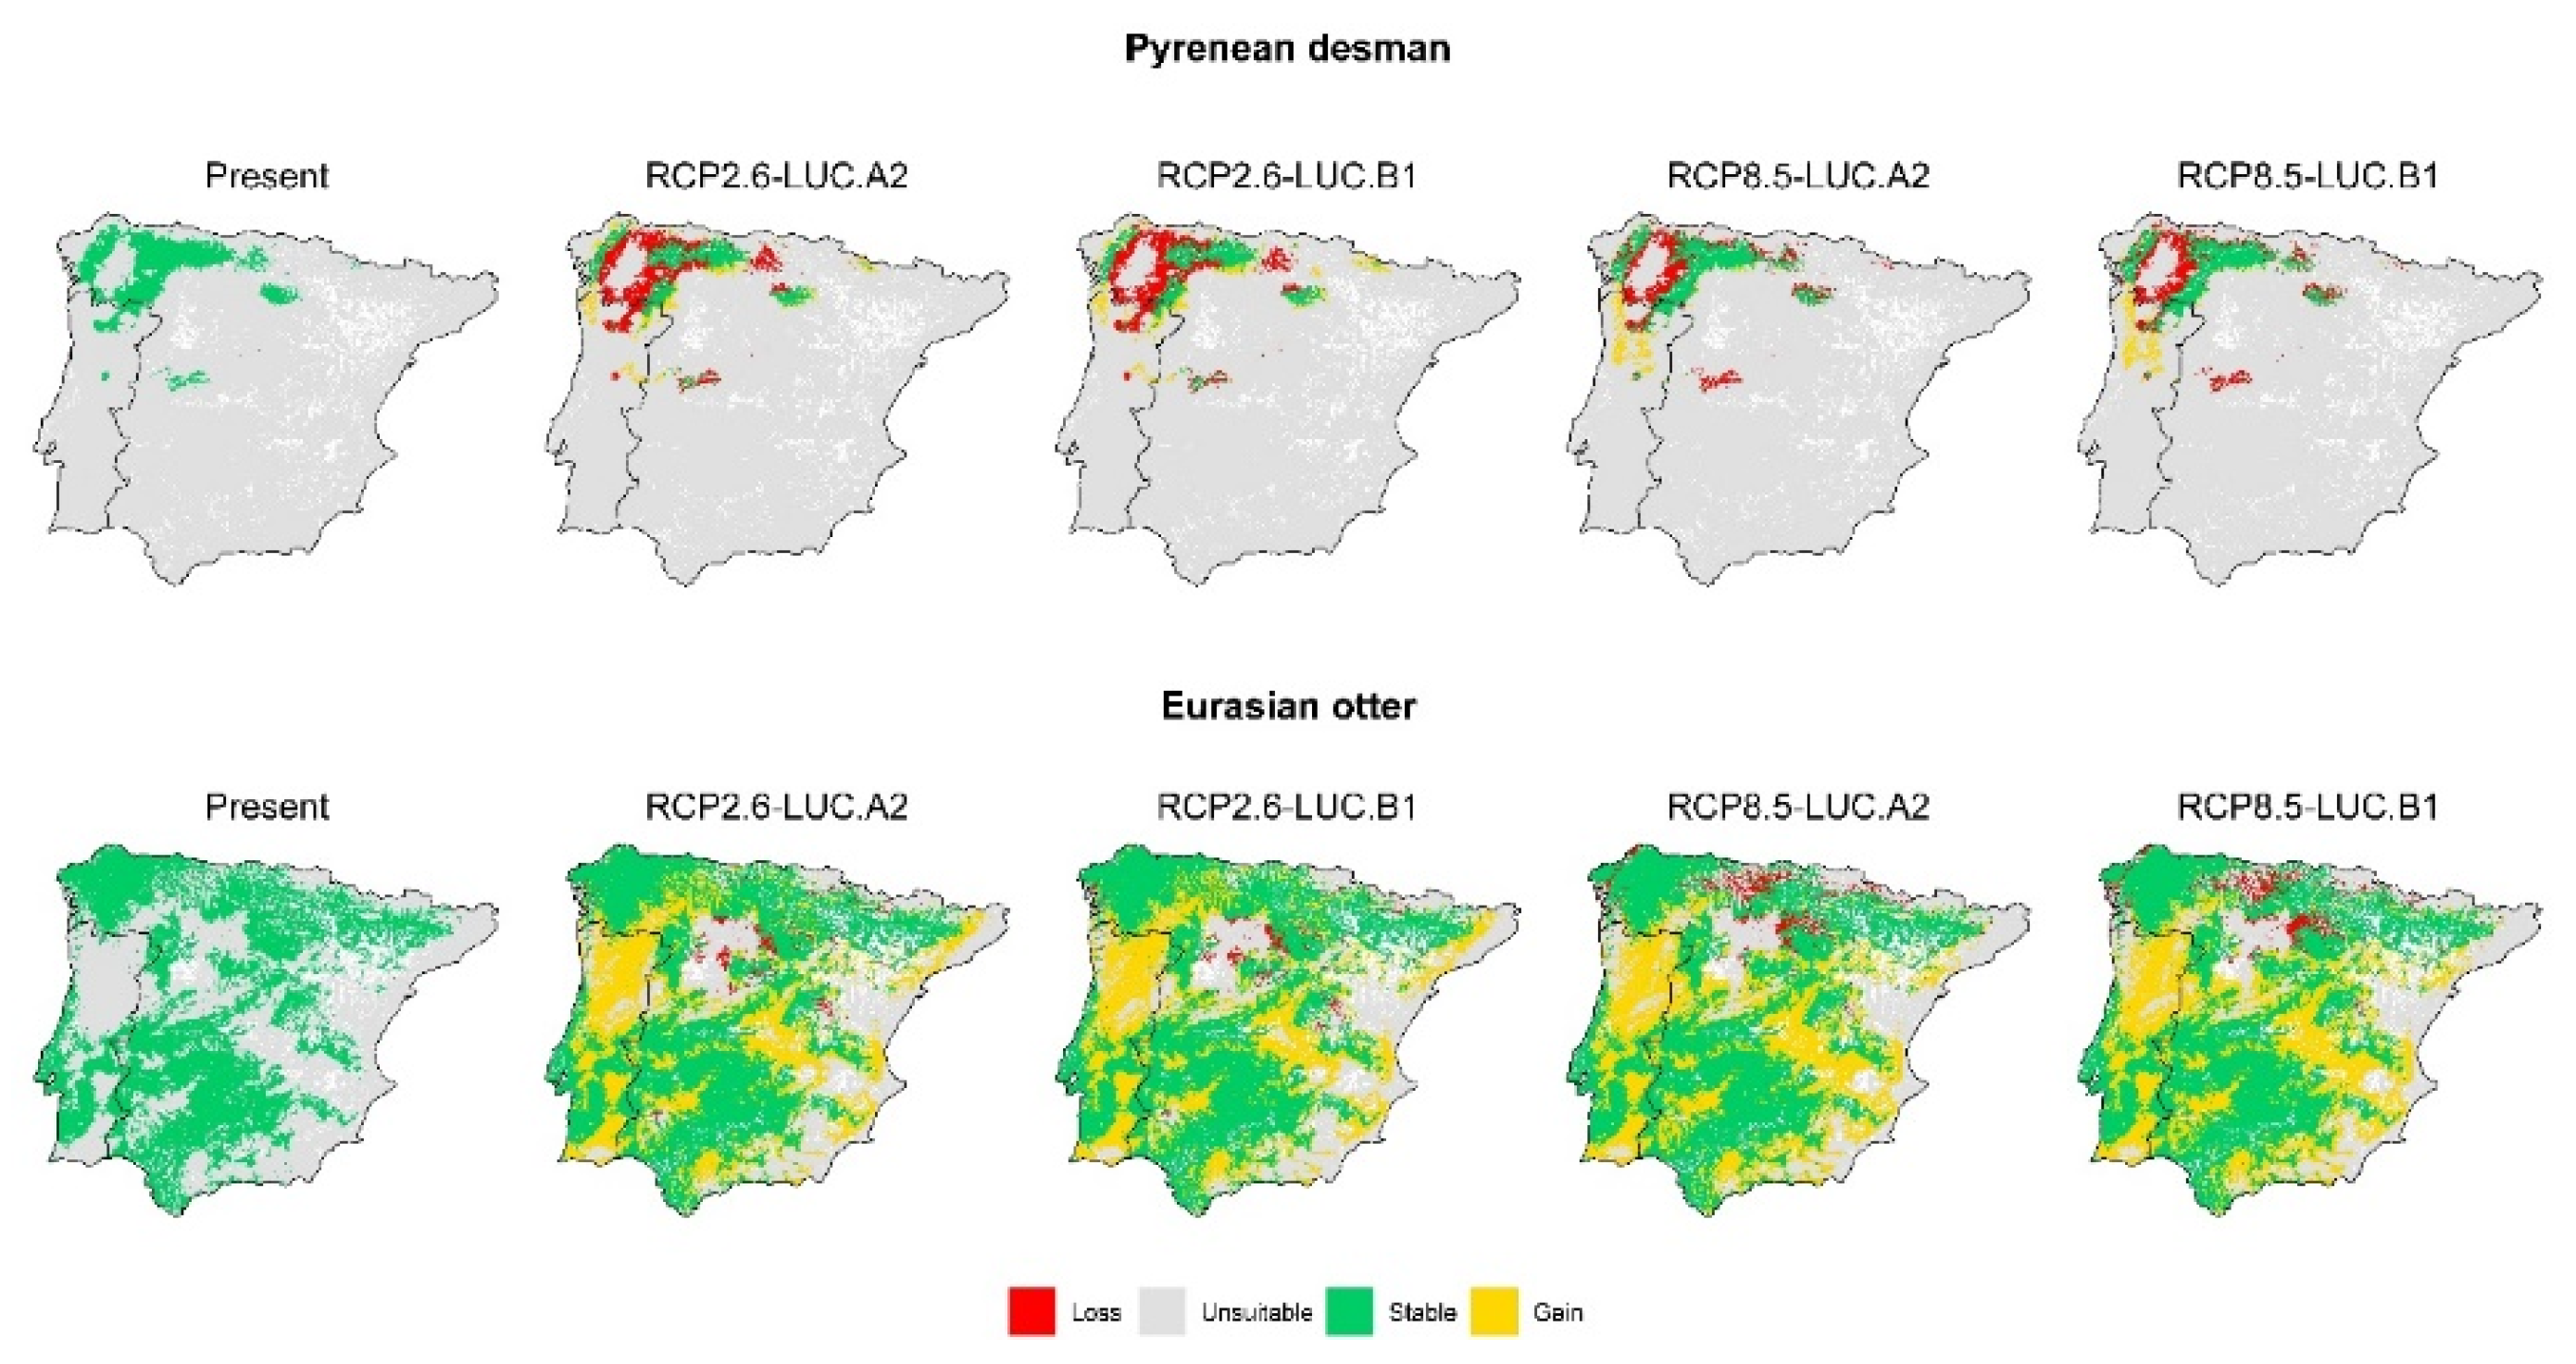
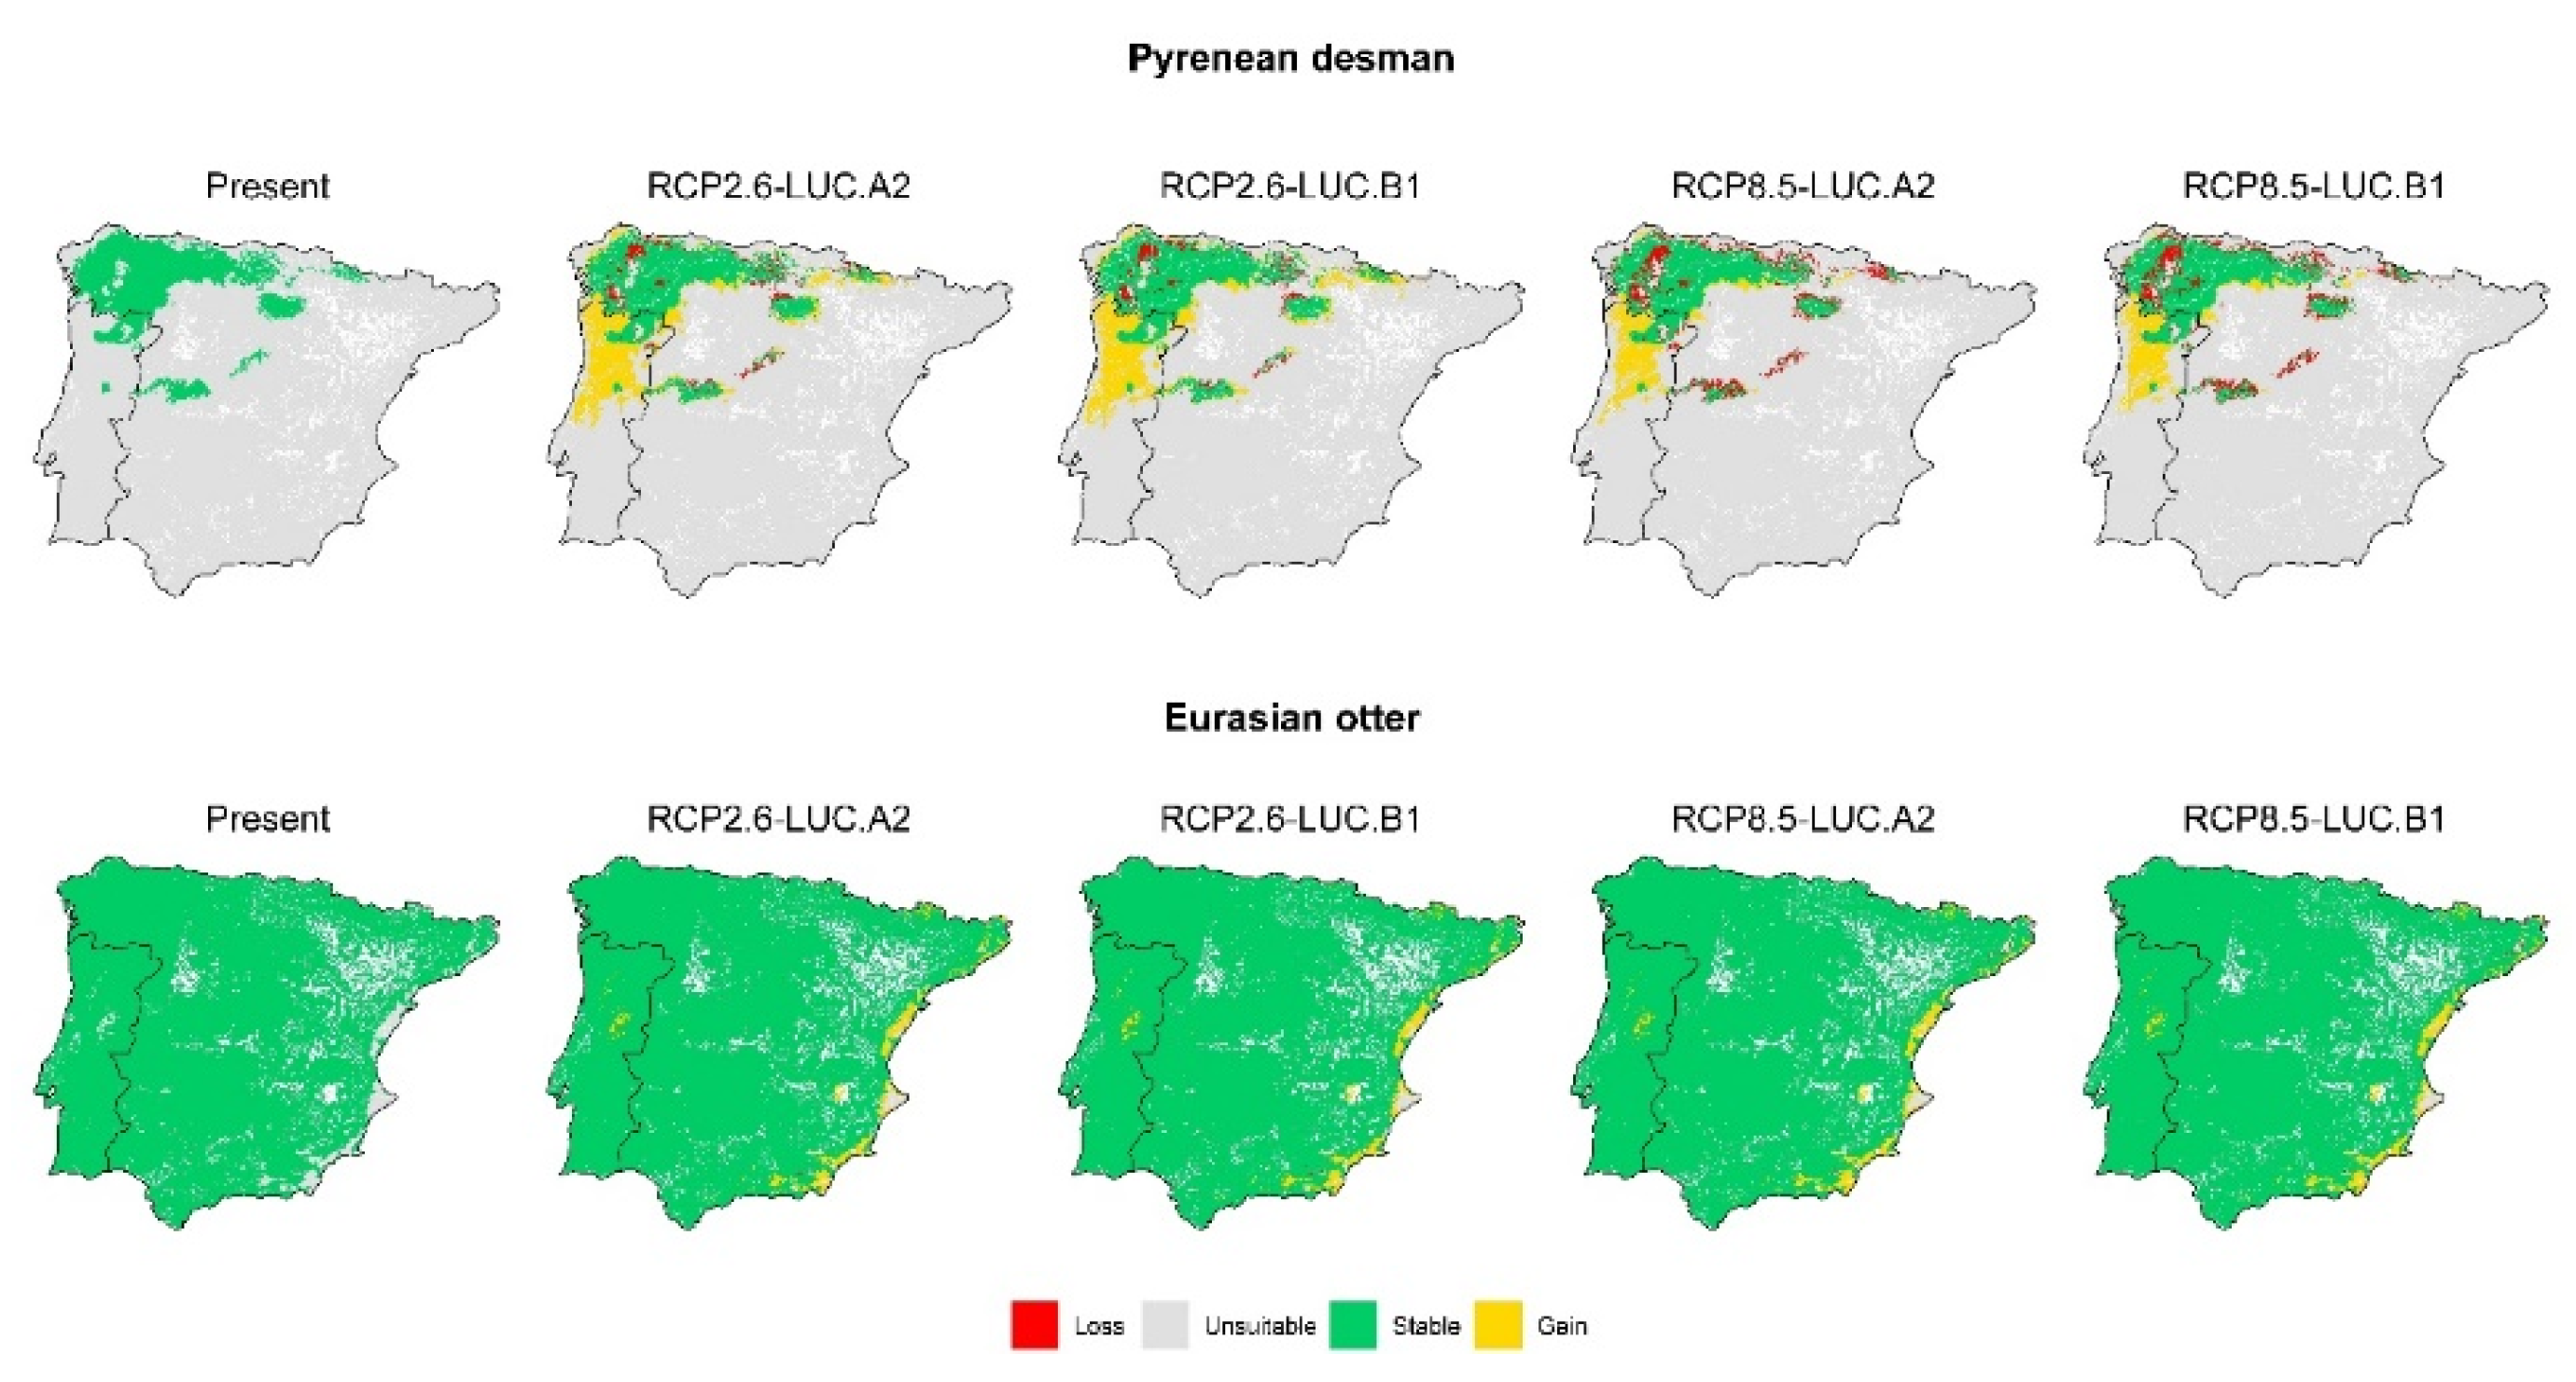
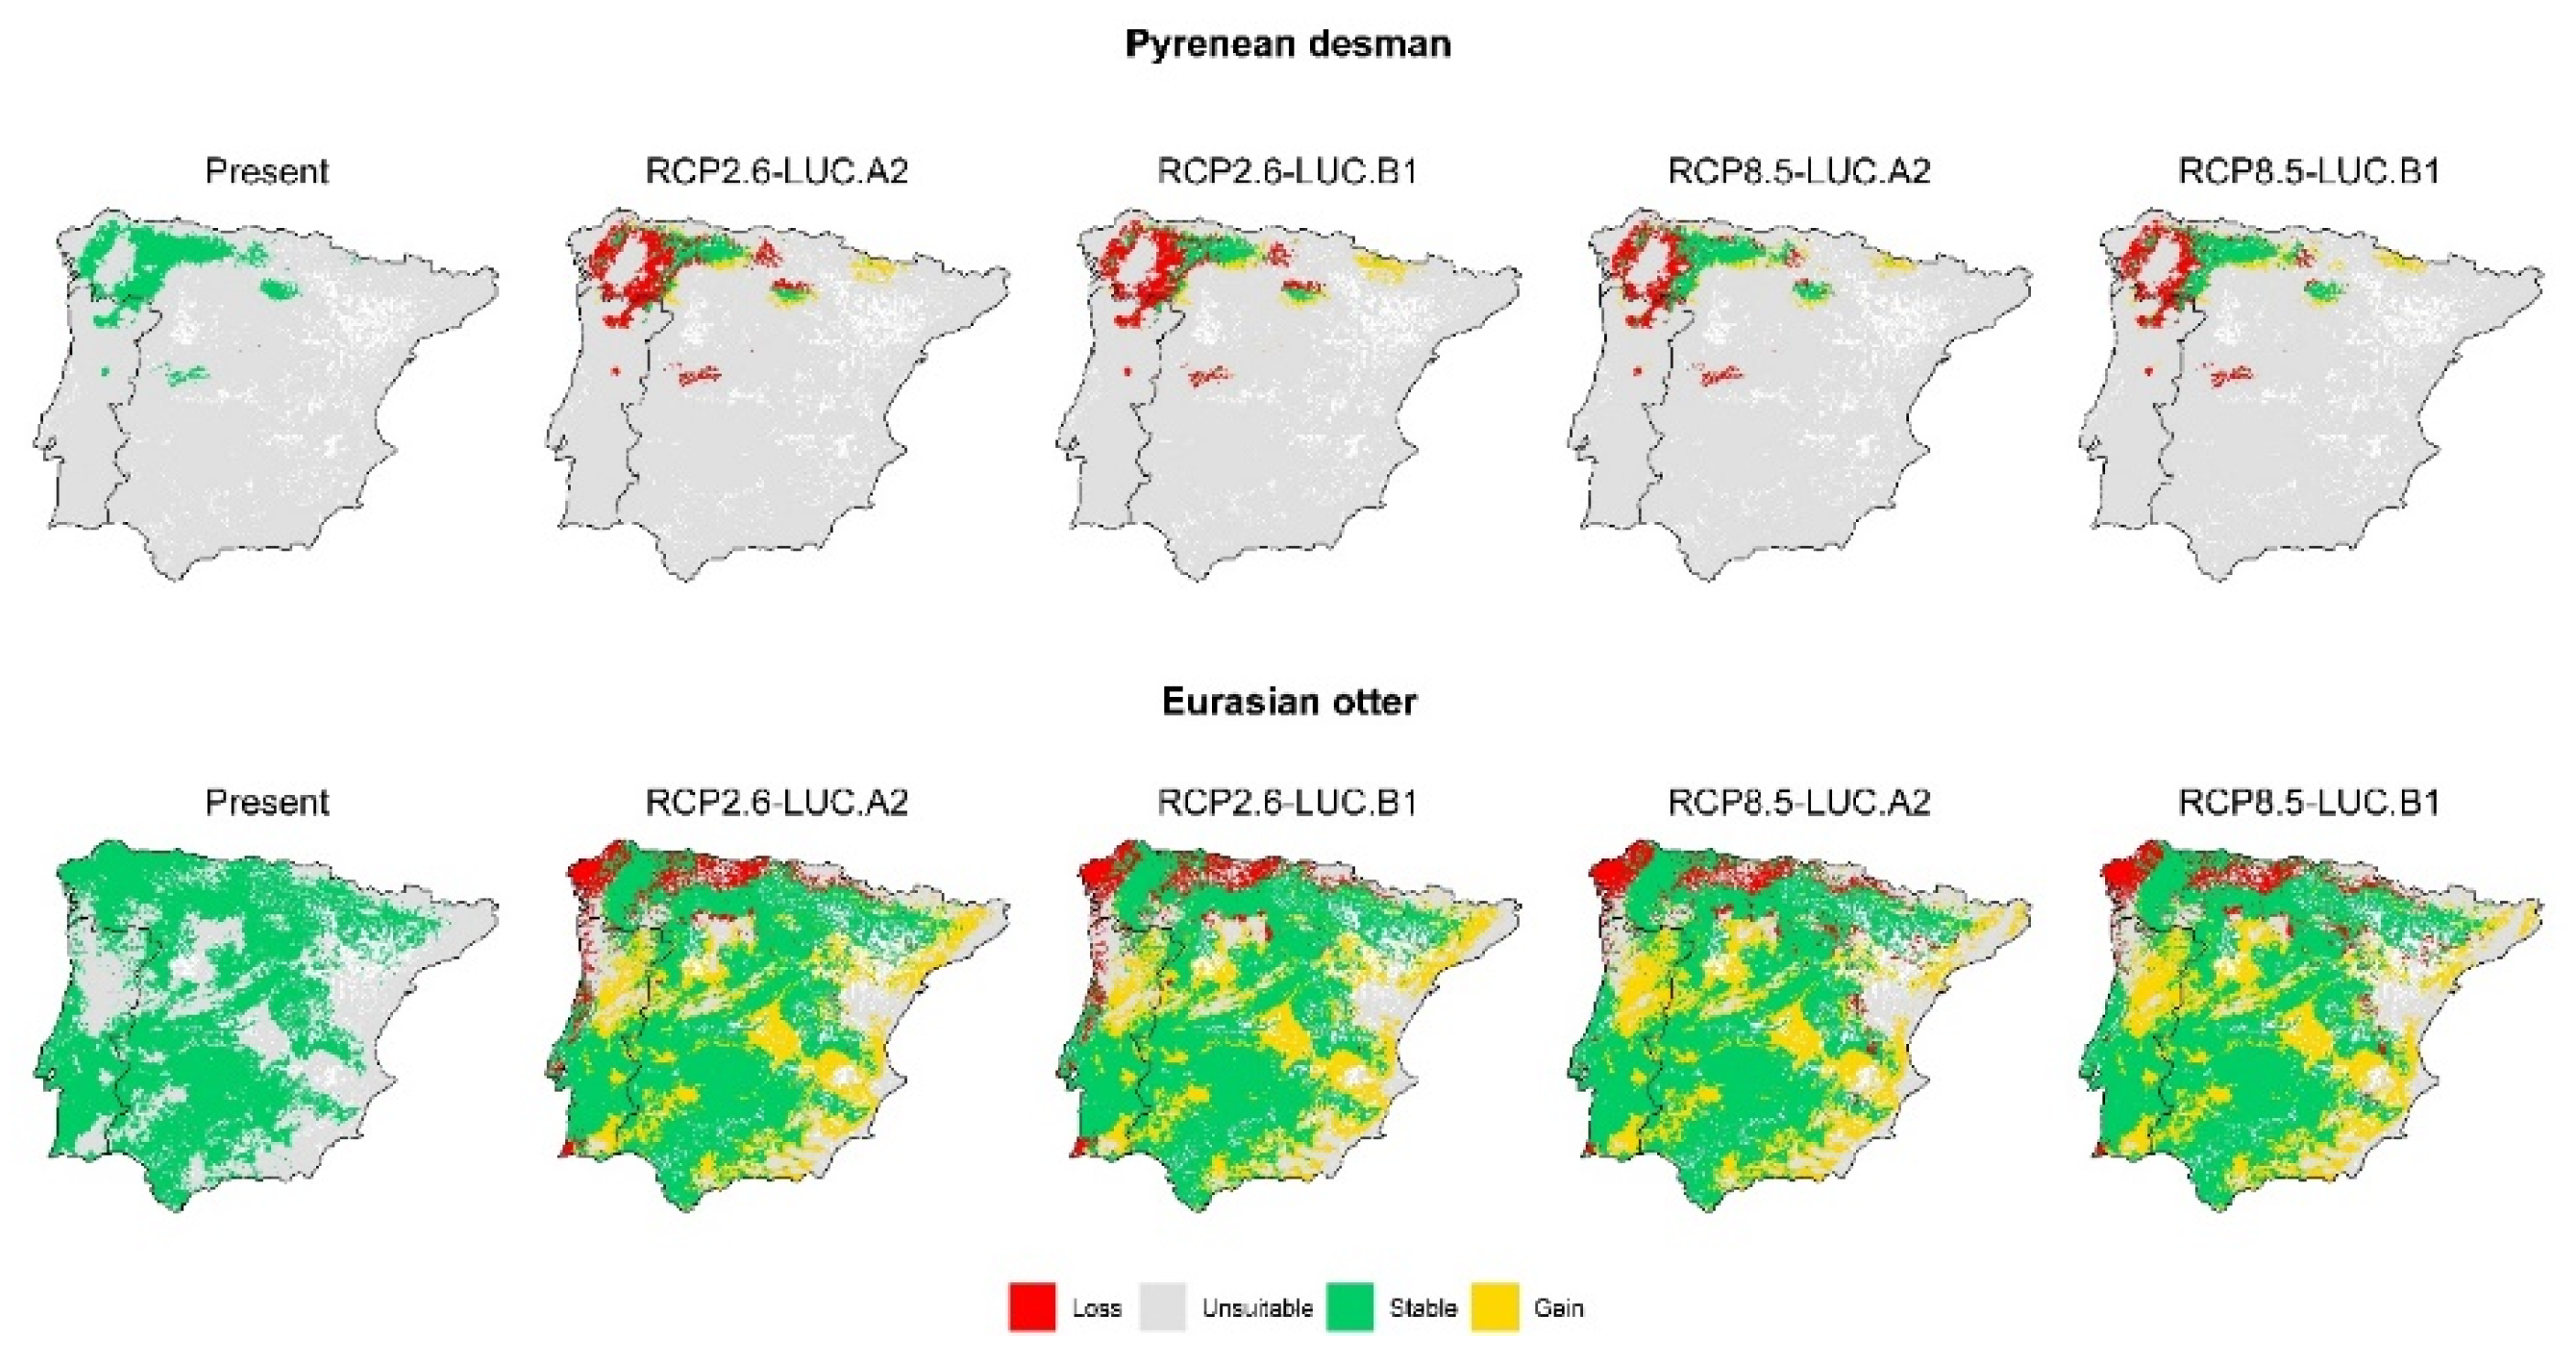
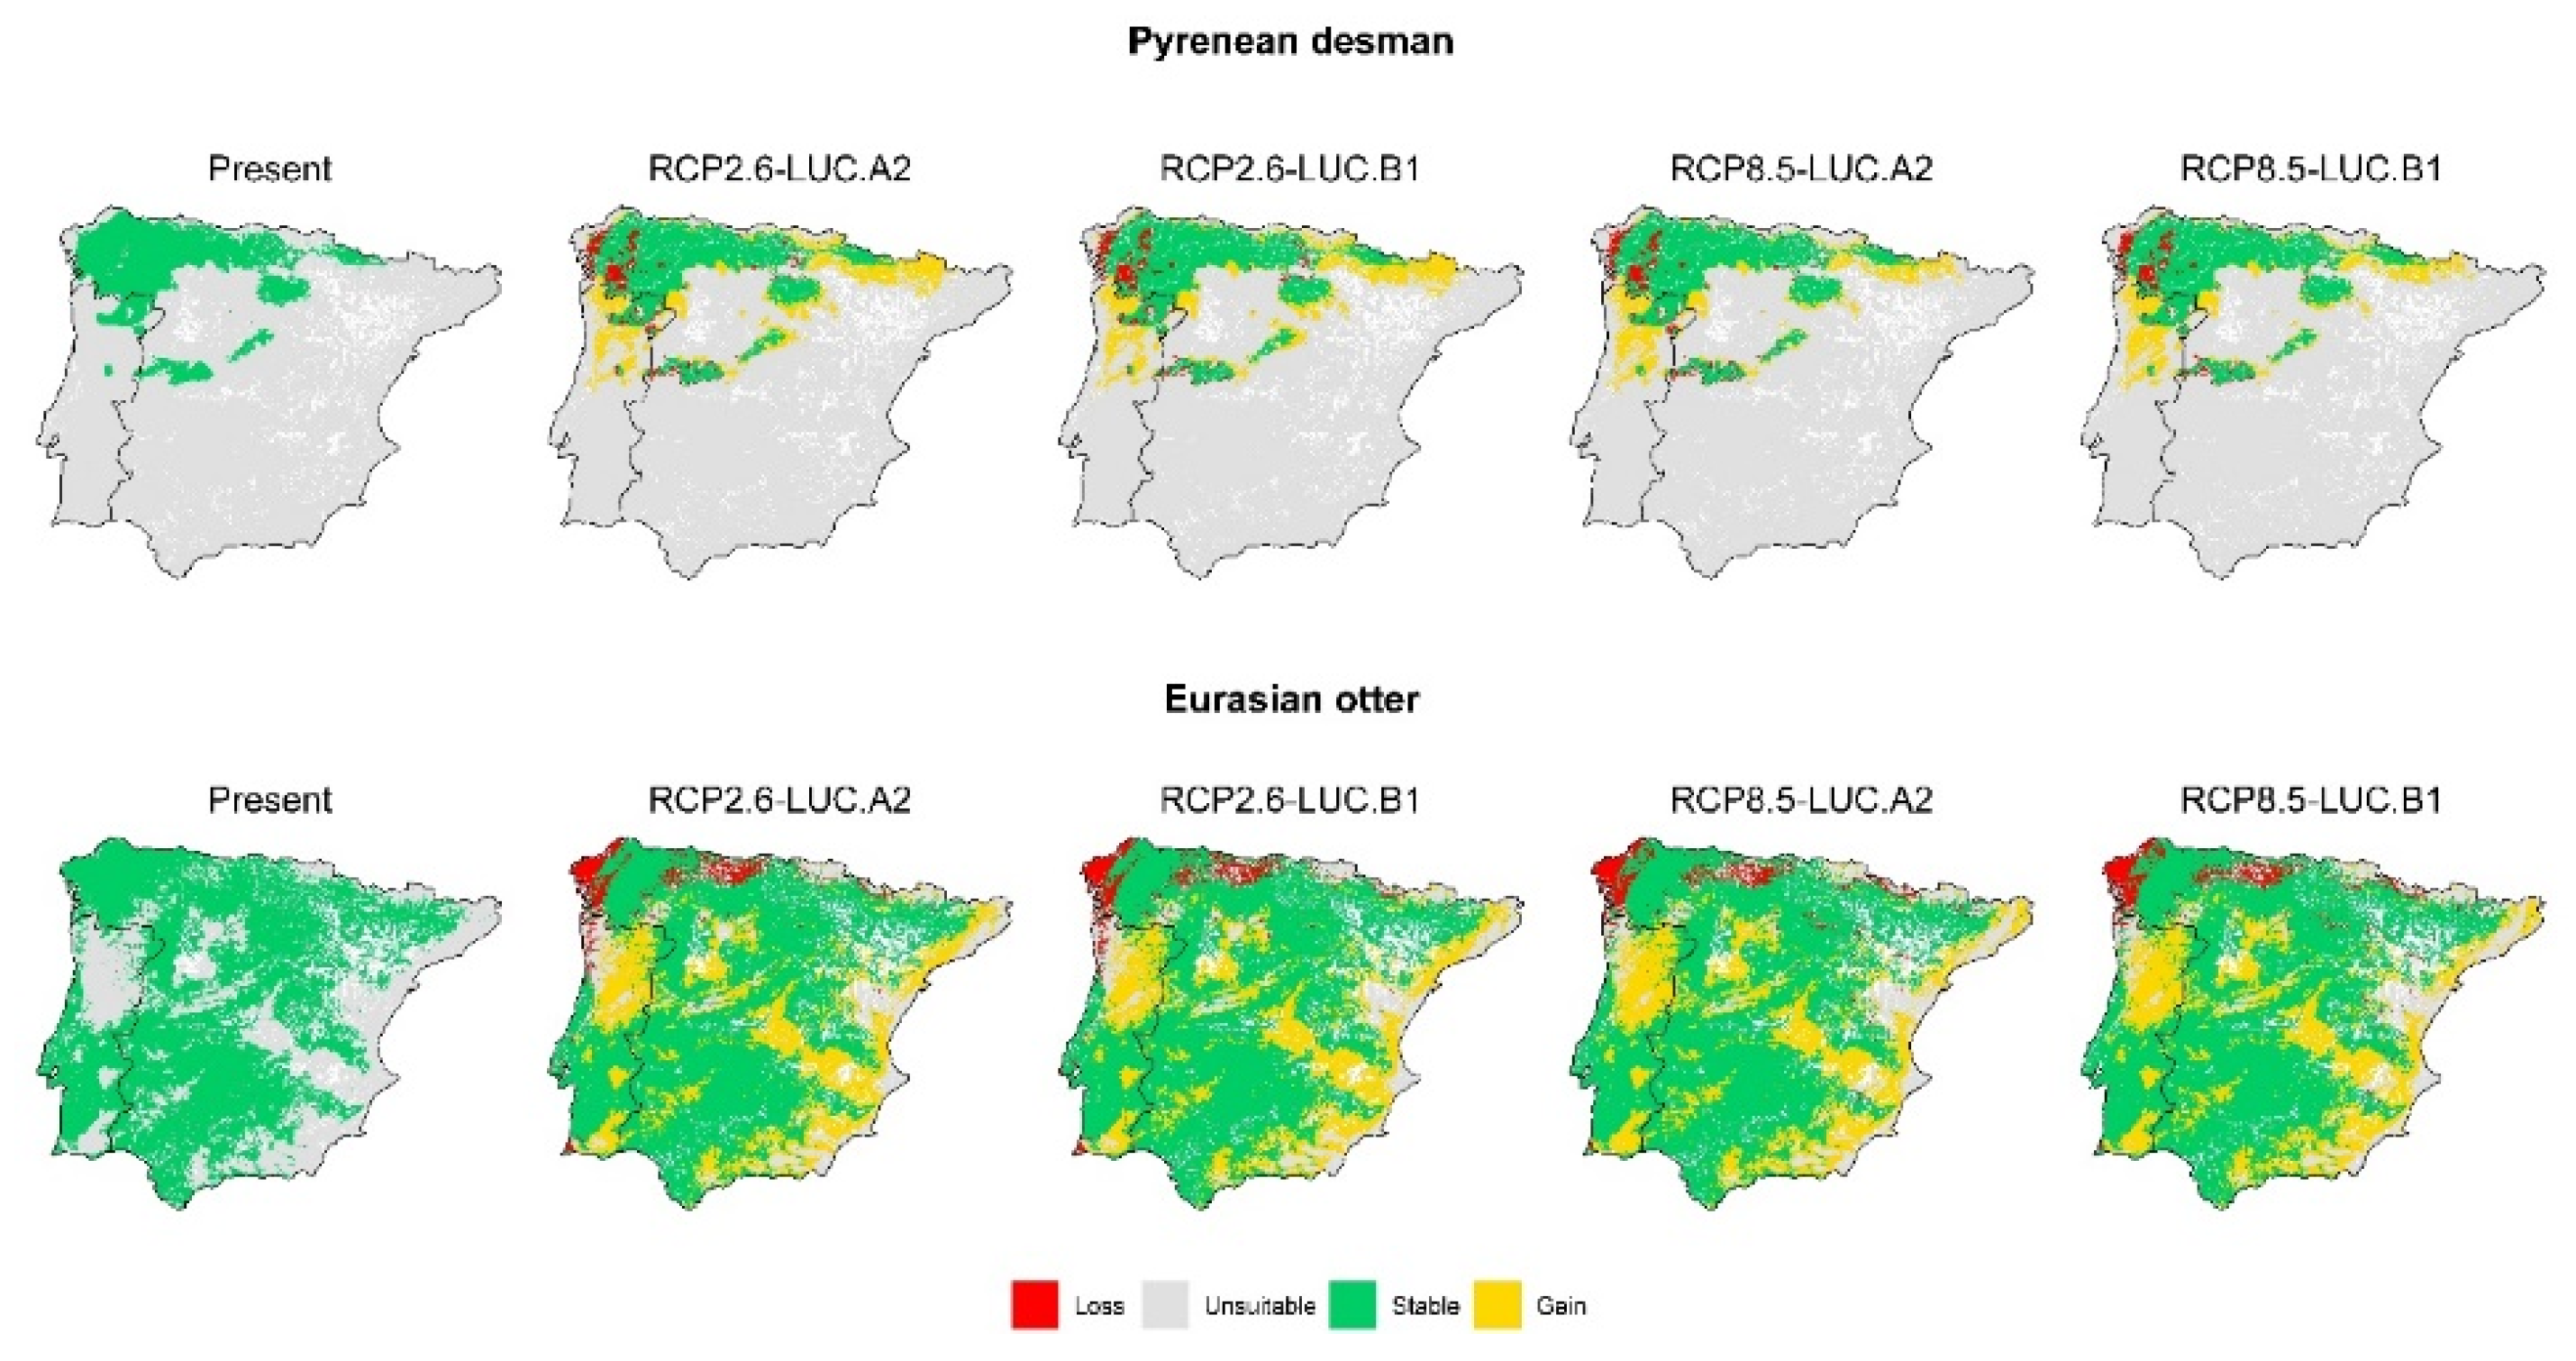
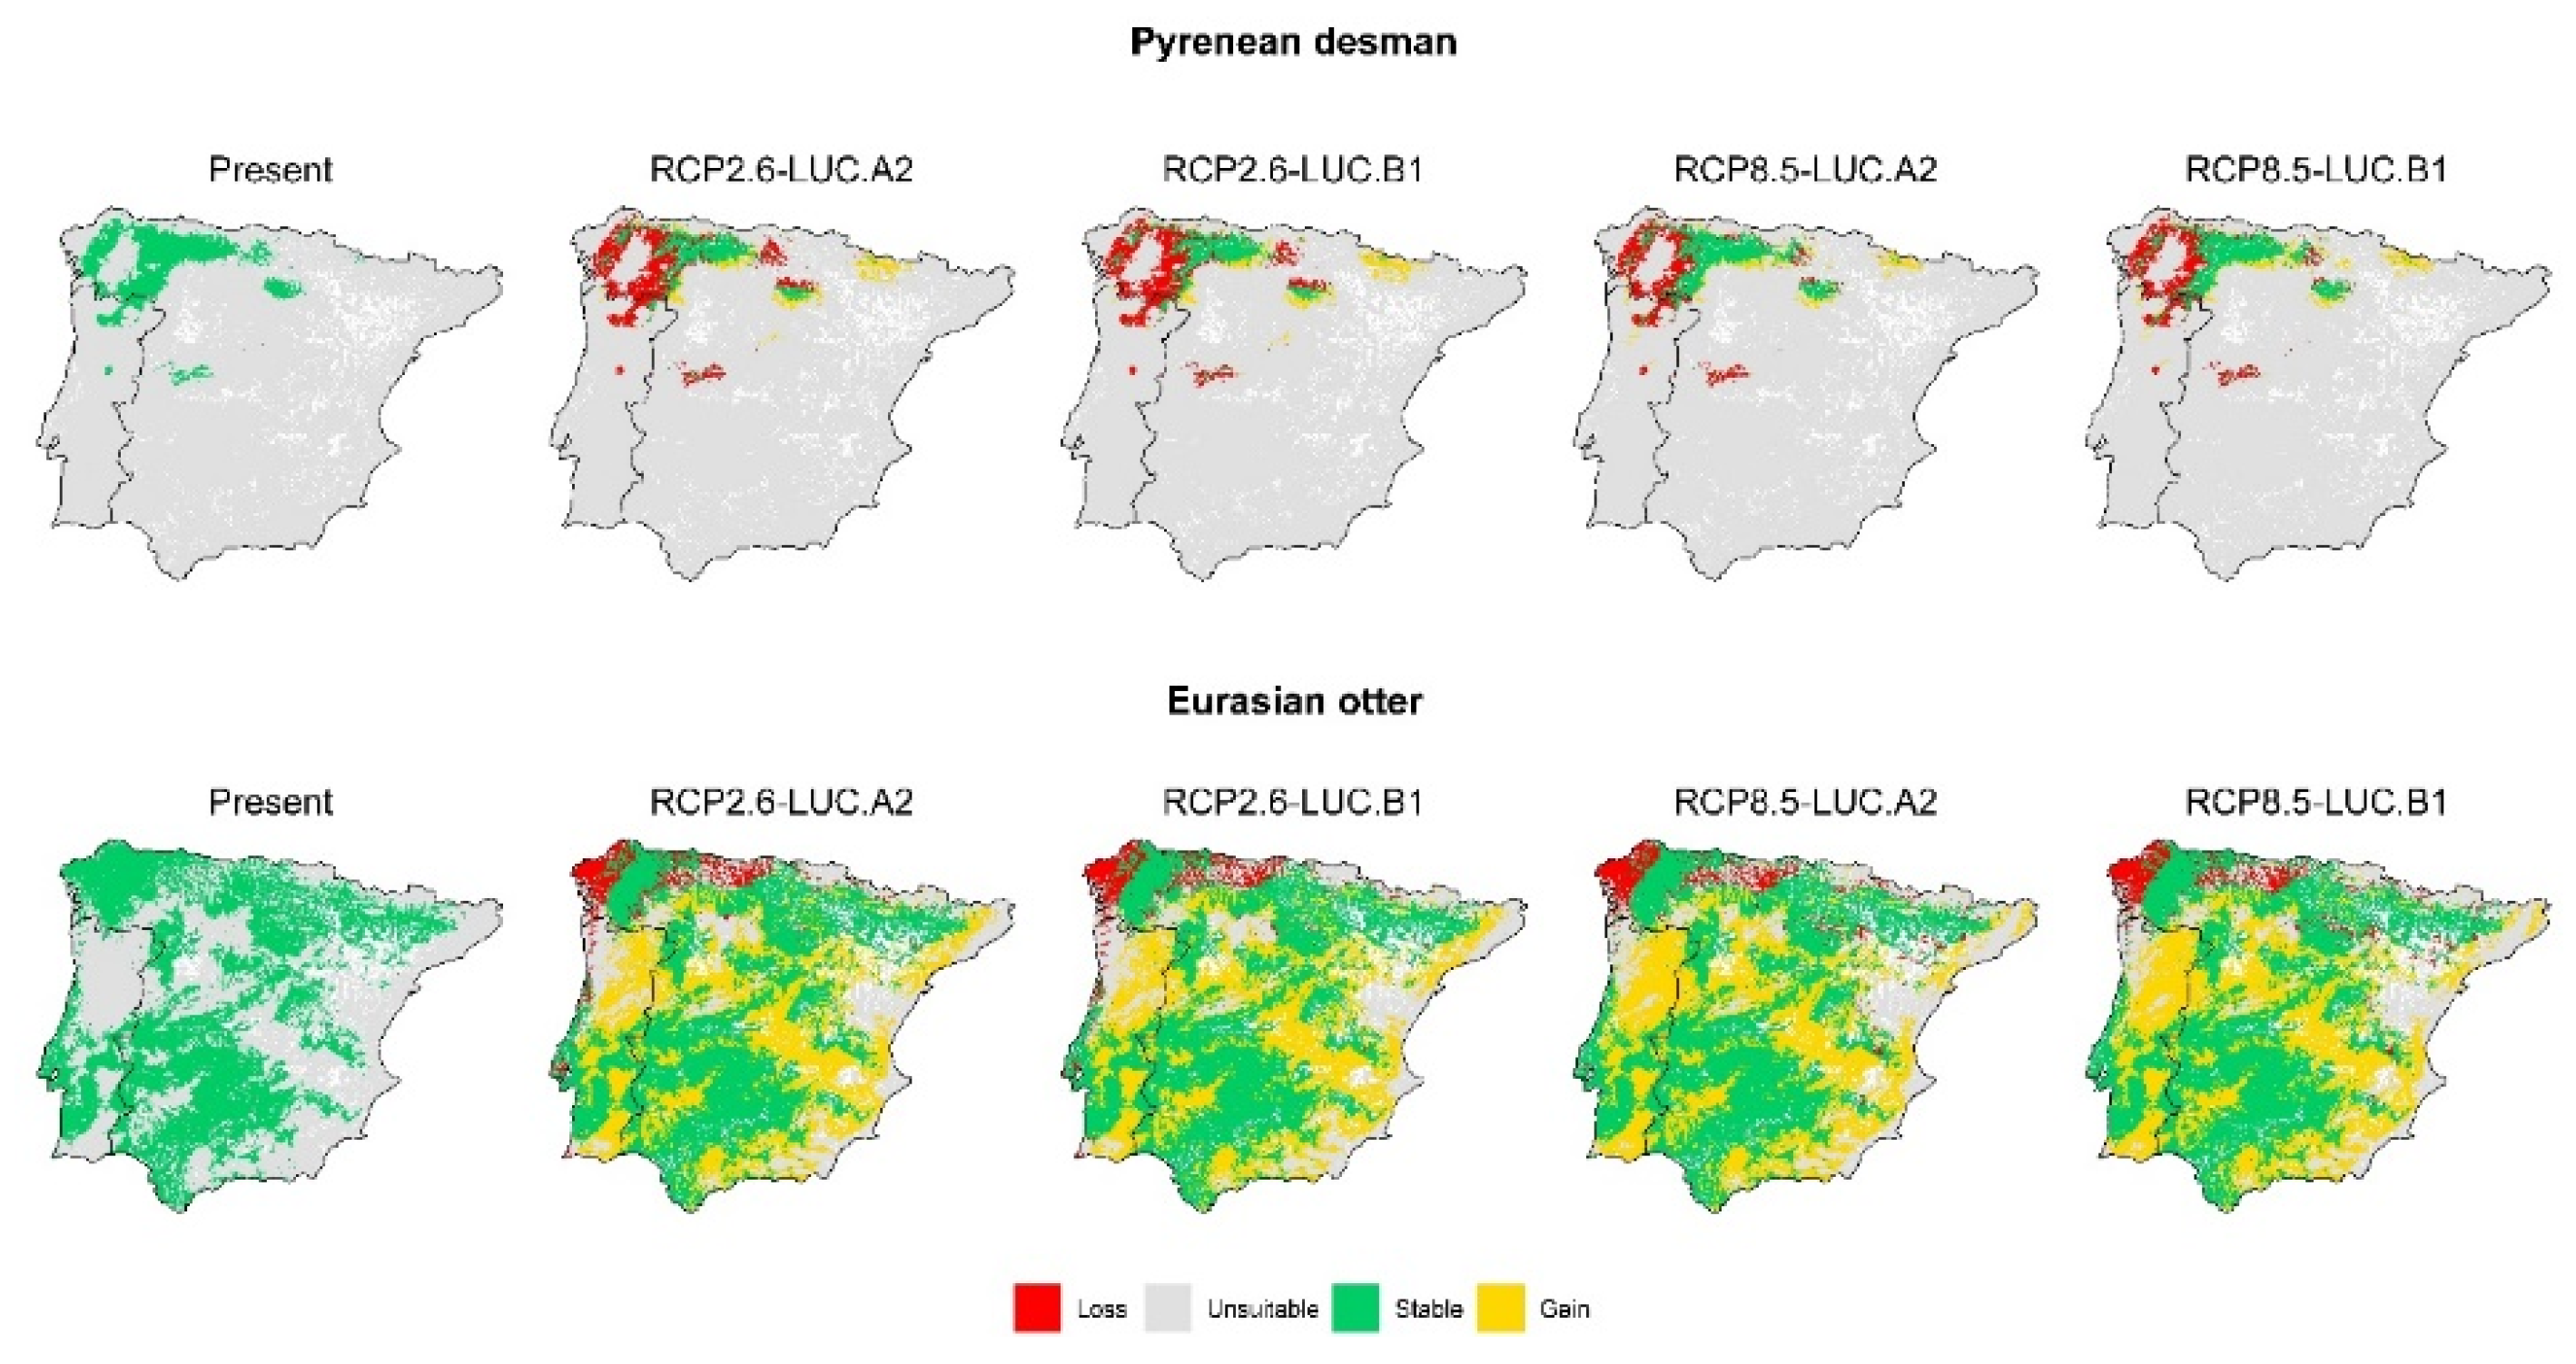
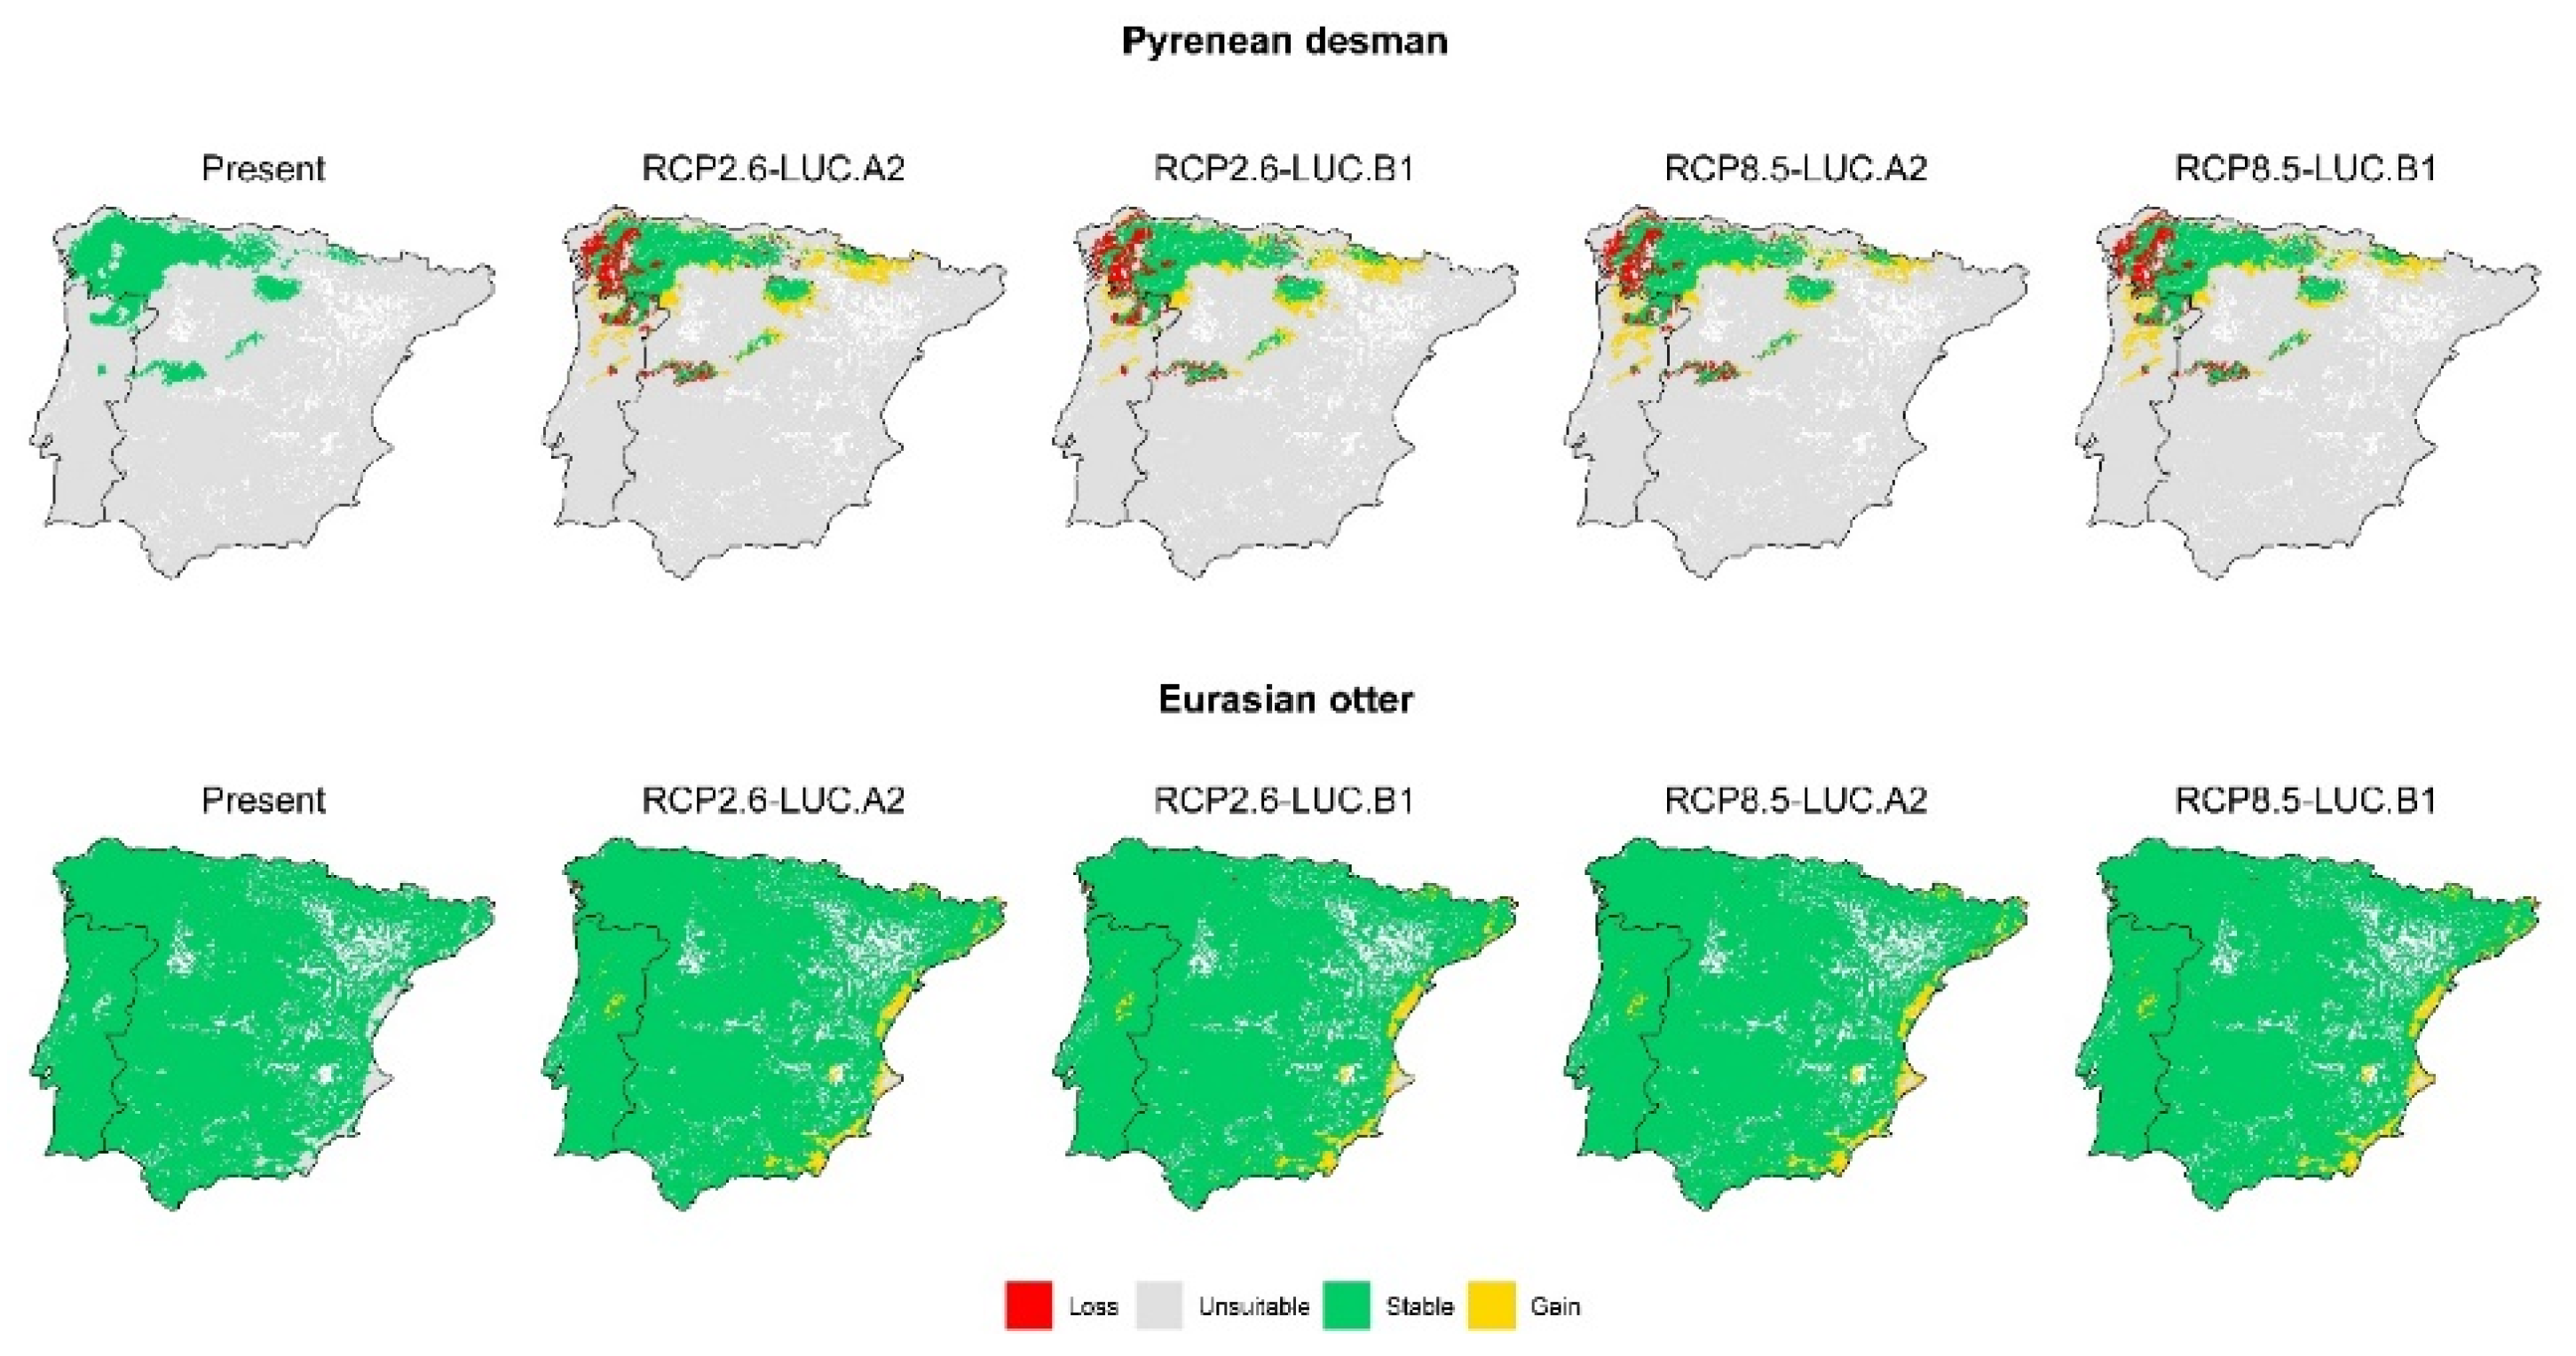
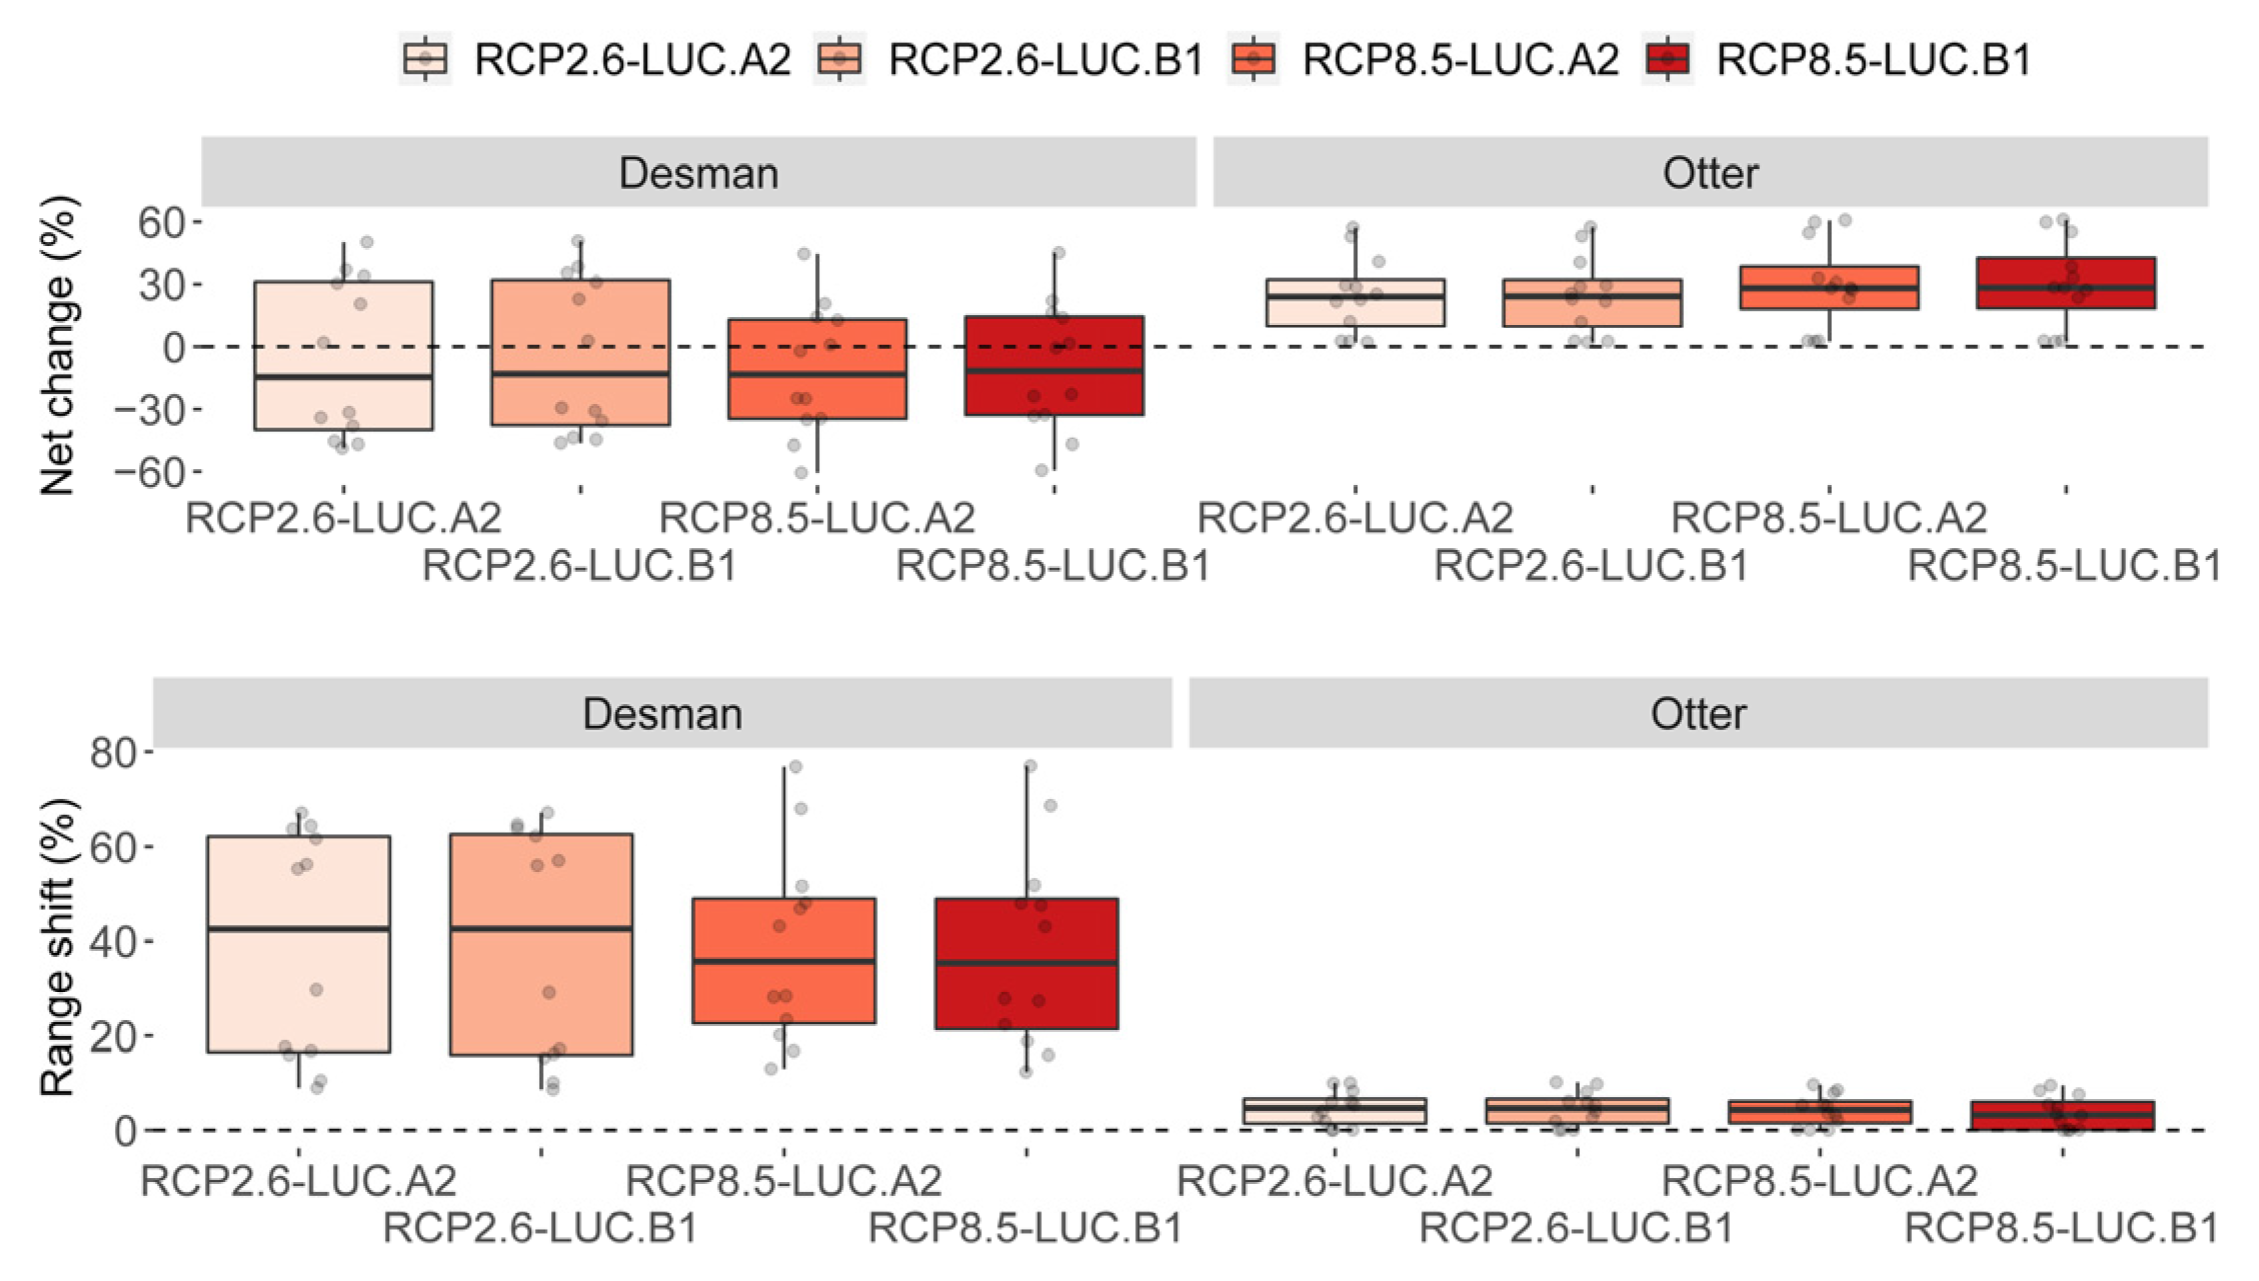
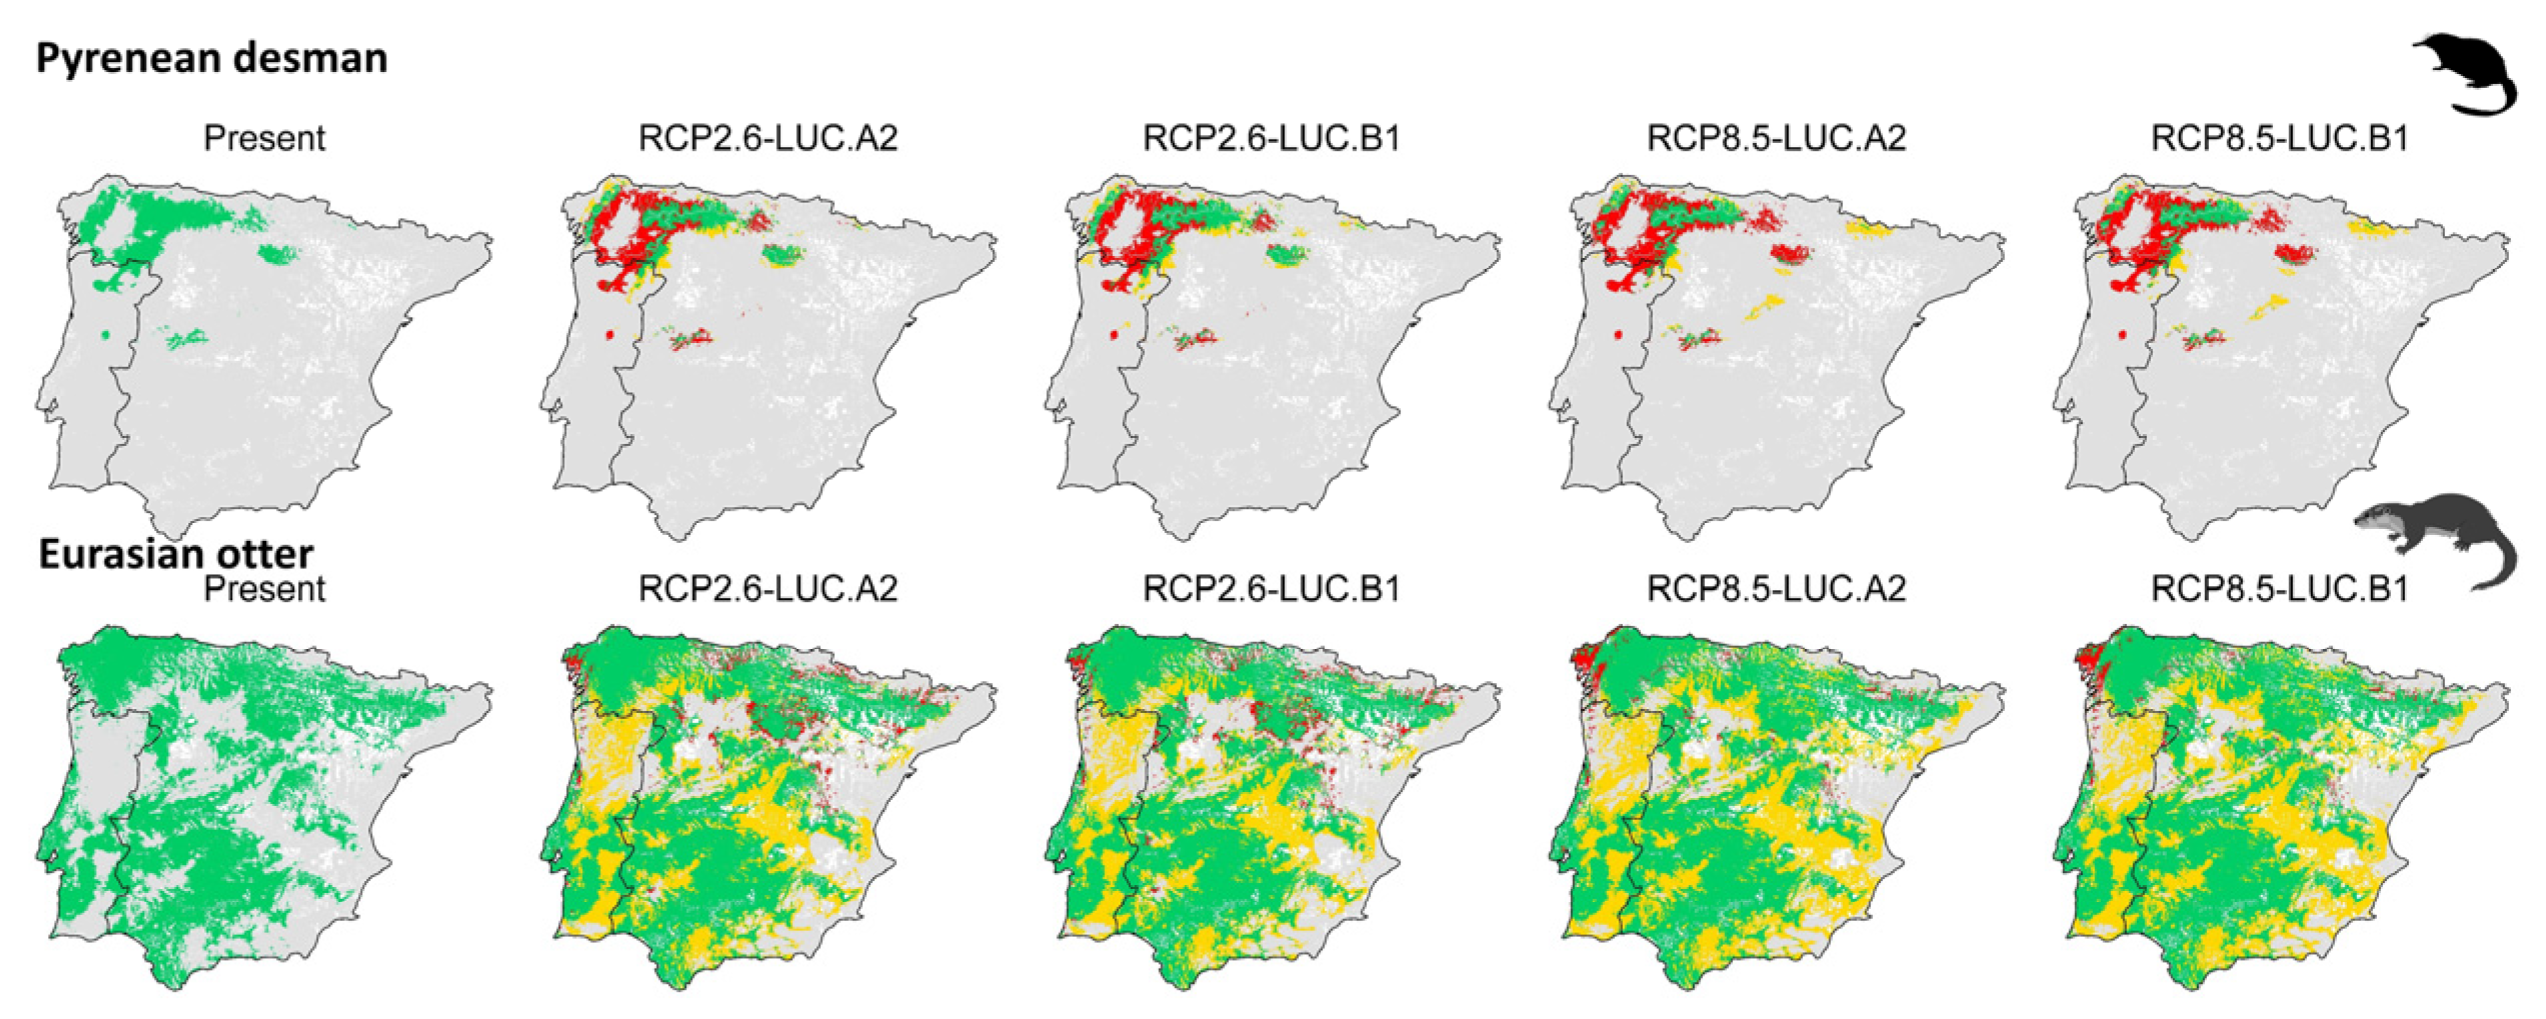
SDM predicted an overall detrimental effect on desman distribution under 2050 global changes, irrespective of the severity of the scenarios (Figure 3 and Figure 4). Under the optimistic scenarios (i.e., RCP.26–LUC.A2 and RCP.26–LUC.B1), desman distribution will likely undergo a ca. 15% reduction and a ca. 42% shift (Figure 3 and Figure 4; Figure A2, Figure A3, Figure A4, Figure A5, Figure A6, Figure A7, Figure A8, Figure A9, Figure A10, Figure A11Figure A12 and Figure A13) compared to its current range. The corresponding figure under the most pessimistic scenarios (i.e., RCP8.5–LUC.A2 and RCP8.5–LUC.B1) reported a negative range net change of ca. 15% and a range shift of ca. 35%. The otter showed a rather opposite pattern. In fact, both optimistic and pessimistic scenarios indicate a positive range net change (ca. 25%), while the shifted range percentage resulted in around 5% (Figure 3 and Figure 4; Figure A2, Figure A3, Figure A4, Figure A5, Figure A6, Figure A7, Figure A8, Figure A9, Figure A10, Figure A11Figure A12 and Figure A13).

3.3. Spatial Overlap

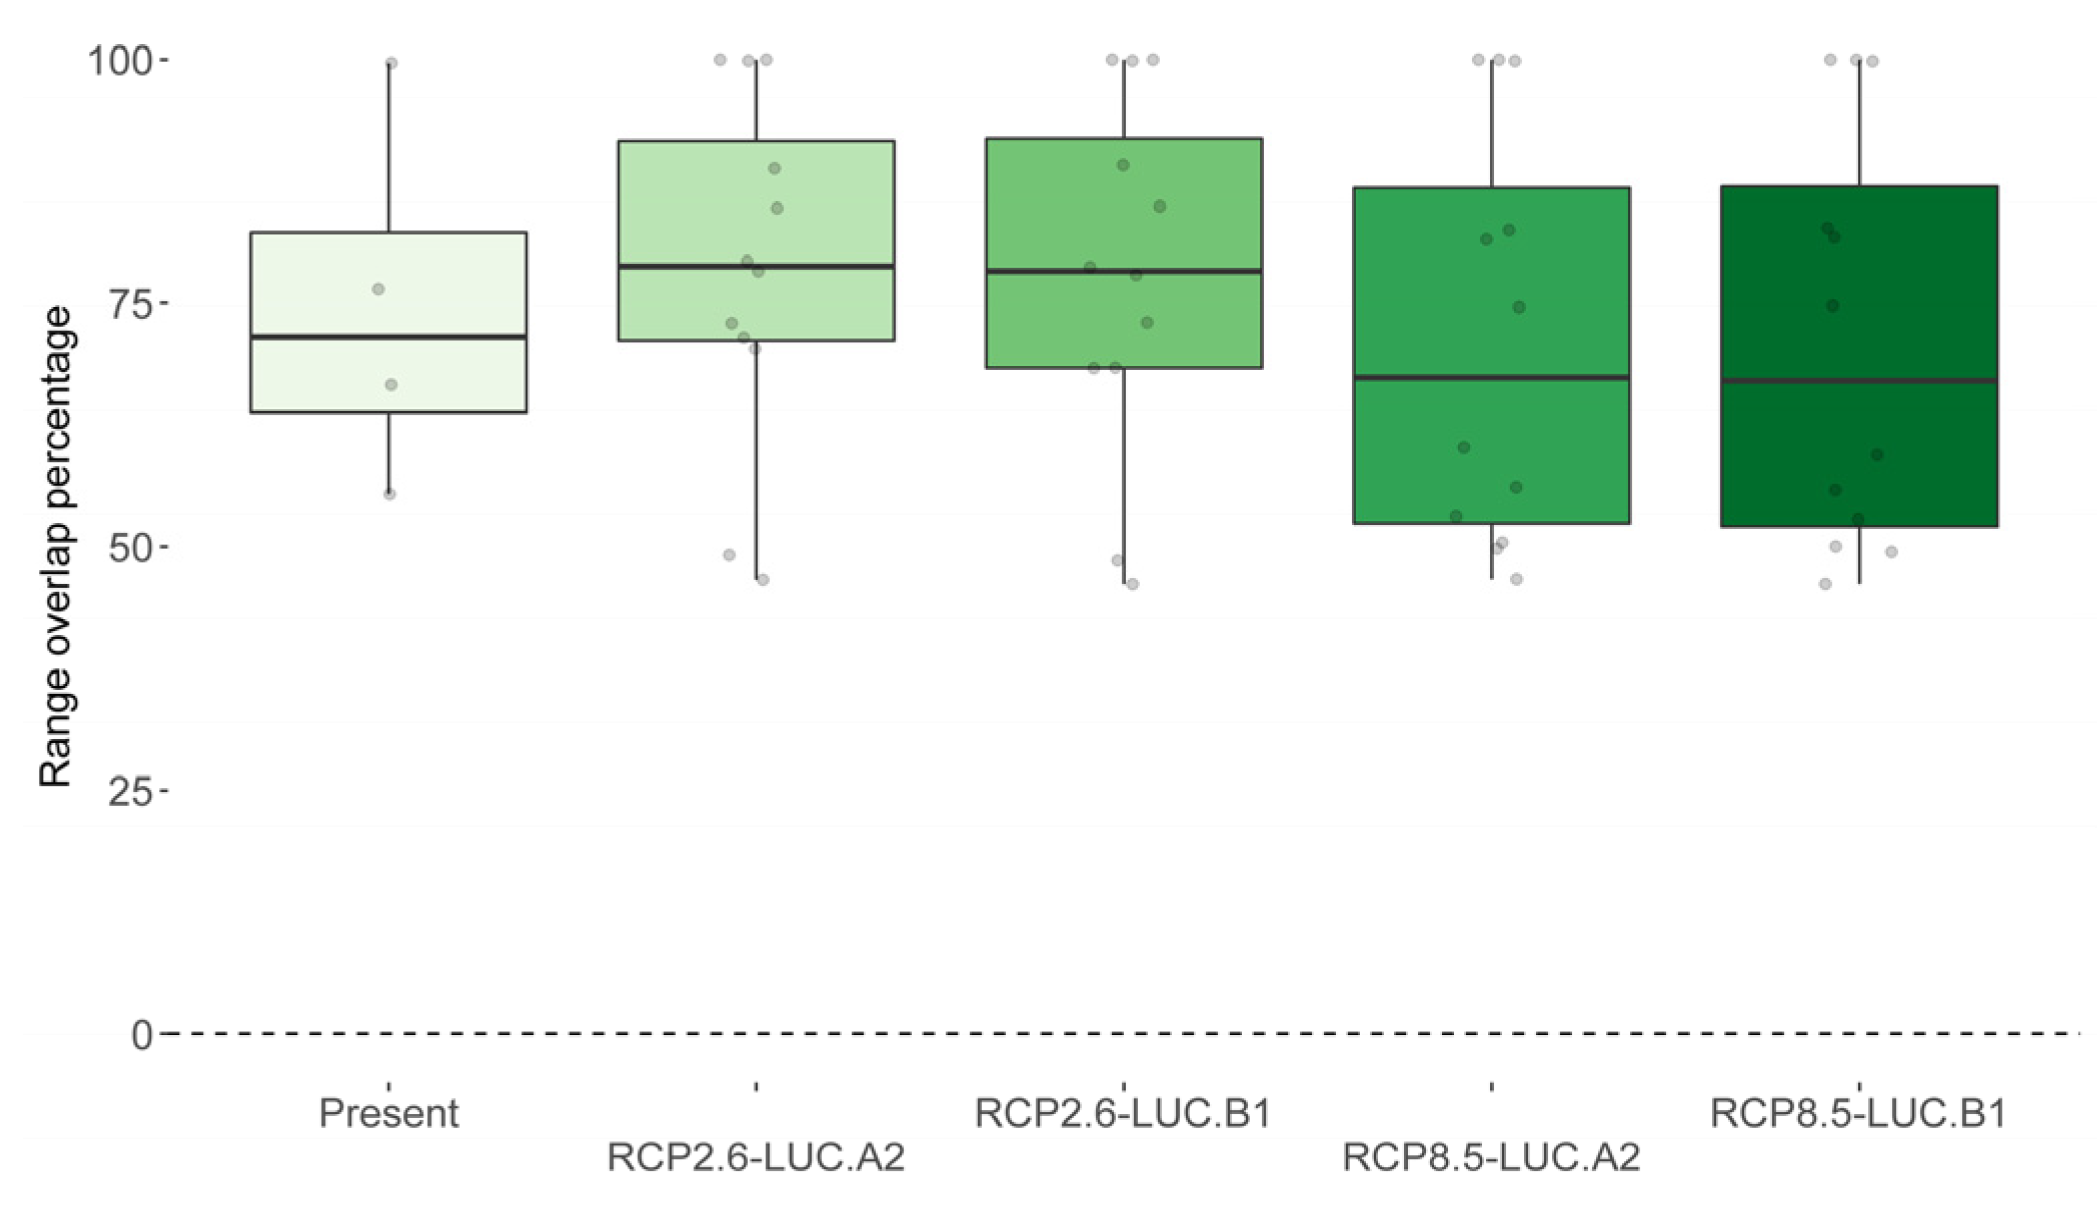
The median percentage of desman distribution that overlaps with otter range under current environmental conditions is 71% (SD = ±19%; Figure 5). According to SDM predictions, this spatial overlap will undergo diverging patterns depending on climate and land use change scenarios. In fact, the percentage of desman distribution overlapping with otter range will likely increase above ca. 80% under the most optimistic scenarios (i.e., RCP2.6–LUC.A2, median = 79%, SD = ±18%; RCP2.6–LUC.B1, median = 78%, SD = ±18%), while decreasing below 67% under the most pessimistic ones (i.e., RCP8.5–LUC.A2, median = 67%, SD = ±21%; RCP8.5–LUC.B1, median = 67%, SD = ±21%; Figure 5).

4. Discussion

We found a clear difference in the response to climate and land use change between desman and otter, as well as a potential alteration of their predator–prey interactions. Specifically, we provided evidence that the desman will drastically reduce its distribution under 2050 climate and land use scenarios, whereas the otter will benefit from these environmental alterations in terms of gained range. Furthermore, our models predicted an increased overlapping between the desman and otter distribution range in 2050 under the most optimistic scenarios. This pattern could imply an increase in otter predation rates on desmans that, combined with the overall reduction in future distribution predicted for the desman, may pose a double threat for the long-term survival of this species.
The species distribution models for both the species indicated isothermality, i.e., day-to-night temperature oscillation, as one of the most important climatic variables that is positively related to species habitat suitability. Such a relationship has been previously found in other studies [72] and suggests that a more stable day-to-night temperature could allow semi-aquatic mammals, such as the desman and otter, to reduce energetic costs for maintaining a constant body temperature. The proximity to forested habitats also showed a certain importance in shaping habitat suitability for both species. In fact, it is well–known that riparian forests are important providers of cover for shelters and refuges [32,73,74]. Specifically for the desman, a low-to-intermediate seasonality in both temperature and precipitation represent a relevant driver influencing habitat suitability. These two variables are probably involved in characterizing more stable river conditions throughout the year, which are known to represent a key riverine habitat feature for the desman [75]. For the otter, the mean temperature of the driest quarter also emerged as directly related to habitat suitability. Some authors suggested that in Mediterranean ecosystems, the increase in temperature during the driest season determines a restriction of water flow and appearance of pools and ponds, triggering, in turn, an increase in otter prey abundance, e.g., crayfishes, cyprinids and amphibians [76,77].
The desman is predicted to lose a sizeable portion of its potential distribution range irrespective of the global change scenarios under consideration, which appears particularly concerning due to the desman’s scarce dispersal ability, capacity to cross artificial barriers and geographic basins of rivers [28,39]. In fact, we predicted the isolated population in the center of Spain to completely lose suitable habitat in 2050, similarly to the population from Portugal, with only small areas in North Spain remaining suitable. In addition to these large scale drivers, the desman is also threatened by small scale factors such as, e.g., habitat fragmentation and water pollution [18], with some local extinctions being already reported [75]. In light of that, we cannot exclude that even the habitat patches that remain suitable to 2050 might still be affected by the abovementioned small scale pressures, which were not accounted for in our predictions. As reported in several studies, the otter is predicted to take advantage of global change alterations forecasted to 2050 [30,45]. In line with this general evidence, we found that areas in the Iberian Peninsula that are now unsuitable for this species will become suitable under 2050 climate and land use changes, as a likely consequence of the predicted isothermality conditions. Such a prediction has been evidenced in both global [29,30] and local [45] scale investigations, and has been linked to the well-known high dispersal abilities of the species [41], which make it well capable to rapidly colonize new available areas [78,79,80].
Of great concern are the predictions we provided about the future dynamics of overlapping areas between desman and otter distributions. In fact, the desman range portion overlapping otter distribution is predicted to increase by ca. 7 to 8% in 2050 under the most optimistic scenarios (while decreasing under the most pessimistic ones). This pattern, coupled with the overall reduction in the entire specie range, would expose the desman to a worrying scenario in which the scarcer, residual distribution remnants in 2050 will become more suitable to otters than they are today, likely driving an increase in otter density. Given the well-described diet plasticity of otters [81], such a dynamic could even trigger a diet shift/widening, where the desman could go from being an occasional prey to a more frequent diet component, thus introducing an additional threat to the long-term conservation of this species. In fact, although the otter mainly feeds on fish [22], it can shift its diet in response to habitat, time of year, elevation and prey availability [82,83,84,85,86]. For instance, Cianfrani et al. [30] suggested that an increase in water temperature could cause eutrophication, with a drastic reduction in fish populations, and, consequently, in prey biomass for otters. This could trigger further shifting to alternative prey such as mammals and birds. That said, it is also plausible that such a diet shift could be rather limited due to the overall low densities of desman populations.
As for the most pessimistic scenarios, we reported a slight decrease in the overlap values, likely indicating that the extreme range reduction showed for desman under these scenarios will also involve most of the margins that were preserved and that overlapped with otter range under the most optimistic scenarios.
Among the main limitations of our research, we acknowledge that we did not account for possible future modifications of river status and dynamics triggered by global change. For example, we cannot exclude that the habitat patches remaining suitable in 2050 under climate and land use change might suffer from future hydrological stress or lower water availability. Such pressures could well make these patches unsuitable in terms of river health, especially for the desman, which prefers highly oxygenated water and rapid streams [87]. Moreover, our analysis focused strictly on the spatial overlap between desman and otters, and, therefore, only a potential increase in their interaction probability. In light of that, we acknowledge that multiple additional factors can contribute to predation events [88], such as, e.g., the density of both prey and predator populations [89,90] or small-scale habitat characteristics, such as the presence of human settlements or the availability of shelter sites [88]. Lastly, prey can change their use of space and circadian rhythm in response to the presence of a predator [91,92].

5. Conclusions

Our study highlighted how two semi-aquatic mammals can respond in very different ways to global change drivers. While otters will take advantage of these environmental alterations, likely continuing their increasing trend in the Iberian Peninsula [35], desmans will likely undergo a drastic reduction in their suitable habitats. In addition, under the most optimistic scenarios, the availability of overlapped range margins between the two species will likely increase, exposing desmans to a potential increased predation risk by otters. The synergistic pressure exerted by future habitat loss and increased predation rate pose a highly concerning scenario for the long-term conservation of this species. In light of this, we stress the importance of preserving riverine ecosystems against the effects of global change drivers, as well as implementing appropriate mitigation measures to ensure the persistence of this endemic species in the Iberian Peninsula.

Author Contributions

Conceptualization, L.F.R., Á.F.-G., V.P., M.d.M.D. and M.D.F.; data curation, L.F.R., Á.F.-G. and S.P.; formal analysis, L.F.R. and M.D.F.; investigation, L.F.R. and M.D.F.; methodology, L.F.R. and M.D.F.; project administration, A.L. and M.D.F.; resources, Á.F.-G.; software, L.F.R. and M.D.F.; supervision, A.L. and M.D.F.; validation, L.F.R. and M.D.F.; visualization, L.F.R., Á.F.-G., V.P., M.d.M.D., S.P., A.L. and M.D.F.; writing—original draft, L.F.R. and M.D.F.; writing—review and editing, L.F.R., Á.F.-G., V.P., M.d.M.D., S.P., A.L. and M.D.F. All authors have read and agreed to the published version of the manuscript.

Funding

Fieldwork was financed by Junta de Castilla y León, Confederación Hidrográfica del Duero, Iberdrola, Gobierno del Principado de Asturias, Xunta de Galicia y Fundación Biodiversidad.

Institutional Review Board Statement

Not applicable.

Informed Consent Statement

Not applicable.

Data Availability Statement

The data presented in this study are available on request from the corresponding author. The data are not publicly available due to ongoing research activities.

Acknowledgments

We thank people from Biosfera Consultoría Medioambiental S.L. for providing occurrence data of Pyrenean desmans as well as for sharing information on this species. We also thank Junta de Castilla y León, Instituto de Conservaçao da Natureza e das Florestas de Portugal, Gobierno de Principado de Asturias and Xunta de Galicia for the collection permits.

Conflicts of Interest

The authors declare no conflict of interest.

Appendix A

Figure A1. Distribution in the Iberian peninsula of the occurrence data of the desman (n = 251) from 2013 to 2020 and the otter (n = 1912) from 2000 to 2020, after the thinning procedure by the “spThin” R package [38].
Animals 13 00274 g0a1
Table A1. The considered 19 bioclimatic variables from the CHELSA database.
CodesNames
BIO1Annual Mean Temperature
BIO2Mean Diurnal Range (Mean of monthly (max temp–min temp))
BIO3Isothermality (BIO2/BIO7) (×100)
BIO4Temperature Seasonality (standard deviation × 100)
BIO5Max Temperature of Warmest Month
BIO6Min Temperature of Coldest Month
BIO7Temperature Annual Range (BIO5-BIO6)
BIO8Mean Temperature of Wettest Quarter
BIO9Mean Temperature of Driest Quarter
BIO10Mean Temperature of Warmest Quarter
BIO11Mean Temperature of Coldest Quarter
BIO12Annual Precipitation
Table A2. Characteristics of 2050 climate and land-use scenarios used in SDMs projections.
ScenarioMain Characteristics
RCP.26The scenario assumes that global annual CO2 emissions will peak between 2010–2020, declining substantially thereafter. A +1 °C global warming is forecasted [65]
RCP.85The scenario assumes CO2 emissions keep rising throughout the 21th century. A +2 °C global warming is forecasted [65].
LUC.A2The scenario assumes a high population growth, a sprawling urban expansion and a medium economic growth. As a result, the scenario predicts an increase in farmlands and a decrease in grasslands and forests [44].
LUC.B1The scenario assumes a low population growth, a compact urban expansion and a high economic growth. As a result, the scenario predicts a decrease in farmlands and an increase in grasslands and forests [44].
Figure A2. Spatially explicit predictions of desman and otter range modifications under 2050 climate and land use change scenarios, as generated by the IPSL-CM5A-LR global circulation model and the “maximize TSS” binarization threshold. Grey: stable unsuitable habitat, red: habitat loss, green: stable suitable habitat, yellow: habitat gain.
Animals 13 00274 g0a2
Figure A3. Spatially explicit predictions of desman and otter range modifications under 2050 climate and land use change scenarios, as generated by the IPSL-CM5A-LR global circulation model and the “mean occurrence probability”, binarization threshold. Grey: stable unsuitable habitat, red: habitat loss, green: stable suitable habitat, yellow: habitat gain.
Animals 13 00274 g0a3
Figure A4. Spatially explicit predictions of desman and otter range modifications under 2050 climate and land use change scenarios, as generated by the IPSL-CM5A-LR global circulation model and the “equalize sensitivity and specificity”, binarization threshold. Grey: stable unsuitable habitat, red: habitat loss, green: stable suitable habitat, yellow: habitat gain.
Animals 13 00274 g0a4
Figure A5. Spatially explicit predictions of desman and otter range modifications under 2050 climate and land use change scenarios, as generated by the IPSL-CM5A-LR global circulation model and the “minimize receiver operating characteristic plot distance”, binarization threshold. Grey: stable unsuitable habitat, red: habitat loss, green: stable suitable habitat, yellow: habitat gain.
Animals 13 00274 g0a5
Figure A6. Spatially explicit predictions of desman and otter range modifications under 2050 climate and land use change scenarios, as generated by the CCSM4 global circulation model and the “maximize TSS” binarization threshold. Grey: stable unsuitable habitat, red: habitat loss green: stable suitable habitat, yellow: habitat gain.
Animals 13 00274 g0a6
Figure A7. Spatially explicit predictions of desman and otter range modifications under 2050 climate and land use change scenarios, as generated by the CCSM4 global circulation model and the “mean occurrence probability”, binarization threshold. Grey: stable unsuitable habitat, red: habitat loss green: stable suitable habitat, yellow: habitat gain.
Animals 13 00274 g0a7
Figure A8. Spatially explicit predictions of desman and otter range modifications under 2050 climate and land use change scenarios, as generated by the CCSM4 global circulation model and the “equalize sensitivity and specificity”, binarization threshold. Grey: stable unsuitable habitat, red: habitat loss, green: stable suitable habitat, yellow: habitat gain.
Animals 13 00274 g0a8
Figure A9. Spatially explicit predictions of desman and otter range modifications under 2050 climate and land use change scenarios, as generated by the CCSM4 global circulation model and the “minimize receiver operating characteristic plot distance”, binarization threshold. Grey: stable unsuitable habitat, red: habitat loss, green: stable suitable habitat, yellow: habitat gain.
Animals 13 00274 g0a9
Figure A10. Spatially explicit predictions of desman and otter range modifications under 2050 climate and land use change scenarios, as generated by the MIROC-ESM-CHEM global circulation model and the “maximize TSS” binarization threshold. Grey: stable unsuitable habitat, red: habitat loss, green: stable suitable habitat, yellow: habitat gain.
Animals 13 00274 g0a10
Figure A11. Spatially explicit predictions of desman and otter range modifications under 2050 climate and land use change scenarios, as generated by the MIROC-ESM-CHEM global circulation model and the “mean occurrence probability”, binarization threshold. Grey: stable unsuitable habitat, red: habitat loss, green: stable suitable habitat, yellow: habitat gain.
Animals 13 00274 g0a11
Figure A12. Spatially explicit predictions of desman and otter range modifications under 2050 climate and land use change scenarios, as generated by the MIROC-ESM-CHEM global circulation model and the “equalize sensitivity and specificity”, binarization threshold. Grey: stable unsuitable habitat, red: habitat loss, green: stable suitable habitat, yellow: habitat gain.
Animals 13 00274 g0a12
Figure A13. Spatially explicit predictions of desman and otter range modifications under 2050 climate and land use change scenarios, as generated by the MIROC-ESM-CHEM global circulation model and the “minimize receiver operating characteristic plot distance”, binarization threshold. Grey: stable unsuitable habitat, red: habitat loss, green: stable suitable habitat, yellow: habitat gain.
Animals 13 00274 g0a13

References

  1. Ceballos, G.; Ehrlich, P.R.; Barnosky, A.D.; García, A.; Pringle, R.M.; Palmer, T.M. Accelerated Modern Human-Induced Species Losses: Entering the Sixth Mass Extinction. Sci. Adv. 2015, 1, 9–13. [Google Scholar] [CrossRef] [PubMed] [Green Version]
  2. Sirami, C.; Caplat, P.; Popy, S.; Clamens, A.; Arlettaz, R.; Jiguet, F.; Brotons, L.; Martin, J.L. Impacts of Global Change on Species Distributions: Obstacles and Solutions to Integrate Climate and Land Use. Glob. Ecol. Biogeogr. 2017, 26, 385–394. [Google Scholar] [CrossRef] [Green Version]
  3. Ohlemüller, R.; Anderson, B.J.; Araújo, M.B.; Butchart, S.H.M.; Kudrna, O.; Ridgely, R.S.; Thomas, C.D. The Coincidence of Climatic and Species Rarity: High Risk to Small-Range Species from Climate Change. Biol. Lett. 2008, 4, 568–572. [Google Scholar] [CrossRef] [Green Version]
  4. Hof, A.R.; Jansson, R.; Nilsson, C. Future Climate Change Will Favour Non-Specialist Mammals in the (Sub)Arctics. PLoS ONE 2012, 7, 52574. [Google Scholar] [CrossRef] [Green Version]
  5. Pacifici, M.; Rondinini, C.; Rhodes, J.R.; Burbidge, A.A.; Cristiano, A.; Watson, J.E.M.; Woinarski, J.C.Z.; Di Marco, M. Global Correlates of Range Contractions and Expansions in Terrestrial Mammals. Nat. Commun. 2020, 11, 2840. [Google Scholar] [CrossRef] [PubMed]
  6. Baisero, D.; Visconti, P.; Pacifici, M.; Cimatti, M.; Rondinini, C. Projected Global Loss of Mammal Habitat Due to Land-Use and Climate Change. One Earth 2020, 2, 578–585. [Google Scholar] [CrossRef]
  7. Boutin, S.; Lane, J.E.; Stan Boutin, C. Climate Change and Mammals: Evolutionary versus Plastic Responses. Evol. Appl. 2013, 7, 29–41. [Google Scholar] [CrossRef]
  8. Réale, D.; McAdam, A.G.; Boutin, S.; Berteaux, D. Genetic and Plastic Responses of a Northern Mammal to Climate Change. Proc. R. Soc. London Ser. B Biol. Sci. 2003, 270, 591–596. [Google Scholar] [CrossRef] [PubMed]
  9. Hetem, R.S.; Fuller, A.; Maloney, S.K.; Mitchell, D. Responses of Large Mammals to Climate Change. Temperature 2014, 1, 115–127. [Google Scholar] [CrossRef]
  10. Williams, J.E.; Blois, J.L. Range Shifts in Response to Past and Future Climate Change: Can Climate Velocities and Species’ Dispersal Capabilities Explain Variation in Mammalian Range Shifts? J. Biogeogr. 2018, 45, 2175–2189. [Google Scholar] [CrossRef]
  11. Blois, J.L.; Zarnetske, P.L.; Fitzpatrick, M.C.; Finnegan, S. Climate Change and the Past, Present, and Future of Biotic Interactions. Science 2013, 341, 499–504. [Google Scholar] [CrossRef] [Green Version]
  12. Vucic-Pestic, O.; Ehnes, R.B.; Rall, B.C.; Brose, U. Warming up the System: Higher Predator Feeding Rates but Lower Energetic Efficiencies. Glob. Change Biol. 2011, 17, 1301–1310. [Google Scholar] [CrossRef]
  13. Öhlund, G.; Hedström, P.; Norman, S.; Hein, C.L.; Englund, G. Temperature Dependence of Predation Depends on the Relative Performance of Predators and Prey. Proc. R. Soc. B Biol. Sci. 2015, 282, 20142254. [Google Scholar] [CrossRef] [PubMed]
  14. Hamilton, C.D.; Kovacs, K.M.; Ims, R.A.; Aars, J.; Lydersen, C. An Arctic Predator-Prey System in Flux: Climate Change Impacts on Coastal Space Use by Polar Bears and Ringed Seals. J. Anim. Ecol. 2017, 86, 1054–1064. [Google Scholar] [CrossRef] [PubMed] [Green Version]
  15. Aryal, A.; Shrestha, U.B.; Ji, W.; Ale, S.B.; Shrestha, S.; Ingty, T.; Maraseni, T.; Cockfield, G.; Raubenheimer, D. Predicting the Distributions of Predator (Snow leopard) and Prey (Blue sheep) under Climate Change in the Himalaya. Ecol. Evol. 2016, 6, 4065–4075. [Google Scholar] [CrossRef] [Green Version]
  16. Bastille-Rousseau, G.; Schaefer, J.A.; Peers, M.J.L.; Ellington, E.H.; Mumma, M.A.; Rayl, N.D.; Mahoney, S.P.; Murray, D.L. Climate Change Can Alter Predator–Prey Dynamics and Population Viability of Prey. Oecologia 2018, 186, 141–150. [Google Scholar] [CrossRef] [PubMed]
  17. Penteriani, V.; Zarzo-Arias, A.; Novo-Fernández, A.; Bombieri, G.; López-Sánchez, C.A. Responses of an Endangered Brown Bear Population to Climate Change Based on Predictable Food Resource and Shelter Alterations. Glob. Change Biol. 2019, 25, 1133–1151. [Google Scholar] [CrossRef]
  18. Quaglietta, L. Galemys Pyrenaicus. IUCN Red List Threat. Species 2021, e.T8826A20. [Google Scholar] [CrossRef]
  19. Morueta-Holme, N.; Fløjgaard, C.; Svenning, J.-C. Climate Change Risks and Conservation Implications for a Threatened Small-Range Mammal Species. PLoS ONE 2010, 5, e10360. [Google Scholar] [CrossRef]
  20. Charbonnel, A.; Laffaille, P.; Biffi, M.; Blanc, F.; Maire, A.; Némoz, M.; Sanchez-Perez, J.M.; Sauvage, S.; Buisson, L. Can Recent Global Changes Explain the Dramatic Range Contraction of an Endangered Semi-Aquatic Mammal Species in the French Pyrenees? PLoS ONE 2016, 11, e0159941. [Google Scholar] [CrossRef]
  21. Roos, A.; Loy, A.; de Silva, P.; Hajkova, P.; Zemanová, B. Lutra Lutra. IUCN Red List Threat. Species 2015, e.T12419A21935287. [Google Scholar]
  22. Hung, N.; Law, C.J. Lutra Lutra (Carnivora: Mustelidae). Mamm. Species 2016, 48, 109–122. [Google Scholar] [CrossRef] [Green Version]
  23. Clavero, M.; Prenda, J.; Delibes, M. Trophic Diversity of the Otter (Lutra lutra L.) in Temperate and Mediterranean Freshwater Habitats. J. Biogeogr. 2003, 30, 761–769. [Google Scholar] [CrossRef] [Green Version]
  24. Melero, Y.; Palazón, S.; Bonesi, L.; Gosàlbez, J. Feeding Habits of Three Sympatric Mammals in NE Spain: The American Mink, the Spotted Genet, and the Eurasian Otter. Acta Theriol. 2008, 53, 263–273. [Google Scholar] [CrossRef]
  25. Remonti, L.; Prigioni, C.; Balestrieri, A.; Sgrosso, S.; Priore, G. Eurasian Otter (Lutra lutra) Prey Selection in Response to a Variation of Fish Abundance. Ital. J. Zool. 2010, 77, 331–338. [Google Scholar] [CrossRef]
  26. Gillet, F.; Mouton, A.; Vanutryve, S.; Blanc, F.; Némoz, M.; Fournier, P.; Fournier Chambrillon, C.; Marc, D.; Michaux, J. Evidence of Predation and Possible Competition among Three Semi Aquatic Species, the Endangered Pyrenean Desman (Galemys pyrenaicus), the Aquatic Shrew (Neomys fodiens) and the European Otter (Lutra lutra) Using next-Generation Sequencing Methods from Fae. In Proceedings of the Congenomics Conference, Porto, Portugal, 3–6 May 2016. [Google Scholar]
  27. Fernández-López, J.; Fernández-González, Á.; Fernández-Menéndez, D. Confirmación de La Depredación de Nutria Paleártica Lutra Lutra (Linnaeus, 1758) Sobre Desmán Ibérico Galemys Pyrenaicus (E. Geoffroy Saint-Hilaire, 1811) Mediante El Empleo de Técnicas Moleculares. Galemys Span. J. Mammal. 2014, 22, 96–99. [Google Scholar] [CrossRef]
  28. Querejeta, M.; Fernández-González, A.; Romero, R.; Castresana, J. Postglacial Dispersal Patterns and Mitochondrial Genetic Structure of the Pyrenean Desman (Galemys pyrenaicus) in the Northwestern Region of the Iberian Peninsula. Ecol. Evol. 2017, 7, 4486–4495. [Google Scholar] [CrossRef]
  29. Cianfrani, C.; Broennimann, O.; Loy, A.; Guisan, A. More than Range Exposure: Global Otter Vulnerability to Climate Change. Biol. Conserv. 2018, 221, 103–113. [Google Scholar] [CrossRef] [Green Version]
  30. Cianfrani, C.; Lay, G.L.; Maiorano, L.; Satizábal, H.F.; Loy, A.; Guisan, A. Adapting Global Conservation Strategies to Climate Change at the European Scale: The Otter as a Flagship Species. Biol. Conserv. 2011, 144, 2068–2080. [Google Scholar] [CrossRef]
  31. Melero, Y.; Aymerich, P.; Santulli, G.; Gosàlbez, J. Activity and Space Patterns of Pyrenean Desman (Galemys pyrenaicus) Suggest Non-Aggressive and Non-Territorial Behaviour. Eur. J. Wildl. Res. 2014, 60, 707–715. [Google Scholar] [CrossRef] [Green Version]
  32. Melero, Y.; Aymerich, P.; Luque-Larena, J.J.; Gosàlbez, J. New Insights into Social and Space Use Behaviour of the Endangered Pyrenean Desman (Galemys pyrenaicus). Eur. J. Wildl. Res. 2012, 58, 185–193. [Google Scholar] [CrossRef]
  33. Gonzalez-Esteban, J.; Esnaola, A.; Aihartza, J. A New Sampling Method to Detect the Pyrenean Desman (Galemys pyrenaicus). Hystrix Ital. J. Mammal. 2018, 29, 190–194. [Google Scholar] [CrossRef]
  34. Grilo, C.; Afonso, B.C.; Afonso, F.; Alexandre, M.; Aliácar, S.; Almeida, A.; Alonso, I.P.; Álvares, F.; Alves, P.; Alves, P.C.; et al. MAMMALS IN PORTUGAL: A Data Set of Terrestrial, Volant, and Marine Mammal Occurrences in Portugal. Ecology 2022, 103, ecy.3654. [Google Scholar] [CrossRef] [PubMed]
  35. Palazón, S. La Nutria En España. Treinta Años de Seguimiento y Recuperación de Un Mamífero Amenazado; Sociedad Española para la Conservación y Estudio de los Mamíferos (SECEM), Grupo Nutria: Seville, Spain, 2021; pp. 279–303. [Google Scholar]
  36. Fabrizio, M.; Di Febbraro, M.; Loy, A. Where Will It Cross next? Optimal Management of Road Collision Risk for Otters in Italy. J. Environ. Manag. 2019, 251, 109609. [Google Scholar] [CrossRef]
  37. Russo, L.F.; Barrientos, R.; Fabrizio, M.; Di Febbraro, M.; Loy, A. Prioritizing Road-Kill Mitigation Areas: A Spatially Explicit National-Scale Model for an Elusive Carnivore. Divers. Distrib. 2020, 26, 1093–1103. [Google Scholar] [CrossRef]
  38. Aiello-Lammens, M.E.; Boria, R.A.; Radosavljevic, A.; Vilela, B.; Anderson, R.P. SpThin: An R Package for Spatial Thinning of Species Occurrence Records for Use in Ecological Niche Models. Ecography 2015, 38, 541–545. [Google Scholar] [CrossRef]
  39. Escoda, L.; Fernández-González, Á.; Castresana, J. Quantitative Analysis of Connectivity in Populations of a Semi-Aquatic Mammal Using Kinship Categories and Network Assortativity. Mol. Ecol. Resour. 2019, 19, 310–326. [Google Scholar] [CrossRef]
  40. Gillet, F.; Le Roux, B.; Blanc, F.; Bodo, A.; Fournier-Chambrillon, C.; Fournier, P.; Jacob, F.; Lacaze, V.; Némoz, M.; Aulagnier, S.; et al. Genetic Monitoring of the Endangered Pyrenean Desman (Galemys pyrenaicus) in the Aude River, France. Belg. J. Zool. 2016, 146, 44–52. [Google Scholar] [CrossRef]
  41. Quaglietta, L.; Fonseca, V.C.; Mira, A.; Boitani, L. Sociospatial Organization of a Solitary Carnivore, the Eurasian Otter (Lutra lutra). J. Mammal. 2014, 95, 140–150. [Google Scholar] [CrossRef]
  42. Karger, D.N.; Conrad, O.; Böhner, J.; Kawohl, T.; Kreft, H.; Soria-Auza, R.W.; Zimmermann, N.E.; Linder, H.P.; Kessler, M. Climatologies at High Resolution for the Earth’s Land Surface Areas. Sci. Data 2017, 4, 170122. [Google Scholar] [CrossRef] [Green Version]
  43. Fick, S.E.; Hijmans, R.J. WorldClim 2: New 1-Km Spatial Resolution Climate Surfaces for Global Land Areas. Int. J. Climatol. 2017, 37, 4302–4315. [Google Scholar] [CrossRef]
  44. Li, X.; Chen, G.; Liu, X.; Liang, X.; Wang, S.; Chen, Y.; Pei, F.; Xu, X. A New Global Land-Use and Land-Cover Change Product at a 1-Km Resolution for 2010 to 2100 Based on Human–Environment Interactions. Ann. Am. Assoc. Geogr. 2017, 107, 1040–1059. [Google Scholar] [CrossRef]
  45. Jamwal, P.S.; Di Febbraro, M.; Carranza, M.L.; Savage, M.; Loy, A. Global Change on the Roof of the World: Vulnerability of Himalayan Otter Species to Land Use and Climate Alterations. Divers. Distrib. 2022, 28, 1635–1649. [Google Scholar] [CrossRef]
  46. Sala, O.E.; Stuart Chapin, F., III; Armesto, J.J.; Berlow, E.; Bloomfield, J.; Dirzo, R.; Huber-Sanwald, E.; Huenneke, L.F.; Jackson, R.B.; Kinzig, A.; et al. Global Biodiversity Scenarios for the Year 2100. Science 2000, 287, 1770–1774. [Google Scholar] [CrossRef]
  47. Schneider, A.; Jost, A.; Coulon, C.; Silvestre, M.; Théry, S.; Ducharne, A. Global-Scale River Network Extraction Based on High-Resolution Topography and Constrained by Lithology, Climate, Slope, and Observed Drainage Density. Geophys. Res. Lett. 2017, 44, 2773–2781. [Google Scholar] [CrossRef] [Green Version]
  48. Zuur, A.F.; Ieno, E.N.; Elphick, C.S. A Protocol for Data Exploration to Avoid Common Statistical Problems. Methods Ecol. Evol. 2010, 1, 3–14. [Google Scholar] [CrossRef]
  49. Bauer, S.; Shamoun-Baranes, J.; Nilsson, C.; Farnsworth, A.; Kelly, J.F.; Reynolds, D.R.; Dokter, A.M.; Krauel, J.F.; Petterson, L.B.; Horton, K.G.; et al. The Grand Challenges of Migration Ecology That Radar Aeroecology Can Help Answer. Ecography 2019, 42, 861–875. [Google Scholar] [CrossRef] [Green Version]
  50. Thuiller, W.; Lafourcade, B.; Engler, R.; Araújo, M.B. BIOMOD—A Platform for Ensemble Forecasting of Species Distributions. Ecography 2009, 32, 369–373. [Google Scholar] [CrossRef]
  51. Olson, D.M.; Dinerstein, E.; Wikramanayake, E.D.; Burgess, N.D.; Powell, G.V.N.; Underwood, E.C.; D’Amico, J.A.; Itoua, I.; Strand, H.E.; Morrison, J.C.; et al. Terrestrial Ecoregions of the World: A New Map of Life on Earth. Bioscience 2001, 51, 933–938. [Google Scholar] [CrossRef]
  52. Barve, N.; Barve, V.; Jiménez-Valverde, A.; Lira-Noriega, A.; Maher, S.P.; Peterson, A.T.; Soberón, J.; Villalobos, F. The Crucial Role of the Accessible Area in Ecological Niche Modeling and Species Distribution Modeling. Ecol. Model. 2011, 222, 1810–1819. [Google Scholar] [CrossRef]
  53. Roberts, D.R.; Bahn, V.; Ciuti, S.; Boyce, M.S.; Elith, J.; Guillera-Arroita, G.; Hauenstein, S.; Lahoz-Monfort, J.J.; Schröder, B.; Thuiller, W.; et al. Cross-Validation Strategies for Data with Temporal, Spatial, Hierarchical, or Phylogenetic Structure. Ecography (Cop.) 2017, 40, 913–929. [Google Scholar] [CrossRef]
  54. Fourcade, Y.; Besnard, A.G.; Secondi, J. Paintings Predict the Distribution of Species, or the Challenge of Selecting Environmental Predictors and Evaluation Statistics. Glob. Ecol. Biogeogr. 2018, 27, 245–256. [Google Scholar] [CrossRef]
  55. Kass, J.M.; Muscarella, R.; Galante, P.J.; Bohl, C.L.; Pinilla-Buitrago, G.E.; Boria, R.A.; Soley-Guardia, M.; Anderson, R.P. ENMeval 2.0: Redesigned for Customizable and Reproducible Modeling of Species’ Niches and Distributions. Methods Ecol. Evol. 2021, 12, 1602–1608. [Google Scholar] [CrossRef]
  56. Muscarella, R.; Galante, P.J.; Soley-Guardia, M.; Boria, R.A.; Kass, J.M.; Uriarte, M.; Anderson, R.P. ENMeval: An R Package for Conducting Spatially Independent Evaluations and Estimating Optimal Model Complexity for Maxent Ecological Niche Models. Methods Ecol. Evol. 2014, 5, 1198–1205. [Google Scholar] [CrossRef] [Green Version]
  57. Pio, D.V.; Engler, R.; Linder, H.P.; Monadjem, A.; Cotterill, F.P.D.; Taylor, P.J.; Schoeman, M.C.; Price, B.W.; Villet, M.H.; Eick, G.; et al. Climate Change Effects on Animal and Plant Phylogenetic Diversity in Southern Africa. Glob. Change Biol. 2014, 20, 1538–1549. [Google Scholar] [CrossRef]
  58. Jørgensen, S.E. Model Selection and Multimodel Inference. Ecol. Model. 2004, 172, 96–97. [Google Scholar] [CrossRef]
  59. Hanley, J.A.; McNeil, B.J. The Meaning and Use of the Area under a Receiver Operating Characteristic (ROC) Curve. Radiology 1982, 143, 29–36. [Google Scholar] [CrossRef] [PubMed] [Green Version]
  60. Allouche, O.; Tsoar, A.; Kadmon, R. Assessing the Accuracy of Species Distribution Models: Prevalence, Kappa and the True Skill Statistic (TSS). J. Appl. Ecol. 2006, 43, 1223–1232. [Google Scholar] [CrossRef]
  61. Swets, J.A. Measuring the Accuracy of Diagnostic Systems. Sci. Sci. 1988, 240, 1285–1293. [Google Scholar] [CrossRef] [Green Version]
  62. Landis, J.R.; Koch, G.G. The Measurement of Observer Agreement for Categorical Data. Biometrics 1977, 33, 159. [Google Scholar] [CrossRef] [Green Version]
  63. Di Febbraro, M.; Martinoli, A.; Russo, D.; Preatoni, D.; Bertolino, S. Modelling the Effects of Climate Change on the Risk of Invasion by Alien Squirrels. Hystrix 2016, 27, 1–8. [Google Scholar] [CrossRef]
  64. Marmion, M.; Parviainen, M.; Luoto, M.; Heikkinen, R.K.; Thuiller, W. Evaluation of Consensus Methods in Predictive Species Distribution Modelling. Divers. Distrib. 2009, 15, 59–69. [Google Scholar] [CrossRef]
  65. Stocker, T.F.; Qin, D.; Plattner, G.K.; Tignor, M.M.B.; Allen, S.K.; Boschung, J.; Nauels, A.; Xia, Y.; Bex, V.; Midgley, P.M. Climate Change 2013 the Physical Science Basis: Working Group I Contribution to the Fifth Assessment Report of the Intergovernmental Panel on Climate Change; Cambridge University Press: Cambridg, UK, 2013. [Google Scholar] [CrossRef] [Green Version]
  66. Buisson, L.; Thuiller, W.; Casajus, N.; Lek, S.; Grenouillet, G. Uncertainty in Ensemble Forecasting of Species Distribution. Glob. Change Biol. 2010, 16, 1145–1157. [Google Scholar] [CrossRef]
  67. Sanderson, B.M.; Knutti, R.; Caldwell, P. A Representative Democracy to Reduce Interdependency in a Multimodel Ensemble. J. Clim. 2015, 28, 5171–5194. [Google Scholar] [CrossRef] [Green Version]
  68. Di Febbraro, M.; Menchetti, M.; Russo, D.; Ancillotto, L.; Aloise, G.; Roscioni, F.; Preatoni, D.G.; Loy, A.; Martinoli, A.; Bertolino, S.; et al. Integrating Climate and Land-use Change Scenarios in Modelling the Future Spread of Invasive Squirrels in Italy. Divers. Distrib. 2019, 25, 644–659. [Google Scholar] [CrossRef] [Green Version]
  69. Engler, R.; Hordijk, W.; Guisan, A. The MIGCLIM R Package—Seamless Integration of Dispersal Constraints into Projections of Species Distribution Models. Ecography (Cop.) 2012, 35, 872–878. [Google Scholar] [CrossRef]
  70. Sales, L.P.; Ribeiro, B.R.; Pires, M.M.; Chapman, C.A.; Loyola, R. Recalculating Route: Dispersal Constraints Will Drive the Redistribution of Amazon Primates in the Anthropocene. Ecography 2019, 42, 1789–1801. [Google Scholar] [CrossRef] [Green Version]
  71. Franklin, J.; Davis, F.W.; Ikegami, M.; Syphard, A.D.; Flint, L.E.; Flint, A.L.; Hannah, L. Modeling Plant Species Distributions under Future Climates: How Fine Scale Do Climate Projections Need to Be? Glob. Change Biol. 2013, 19, 473–483. [Google Scholar] [CrossRef] [Green Version]
  72. Jo, Y.S.; Won, C.M.; Fritts, S.R.; Wallace, M.C.; Baccus, J.T. Distribution and Habitat Models of the Eurasian Otter, Lutra Lutra, in South Korea. J. Mammal. 2017, 98, 1105–1117. [Google Scholar] [CrossRef] [Green Version]
  73. Biffi, M.; Charbonnel, A.; Buisson, L.; Blanc, F.; Némoz, M.; Laffaille, P. Spatial Differences across the French Pyrenees in the Use of Local Habitat by the Endangered Semi-Aquatic Pyrenean Desman (Galemys pyrenaicus). Aquat. Conserv. Mar. Freshw. Ecosyst. 2016, 26, 761–774. [Google Scholar] [CrossRef]
  74. Prenda, J.; Granado-Lorencio, C. The Relative Influence of Riparian Habitat Structure and Fish Availability on Otter Lutra lutra L. Sprainting Activity in a Small Mediterranean Catchment. Biol. Conserv. 1996, 76, 9–15. [Google Scholar] [CrossRef]
  75. Quaglietta, L.; Paupério, J.; Martins, F.M.S.; Alves, P.C.; Beja, P. Recent Range Contractions in the Globally Threatened Pyrenean Desman Highlight the Importance of Stream Headwater Refugia. Anim. Conserv. 2018, 21, 515–525. [Google Scholar] [CrossRef]
  76. Ruiz-Olmo, J.; Olmo-Vidal, J.M.; Mañas, S.; Batet, A. The Influence of Resource Seasonality on the Breeding Patterns of the Eurasian Otter (Lutra Lutra) in Mediterranean Habitats. Can. J. Zool. 2002, 80, 2178–2189. [Google Scholar] [CrossRef]
  77. Barbosa, A.M.; Real, R.; Olivero, J.; Vargas, J.M. Otter (Lutra lutra) Distribution Modeling at Two Resolution Scales Suited to Conservation Planning in the Iberian Peninsula. Biol. Conserv. 2003, 114, 377–387. [Google Scholar] [CrossRef]
  78. Mason, C.F.; Macdonald, S.M. Growth in Otter (Lutra lutra) Populations in the UK as Shown by Long-Term Monitoring. Ambio 2004, 33, 148–152. [Google Scholar] [CrossRef]
  79. Elmeros, M.; Hammershøj, M.; Madsen, A.; Søgaard, B. Recovery of the Otter Lutra Lutra in Denmark Monitored by Field Surveys and Collection of Carcasses. Hystrix Ital. J. Mammal. 2006, 17, 17–28. [Google Scholar] [CrossRef]
  80. McDonald, R.A.; O’Hara, K.; Morrish, D.J. Decline of Invasive Alien Mink (Mustela Vison) Is Concurrent with Recovery of Native Otters (Lutra lutra). Divers. Distrib. 2007, 13, 92–98. [Google Scholar] [CrossRef]
  81. Russo, L.F.; Meloro, C.; De Silvestri, M.; Chadwick, E.A.; Loy, A. Better Sturdy or Slender? Eurasian Otter Skull Plasticity in Response to Feeding Ecology. PLoS ONE 2022, 17, e0274893. [Google Scholar] [CrossRef]
  82. Lanszki, J.; Lehoczky, I.; Kotze, A.; Somers, M.J. Diet of Otters (Lutra lutra) in Various Habitat Types in the Pannonian Biogeographical Region Compared to Other Regions of Europe. PeerJ 2016, 4, e2266. [Google Scholar] [CrossRef] [Green Version]
  83. Martínez-Abraín, A.; Marí-Mena, N.; Vizcaíno, A.; Vierna, J.; Veloy, C.; Amboage, M.; Guitián-Caamaño, A.; Key, C.; Vila, M. Determinants of Eurasian Otter (Lutra lutra) Diet in a Seasonally Changing Reservoir. Hydrobiologia 2020, 847, 1803–1816. [Google Scholar] [CrossRef]
  84. Moorhouse-Gann, R.J.; Kean, E.F.; Parry, G.; Valladares, S.; Chadwick, E.A. Dietary Complexity and Hidden Costs of Prey Switching in a Generalist Top Predator. Ecol. Evol. 2020, 10, 6395–6408. [Google Scholar] [CrossRef]
  85. Remonti, L.; Prigioni, C.; Balestrieri, A.; Sgrosso, S.; Priore, G. Trophic Flexibility of the Otter (Lutra lutra) in Southern Italy. Mamm. Biol. 2008, 73, 293–302. [Google Scholar] [CrossRef]
  86. Ruiz-Olmo, J.; Jiménez, J. Diet Diversity and Breeding of Top Predators Are Determined by Habitat Stability and Structure: A Case Study with the Eurasian Otter (Lutra lutra L.). Eur. J. Wildl. Res. 2009, 55, 133–144. [Google Scholar] [CrossRef]
  87. Esnaola, A.; González-Esteban, J.; Elosegi, A.; Arrizabalaga-Escudero, A.; Aihartza, J. Need for Speed: Preference for Fast-Flowing Water by the Endangered Semi-Aquatic Pyrenean Desman (Galemys pyrenaicus) in Two Contrasting Streams. Aquat. Conserv. Mar. Freshw. Ecosyst. 2018, 28, 600–609. [Google Scholar] [CrossRef]
  88. Suraci, J.P.; Smith, J.A.; Chamaillé-Jammes, S.; Gaynor, K.M.; Jones, M.; Luttbeg, B.; Ritchie, E.G.; Sheriff, M.J.; Sih, A. Beyond Spatial Overlap: Harnessing New Technologies to Resolve the Complexities of Predator–Prey Interactions. Oikos 2022, 2022, e09004. [Google Scholar] [CrossRef]
  89. Sims, D.W.; Witt, M.J.; Richardson, A.J.; Southall, E.J.; Metcalfe, J.D. Encounter Success of Free-Ranging Marine Predator Movements across a Dynamic Prey Landscape. Proc. R. Soc. B Biol. Sci. 2006, 273, 1195–1201. [Google Scholar] [CrossRef] [PubMed] [Green Version]
  90. Turesson, H.; Brönmark, C. Predator-Prey Encounter Rates in Freshwater Piscivores: Effects of Prey Density and Water Transparency. Oecologia 2007, 153, 281–290. [Google Scholar] [CrossRef] [PubMed]
  91. Kohl, M.T.; Stahler, D.R.; Metz, M.C.; Forester, J.D.; Kauffman, M.J.; Varley, N.; White, P.J.; Smith, D.W.; MacNulty, D.R. Diel Predator Activity Drives a Dynamic Landscape of Fear. Ecol. Monogr. 2018, 88, 638–652. [Google Scholar] [CrossRef] [Green Version]
  92. Caravaggi, A.; Gatta, M.; Vallely, M.C.; Hogg, K.; Freeman, M.; Fadaei, E.; Dick, J.T.A.; Montgomery, W.I.; Reid, N.; Tosh, D.G. Seasonal and Predator-Prey Effects on Circadian Activity of Free-Ranging Mammals Revealed by Camera Traps. PeerJ 2018, 2018, 5827. [Google Scholar] [CrossRef] [PubMed]
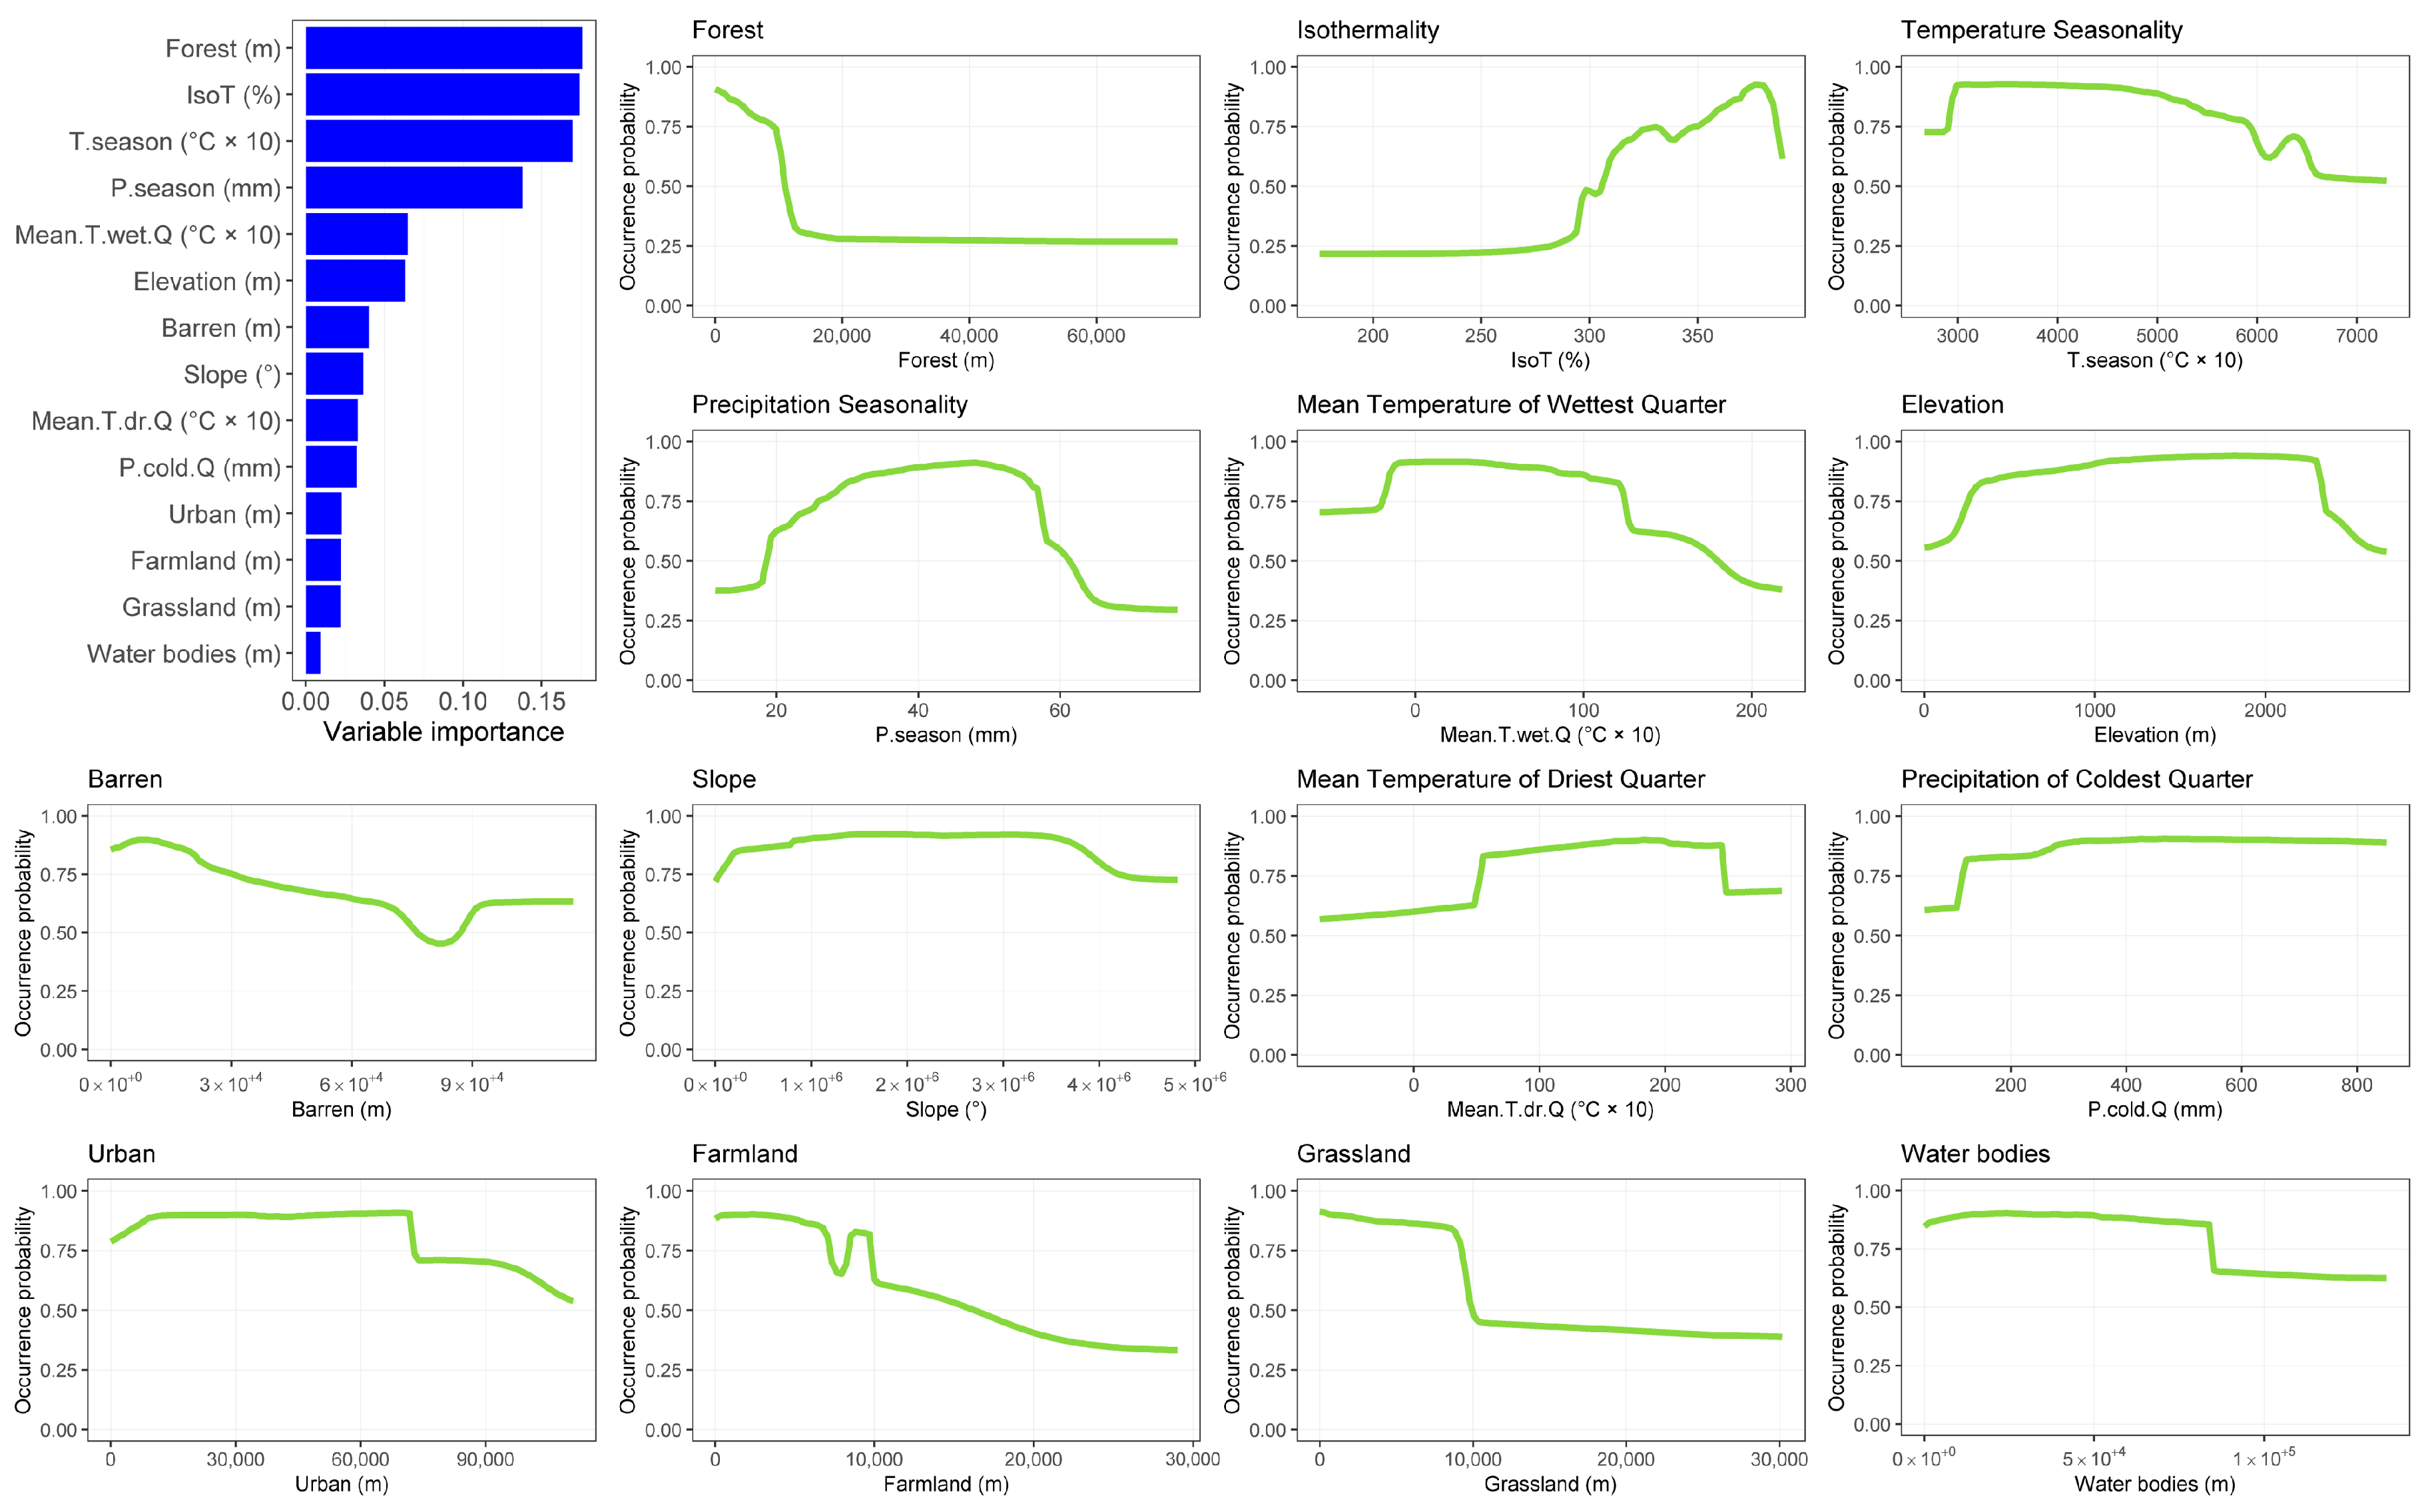
Figure 1. Bar plot depicting variables importance for desman and response curves depicting the shape of the relationship between desman habitat suitability and each environmental variable included into the ensemble model.
Animals 13 00274 g001
Figure 2. Bar plot depicting variables importance for otter and response curves depicting the shape of the relationship between otter habitat suitability and each environmental variable included into the ensemble model.
Animals 13 00274 g002
Figure 3. Percentage of range net change and shift for the desman and the otter under current time and the four 2050 global change scenarios. The variation depicted in each box plot refers to net change and shift values as generated by the three global circulation models and the four binarization thresholds.
Animals 13 00274 g003
Figure 4. Spatially explicit predictions of desman and otter range modifications under 2050 climate and land use change scenarios, as generated by the IPSL-CM5A-LR global circulation model and the “equalize sensitivity and specificity” binarization threshold. Grey: stable unsuitable habitat, red: habitat loss, green: stable suitable habitat, yellow: habitat gain.
Animals 13 00274 g004
Figure 5. Percentage of overlap between the desman and otter ranges of distribution today and under the four 2050 global change scenarios. The variation depicted in each box plot refers to overlap values as generated by the three global circulation models and the four binarization thresholds.
Animals 13 00274 g005
Disclaimer/Publisher’s Note: The statements, opinions and data contained in all publications are solely those of the individual author(s) and contributor(s) and not of MDPI and/or the editor(s). MDPI and/or the editor(s) disclaim responsibility for any injury to people or property resulting from any ideas, methods, instructions or products referred to in the content.