Article

Population Genetic Analysis of Six Chinese Indigenous Pig Meta-Populations Based on Geographically Isolated Regions

1
College of Animal Science and Technology, Henan Agricultural University, Zhengzhou 450002, China
2
Animal Science College, Tibet Agriculture and Animal Husbandry University, Linzhi 860000, China
3
National Animal Husbandry Service, Beijing 100193, China
4
National Supercomputing Center in Zhengzhou, Zhengzhou 450001, China
*
Authors to whom correspondence should be addressed.
Animals 2023, 13(8), 1396; https://doi.org/10.3390/ani13081396
Submission received: 1 March 2023 / Revised: 28 March 2023 / Accepted: 12 April 2023 / Published: 18 April 2023
(This article belongs to the Section Animal Genetics and Genomics)

Abstract

:

Simple Summary

Whole-genome SNP data from 613 Chinese indigenous pigs were collected to comprehensively estimate the genetic diversity, genetic relationship, and population genetic structure of the indigenous pig meta-populations. These Chinese meta-populations were characterized by genetic distance, genetic difference index, and runs of homozygosity (ROH). The contribution of genetic diversity of each meta-population was scaled based on genetic and allelic diversity, which provides a basis for improving the conservation project. Further, a selective sweep analysis revealed that genes related to fat deposition and heat stress may contribute to the adaptability of the indigenous pigs to cold and heat. These findings provide a theoretical basis for the improvement of conservation strategies and insights into the environmental adaptability of Chinese indigenous pigs.

Abstract

The diversification of indigenous pig breeds in China has resulted from multiple climate, topographic, and human cultural influences. The numerous indigenous pig breeds can be geographically divided into six meta-populations; however, their genetic relationships, contributions to genetic diversity, and genetic signatures remain unclear. Whole-genome SNP data for 613 indigenous pigs from the six Chinese meta-populations were obtained and analyzed. Population genetic analyses confirmed significant genetic differentiation and a moderate mixture among the Chinese indigenous pig meta-populations. The North China (NC) meta-population had the largest contribution to genetic and allelic diversity. Evidence from selective sweep signatures revealed that genes related to fat deposition and heat stress response (EPAS1, NFE2L2, VPS13A, SPRY1, PLA2G4A, and UBE3D) were potentially involved in adaptations to cold and heat. These findings from population genetic analyses provide a better understanding of indigenous pig characteristics in different environments and a theoretical basis for future work on the conservation and breeding of Chinese indigenous pigs.

1. Introduction

The domestication of indigenous pigs in China began about 9000 years ago [1,2,3,4], and selective breeding of pigs has been performed since the 7th century [5]. Because China is an expansive country with complex climates and geographies, domesticated breeds of pigs have experienced various degrees of natural selection leading to diverse phenotypic characteristics of indigenous pig breeds [6]. Subsequently, Chinese indigenous pig breeds have distinctive features in different geographical settings, displaying broad adaptability to multiple environments (e.g., hypoxia, hypobaria, cold, and heat) [4].
Based on the region where they live and environmental adaptations, Chinese indigenous pigs can be divided into six geographic types [7]. These six geographic types include Southern China (SC), Southwestern China (SWC), Central China (CC), Plateau of China (PC), Jianghai district of China (JDC), and North China (NC). The phenotypes of indigenous pig breeds have large differences among the different regions. Furthermore, pigs in the southern region and plateau are smaller than the northern pigs, which is partly related to their environment and climate [8,9]. The climate of Northern China is cold and dry, and Southern China has a hot and humid climate [10]. Moreover, the environment is the main factor affecting the distribution and diversity of species [8,11,12]. Animals can become better adapted to their local environments through genetic variation associated with environmental tolerances [8,13]. Pig breeds in the southern region are well adapted to the heat and humidity [8], and Tibetan pigs are able to adapt to the harsh environment of high altitudes and hypobaric and hypoxic conditions in the plateau [14]. Indeed, the indigenous pigs in different geographical areas have evolved adaptations to their region producing distinct representative characteristics.
In this study, a population genetic analysis was performed on six geographically isolated Chinese indigenous pig meta-populations. Genetic and allelic diversity of each indigenous pig meta-population was evaluated to determine their proportional contributions to the gene pool of all six meta-populations. Finally, the signatures of selective sweeps through Chinese indigenous pig meta-populations were compared to screen potential candidate genes associated with acclimation.

2. Material and Methods

2.1. Sample Collection

A broad array of 60K genome-wide single-nucleotide polymorphism (SNP) data that included 613 pigs from 37 Chinese indigenous breeds was downloaded [15]. Based on geographical location, we grouped these indigenous pig breeds into six meta-populations, which consisted of Southern China (SC), Southwestern China (SWC), Central China (CC), Plateau of China (PC), Jianghai district of China (JDC), and North China (NC). In addition, we also divided three climatic regions, including the northern region (NR), southern region (SR), and central region (CR), to partition Chinese indigenous pig meta-populations based on climate. The detailed distribution of these meta-populations and breeds is shown in Figure 1, and supplemental information is also provided in Table S1.

2.2. Data Quality Control

Quality control of SNP data was performed using PLINK software (https://www.cog-genomics.org/plink/1.9/, accessed on 12 May 2022). The SNPs with call rates of less than 99% and minor allele frequency larger than 1% and located on sex chromosomes were removed. A set of 40,127 SNPs remained for subsequent analyses.

2.3. Population Structure Analysis

The geographical distributions of the six pig meta-populations were created using ‘tmap’ functions (https://cran.r-project.org/web/packages/tmap/index.html, accessed on 12 May 2022) in R (http://www.r-project.org/, accessed on 12 May 2022). Principal component analysis (PCA) was performed using PLINK, and the visualization of PCA was created with ggplot2 (http://had.co.nz/ggplot2/, accessed on 12 May 2022). The phylogenetic tree was analyzed with MEGA6 [16] and drawn by using ggtree (http://www.bioconductor.org/packages/ggtree, accessed on 12 May 2022). ADMIXTURE software [17] was utilized to reveal admixture patterns among the six pig meta-populations. Pophelper (http://www.royfrancis.com/pophelper/, accessed on 12 May 2022) was used to visualize the results of admixture patterns. The best number of ancestral components, K, was determined by cross-validation error analysis with K = 2 to 6.

2.4. Genetic Diversity and Differentiation

Observed heterozygosity (HO) and expected heterozygosity (HE) of the six pig meta-populations were calculated using PLINK. Metapop2 software (v2.4.2, Eugenio López-Cortegano, Spain) was used to compute the pair-wise genetic differentiation index (FST) and pair-wise Nei’s minimum genetic distance (Dnei) between subpopulations [18]. The total heterozygosity was partitioned into two components including the average expected heterozygosity within subpopulations (HS) and average Nei’s minimum genetic distance between subpopulations (DG); HS and DG were used to evaluate the contribution of each pig meta-population to heterozygosity [19]. Total allelic diversity (AT) was divided into within and between subpopulations. Average allelic diversity within subpopulations was computed as the mean number of alleles in the subpopulations minus one (AS), and the average number of special alleles in a subpopulation contrasted with the other subpopulation mean over all possible subpopulation pairs (DA) and was defined as the average allelic diversity between subpopulations [18].

2.5. Identification of Runs of Homozygosity and Distribution

We used the detectRUNS package (https://cran.r-project.org/web/packages/detectRUNS/index.html, accessed on 12 May 2022) to calculate runs of homozygosity (ROH) segments with default parameters as follows: the ROHs were divided into five categories: 0 to <6 Mb, 6 to <12 Mb, 12 to <24 Mb, 24 to <48 Mb, and ≥48 Mb. A sliding window analysis with window size of 15 SNPs was used, and the minimum number of homozygous SNPs was set to 20. Further, the homozygous threshold of windows overlapping was set to 0.05 with a minimum number of 1000 SNPs per kbps. Additionally, the maximum distance between two SNPs and the minimum length of a homozygous run was set to 1,000,000 bps and 250,000 bps, respectively. The individual genomic inbreeding coefficient based on ROH (FROH) [20] of the six geographically isolated meta-populations was also calculated using detectRUNS. The results of inbreeding coefficients for different meta-populations were plotted by ggplot2.

2.6. Selective Sweep Analysis

The population differentiation index (FST) and cross-population composite likelihood ratio test (XP-CLR) were employed to detect the genomic regions under selection for the differentiation of Chinese indigenous pigs. Selective sweep analysis was performed using VCFtools [21] and XPCLR software [22]. Manhattan maps of the FST and XP-CLR results were plotted using rMVP (https://github.com/xiaolei-lab/rMVP, accessed on 12 May 2022). Selective sweeps were scanned for FST and XP-CLR using a 10 kb non-overlapping window. Genomic signatures were defined as the top 1% of FST and XP-CLR. In addition, the intersection of genes located around the significant selection regions were annotated using BioMart (http://asia.ensembl.org/biomart/martview/, accessed on 12 May 2022).

3. Results and Discussion

3.1. Population Structure

According to their geographic origin and characteristics, Chinese indigenous pigs were divided into six geographically isolated meta-populations (Figure 1A) [23,24,25,26]. Principal component analysis based on whole-genome-wide SNPs revealed that the six meta-populations were relatively mixed (Figure 2A). Principal component 1 (PC1) captured 62.47% of the variance and separated some individuals in the Jianghai district of China (JDC) and North China (NC) from the main cluster. Interestingly, PC2 arranged the six meta-populations into groups somewhat consistent with their geographic origin with the Southern China (SC) and Southwestern China (SWC) meta-populations having maximum negative values and the NC and JDC meta-populations having maximum positive values (Figure 2A). Moreover, clear population admixture was seen in phylogenetic clustering (Figure 2B) and population structure (Figure 2C). A possible reason for this result is that the occupation of adjacent regions facilitates gene flow among these pig breeds. A population structure analysis provided evidence for introgression from exotic ancestry into Chinese indigenous pigs (Figure 2C), consistent with previous studies [27]. In addition, there were more genetic components in the SWC and CC meta-populations, which was consistent with the results of a frequent gene exchange in southern China [28]. The SC meta-population had unique genetic features compared to the others (Figure 2B,C), which could result from unique selective pressures from the hot and humid climate and from artificial selection for a small body size by humans [29] or long-term ancestral isolation.

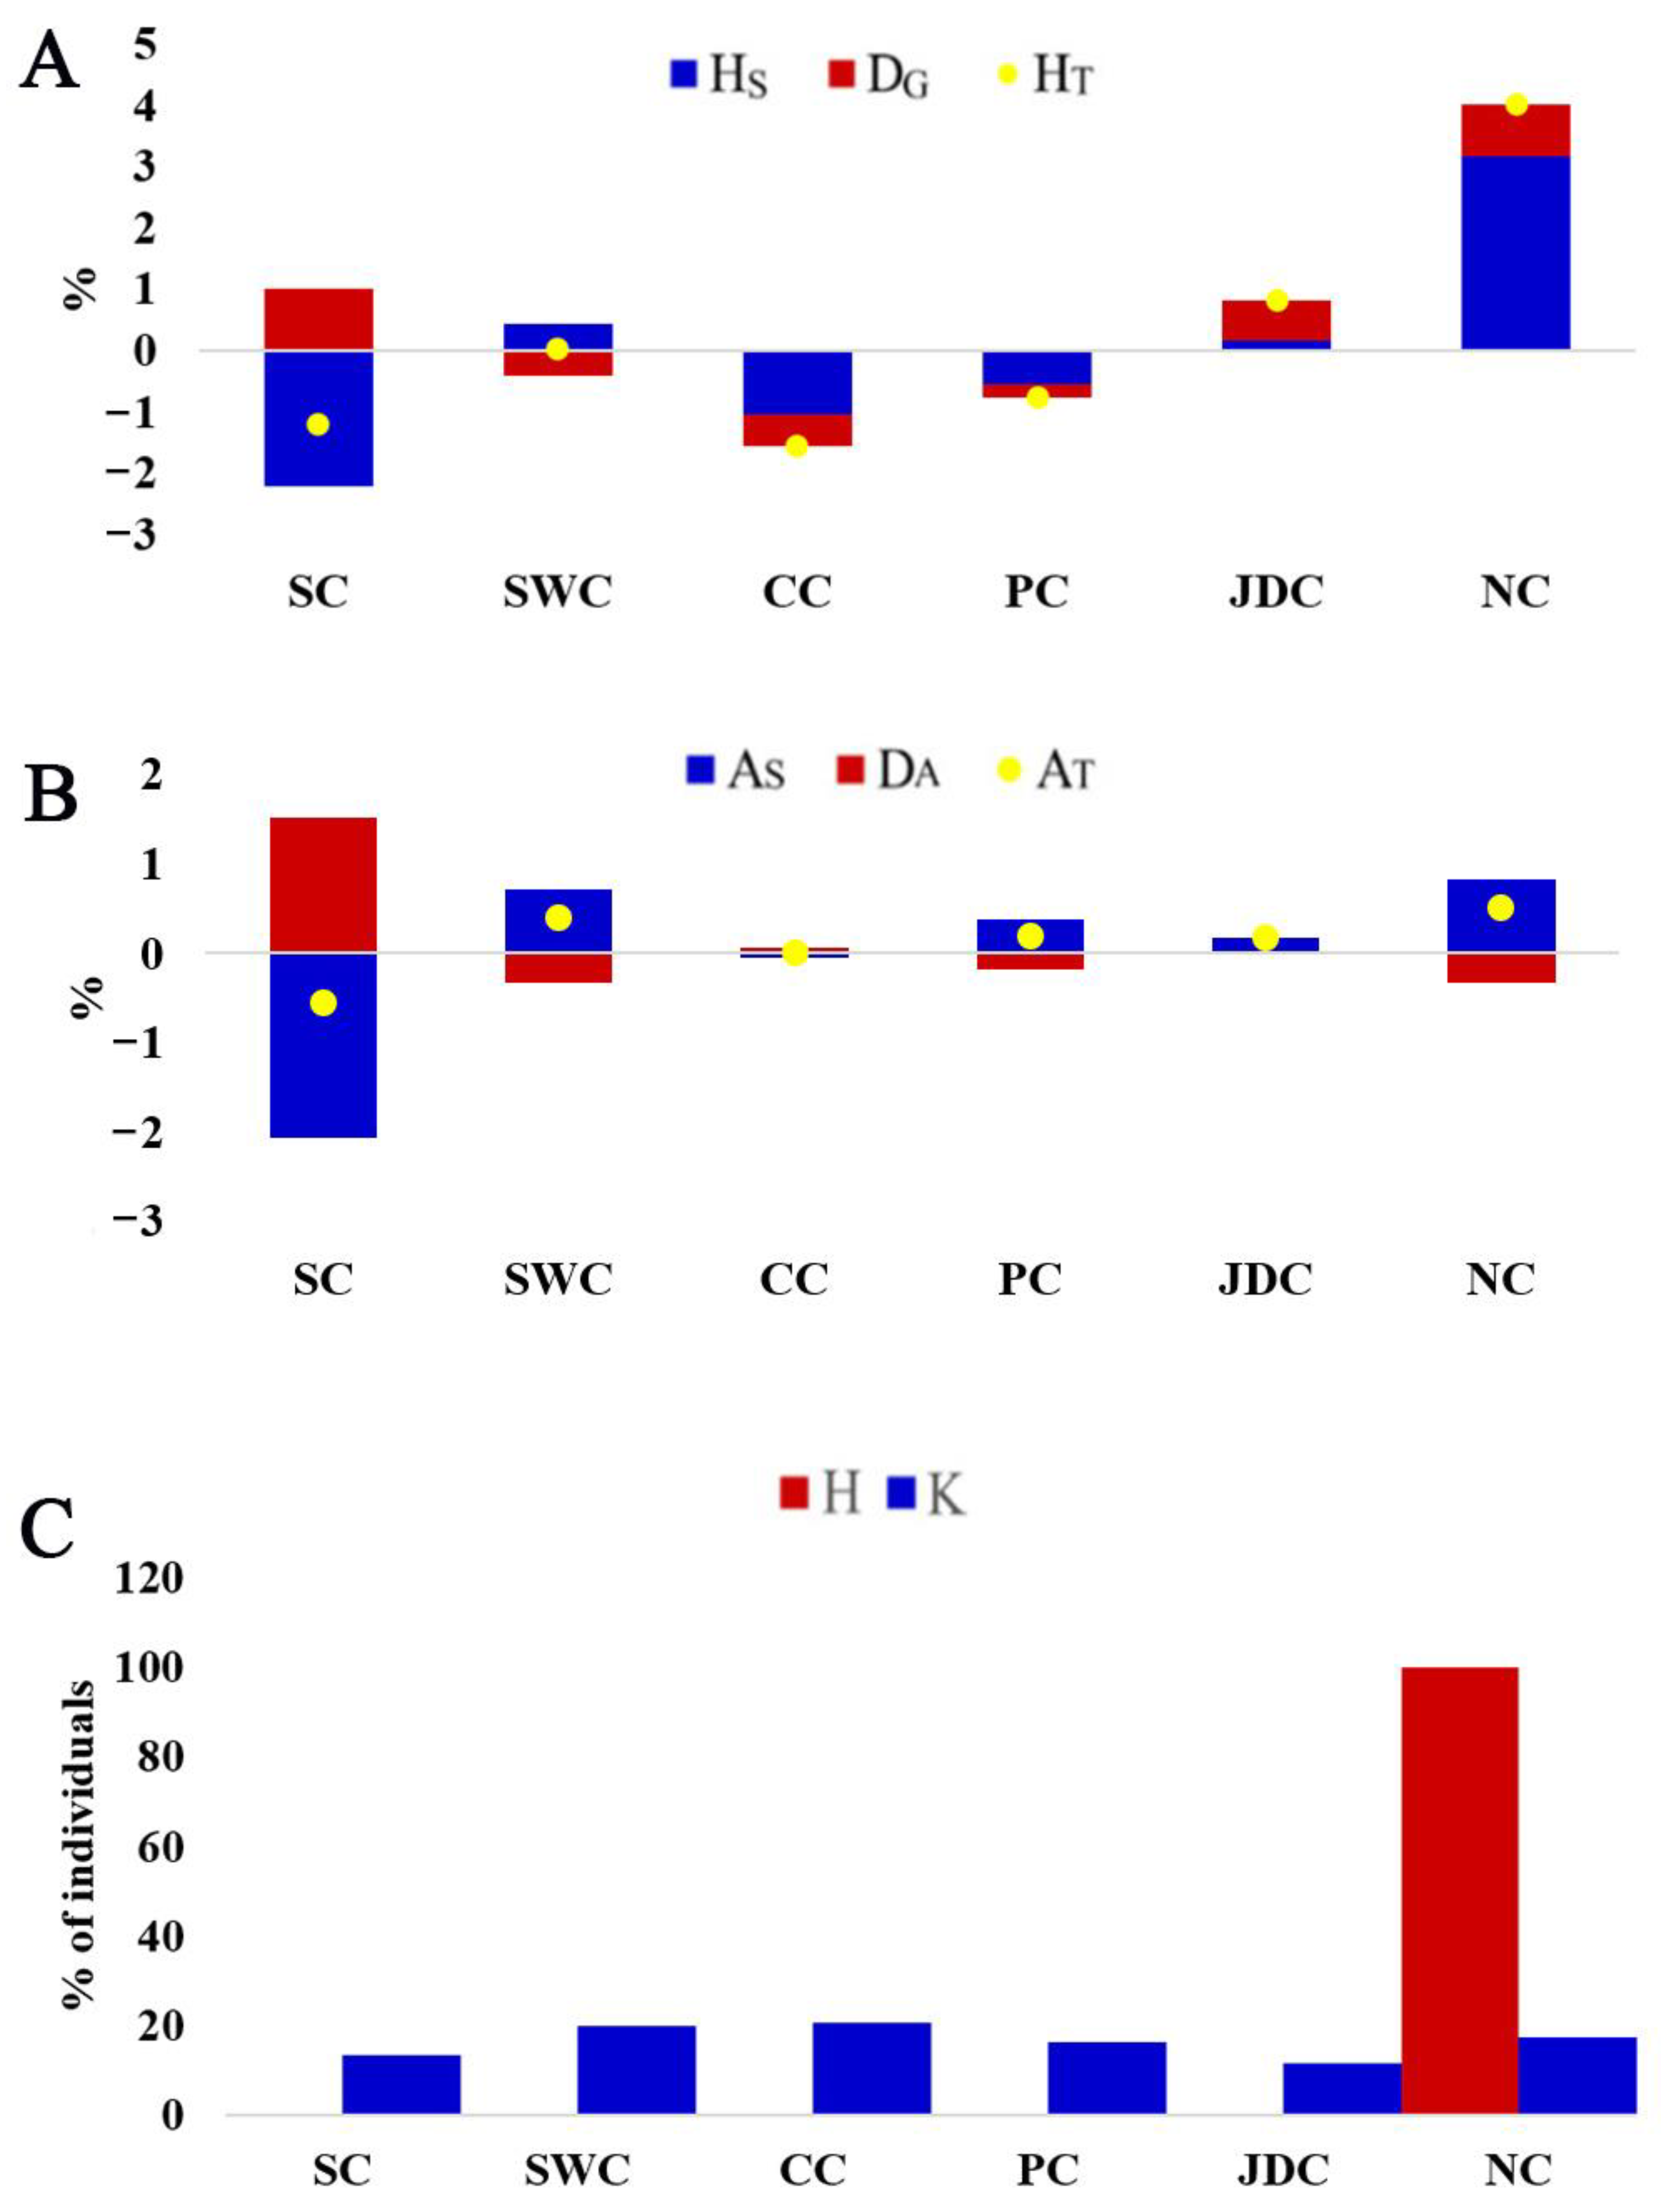
3.2. Genetic Diversity and Differentiation

Genetic diversity was calculated for each pig meta-population based on the SNP data (Table 1). The highest observed heterozygosity (HO: 0.2790) and expected heterozygosity (HE: 0.3224) were found for the NC meta-population; this meta-population had the lowest inbreeding coefficient (F: 0.3533) and average co-ancestry (fii: 0.6817). The minimum HO (0.2246) and HE (0.2733) were seen for the CC (Central China) and PC (Plateau of China) meta-populations, respectively. The maximum F (0.4748) and f ii (0.7676) were observed in the JDC and SC meta-populations, respectively (Table 1). The FST and Dnei results between the six pig meta-populations are shown in Figure 3. The values of FST and Dnei between the SWC (Southwestern China) and PC meta-populations were the lowest among all pair-wise comparisons of the meta-populations with values of 0.0375 and 0.019, respectively. In addition, the SC and JDC meta-populations had the highest values of differentiation indices (FST: 0.1359 and Dnei: 0.0709). The values for genetic differences were largely consistent with the physical distances between geographical coordinates, indicating that geographical distance influences the degree of genetic differentiation. Comparing the CC meta-population with the other meta-populations produced the lowest averages of FST (0.06486) and Dnei (0.03254). This finding of similar genetic composition of the CC meta-population to the others may be the result of its location in the middle region of China leading to a high gene flow between the CC meta-population and the others. Similarly, the results for population structure indicate that the CC meta-population was admixed with other populations (Figure 2C). The highest averages of FST and Dnei were between the SC meta-population and the other populations with values of 0.10126 and 0.05288, respectively, which may be from the adaptation to its unique geographic location and relative isolation.

3.3. Contribution to Genetic and Allelic Diversity

Maintenance of maximum genetic diversity is an important goal of conservation to maintain the potential for adaptation to environmental changes in the future [30]. Expected heterozygosity and allelic diversity measure genetic diversity, and they are susceptible to selection intensity and the influence of bottlenecks, respectively [31]. The contribution of each meta-population to the global genetic diversity was determined by calculating the change in genetic and allelic diversity, removing one subpopulation from all meta-populations before the calculation. When a subpopulation is removed, the positive and negative contribution values represent the loss and gain of diversity, respectively [18]. These positive and negative values can be used to rank the conservation priority of the subpopulation. Conservation priority based on contribution rank to total diversity within the meta-populations was similar for total heterozygosity and allelic diversity (Figure 4). The removal of the NC meta-population resulted in the highest loss of total heterozygosity (HT, 4.0108%) followed by the JDC meta-population (HT, 0.8306%) (Figure 4A). Furthermore, the NC and SWC meta-populations had the first-(0.5118%) and second-(0.3959%) highest contribution to the loss of total allelic diversity (AT), respectively. The CC meta-population had the highest percentage of HT (−1.5417%), and the percentage of AT was the highest in the SC meta-population (−0.5499%). The SC meta-population had lower within-population diversity because it had the most significant negative contributions to both HS (−2.1954%) and AS (−2.0666%) (Figure 4A,B). Moreover, the SC meta-population had the highest average co-ancestry (fii: 0.7676), which corresponds to the above results for population diversity (Table 1). The NC meta-population had the largest within-population diversity based on the highest values of positive contribution to both HS (3.1711%) and AS (0.8303%). Additionally, the largest within-population diversity corresponded to a low average co-ancestry (fii: 0.6817) in the NC meta-population (Table 1). The maximum value of expected heterozygosity roughly corresponded to the minimum value of average co-ancestry [32]. However, the lowest negative contribution to DG (−0.4937%) was observed in the CC meta-population, which is consistent with the CC meta-population having the smallest average Nei’s distance compared with the others (Dnei: 0.02712) (Figure 3). Based on maximum expected heterozygosity and total number of alleles, we calculated the contribution of each meta-population to the total meta-population gene pool (Figure 4C). As expected, the NC population had the highest contribution to allelic diversity (K). For genetic diversity, the NC population contributed 100%, and all six meta-populations contributed greater than 10% to allelic diversity. Overall, the above evidence suggests that the NC meta-population should be given the highest priority in a conservation plan for Chinese indigenous pigs. We should strengthen the research and application of indigenous pigs in North China, promote the re-innovation of pig germplasms, and speed up the development of local pig industries.

3.4. Distribution of ROH and Genomic Inbreeding Coefficient

A total of 207,141 ROHs were identified in the 613 pigs by detectRUNS, and the mean length for each ROH was 2.91 Mb. The number of ROHs on each pig chromosome is displayed in Figure 5A. Figure 5A illustrates that the number of ROH fragments may be related to chromosome length for each chromosome. The individual genomic inbreeding coefficient (FROH) for the pig meta-populations within geographic regions is shown in Figure 5B. The NC (0.3533) and PC (0.3536) meta-populations had a lower average inbreeding coefficient due to their wide distribution, indicating the possible influence of geographical distribution on inbreeding coefficients. The JDC meta-population had the highest average inbreeding coefficient (Table 1, 0.4748), but the number of ROH segments in this population was the lowest (Table 2). These results indicate that this population had a greater number of long ROH segments and had recently experienced higher inbreeding than the other meta-populations. This finding may be related to the close physical distance of breeds in the JDC meta-population. These results may indicate that reducing inbreeding among species and improving population diversity can be achieved by increasing the physical distance between species.

3.5. Selective Sweep Analysis for Temperature Adaptation

Chinese indigenous pigs were domesticated from wild ancestors and then differentiated into various breeds. To adapt to the local climate and environment, unique genetic structures developed over the past several thousand years. The annual mean temperature (AMT) in southern China is over 20 °C, whereas the AMT in northern China is below −20 °C (Figure 1B). Pigs residing in the southern region (SR) adapted to heat, while pigs living in the northern region (NR) adapted to cold. Thus, three populations comprised of breeds from the southern region (SR), central region (CR), and northern region (NR) were compared (Figure 6). In addition, Figure 2C shows that the consanguineous composition of pig breeds in SR (consisting mainly of SC and SWC), CR (consisting mainly of JDC and CC), and NR (consisting of NC) is obviously different. The consanguineous composition of CR was more like one combination of SR and CR. Using SR vs. NR and CR (SNC) and NR vs. SR and CR (NSC), we were more likely to detect the true difference of environmental adaptability between the northern and southern regions. Two combinations (Figure 6A,B and Figure 6C,D), SR vs. NR and CR (FST > 0.3430, XP-CLR > 6.1482) and NR vs. SR and CR (FST > 0.1787, XP-CLR > 4.3531), were used to explore the selection signatures related to heat and environmental adaptability, respectively (Figure 1B). Genes located within the 10 kb region adjacent to the selective region were defined as potential candidate genes. The overlap genes of FST and XP-CLR were 59 and 87 in SNC and NRC, respectively. A total of six candidate genes were identified underling environmental adaptation, possibly through changes in heat response and fat deposition (Table 3).
Genes associated with heat stress response included EPAS1, NFE2L2, and VPS13A. EPAS1 is associated with heat tolerance and can be directly implicated in the hypoxic response during thermal stress [33,34,35]. This finding suggests that EPAS1 may protect the reproductive capacity of pigs. A previous study indicated that NFE2L2 plays a protective role in bovine endometrial epithelial cells cultured under heat stress conditions [36]. NFE2L2 may reduce the effects of heat on fertility in pigs in the southern region. In addition, VPS13A has been recognized as a key regulator of secretion and aggregation of blood platelets in heat stress conditions, which can reduce physiological damage, including the risk of coronary thrombosis, in animals under heat stress [37]. This finding suggests that VPS13A is likely to have a close relationship with heat stress resistance in pigs. These three genes possibly reduced or mitigated inflammatory responses produced by heat stress in local pigs, and they may be associated with high-temperature adaptation of pigs in southern China.
Three genes associated with fat deposition were SPRY1, PLA2G4A, and UBE3D. Adipose tissue-specific SPRY1 expression in mice resulted in increased body fat, and conditional deletion of SPRY1 resulted in increased body fat [38]. Furthermore, some studies demonstrated that SPRY1 has protective effects on mice fed a high-energy diet, and SPRY1 expression can prevent high-fat, diet-induced obesity [39]. This mechanism may be associated with higher lean meat of pigs in the SR. High amounts of lean meat may dissipate heat and allow for easier adaptation to high temperatures. PLA2G4A was a key regulator for fat deposition significantly involved in several biological processes of fat deposition [40]. Further, PLA2G4A was significantly associated with persistent weight stability and insulin sensitivity [41]. This result may be related to the continuous provision of energy for pigs to resist the cold. Some studies found that UBE3D had a relationship with fat composition in sheep, and it was a cold-resistant candidate gene in Weining cattle [42,43]. Therefore, UBE3D may be related to the adaptation of pigs to low temperatures in the northern region. Thick layers of subcutaneous fat are an important adaptation to cold and heat; the fat can produce heat in response to cold exposure and protect animals against hypothermia [44]. The above results indicate that the genes discussed above may play key roles in the adaptation of pigs to their environment.

4. Conclusions

In summary, this study investigated contributions to genetic diversity of Chinese indigenous pig meta-populations and identified selective candidate genes involved in heat and cold environmental adaptation. We found that the NC meta-population has the highest genetic and allelic diversity for the six pig meta-populations. Numerous genes linked to fat deposition and heat stress were detected based on selective sweep analysis including EPAS1, NFE2L2, VPS13A, SPRY1, PLA2G4A, and UBE3D. These findings illuminate the genetic features of Chinese indigenous pigs leading to an improved conservation plan and provide theoretical support for the evolution of environmental adaptability.

Supplementary Materials

The following supporting information can be downloaded at: https://www.mdpi.com/article/10.3390/ani13081396/s1, Table S1: Breeds information.

Author Contributions

K.W. and G.L. contributed to the conception of the study. K.W. and L.Z. wrote and revised the manuscript. L.Z., S.Z., F.Z. (Fengting Zhan) and M.S. performed data analysis. F.Z. (Fangxian Zhu), P.S., X.L. (Xinjian Li), R.Q., X.H., X.L. (Xiuling Li) and F.Y. assisted with manuscript revision. J.L. contributed to computing resources collection. All authors have read and agreed to the published version of the manuscript.

Funding

This work was supported by the Grand Science and Technology Special Project in Tibet (XZ202101ZD0005N), the National Science Foundation of China (32002142), the Starting Foundation for Outstanding Young Scientists of Henan Agricultural University (30501280) and the National Key R&D Program (2021YFD1301205).

Institutional Review Board Statement

Not applicable.

Informed Consent Statement

Not applicable.

Data Availability Statement

The data used in this study are publicly available, and can be obtained from: http://dx.doi.org/10.5061/dryad.30tk6 (accessed on 5 May 2021).

Acknowledgments

We thank the National Supercomputing Centre in Zhengzhou for providing computing resources.

Conflicts of Interest

The authors declare no conflict of interest.

References

  1. Kijas, J.; Andersson, L. A phylogenetic study of the origin of the domestic pig estimated from the near-complete mtDNA genome. J. Mol. Evol. 2001, 52, 302–308. [Google Scholar] [CrossRef] [PubMed]
  2. Larson, G.; Dobney, K.; Albarella, U.; Fang, M.; Matisoo-Smith, E.; Robins, J.; Lowden, S.; Finlayson, H.; Brand, T.; Willerslev, E.; et al. Worldwide phylogeography of wild boar reveals multiple centers of pig domestication. Science 2005, 307, 1618–1621. [Google Scholar] [CrossRef] [PubMed]
  3. Xiang, H.; Gao, J.; Cai, D.; Luo, Y.; Yu, B.; Liu, L.; Liu, R.; Zhou, H.; Chen, X.; Dun, W.; et al. Origin and dispersal of early domestic pigs in northern China. Sci. Rep. 2017, 7, 5602. [Google Scholar] [CrossRef]
  4. Zhang, Z.; Xiao, Q.; Zhang, Q.; Sun, H.; Chen, J.; Li, Z.; Xue, M.; Ma, P.; Yang, H.; Xu, N.; et al. Genomic analysis reveals genes affecting distinct phenotypes among different Chinese and western pig breeds. Sci. Rep. 2018, 8, 13352. [Google Scholar] [CrossRef] [PubMed]
  5. Giuffra, E.; Kijas, J.; Amarger, V.; Carlborg, O.; Jeon, J.; Andersson, L. The origin of the domestic pig: Independent domestication and subsequent introgression. Genetics 2000, 154, 1785–1791. [Google Scholar] [CrossRef] [PubMed]
  6. Amaral, A.; Ferretti, L.; Megens, H.; Crooijmans, R.; Nie, H.; Ramos-Onsins, S.; Perez-Enciso, M.; Schook, L.; Groenen, M. Genome-wide footprints of pig domestication and selection revealed through massive parallel sequencing of pooled DNA. PLoS ONE 2011, 6, e14782. [Google Scholar] [CrossRef] [PubMed]
  7. Cai, Y.; Quan, J.; Gao, C.; Ge, Q.; Jiao, T.; Guo, Y.; Zheng, W.; Zhao, S. Multiple Domestication Centers Revealed by the Geographical Distribution of Chinese Native Pigs. Animals 2019, 9, 709. [Google Scholar] [CrossRef] [PubMed]
  8. Diao, S.; Huang, S.; Chen, Z.; Teng, J.; Ma, Y.; Yuan, X.; Chen, Z.; Zhang, H.; Li, J.; Zhang, Z. Genome-Wide Signatures of Selection Detection in Three South China Indigenous Pigs. Genes 2019, 10, 346. [Google Scholar] [CrossRef]
  9. Tian, Y.; Yue, M.; Gu, Y.; Gu, W.; Wang, Y. Single-nucleotide polymorphism analysis of GH, GHR, and IGF-1 genes in minipigs. Braz. J. Med. Biol. Res. 2014, 47, 753–758. [Google Scholar] [CrossRef]
  10. Cai, Y.; Fu, W.; Cai, D.; Heller, R.; Zheng, Z.; Wen, J.; Li, H.; Wang, X.; Alshawi, A.; Sun, Z.; et al. Ancient Genomes Reveal the Evolutionary History and Origin of Cashmere-Producing Goats in China. Mol. Biol. Evol. 2020, 37, 2099–2109. [Google Scholar] [CrossRef]
  11. Luo, H.; Zhang, H.; Li, K.; Rehman, M.; Mehmood, K.; Lan, Y.; Huang, S.; Li, J. Cysticercus tenuicollisEpidemiological Survey and Phylogenetic Characterization of Isolated from Tibetan Pigs in Tibet, China. BioMed Res. Int. 2017, 2017, 7857253. [Google Scholar] [CrossRef]
  12. Wang, J.; Ren, Q.; Hua, L.; Chen, J.; Zhang, J.; Bai, H.; Li, H.; Xu, B.; Shi, Z.; Cao, H.; et al. Comprehensive Analysis of Differentially Expressed mRNA, lncRNA and circRNA and Their ceRNA Networks in the Longissimus Dorsi Muscle of Two Different Pig Breeds. Int. J. Mol. Sci. 2019, 20, 1107. [Google Scholar] [CrossRef]
  13. Yang, Y.; Gao, C.; Yang, T.; Sha, Y.; Cai, Y.; Wang, X.; Yang, Q.; Liu, C.; Wang, B.; Zhao, S. Characteristics of Tibetan pig lung tissue in response to a hypoxic environment on the Qinghai-Tibet Plateau. Arch. Anim. Breed. 2021, 64, 283–292. [Google Scholar] [CrossRef] [PubMed]
  14. Wang, W.; Yang, Q.; Xie, K.; Wang, P.; Luo, R.; Yan, Z.; Gao, X.; Zhang, B.; Huang, X.; Gun, S. HMOX1Transcriptional Regulation of Gene in Hezuo Tibetan Pigs: Roles of WT1, Sp1, and C/EBPα. Genes 2020, 11, 352. [Google Scholar] [CrossRef] [PubMed]
  15. Yang, B.; Cui, L.; Perez-Enciso, M.; Traspov, A.; Crooijmans, R.; Zinovieva, N.; Schook, L.; Archibald, A.; Gatphayak, K.; Knorr, C.; et al. Genome-wide SNP data unveils the globalization of domesticated pigs. Genet. Sel. Evol. 2017, 49, 71. [Google Scholar] [CrossRef]
  16. Zheng, Z.; Li, Y.; Wang, M.; Ruan, R.; Yang, B.; Zhu, T.; Li, S.; Liu, Y.; Qiao, T.; Lin, T.; et al. Leaf spot on Alocasia macrorrhizos caused by Fusarium asiaticum in Sichuan, China. Plant Dis. 2022, 15. [Google Scholar] [CrossRef] [PubMed]
  17. Alexander, D.; Novembre, J.; Lange, K. Fast model-based estimation of ancestry in unrelated individuals. Genome Res. 2009, 19, 1655–1664. [Google Scholar] [CrossRef] [PubMed]
  18. López-Cortegano, E.; Pérez-Figueroa, A.; Caballero, A. metapop2: Re-implementation of software for the analysis and management of subdivided populations using gene and allelic diversity. Mol. Ecol. Resour. 2019, 19, 1095–1100. [Google Scholar] [CrossRef]
  19. Liu, B.; Shen, L.; Guo, Z.; Gan, M.; Chen, Y.; Yang, R.; Niu, L.; Jiang, D.; Zhong, Z.; Li, X.; et al. Single nucleotide polymorphism-based analysis of the genetic structure of Liangshan pig population. Anim. Biosci. 2021, 34, 1105–1115. [Google Scholar] [CrossRef]
  20. McQuillan, R.; Leutenegger, A.; Abdel-Rahman, R.; Franklin, C.; Pericic, M.; Barac-Lauc, L.; Smolej-Narancic, N.; Janicijevic, B.; Polasek, O.; Tenesa, A.; et al. Runs of homozygosity in European populations. Am. J. Hum. Genet. 2008, 83, 359–372. [Google Scholar] [CrossRef]
  21. Danecek, P.; Auton, A.; Abecasis, G.; Albers, C.; Banks, E.; DePristo, M.; Handsaker, R.; Lunter, G.; Marth, G.; Sherry, S.; et al. The variant call format and VCFtools. Bioinformatics 2011, 27, 2156–2158. [Google Scholar] [CrossRef] [PubMed]
  22. Chen, H.; Patterson, N.; Reich, D. Population differentiation as a test for selective sweeps. Genome Res. 2010, 20, 393–402. [Google Scholar] [CrossRef] [PubMed]
  23. Xu, Z.; Meenu, M.; Chen, P.; Xu, B. Comparative Study on Phytochemical Profiles and Antioxidant Capacities of Chestnuts Produced in Different Geographic Area in China. Antioxidants 2020, 9, 190. [Google Scholar] [CrossRef]
  24. Zheng, X.; Liu, L.; Sun, J.; Li, G.; Zhou, F.; Xu, J. Imaging of underground karst water channels using an improved multichannel transient Rayleigh wave detecting method. PLoS ONE 2018, 13, e0199030. [Google Scholar] [CrossRef]
  25. Zhai, H.; Chen, C.; Wang, N.; Chen, Y.; Nie, X.; Han, B.; Li, Q.; Xia, F.; Lu, Y. Blood lead level is associated with non-alcoholic fatty liver disease in the Yangtze River Delta region of China in the context of rapid urbanization. Environ. Health A Glob. Access Sci. Source 2017, 16, 93. [Google Scholar] [CrossRef] [PubMed]
  26. Wang, Y.; Xu, M.; Shi, Y. Efficacy of spinal chiropractic manipulative therapy for adjusting the relationship between cervical facet joints to treat headache caused by acute mountain sickness. J. Int. Med. Res. 2020, 48, 1–9. [Google Scholar] [CrossRef] [PubMed]
  27. Wang, J.; Liu, C.; Chen, J.; Bai, Y.; Wang, K.; Wang, Y.; Fang, M. Genome-Wide Analysis Reveals Human-Mediated Introgression from Western Pigs to Indigenous Chinese Breeds. Genes 2020, 11, 275. [Google Scholar] [CrossRef] [PubMed]
  28. Wang, Y.; Zhang, C.; Peng, Y.; Cai, X.; Hu, X.; Bosse, M.; Zhao, Y. Whole-genome analysis reveals the hybrid formation of Chinese indigenous DHB pig following human migration. Evol. Appl. 2022, 15, 501–514. [Google Scholar] [CrossRef]
  29. Xu, J.; Fu, Y.; Hu, Y.; Yin, L.; Tang, Z.; Yin, D.; Zhu, M.; Yu, M.; Li, X.; Zhou, Y.; et al. Whole genome variants across 57 pig breeds enable comprehensive identification of genetic signatures that underlie breed features. J. Anim. Sci. Biotechnol. 2020, 11, 115. [Google Scholar] [CrossRef]
  30. Steffen, W.; Richardson, K.; Rockström, J.; Cornell, S.; Fetzer, I.; Bennett, E.; Biggs, R.; Carpenter, S.; de Vries, W.; de Wit, C.; et al. Sustainability. Planetary boundaries: Guiding human development on a changing planet. Science 2015, 347, 1259855. [Google Scholar] [CrossRef]
  31. López-Cortegano, E.; Pouso, R.; Labrador, A.; Pérez-Figueroa, A.; Fernández, J.; Caballero, A. Optimal Management of Genetic Diversity in Subdivided Populations. Front. Genet. 2019, 10, 843. [Google Scholar] [CrossRef] [PubMed]
  32. Shang, P.; Li, W.; Tan, Z.; Zhang, J.; Dong, S.; Wang, K.; Chamba, Y. Population Genetic Analysis of Ten Geographically Isolated Tibetan Pig Populations. Animals 2020, 10, 1297. [Google Scholar] [CrossRef] [PubMed]
  33. Sigdel, A.; Liu, L.; Abdollahi-Arpanahi, R.; Aguilar, I.; Peñagaricano, F. Genetic dissection of reproductive performance of dairy cows under heat stress. Anim. Genet. 2020, 51, 511–520. [Google Scholar] [CrossRef] [PubMed]
  34. Dikmen, S.; Wang, X.Z.; Ortega, M.S.; Cole, J.B.; Null, D.J.; Hansen, P.J. Single nucleotide polymorphisms associated with thermoregulation in lactating dairy cows exposed to heat stress. J. Anim. Breed. Genet. 2015, 132, 409–419. [Google Scholar] [CrossRef]
  35. Ortega, M.S.; Denicol, A.C.; Cole, J.B.; Null, D.J.; Hansen, P.J. Use of single nucleotide polymorphisms in candidate genes associated with daughter pregnancy rate for prediction of genetic merit for reproduction in Holstein cows. Anim. Genet. 2016, 47, 288–297. [Google Scholar] [CrossRef]
  36. Murata, H.; Kunii, H.; Kusama, K.; Sakurai, T.; Bai, H.; Kawahara, M.; Takahashi, M. Heat stress induces oxidative stress and activates the KEAP1-NFE2L2-ARE pathway in bovine endometrial epithelial cells†. Biol. Reprod. 2021, 105, 1114–1125. [Google Scholar] [CrossRef]
  37. Asadollahi, H.; Vaez Torshizi, R.; Ehsani, A.; Masoudi, A.A. An association of CEP78, MEF2C, VPS13A and ARRDC3 genes with survivability to heat stress in an F2 chicken population. J. Anim. Breed. Genet. 2022, 139, 574–582. [Google Scholar] [CrossRef]
  38. Urs, S.; Venkatesh, D.; Tang, Y.; Henderson, T.; Yang, X.; Friesel, R.; Rosen, C.; Liaw, L. Sprouty1 is a critical regulatory switch of mesenchymal stem cell lineage allocation. FASEB J. 2010, 24, 3264–3273. [Google Scholar] [CrossRef]
  39. Urs, S.; Henderson, T.; Le, P.; Rosen, C.; Liaw, L. Tissue-specific expression of Sprouty1 in mice protects against high-fat diet-induced fat accumulation, bone loss and metabolic dysfunction. Br. J. Nutr. 2012, 108, 1025–1033. [Google Scholar] [CrossRef]
  40. Xiao, C.; Sun, T.; Yang, Z.; Xu, W.; Wang, J.; Zeng, L.; Deng, J.; Yang, X. Transcriptome landscapes of differentially expressed genes related to fat deposits in Nandan-Yao chicken. Funct. Integr. Genom. 2021, 21, 113–124. [Google Scholar] [CrossRef]
  41. Harris, R.; Alcott, C.; Sullivan, E.; Takahashi, D.; McCurdy, C.; Comstock, S.; Baquero, K.; Blundell, P.; Frias, A.; Kahr, M.; et al. Genomic Variants Associated with Resistance to High Fat Diet Induced Obesity in a Primate Model. Sci. Rep. 2016, 6, 36123. [Google Scholar] [CrossRef] [PubMed]
  42. Rovadoscki, G.; Pertile, S.; Alvarenga, A.; Cesar, A.; Pértille, F.; Petrini, J.; Franzo, V.; Soares, W.; Morota, G.; Spangler, M.; et al. Estimates of genomic heritability and genome-wide association study for fatty acids profile in Santa Inês sheep. BMC Genom. 2018, 19, 375. [Google Scholar] [CrossRef] [PubMed]
  43. Liu, Y.; Cheng, H.; Wang, S.; Luo, X.; Ma, X.; Sun, L.; Chen, N.; Zhang, J.; Qu, K.; Wang, M.; et al. Genomic Diversity and Selection Signatures for Weining Cattle on the Border of Yunnan-Guizhou. Front. Genet. 2022, 13, 848951. [Google Scholar] [CrossRef] [PubMed]
  44. Song, N.; Chang, S.; Li, D.; Villanueva, C.; Park, K. Induction of thermogenic adipocytes: Molecular targets and thermogenic small molecules. Exp. Mol. Med. 2017, 49, e353. [Google Scholar] [CrossRef] [PubMed]
Figure 1. Geographical distributions of 37 Chinese indigenous pig breeds. Thirty-seven populations of Chinese indigenous pigs: 1, Wuzhishan pig; 2, Diannanxiaoer pig; 3, Luchuan pig; 4, Guangdongdahuabai pig; 5, Lantang pig; 6, Bamaxiang pig; 7, Mingguangxiaoer pig; 8, Congjiangxiang pig; 9, Guanling pig; 10, Xiang pig; 11, Dongshan pig; 12, Kele pig; 13, Leanhua pig; 14, Diqing Tibetan pig; 15, Shaziling pig; 16, Ganxiliangtouwu pig; 17, Nanchang Wild Boar pig; 18, Leping Spotted pig; 19, Jinhua pig; 20, Milin Tibetan pig; 21, Tongcheng pig; 22, Rongchang pig; 23, Neijiang pig; 24, Wannan Spotted pig; 25, Litang Tibetan pig; 26, Gongbujiangda Tibetan pig; 27, Sutai pig; 28, Meishan pig; 29, Erhualian pig; 30, Jiangquhai pig; 31, Tibetan pig; 32, Gansu Tibetan pig; 33, Bamei pig; 34, Laiwuhei pig; 35, Lichahei pig; 36, Hetaodaer pig; and 37, Min pig. (A) Six geographically isolated Chinese indigenous pig meta-populations: PC, Plateau of China; NC, North China; SC, Southern China; CC, Central China; JDC, Jianghai district of China; and SWC, Southwestern China. (B) Three climatically isolated Chinese indigenous pig meta-populations: NR, northern region; SR, southern region; and CR, central region.
Animals 13 01396 g001
Figure 2. Population structures and relationships. (A) Principal component analysis of Chinese indigenous pig populations. (B) Phylogenetic tree of Chinese indigenous pig populations. Group colors used in (A) are the same as (B). (C) Population structure of Chinese indigenous pigs revealed by admixture analysis. The population abbreviations are as in Figure 1A.
Animals 13 01396 g002
Figure 3. Heatmap plot of Nei’s minimum genetic distance Dnei (lower) and gene frequency differentiation index FST (upper). The population abbreviations are as in Figure 1A.
Animals 13 01396 g003
Figure 4. Contribution to genetic diversity of 6 Chinese indigenous pig meta-populations. (A,B) Contribution to within-(HS, AS), between-(DG, DA), and total (HT, AT) genetic and allelic diversity of six Chinese indigenous pig meta-populations. (C) Contribution of individuals (%) from each meta-population to a synthetic pool of individuals with maximal genetic diversity (H) or number of alleles (K). The population abbreviations are as in Figure 1A.
Animals 13 01396 g004
Figure 5. Descriptive graphics of runs of homozygosity (ROH) in 6 geographically isolated Chinese indigenous pig meta-populations. (A) The average number of ROHs per chromosome (bars) and the average percentage of each chromosome covered by ROHs (lines) for all pigs. (B) Distribution of ROH-based inbreeding coefficients (FROH) on each pig population within geographic region. The population abbreviations are as in Figure 1A.
Animals 13 01396 g005
Figure 6. Selective sweep analysis for three climatically isolated Chinese indigenous pig meta-populations by using FST and XP-CLR (Manhattan map of FST and Manhattan map of XP-CLR.). The red dots indicate the top 1% values of FST and XP-CLR. (A) FST of SR vs. NR and CR. (B) XP-CLR of SR vs. NR and CR. (C) FST of NR vs. SR and CR. (D) XP-CLR of NR vs. SR and CR. The population abbreviations are as in Figure 1B.
Animals 13 01396 g006
Table 1. Genetic diversity in 6 geographically isolated Chinese indigenous pig meta-populations.
Meta-PopulationOriginBreed
Number
NumberHOHEFfii
PCPlateau of China61100.24880.27330.35360.7428
NCNorth China5840.27900.32240.35330.6817
SCSouthern China61010.25250.29530.44070.7676
CCCentral China81300.22460.27520.42780.7470
JDCJianghai District of China4660.22890.28820.47480.7318
SWCSouthwestern China81220.24150.27730.38230.7308
Note: HO, observed heterozygosity; HE, expected heterozygosity; F, inbreeding coefficient; and fii, average co-ancestry within the population.
Table 2. Descriptive statistics of runs of homozygosity (ROH) number of each pig population within geographic region by ROH length class (0–6 Mb, 6–12 Mb, 12–24 Mb, 24–48 Mb, and >48 Mb). The population abbreviations are as in Figure 1A.
Class0–6 Mb6–12 Mb12–24 Mb24–48 Mb>48 MbTotal
PC35,759
(95.07%)
1265
(3.36%)
372
(0.99%)
142
(0.38%)
74
(0.20%)
37,612
NC21,126
(91.63%)
1204
(5.22%)
438
(1.90%)
197
(0.85%)
92
(0.40%)
23,057
SC36,375
(93.72%)
1713
(4.41%)
467
(1.20%)
152
(0.39%)
107
(0.28%)
38,814
CC41,530
(92.92%)
1945
(4.35%)
703
(1.57%)
326
(0.73%)
189
(0.42%)
44,693
JDC20,526
(90.18%)
1376
(6.05%)
541
(2.38%)
237
(1.04%)
81
(0.36%)
22,761
SWC37,518
(93.32%)
1731
(4.31%)
622
(1.55%)
231
(0.57%)
102
(0.25%)
40,204
Table 3. List of candidate genes located in genomic regions with a high value of both the intersection of FST and XP-CLR. The population abbreviations are as in Figure 1B.
GroupCHRStart (bp)End (bp)Gene FSTXP-CLRFunction
SNC394,167,75994,253,662EPAS10.449313.6013Heat tolerance in dairy cows [33,34,35]
SNC1582,967,48583,146,185NFE2L20.36817.8295Protecting the body of dairy cows under heat stress [36]
SNC1230,069,339230,331,343VPS13A0.42958.3043Reducing physiological damage in animals under heat stress [37]
SNC8100,449,476100,863,780SPRY10.49006.9364Fat deposition [38,39]
NSC9127,853,581128,164,825PLA2G4A0.19605.0068The key regulators for fat deposition [40,41]
NSC183,140,47983,295,865UBE3D0.26127.2031Related to fat composition in sheep [42,43,44]
Note: SNC, SR vs. NR and CR; NSC, NR vs. SR and CR.
Disclaimer/Publisher’s Note: The statements, opinions and data contained in all publications are solely those of the individual author(s) and contributor(s) and not of MDPI and/or the editor(s). MDPI and/or the editor(s) disclaim responsibility for any injury to people or property resulting from any ideas, methods, instructions or products referred to in the content.

