Article

Using Image Analysis Technique for Predicting Light Lamb Carcass Composition

1
Centre for Interdisciplinary Research in Animal Health (CIISA), Faculty of Veterinary Medicine, University of Lisbon, Avenida da Universidade Técnica, 1300-477 Lisboa, Portugal
2
Associate Laboratory of Animal and Veterinary Science (AL4AnimalS), Veterinary and Animal Research Centre (CECAV), University of Trás-os-Montes e Alto Douro, Quinta de Prados, 5000-801 Vila Real, Portugal
3
Mountain Research Centre (CIMO), Escola Superior Agrária, Instituto Politécnico de Bragança, Campus Sta Apolónia Apt 1172, 5301-855 Bragança, Portugal
*
Author to whom correspondence should be addressed.
Animals 2024, 14(11), 1593; https://doi.org/10.3390/ani14111593
Submission received: 19 April 2024 / Revised: 17 May 2024 / Accepted: 27 May 2024 / Published: 28 May 2024
(This article belongs to the Collection Carcass Composition and Meat Quality of Small Ruminants)

Abstract

:

Simple Summary

To categorize carcasses into value classes aligning with consumer preferences and to guarantee equitable compensation for producers, as well as to furnish valuable data for scientific research, numerous technologies have been devised to assess carcass composition with ever-increasing accuracy and precision. One such technology is video image analysis (VIA), which has demonstrated promising outcomes, particularly in its application to cattle and sheep carcasses. This study focuses on employing a VIA methodology for evaluating light lamb carcasses, a segment that has received comparatively less attention from both research and industry.

Abstract

Over the years, numerous techniques have been explored to assess the composition and quality of sheep carcasses. This study focuses on the utilization of video image analysis (VIA) to evaluate the composition of light lamb carcasses (4.52 ± 1.34 kg, mean cold carcass weight ± SD). Photographic images capturing the lateral and dorsal sides of fifty-five light lamb carcasses were subjected to analysis. A comprehensive set of measurements was recorded, encompassing dimensions such as lengths, widths, angles, areas, and perimeters, totaling 21 measurements for the lateral view images and 29 for the dorsal view images. K-Folds stepwise multiple regression analyses were employed to construct prediction models for carcass tissue weights (including muscle, subcutaneous fat, intermuscular fat, and bone) and their respective percentages. The most effective prediction equations were established using data from cold carcass weight (CCW) and measurements from both dorsal and lateral views. These models accounted for a substantial portion of the observed variation in the weights of all carcass tissues (with K-fold-R2 ranging from 0.83 to 0.98). In terms of carcass tissue percentages, although the degree of variation explained was slightly lower (with K-fold-R2 ranging from 0.41 to 0.78), the VIA measurements remained integral to the predictive models. These findings underscore the efficacy of VIA as an objective tool for assessing the composition of light lamb carcasses, which are carcasses weighing ≈ 4–8 kg.

1. Introduction

Scholz et al. [1] pointed out that accurate and precise evaluation of body or carcass composition is important for performance testing, grading, and the selection or payment of meat-producing animals, as well as for scientific studies on growth, nutrition, genetics, housing, and behavior or farm animal well-being. Sorting carcasses into value classes based on consumer preferences, producers can be rewarded for delivering carcasses that meet industry and consumer requirements [2,3,4]) and, feeding this information back from the abattoir to the producers and breeders, it can be used in genetic evaluations, what will increase the accuracy of estimated breeding values and rates of response to selection [5]. However, direct evaluation of carcass composition implies dissection and/or chemical analyses, which are destructive, time-consuming, expensive, and prone to error due to human fatigue [6], while traditional indirect techniques based on linear measures have shown poor prediction accuracy [7,8]. So, in the process of developing new technologies to assess carcass composition with increasing accuracy and precision, preference has been given to non-invasive procedures, relying mainly on the development of electronic and computer-based techniques in order to provide objective phenotypic data [1]. Since the Kansas State University won, in 1980, a project to develop a prototype VIA [9], several works have been carried out to understand and develop the potential of this technology as a non-destructive nor invasive alternative to allow an objective, quick and precise evaluation of the carcass without interfering with the production chain [10]. The evaluation of carcasses with the VIA systems is based on measurements of length, width, area, angle, volume, and color made on images obtained during processing operations. Such measurements can then be used to estimate traits such as carcass yield, lean meat yield, saleable meat yield, yield in pieces, and percentage of fat or carcass muscularity [11,12,13,14]. The objective of the present study was to evaluate the potential of a VIA technology to estimate the tissue composition of light lamb carcasses, developing prediction equations for carcass muscle, fat, and bone.

2. Materials and Methods

2.1. Animals and Carcasses

Light carcasses of the fifty-five lambs from the indigenous Portuguese Churra da Terra Quente (CTQ) breed, in accordance with the Borrego Terrincho–PDO specifications [15], were selected for this. Briefly, the Borrego Terrincho–PDO lamb comes from the Churra da Terra Quente breed in Northeast Portugal and is primarily bred for milk production and milk-fed lambs. These lambs are typically slaughtered at 4–6 weeks of age and yield carcasses weighing approximately 4–8 kg. European meat quality labels, such as “Borrego Terrincho”–PDO, are linked to specific regions and traditional production methods, providing a level of uniqueness. The animals were processed in an accredited slaughterhouse, adhering strictly to both National and European regulations. Following slaughter, the carcasses underwent refrigeration at 4 °C for 24 h, during which the cold carcass weight (CCW) was recorded (4.52 ± 1.34 kg, mean CCW ± SD).

2.2. Acquisition of VIA Images and Measurements

Photographic images capturing both the dorsal and left outer side of each carcass were obtained. For the left outer side images, carcasses were suspended against a black background and repositioned for dorsal images; precautions were taken to stabilize the carcasses prior to image capture. A Nikon D3100 digital camera (Nikon Inc., Tokyo, Japan) equipped with an 8-megapixel sensor was used for image acquisition. The camera settings were manually configured: shutter speed at 1/60 s, aperture at F/4.5, ISO sensitivity set to 400, no flash, and a focal length of 26 mm. Images were saved in JPEG format. The entire process was conducted under consistent artificial lighting conditions and a fixed camera position, with the camera positioned 3 m from the carcasses.
To ensure scale accuracy, two red dots were projected onto each carcass using parallel lasers (wavelength: 650 nm) mounted on a frame with predetermined spacing. These dots served as reference points for scale-bar purposes. The captured images were then transferred to a computer for analysis. Image analysis was performed using Fiji software (ImageJ 1.49u) developed by Rasband [16]. A total of 50 VIA measurements were recorded, comprising 21 from lateral view images (Figure 1a–d) and 29 from dorsal view images (Figure 2a–d). These measurements included areas, perimeters, lengths, angles, and widths taken from various regions of the carcass. In the present study, we build upon the documented measurements of length, area, width, and angle from prior research utilizing VIA systems. Specifically, insights from studies conducted by Batista et al. [17], Ngo et al. [18], Oliver et al. [19], and Rius-Vilarrasa et al. [20] have informed our approach and methodology.

2.3. Carcass Jointing and Dissection

Following the delineation by Santos et al. [21], the half-carcasses underwent division into six distinct cuts: neck, shoulder, breast, rib, loin, and leg. Subsequently, employing the methodology outlined by Panea et al. [22], all cuts were meticulously dissected into lean, fat (subcutaneous and intermuscular fat), and bone components within a controlled room environment ranging from 15 to 20 °C.

2.4. Models and Statistical Analysis

A comprehensive descriptive statistical analysis was conducted, encompassing the determination of mean, standard deviation, range, as well as the coefficient of variation for carcass characteristics such as CCW and weight, and percentage of muscle, subcutaneous fat, intermuscular fat, total fat, and bone, along with all VIA measurements.
For predictive modeling, K-fold stepwise regression analyses were employed to predict muscle, subcutaneous fat, intermuscular fat, total carcass fat, and bone weights and percentages. These models utilized either CCW plus VIA measurements or solely VIA measurements as independent variables. The accuracy of these predictions was assessed through the K-fold coefficient of determination (K-fold-R2), while the precision of the prediction models was evaluated using the residual mean square error (RMSE). The value of 0.05 was used as p-value threshold. Furthermore, the overall predictive ability of the k-fold cross-validation models was gauged through the ratio of percent deviation (RPD), which is the ratio of the standard deviation of the reference values to the RMSE of the validation [23]. All statistical procedures were executed using JMP software version 17 (SAS Institute, Cary, NC, USA).

3. Results

Table 1 summarizes the descriptive statistics (mean, standard deviation, range, and coefficient of variation) for cold carcass weight, weight, and percentage of tissues and VIA measurements obtained with lateral and dorsal views of the light lamb carcasses.
The average cold carcass weight recorded was 4.52 kg. When considering the amount of carcass tissues, greater variation was evident, with coefficients of variation ranging from 22.9% for bone, 29.2% for muscle, 38.9% for intermuscular fat, to 58.6% for subcutaneous fat. In terms of VIA measurements, area measurements exhibited the most significant variation, with relatively close coefficients of variation (CV) observed for both lateral and dorsal views (20.0% < CV < 25.4% and 18.0% < CV < 25.0%, respectively). Conversely, angle measurements displayed the least variation for both lateral and dorsal views (3.5% < CV < 6.1% and 3.1% < CV < 3.4%, respectively).

3.1. Prediction of Carcass Tissues Weight in the Carcass

The predictors, coefficients of determination (K-fold-R2), root mean square error (RMSE), and the ratio of prediction to deviation (RPD) for the best models to estimate the weight of carcass tissues are presented in Table 2.
The stepwise regression analysis using CCW and VIA measurements showed that the best prediction equations explained most of the variation observed in the weight of all carcass tissues (0.83 < K-fold-R2 < 0.98). The highest accuracy was observed for muscle, using model 1 (based on dorsal + lateral view data), and the lowest was for subcutaneous fat, also using model 1. Regardless of using model 1, model 2 (based on dorsal view data), or model 3 (based on lateral view data), CCW was the first independent variable in the best models for all tissues, which always included at least one VIA measurement. The number of VIA measurements included in the best prediction equation for each tissue was quite similar for the three models, except in the case of muscle, with the best prediction equation (model 1) including eight VIA measurements as independent variables, while models 2 and 3 only included one VIA measurement. For each tissue, the accuracy of the estimates obtained with the three models was quite similar, although the precision of the estimates was consistently higher for model 1—the largest difference was observed for bone (K-fold-R2 = 0.95 and RMSE = 21.76 for model 1; K-fold-R2 = 0.91 and RMSE = 28.20 for model 2, Table 2). For each tissue, concerning VIA measurements, there was little correspondence between the independent variables included in model 1 and the independent variables included in models 2 and 3. In the case of muscle, there were several independent variables from the dorsal and lateral view, but none of the ones included in models 2 and 3 (DP3 and LA1, respectively). For subcutaneous fat and bone, the first independent variables in model 1 corresponded to the first independent variables of models 2 and 3, but for muscle and intermuscular fat that did not happen. In the case of muscle, the first independent variable included in model 3 (Lw6; Table 3) was not even included in model 1. Besides CCW, model 1 included only lateral view data for intermuscular fat, while bone included more dorsal view data than lateral view data, and muscle included a similar amount of dorsal and lateral view data. When CCW was not included in the stepwise regression analysis the best prediction equations still explained a very large amount of the variation observed in the weight of all carcass tissues (0.74 < K-fold-R2 < 0.98; Table 3), regardless of the model used. For each tissue, model 1 included one to three more independent variables than the next best model, which was always model 2. Model 1 showed consistent but just slightly higher accuracy (0.89 < K-fold-R2 < 0.98, against 0.86 < K-fold-R2 < 0.94, for model 2) and higher precision, the largest difference being observed for muscle (K-fold-R2 = 0.98 and RMSE = 56.64, for model 1; K-fold-R2 = 0.94 and RMSE = 84.22, for model 2).
As for the analysis including CCW, the muscle was the tissue most accurately estimated (0.89 < K-fold-R2 < 0.98). However, excluding CCW from the analysis, intermuscular fat estimates became the ones showing the lowest accuracy (0.82 < K-fold-R2 < 0.89) except in the case of model 3, with the subcutaneous fat estimates remaining the ones showing the lowest accuracy (K-fold-R2 = 0.74). For subcutaneous fat and bone, the first independent variables in model 1 corresponded to the first independent variables of models 2 and 3, but for muscle and intermuscular fat that did not happen. In the case of muscle, the first independent variable included in model 3 (Lw6; Table 3) was not even included in model 1. Across the different tissues, model 1 included more dorsal view data than lateral view data and more independent variables than models 2 and 3.

3.2. Prediction of Carcass Tissues Percentage in the Carcass

The predictors, coefficients of determination (K-fold-R2), root mean square error (RMSE), and the ratio of prediction to deviation (RPD) for the best models to estimate the percentage of carcass tissues are presented in Table 4.
The models for the prediction of carcass tissue percentages explained a much smaller amount of the variation observed than the equivalent models for the prediction of carcass tissue weights, except in the case of model 1 for subcutaneous fat, which showed K-fold-R2 = 0.83 and 0.78, respectively, for subcutaneous fat weight and subcutaneous fat percentage (Table 2 and Table 4). Still, with the exception of model 2 for muscle and intermuscular fat, the best prediction equations showed moderate to high accuracy (0.41 < K-fold-R2 < 0.78; Table 4) in predicting the percentage of the different carcass tissues. The highest accuracy was observed for subcutaneous fat, using model 1 (based on dorsal + lateral view data), and the lowest was for muscle, using model 2 (K-fold-R2 = 0.16; Table 4). Although CCW was the first independent variable in some of the best prediction equations (model 3 for all tissues except muscle and model 1 for bone), it was not included in most of the best prediction equations (Table 4). The number of VIA measurements included in the best prediction equation for each tissue was particularly larger in the case of model 1 for subcutaneous fat, total fat, and bone, in the latter case including CCW as well, particularly in the case of muscle (K-fold-R2 = 0.45; RMSE = 1.77), subcutaneous fat (K-fold-R2 = 0.78; RMSE = 0.84), and bone (K-fold-R2 = 0.72; RMSE = 1.00). Concerning VIA measurements, the first independent variables of models 2 and 3 were included in model 1, except in the case of the equations for muscle and intermuscular fat, which did not include the first independent variables of model 2 and included mainly lateral view data as independent variables, unlike model 1 for each of the other tissues, which included mainly dorsal view data. (Table 4). For those tissues with the best prediction equations including CCW (intermuscular fat, subcutaneous fat), when CCW was removed from the stepwise analysis, the best prediction equations showed poor to moderate accuracy (0.37 < K-fold-R2 < 0.46).

4. Discussion

Concerning the prediction of carcass tissue weight or carcass tissue percentage, regardless of the methodology/technology applied, the literature consistently shows body weight or carcass weight as the strongest single predictor, the question being if prediction accuracy is significantly increased using such different methodologies/technologies. In line with this, the present study showed CCW as the first independent variable included in the best models for the prediction of carcass tissue weights. However, for carcass tissue percentages, with the exception of bone, when the stepwise analysis used CCW data, CCW was included only in the best models without dorsal VIA data. Such a finding agrees with Araújo et al. [24]. In fact, working with hair sheep lambs, castrated males, from commercial herds, finished in confinement and slaughter in a range of weight from 21 to 49 kg, Araújo et al. [24] showed better estimates of CCW using dorsal view data than lateral view data and related this to the fact that in the dorsal region it is possible to use measurements that represent a large part of the carcass, with large deposition of musculature and adipose tissue. Horgan et al. [25] had already studied the contribution of dorsal and lateral view data for the best prediction equations using castrated male lambs reared at grass, weaned at an average age of 12 weeks, and slaughtered when they reached a target live weight of 42 kg. They showed that in collecting dorsal and lateral view data, most of the data included in the best prediction equations were supplied by the dorsal plan and, using just dorsal or lateral view data in the multiple regression analysis, most carcass traits were better predicted in the former case. The present study showed the same trend for carcass tissue weights when CCW was not included in the analysis, with model 1 including more dorsal view data than lateral view data as independent variables and model 2 showing higher accuracy than model 3, for all carcass tissues. Not so much when CCW was included in the analysis, nor when carcass tissues were predicted as a percentage of CCW, suggesting that, when the effect of CCW is accounted for, either including CCW as an independent variable or expressing carcass tissues of a percentage of CCW, lateral view data provide more complementary information than dorsal view data. The little correspondence observed, in most cases, between the independent variables included in model 1 and the independent variables included in models 2 and 3, for each carcass tissue, strengthens the idea that the complementarity of the information given by each independent variable for the best prediction equation is more valuable than the individual information of each independent variable. It is not possible to make a direct comparison between the present study with previous studies using VIA data since different studies used different linear measurements, area measurements, or even color, and some refer to saleable meat, which included a variable amount of fat and, sometimes, bone [4,12]. Also, factors such as breed, weight at slaughter, and feeding background have a strong effect on carcass composition. Previous studies on assessment of lamb carcasses by video image analysis have been conducted with quite different experimental populations, such as Scottish Mule Χ Suffolk male castrated lambs reared at grass, weaned at an average age of 12 weeks and slaughtered when they reached a target live weight of 42 kg [25], rams, ewes, and wethers of either wool-type (Rambouillet, Targhee) or large-frame meat-type (Suffolk, Hampshire), with a carcass weight of 24.3–27.2 kg [26], lamb carcasses reflecting the extreme range of variation in carcass traits experienced in commercial facility with hot carcass weight (HCW) ≤ 29.48 kg (light-muscled carcasses), HCW = 29.94 kg to 34.02 (medium-muscled carcasses) and HCW ≥ 34.47 kg (heavy-muscled carcasses) [27] and CCW = 21.22 kg to 54.34 kg [28], mixed sex and breed types selected to cover as far as possible the full spectrum of lambs slaughtered in Australia, with HCW = 13.6 to 34.0 kg [29] and purebred ram and ewe lambs of the Icelandic breed, with HCW = 7.2 to 26.8 kg [30]. Still, the present results compare well with results from such previous studies that showed R2 = 0.95 for saleable meat weight [25], R2 = 0.99 for lean meat weight [5], R2 = 0.58 for fat weight [25], 0.16 < R2 < 0.71 for saleable meat yield ([25,26,27,31], 0.48 < R2 < 0.74 for fat yield ([25,27,28], R2 = 0.60 for boneless saleable meat yield [29] and 0.52 < R2 < 0.58 for lean meat wield [29,30], particularly given the fact that the carcass weight the animals now used (mean CCW = 4.5 kg) was much smaller than the carcass weight of the animals used in such studies. The largest number of VIA measurements used as independent variables in the best prediction equations now obtained (nine VIA measurements with model 1, for subcutaneous fat percentage, excluding CCW from the analysis) is well in the range of the number of VIA measurements in the prediction equations developed in the same studies, (six to eight VIA measurements in most cases). Although there was a clear trend for model 1 to show higher accuracy and precision across all carcass tissues, considering the possibility of implementation of a VIA system under commercial abattoir conditions, this has to be balanced with the fact that model 1 also includes more VIA measurements as independent variables and implies the acquisition of images from two view plans instead of just one as in the case of models 2 and 3. If a larger number of VIA measurements to be collected may not be a problem with an automated system and the software resources currently available, creating the conditions to collect dorsal and lateral view data without interfering with the high speed of a slaughter line may not be practical. According to Viscarra Rossel et al. [32] most of the best prediction equations obtained in the present study for carcass tissue weights can be qualified as having excellent predictive value, presenting RPD > 2.5. The exceptions were the equations obtained with model 3 for fat weights when CCW was not included in the stepwise analysis. Even so, the equations for intermuscular fat and total fat showed very good predictive value (2.0 < RPD < 2.5) and the equation for subcutaneous fat showed good predictive value (1.8 < RPD < 2.0). Although the best equations for the prediction of the percentage of carcass tissues explained a considerably lower amount of the variation observed than the best equations for the prediction of carcass tissue weights, only the ones for the prediction of muscle percentage and model 2 for prediction of intermuscular fat percentage showed poor predictive value (1.0 < RPD < 1.4). The best equation for the prediction of subcutaneous fat percentage based on model 1 even showed excellent predictive value (RPD = 2.5).

5. Conclusions

This study not only confirms results from previous studies showing that information extracted from images of lamb carcasses can be used to explain most of the variation observed in carcass composition but also suggests that the same applies to light lamb carcasses, providing an objective means in conjunction of CCW, to have a value-based payment system that leads to a fair payment to the producer, according to the preference of the consumers. VIA data obtained from dorsal and lateral views provided higher accuracy and precision estimates than dorsal or lateral view data across all carcass tissues. However, considering the possibility of implementing a VIA system under commercial abattoir conditions, the need to reduce to a minimum the interference with the production chain may justify the option for using dorsal or lateral view data only. This needs further analysis, as well as additional studies, to strengthen the present results on light lamb carcasses.

Author Contributions

Conceptualization, M.A., A.C.B., C.G., S.S. and A.T.; methodology, A.C.B., C.G., V.S. and S.S.; software, S.S. and A.T.; investigation, A.C.B., C.G., S.S. and M.A.; resources, C.G. and S.S.; writing—original draft preparation, J.J.A.; writing—review and editing, A.C.B., C.G., S.S., J.J.A., A.T. and M.A.; supervision, C.G. and S.S.; project administration, C.G.; funding acquisition, C.G. All authors have read and agreed to the published version of the manuscript.

Funding

The authors acknowledge the financial support of the research unit CECAV, which was financed by the National Funds from FCT, the Portuguese Foundation for Science and Technology (FCT), project number UIDB/00772/2020 (Doi:10.54499/UIDB/00772/2020). Ana Catharina Batista also acknowledges the financial support from the Brazilian agency CAPES—Coordenação de Aperfeiçoamento de Pessoal de Ensino Superior (Process 1052/13-6).

Institutional Review Board Statement

Ethical review and approval were waived as the carcasses used in the study were obtained in a registered slaughterhouse for human consumption. All animals were slaughtered according to the regular procedures under the animal welfare supervisor and official veterinarians, according to EU guidelines for the protection of animals.

Informed Consent Statement

Not applicable.

Data Availability Statement

Data are available upon request to the corresponding author and with permission from study participants.

Acknowledgments

The authors thank and acknowledge the University of Trás-os-Montes and Alto Douro experimental farm and carcass laboratory staff.

Conflicts of Interest

The authors declare no conflicts of interest.

References

  1. Scholz, A.M.; Bünger, L.; Kongsro, J.; Baulain, U.; Mitchell, A.D. Non-invasive methods for the determination of body and carcass composition in livestock: Dual energy X-ray absorptiometry, computed tomography, magnetic resonance imaging and ultrasound: Invited review. Animal 2015, 9, 1250–1264. [Google Scholar] [CrossRef] [PubMed]
  2. Aalhus, J.L.; López-Campos, Ó.; Prieto, N.; Rodas-González, A.; Dugan, M.E.R.; Uttaro, B.; Juárez, M. Review: Canadian beef grading—Opportunities to identify carcass and meat quality traits valued by consumers. Can. J. Anim. Sci. 2014, 94, 545–556. [Google Scholar] [CrossRef]
  3. Allen, P. Recent developments in the objective measurement of carcass and meat quality for industrial application. Meat Sci. 2021, 181, 108601. [Google Scholar] [CrossRef] [PubMed]
  4. Delgado-Pando, G.; Allen, P.; Troy, D.J.; McDonnell, C.K. Objective carcass measurement technologies: Latest developments and future trends. Trends Food Sci. Technol. 2021, 111, 771–782. [Google Scholar] [CrossRef]
  5. Rius-Vilarrasa, E.; Bünger, L.; Maltin, C.; Matthews, K.R.; Roehe, R. Evaluation of Video Image Analysis (VIA) technology to predict meat yield of sheep carcasses on-line under UK abattoir conditions. Meat Sci. 2009, 82, 94–100. [Google Scholar] [CrossRef] [PubMed]
  6. Segura, J.; Aalhus, J.L.; Prieto, N.; Zawadski, S.; Scott, H.; López-Campos, O. Prediction of primal and retail cut weights, tissue composition and yields of youthful cattle carcasses using computer vision systems; whole carcass camera and/or ribeye camera. Meat Sci. 2023, 199, 109120. [Google Scholar] [CrossRef] [PubMed]
  7. Lawrence, T.E.; Elam, N.A.; Miller, M.F.; Brooks, J.C.; Hilton, G.G.; VanOverbeke, D.L.; McKeith, F.K.; Killefer, J.; Montgomery, T.H.; Allen, D.M.; et al. Predicting red meat yields in carcasses from beef-type and calf-fed Holstein steers using the United States Department of Agriculture calculated yield grade. J. Anim. Sci. 2010, 88, 2139–2143. [Google Scholar] [CrossRef] [PubMed]
  8. López-Campos, Ó.; Larsen, I.L.; Prieto, N.; Juárez, M.; Dugan, M.E.R.; Aalhus, J.L. Evaluation of the Canadian and United States beef yield prediction equations and dua energy x-ray absorptiometry for a rapid, non-invasive yield prediction in beef. In Proceedings of the 61st International Congress of Meat Science and Technology Session VII-111, Clermont-Ferrand, France, 23–28 August 2015. [Google Scholar]
  9. Woerner, D.R.; Belk, K.-E. The History of Instrument Assessment of Beef—A Focus on the Last Ten Years; National Cattlemen’s Beef Association: Washington, DC, USA, 2008. [Google Scholar]
  10. Craigie, C.R.; Ross, D.W.; Maltin, C.A.; Purchas, R.W.; Bünger, L.; Roehe, R.; Morris, S.T. The relationship between video image analysis (VIA), visual classification, and saleable meat yield of sirloin and fillet cuts of beef carcasses differing in breed and gender. Livest. Sci. 2013, 158, 169–178. [Google Scholar] [CrossRef]
  11. Pabiou, T.; Fikse, W.F.; Amer, P.R.; Cromie, A.R.; Nasholm, A.; Berry, D.P. Genetic variation in wholesale carcass cuts predicted from digital images in cattle. Animal 2011, 5, 1720–1727. [Google Scholar] [CrossRef]
  12. Craigie, C.R.; Navajas, E.A.; Purchas, R.W.; Maltin, C.A.; Bünger, L.; Hoskin, S.O.; Ross, D.W.; Morris, S.T.; Roehe, R. A review of the development and use of video image analysis (VIA) for beef carcass evaluation as an alternative to the current EUROP system and other subjective systems. Meat Sci. 2012, 92, 307–318. [Google Scholar] [CrossRef]
  13. Allen, P. Evaluating video image analysis (VIA) systems for beef carcass classification. In The Science of Beef Quality, Proceedings of the Annual Meeting of the British Society of Animal Science, Bristol, UK, 18–19 May 2005; British Society of Animal Science: Midlothian, UK, 2005; pp. 9–12. [Google Scholar]
  14. Allen, P. New methods for grading beef and sheep carcasses. In Evaluation of Carcass and Meat Quality in Cattle and Sheep; Lazzaroni, C., Gigli, S., Gabiña, D., Eds.; EAAP publications No. 123; Wageningen Academic Publishers: Wageningen, The Netherlands, 2007; pp. 39–48. [Google Scholar]
  15. Commission Regulation (EC) No 1107/96 of 12 June 1996 on the Registration of Geographical Indications and Designations of Origin under the Procedure Laid down in Article 17 of Council Regulation (EEC) No 2081/92. Available online: https://www.legislation.gov.uk/eur/1996/1107 (accessed on 5 April 2024).
  16. Rasband, W.S. ImageJ; U.S. National Institutes of Health: Bethesda, MD, USA, 2018. Available online: https://imagej.nih.gov/ij/ (accessed on 1 January 2019).
  17. Batista, A.C.; Santos, V.; Afonso, J.; Guedes, C.; Azevedo, J.; Teixeira, A.; Silva, S. Evaluation of an image analysis approach to predicting primal cuts and lean in light lamb carcasses. Animals 2021, 11, 1368. [Google Scholar] [CrossRef]
  18. Ngo, L.; Ho, H.; Hunter, P.; Quinn, K.; Thomson, A.; Pearson, G. Post-mortem prediction of primal and selected retail cut weights of New Zealand lamb from carcass and animal characteristics. Meat Sci. 2016, 112, 39–45. [Google Scholar] [CrossRef]
  19. Oliver, A.; Mendizabal, J.A.; Ripoll, G.; Alberti, P.; Purroy, A. Predicting meat yields and commercial meat cuts from carcasses of young bulls of Spanish breeds by the SEUROP method and an image analysis system. Meat Sci. 2010, 84, 628–633. [Google Scholar] [CrossRef]
  20. Rius-Vilarrasa, E.; Bünger, L.; Brotherstone, S.; Macfarlane, J.M.; Lambe, N.R.; Matthews, K.R.; Haresign, W.; Roehe, R. Genetic parameters for carcass dimensional measurements from Video Image Analysis and their association with conformation and fat class scores. Livest. Sci. 2010, 128, 92–100. [Google Scholar] [CrossRef]
  21. Santos, V.A.C.; Cabo, A.; Raposo, P.; Silva, J.A.; Azevedo, J.M.T.; Silva, S.R. The effect of carcass weight and sex on carcass composition and meat quality of “Cordeiro Mirandes”-Protected designation of origin lambs. Small Rumin. Res. 2015, 130, 136–140. [Google Scholar] [CrossRef]
  22. Panea, B.; Ripoll, G.; Albertí, P.; Joy, M.; Teixeira, A. Atlas of dissection of ruminant’s carcass. Inf. Tec. Econ. Agrar. 2012, 108, 3–105. [Google Scholar]
  23. Williams, P.C. Variables affecting near-infrared reflectance spectroscopic analysis. In Near-infrared Technology in the Agricultural and Food Industries; Williams, P., Norris, K., Eds.; American Association of Cereal Chemists: St. Paul, MN, USA, 1987; pp. 143–166. [Google Scholar]
  24. Araújo, J.C.; Santos, H.A.S.; Ribeiro, E.S.C.; Trindade, A.C.C.; Sousa, M.A.; Nunes, M.P.M.; Lima, A.C.S.; Daher, L.C.C.; Silva, A.G.M. Use of in vivo video image analysis as a substitute for manual biometric measurements on the prediction of qualitative and quantitative carcass characteristics of hair sheep lambs. Small Rumin. Res. 2022, 215, 106779. [Google Scholar] [CrossRef]
  25. Horgan, G.W.; Murphy, S.V.; Simm, G. Automatic assessment of sheep carcasses by image analysis. Anim. Sci. 1995, 60, 197–202. [Google Scholar] [CrossRef]
  26. Stanford, K.; Richmond, R.J.; Jones, S.D.M.; Robertson, W.M.; Price, M.A.; Gordon, A.J. Video image analysis for on-line classification of lamb carcasses. Anim. Sci. 1998, 67, 311–316. [Google Scholar] [CrossRef]
  27. Cunha, B.C.N.; Belk, K.E.; Scanga, J.A.; LeValley, S.B.; Tatum, J.D.; Smith, G.C. Development and validation of equations utilizing lamb vision system output to predict lamb carcass fabrication yields. J. Anim. Sci. 2004, 82, 2069–2076. [Google Scholar] [CrossRef]
  28. Brady, A.S.; Belk, K.E.; LeValley, S.B.; Dalsted, N.L.; Scanga, J.A.; Tatum, J.D.; Smith, G.C. An evaluation of the lamb vision system as a predictor of lamb carcass red meat yield percentage. J. Anim. Sci. 2003, 81, 1488–1498. [Google Scholar] [CrossRef] [PubMed]
  29. Hopkins, D.L.; Safari, E.; Thompson, J.M.; Smith, C.R. Video image analysis in the Australian meat industry—Precision and accuracy of predicting lean meat yield in lamb carcasses. Meat Sci. 2004, 67, 269–274. [Google Scholar] [CrossRef] [PubMed]
  30. Einarsson, E.; Eythorsdottir, E.; Smith, C.R.; Jonmundsson, J.V. The ability of video image analysis to predict lean meat yield and EUROP score of lamb carcasses. Animal 2014, 8, 1170–1177. [Google Scholar] [CrossRef] [PubMed]
  31. Rius-Vilarrasa, E.; Bünger, L.; Matthews, K.; Maltin, C.; Hinz, A.; Roehe, R. Evaluation of Video Image Analysis (VIA) technology to predict meat yield of sheep carcasses online under abattoir conditions. In Proceedings of the British Society of Animal Science, Southport, UK, 2–4 April 2007; p. 108. [Google Scholar]
  32. Viscarra Rossel, R.A.; McGlynn, R.N.; McBratney, A.B. Determining the composition of mineral-organic mixes using UV-vis-NIR diffuse reflectance spectroscopy. Geoderma 2006, 137, 70–82. [Google Scholar] [CrossRef]
Figure 1. Lateral side view of light lamb carcass showing areas (a), perimeters (b), lengths and angles (c), and widths (d) measurements. For a brief measurement description please see Table 1.
Animals 14 01593 g001
Figure 2. Dorsal side view of light lamb carcass showing areas (a), perimeters (b), lengths and angles (c), and widths (d) measurements. For a brief measurement description please see Table 1.
Animals 14 01593 g002
Table 1. Mean (standard deviation—sd), range, and coefficient of variation (CV) for cold carcass weight (CCW), weight and percentage of carcass tissues, and VIA measurements obtained in lateral and dorsal views (n = 55).
TraitsAbbreviationDescriptionMean (sd)RangeCV (%)
CCW (g) 4522 (1336)2162–762229.6
Carcass composition
Carcass tissues (g)MMuscle1169.5 (341.4)546.9–1945.629.2
SFSubcutaneous fat131.0 (76.8)11.8–359.458.6
IFIntermuscular fat236.4 (91.9)96.0–475.738.9
TFTotal fat367.4 (166.0)107.9–834.945.2
BBone447.8 (102.5)259.6–683.322.9
Carcass tissues (%)pMPercentage muscle61.1 (2.4)56.4–69.74.0
pSFPercentage subcutaneous fat6.1 (2.1)1.1–10.734.2
pIFPercentage intermuscular fat10.9 (1.7)5.9–13.915.2
pTFPercentage total fat17.0 (3.5)7.0–24.720.4
pBPercentage bone21.9 (2.1)17.4–26.09.7
Lateral view measurements
Length (cm)Ll1Leg length30.8 (3.4)23.0–38.011.0
Ll2Lateral thoracolumbar length39.2 (4.3)29.7–47.010.9
Ll3Length between the calcaneus and the greater tubercle of humerus72.7 (6.9)55.3–86.49.5
Ll4Forearm length26.9 (3.2)18.9–32.412.1
Width (cm)Lw1Thinnest leg width9.7 (1.1)7.2–12.011.6
Lw2Largest leg width10.3 (1.3)7.7–13.012.7
Lw3Minimum waist width9.4 (1.2)7.1–12.712.6
Lw4Maximum waist width13.2 (1.7)9.2–16.613.0
Lw5Maximum thoracic width17.1 (2.1)13.1–20.912.1
Lw6Widest part of the chest17.4 (2.0)13.1–22.711.5
Angle (θ)La1Lateral leg angle 1142.6 (5.7)129.8–153.94.0
La2Lateral leg angle 2160.5 (5.6)149.2–172.83.5
La3Lateral leg angle 3154.6 (9.5)136.0–178.96.1
Area (cm2)LA1Lateral leg area185.0 (42.8)107.7–271.623.1
LA2Loin area163.1 (39.8)97.8–270.624.4
LA3Forequarter area337.7 (67.5)204.2–471.320.0
LA4Lateral shoulder area140.3 (35.6)83.5–260.725.4
Perimeter (cm)LP1Lateral leg perimeter58.6 (7.1)44.0–70.712.2
LP2Loin perimeter50.8 (7.9)14.0–65.715.5
LP3Forequarter perimeter69.8 (10.4)15.3–83.214.9
LP4Lateral shoulder perimeter48.7 (8.2)11.4–67.516.8
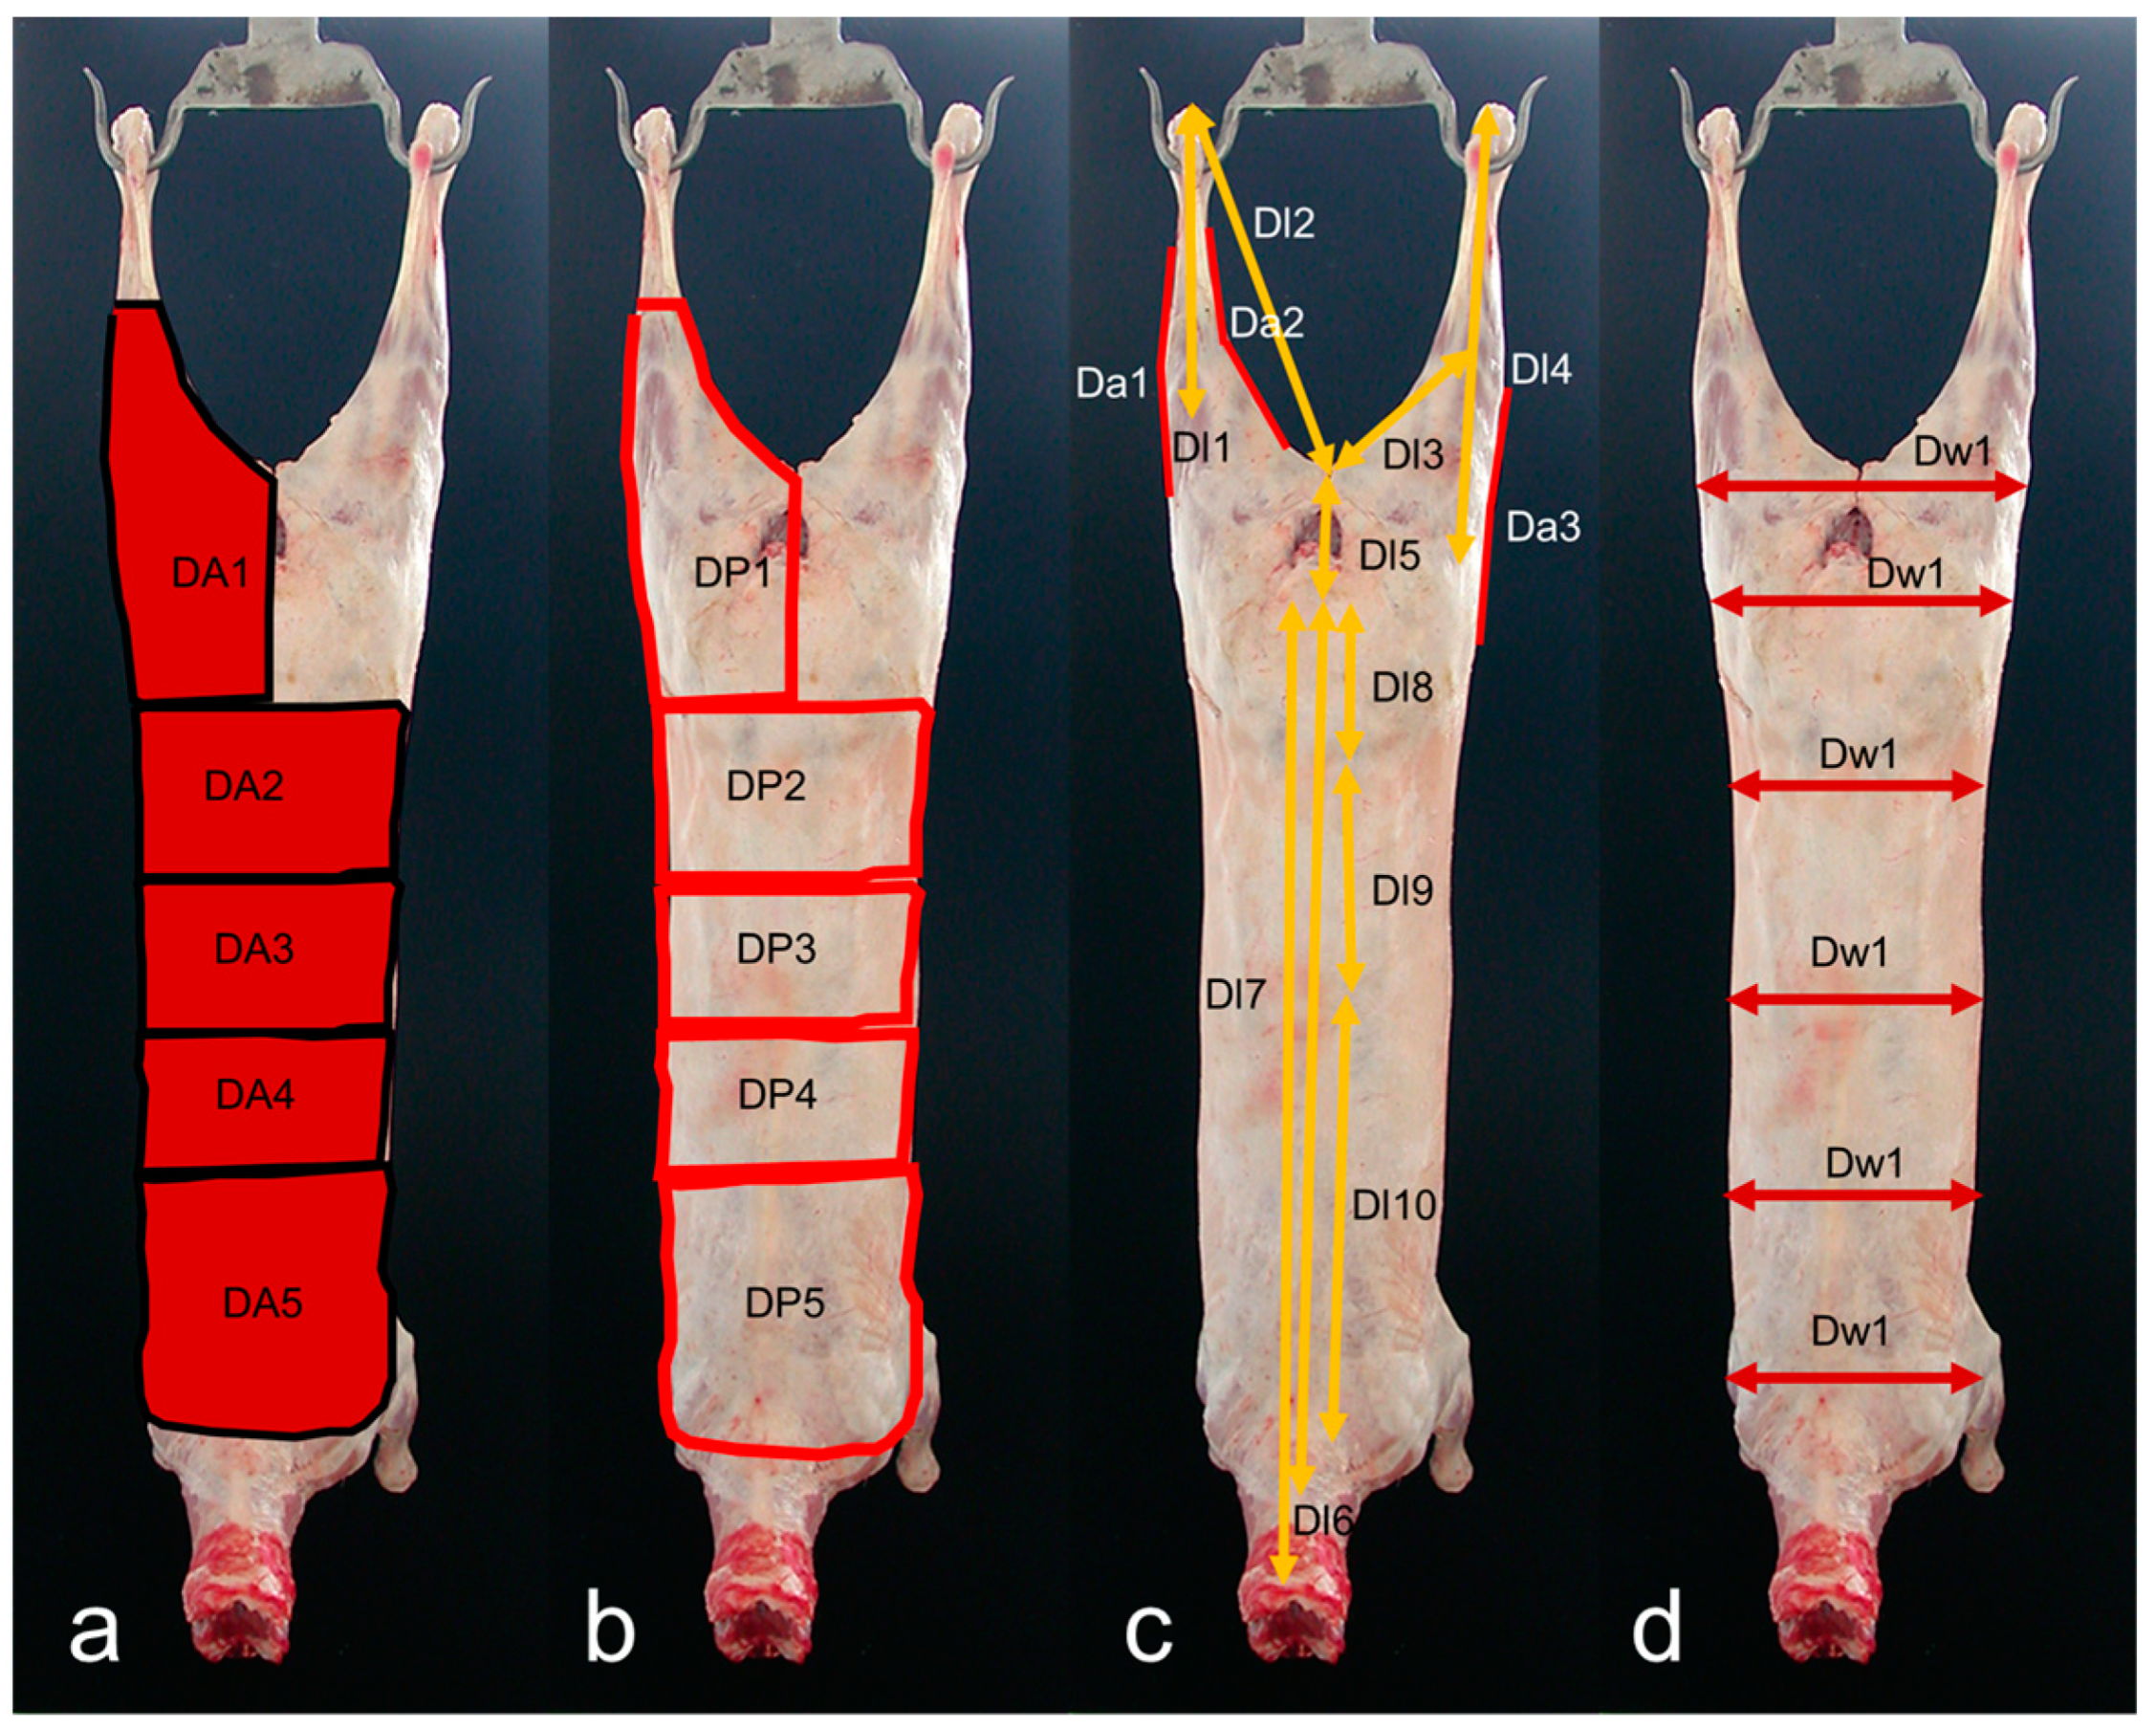
Dorsal view measurements -
Length (cm)Dl1Minimum leg length16.3 (3.8)8.6–27.023.3
Dl2Length between the perineum and the tarsometatarsal joint19.3 (2.6)11.4–25.013.4
Dl3Length between the perineum and the femorotibial joint6.4 (0.8)4.9–8.812.5
Dl4Maximum leg length24.5 (3.8)6.1–33.815.5
Dl5Length between the basis of tail and the perineum9.1 (1.8)6.0–14.320.0
Dl6Length between the basis of the neck and the basis of tail49.7 (4.8)41.2–61.49.6
Dl7Length between the basis of tail and the atlas62.0 (5.7)48.9–77.19.2
Dl8Sacrum length8.6 (1.3)5.9–11.914.7
Dl9Lumbar spine length18.9 (3.0)10.2–26.315.9
Dl10Thoracic spine length29.5 (4.2)19.9–38.914.1
Width (cm)Dw1Minimum leg width17.5 (1.5)14.2–21.88.4
Dw2Maximum leg width13.0 (1.4)10.4–17.410.9
Dw3Minimum saddle width9.7 (1.2)7.9–13.012.7
Dw4Maximum chest width10.6 (1.4)7.6–14.313.3
Dw5Minimum chest width9.8 (1.1)7.0–12.011.2
Dw6Maximum shoulder width10.9 (1.3)7.6–13.311.9
Angle (θ)Da1Dorsal leg angle 1164.1 (5.6)150.2–174.03.4
Da2Dorsal leg angle 2122.3 (4.0)113.7–130.73.3
Da3Dorsal leg angle 3167.7 (5.2)157.3–179.73.1
Area (cm2)DA1Dorsal leg area131.0 (23.5)89.8–203.018.0
DA2Lumbar area104.4 (26.8)55.7–199.825.7
DA3Thoracolumbar area105.1 (26.3)58.4–171.925.0
DA4Thoracic area101.9 (23.6)57.4–189.823.2
DA5Dorsal shoulder area136.8 (33.7)77.2–242.124.6
Perimeter (cm)DP1Dorsal leg perimeter55.9 (4.9)45.3–71.88.8
DP2Lumbar perimeter42.3 (5.2)31.9–60.212.3
DP3Thoracolumbar perimeter40.3 (4.9)29.8–53.112.2
DP4Thoracic perimeter40.1 (4.7)30.4–54.611.6
DP5Dorsal shoulder perimeter46.2 (5.7)35.6–62.112.3
Table 2. Equations and corresponding coefficient of determination (K-fold-R2), root mean square error (RMSE), and ratio of prediction to deviation (RPD) for prediction of the weight of carcass tissues in lamb carcasses for stepwise analysis with CCW (n = 55).
Tissue Dorsal + Lateral (Model 1)Dorsal(Model 2)Lateral(Model 3)
Muscle (g)Intercept−1570.57 −152.25 −73.05
Independent variables0.128CCW0.23CCW0.197CCW
−7.293Ll27.004DP31.891LA1
10.052Ll3
47.455Lw3
3.72La1
−6.278Dl2
4.775Dl11
46.776Dw3
4.715DP2
k-fold-R20.98 0.95 0.97
RMSE42.05 63.46 54.19
RPD8.12 5.38 6.3
IF (g)Intercept406.761 −205.125 347.615
Independent variables0.058CCW0.033CCW0.052CCW
−4.012Ll115.509Dl3−3.121La1
−2.93La11.47DA10.619LA2
0.679LA2
k-fold-R20.88 0.85 0.88
RMSE28.82 34.28 29.98
RPD3.19 2.68 3.07
SF (g)Intercept45.155 −239.455 8.721
Independent variables0.044CCW0.016CCW0.063CCW
−4.843Ll1−2.537Dl4−6.061Ll4
−2.392Ll414.036Dw3
−3.775Dl71.722DA1
11.523Dw3
1.699DA1
k-fold-R20.83 0.85 0.84
RMSE24.07 27.61 29.5
RPD3.19 2.78 2.6
TF (g)Intercept388.234 −46.719 614.243
Independent variables0.073CCW0.034CCW0.117CCW
−12.861Ll124.227Dl3−9.676Ll1
−3.456La1−5Dl4−4.361La1
0.799LA24.786Dl100.885LA2
0.363LA327.359Dw3
2.171DA1−3.693Da1
3.275DA1
k-fold-R20.91 0.89 0.88
RMSE45.81 49.72 50.42
RPD3.62 3.34 3.29
Bone (g)Intercept−244.683 −271.71 −58.374
Independent variables0.04CCW0.039CCW0.055CCW
22.367Lw15.022Dl726.264Lw1
−16.285Dl3−20.496Dw4
3.612Dl624.96Dw5
−17.319Dw45.14DP3
19.553Dw5
5.189DP3
k-fold-R20.95 0.91 0.92
RMSE21.76 28.2 27.63
RPD4.71 3.63 3.71
CCW = Cold carcass weight; IF = intermuscular fat; SF = subcutaneous fat; TF = total fat; Ll2 = thoracolumbar length; Ll3 = length between the calcaneus and the greater tubercle of humerus; Lw3 = minimum waist width; La1 = lateral leg angle; Dl2 = length between the perineum and the tarsometatarsal joint; Dl11 = thoracic spine length; Dw3 = minimum saddle width; DP2 = lumbar perimeter; DP3 = thoracolumbar perimeter; LA1 = lateral leg area; Ll1 leg length: LA2 = loin area; Ll4 = forearm length; Dl7 = cervical spine length; DA1 = dorsal leg area; Dl3 = length between the perineum and the femorotibial joint; Dl4 = maximum leg length; LA3 = forequarter area; Dl10 = thoracic spine length; Da1 = dorsal leg angle 1; Lw1 = thinnest leg width; Dl6 = length between the basis of the neck and the basis of tail; Dw4 = maximum chest width; Dw5 = minimum chest width.
Table 3. Equations and corresponding coefficient of determination (K-fold-R2), root mean square error (RMSE), and ratio of prediction to deviation (RPD) for prediction of the weight of carcass tissues in lamb carcasses for stepwise analysis without CCW (n = 55).
Tissue Dorsal + Lateral (Model 1)Dorsal (Model 2)Lateral (Model 3)
MuscleIntercept−1259.646 −1281.543 −828.65
Independent variables10.524DA218.335Dl766.034Lw6
7.022Dw370.866Dw34.598LA1
6.932LA15.99DA2
2.049Ll4
1.417Dl2
1.083Dl11
K-fold-R20.98 0.94 0.88
RMSE56.642 84.222 122.901
RPD6.03 4.05 2.78
IFIntercept−164.563 −455.011 97.734
Independent variables−2.22La116.103Dl35.573Ll2
0.542LA24.975Dl716.602Lw6
4.236Dl72.139DA1−3.683La1
9.573Dw1 0.964LA2
1.522DA1
K-fold-R20.89 0.86 0.82
RMSE31.416 35.577 40.7
RPD2.93 2.58 2.26
SFIntercept−32.639 55.649 113.112
Independent variables10.248DA111.553DA1−6.682Ll1
5.954Dw35.898Dw31.531LA1
5.123Ll13.438Da10.578LA2
4.052Da12.451Dl40.716LA3
2.455Lw31.935Dl9−6.75LP1
2.338Dl71.487Da3
1.843DP5
1.501LP3
1.479Dl9
K-fold-R20.94 0.91 0.74
RMSE20.598 23.978 41.358
RPD3.73 3.2 1.86
TFIntercept−134.537 −839.286 41.391
Independent variables−10.169Ll112.691DA1−12.034Ll1
1.926LP33.805Dw311.758Ll2
−4.516Dl42.336Da144.735Lw6
24.446Dw11.81Dl4−5.603La1
30.785Dw51.674Dl91.582LA2
−3.988Da1
5.482DA1
K-fold-R20.92 0.91 0.80
RMSE49.017 52.401 77.904
RPD3.39 3.17 2.13
BoneIntercept−24.68 −351.21 −250.958
Independent variables5.905Dl75.244Dl76.53Ll2
4.241Ll22.668DP320.198Lw1
2.272DP32.213Dw50.906LA1
2.159Da22.1Dl120.486LA2
1.804LA11.523Dw4
1.634Dl2
K-fold-R20.94 0.92 0.89
RMSE25.864 30.175 34.997
RPD3.96 3.40 2.93
CCW = cold carcass weight; IF = intermuscular fat; SF = subcutaneous fat; TF = total fat; DA2 = lumbar area; Dw3 = minimum saddle width; LA1 = lateral leg area; Ll4 = forearm length; Dl2 = length between the perineum and the tarsometatarsal joint; Dl11 = thoracic spine length; Dl7 = cervical spine length; Lw6 = widest part of the chest; La1 = lateral leg angle 1; LA2 = loin area; Dw1 = minimum leg width; DA1 = dorsal leg area; Ll1 leg length: Dl3 = length between the perineum and the femorotibial joint; Ll2 = thoracolumbar length; Da1 = dorsal leg angle 1; Dl4 = maximum leg length; LA3 = forequarter area; Lw3 = minimum waist width; Dl9 = lumbar spine length; LP1 = lateral leg perimeter; Da3 = dorsal leg angle 3; DP5 = dorsal shoulder perimeter; LP3 = forequarter perimeter; Dw5 = minimum chest width; DP3 = thoracolumbar perimeter; Da2 = dorsal leg angle 2; Lw1 = thinnest leg width; Dl12 = cervical spine length; Dw4 = maximum chest width.
Table 4. Equations and corresponding coefficient of determination (K-fold-R2), root mean square error (RMSE), and ratio of prediction to deviation (RPD) for prediction of the percentage of carcass tissues in lamb carcasses for stepwise analysis with CCW (n = 55).
Tissue Dorsal + Lateral (Model 1)Dorsal (Model 2)Lateral (Model 3)
Muscle (%)Intercept38.948 59.928 37.757
Independent variables0.594Ll10.214Dl40.594Ll1
−0.385Ll2−0.179Dl10−0.385Ll2
0.171La10.733Dw60.171La1
−0.026LA2−0.051DA1−0.026LA2
k-fold-R20.46 0.16 0.41
RMSE1.77 2.177 1.776
RPD1.36 1.1 1.35
IF (%)Intercept11.671 3.621 23.099
Independent variables−0.222Ll10.896Dl30.001CCW
0.216Ll2−0.129Dl4−0.231Ll1
−0.09La10.161Dl100.165Ll2
−0.033LA1 −0.097La1
0.024LA2 −0.032LA1
0.203Dl7 0.022LA2
k-fold-R20.50 0.23 0.51
RMSE1.089 1.385 1.07
RPD1.56 1.23 1.50
SF (%)Intercept10.3 −1.698 8.06
Independent variables−0.328Ll1−0.178Dl40.002CCW
−0.126Dl40.524DW3−0.308Ll1
−0.239Dl50.053DA1
0.737DW3
−0.11Da1
0.078DA1
−0.084DA4
0.403DP4
0.092DP5
k-fold-R20.78 0.59 0.56
RMSE0.841 1.271 1.329
RPD2.5 1.65 1.64
TF (%)Intercept51.799 −18.547 34.396
Independent variables−0.496Ll1−0.329Dl40.003CCW
−0.104La10.242Dl10−0.552Ll1
−0.26Dl40.186Da20.925Lw6
−0.317Dl50.105DA1−0.144La1
0.218Dl9 −0.051LA1
1.188Dw3
−0.168Da1
0.126DA1
k-fold-R20.63 0.49 0.58
RMSE1.827 2.264 2.073
RPD1.92 1.55 1.61
Bone (%)Intercept44.53 32.965 23.029
Independent variables0.001CCW0.119Dl4−0.002CCW
0.271Ll2−0.244DW30.161Ll2
−0.011LA3−0.454Dw6
0.127Dl4−0.051DA1
−0.358Dw1
−0.612Dw6
−0.107Da2
−0.043DA1
k-fold-R20.72 0.64 0.62
RMSE0.996 1.210 1.288
RPD2.11 1.74 1.71
CCW = cold carcass weight; IF = intermuscular fat; SF = subcutaneous fat; TF = total fat; Ll1 = leg length: Ll2 = thoracolumbar length; Dl4 = maximum leg length; La1 = lateral leg angle 1; Dw6 = maximum shoulder width; Dl10 = Y; DA1 = leg area; Dl9 = lumbar spine length; LA2 = loin area; LA1 = lateral leg area; Dw3 = minimum saddle width; Dl5 = length between the basis of tail and the perineum; LA3 = forequarter area; Da1 = dorsal leg angle 1; Dl3 = length between the perineum and the femorotibial joint; DA4 = thoracic area; DP4 = thoracic perimeter; DP5 = dorsal shoulder perimeter; Da2 = dorsal leg angle 2; Lw6 = widest part of the chest; Dw1 = minimum leg width.
Disclaimer/Publisher’s Note: The statements, opinions and data contained in all publications are solely those of the individual author(s) and contributor(s) and not of MDPI and/or the editor(s). MDPI and/or the editor(s) disclaim responsibility for any injury to people or property resulting from any ideas, methods, instructions or products referred to in the content.

