Article

Complete Mitochondrial Genomes of Nannostomus Pencilfish: Genome Characterization and Phylogenetic Analysis

1
The Co-Innovation Center for Sustainable Forestry in Southern China, College of Life Sciences, Nanjing Forestry University, Nanjing 210037, China
2
College of Animal Science and Technology, Zhejiang Agriculture and Forestry University, Hangzhou 311300, China
*
Author to whom correspondence should be addressed.
These authors contributed equally to this work.
Animals 2024, 14(11), 1598; https://doi.org/10.3390/ani14111598
Submission received: 28 April 2024 / Revised: 20 May 2024 / Accepted: 27 May 2024 / Published: 29 May 2024

Abstract

:

Simple Summary

To complement the genetic information of the pencilfish, a popular aquarium ornamental fish, we sequenced the mitochondrial genomes of four common pencilfish species. Their genome structure, nucleotide composition, codon usage, and phylogeny were comparatively analyzed. The results indicate that the four mitogenomes exhibited a typical circular structure. The gene order of the four Nannostomus pencilfish was similar to that of other fish. Our phylogenetic analyses support the current classification of the family Lebiasinidae. This study provides new data for the breeding and study of pencilfish.

Abstract

Although the pencilfish is a globally popular economic fish in the aquarium market, its taxonomic classification could be further refined. In order to understand the taxonomy of species of the genus Nannostomus (Characiformes, Lebiasinidae) and their phylogenetic position within the order Characiformes, in this study, we characterized mitochondrial genomes (mitogenomes) from four Nannostomus species for the first time. The four mitogenomes exhibited the typical circular structure, with overall sizes varying from 16,661 bp to 16,690 bp. They contained 13 protein-coding genes (PCGs), 2 ribosomal RNA genes (rRNAs), 22 transfer RNA genes (tRNAs), and 1 control region (CR). Nucleotide composition analysis suggested that the mitochondrial sequences were biased toward A and T. Bayesian inference and maximum likelihood analyses based on PCGs support the family Lebiasinidae classification, described using four Nannostomus species, clustering together with Lebiasina multimaculata from the same family. The results of this study support the current taxonomic classification of the family Lebiasinidae. Phylogenetic analysis also suggested that gene rearrangement would not significantly impact the phylogenetic relationships within the order Characiformes. These results might provide new data regarding the phylogeny and classification of the order Characiformes, thus providing a theoretical basis for the economic development of aquarium fish markets.

1. Introduction

The family Lebiasinidae, which belongs to the order Characiformes, consists of over 70 valid species of small freshwater fish that are widely distributed across South and Central America, spanning from Costa Rica to Argentina [1]. Lebiasinidae is divided into two subfamilies, Lebiasininae (which includes the genera Derhamia, Lebiasina, and Piabucina) and Pyrrhulininae (which includes the genera Copeina, Copella, Nannostomus, and Pyrrhulina) [2]. The latter represents the most diverse clade, and the genus Nannostomus is the most species-rich genus in the subfamily [2]. Most species in Nannostomus are slender and pencil-shaped, with lengths ranging from 1.5 cm to 7 cm, and are highly popular in the aquarium market under the popular name “pencilfish” [1,3,4]. The global aquarium trade has up to 5300 freshwater fish species available for sale each year, with about 1 billion individuals [5]; of these, species in the order Characiformes account for a certain share [1,4]. Despite its economic importance, there have been incomprehensive reports about its basic biological data, including genetic information [3,6]. Given the wide variety of species, diverse body colors, and limited gene sequence databases, understanding the taxonomy of species in the genus Nannostomus poses a significant challenge [2]; the phylogenetic position of family Lebiasinidae within the order Characiformes could be further refined [7]. The phylogenetic position of Lebiasinidae within the order Characiformes has been a topic of frequent discussion [8,9].
In the realm of animals, the mitochondrial genome (mitogenome) is a small, circular genome, ranging in size from 15 to 18 kb [10,11]. It generally contains 13 protein-coding genes (PCGs), 22 transport RNA (tRNA) genes, 2 ribosomal RNA (rRNA) genes, and 1 control region (CR) [12,13]. The 13 PCGs are NADH dehydrogenase subunit 1 (ND1), NADH dehydrogenase subunit 2 (ND2), Cytochrome c oxidase subunit I (COX1), Cytochrome c oxidase subunit II (COX2), ATP synthase F0 subunit 8 (ATP8), ATP synthase F0 subunit 6 (ATP6), Cytochrome c oxidase subunit III (COX3), NADH dehydrogenase subunit 3 (ND3), NADH dehydrogenase subunit 4L (ND4L), NADH dehydrogenase subunit 4 (ND4), NADH dehydrogenase subunit 5 (ND5), NADH dehydrogenase subunit 6 (ND6), and Cytochrome b (Cytb) (arranged in the common order in the mitogenome of the order Characiformes) [12,13]. The utilization of mitogenomes in molecular identification and phylogenetic analysis is prevalent due to their rapid evolution rate, simple structure, low molecular weight, and maternal inheritance [14,15]. Certain mitochondrial gene fragments, namely 16S rRNA, COX1, and Cytb, have been extensively employed in phylogenetic analyses [16,17]. However, the utilization of partial mitochondrial sequences is constrained by their limited capacity to provide comprehensive information [11]. On the other hand, the complete mitogenome offers a higher level of resolution and sensitivity, making it more suitable for the examination of phylogenetic relationships and species classification [18,19].
With the application of next-generation sequencing technology, there has been a growing number of mitogenomes sequenced in recent years [20]. However, only a limited number of complete mitogenomes are available in the family Lebiasinidae [3,6], and no complete mitogenome is available in the genus Nannostomus. In this study, we present the complete mitogenomes of four Nannostomus species, namely Nannostomus beckfordi, Nannostomus marilynae, Nannostomus marginatus, and Nannostomus unifasciatus. Specifically, the mitochondrial characteristics of these four species, including their gene order, genome size, nucleotide composition, codon usage, and tRNA secondary structure, are comparatively analyzed with other species within the order Characiformes. This study provides new data regarding the phylogeny and classification of Nannostomus pencilfish and the order Characiformes, thus providing a theoretical basis for the economic development of aquarium fish markets.

2. Materials and Methods

2.1. Sample Collection and DNA Extraction

All fish specimens were procured from an aquarium market located in Tianjin, China. Samples of these four fish were identified through morphological and molecular identification, utilizing the resources provided by the WorldFish Center’s FishBase database (https://www.worldfishcenter.org/fishbase, accessed on 11 October 2023) [21] and NCBI (https://www.ncbi.nlm.nih.gov/, accessed on 11 October 2023) [3,8]. The sample used for morphological identification was fresh. In addition, the fish purchased was a normal shape with a complete body. Total DNA was extracted from each fin using the FastPure Cell/Tissue DNA Isolation Mini Kit (Vazyme™, Nanjing, China) and stored in a refrigerator at −20 °C for follow-up.

2.2. Mitogenome Sequencing and Assembly

Library construction and sequencing were carried out by Shanghai Personal Biotechnology Co., Ltd. (Shanghai, China) on the NovaSeq X Plus platform (Illumina, CA, USA) following the manufacture’s protocol for 150 bp paired-end reads. The depth of the sequencing was 3×. To generate clean data, low-quality sequences were removed. Clean reads were utilized in the assembly of the complete mitogenomes, using Geneious Prime 2023 using Lebiasina multimaculata (AP006766.1) as a template, and both ends of the final assembly were manually examined for any potential overlap in order to construct the circular mitogenomes. The medium sensitivity/speed option was used for the assembly. Consensus sequences were generated with a 50% base call threshold, obtaining the complete mitogenomes.

2.3. Sequence Analysis

Conservative domains of the mitogenomes were identified using two tools: BLAST CD-Search (https://www.ncbi.nlm.nih.gov/Structure/cdd/wrpsb.cgi, accessed on 26 November 2023.) and MITOS server (http://mitos.bioinf.uni-leipzig.de/index.py, accessed on 26 November 2023.). Gene maps of the mitogenomes were generated utilizing the CG View server (http://cgview.ca/, accessed on 28 November 2023). The formulas “AT-skew = (A − T)/(A + T)” and “GC-skew = (G − C)/(G + C)” were used to measure nucleotide bias [22]. A heatmap was plotted using heatmap tools in the genescloud platform (https://www.genescloud.cn, accessed on 30 November 2023). The tool was developed from the pheatmap package (V1.0.8), which was slightly modified to improve the layout style [23]. The data were normalized using z-scores. The analysis of relative synonymous codon usage (RSCU), as well as non-synonymous (Ka) and synonymous substitutions (Ks), was conducted using MEGA X software [24]. For RSCU analysis, coding regions were concatenated. tRNA genes were identified using the tRNAscan-SE Search Server (http://lowelab.ucsc.edu/tRNAscan-SE/, accessed on 30 November 2023 [25].

2.4. Phylogenetic Analysis

We constructed a concatenated dataset, consisting of the base sequences of the 13 PCGs from a total of 49 species. This dataset was utilized to investigate the phylogenetic relationships within the order Characiformes. Details of the species included in the analysis can be found in Table 1. Cyprinus carpio was employed as an outgroup in this study. All operations were performed in PhyloSuite software package v1.2.3 [26]. The alignment of the datasets was performed in batches using MAFFT v7.505 software [27]. MACSE was used to optimize alignments using the classic “Needleman–Wunsch” algorithm [28]. ModelFinder was used to partition the codons and determine the best-fit model for the phylogenetic analyses [29]. Unlike the Akaike Information Criterion (AIC), the Bayesian Information Criterion (BIC) considers the number of samples. When the number of samples is too large, the BIC can effectively prevent the excessive model complexity caused by excessive model precision [30]. The results of the best-fit model are as follows:
Best-fit model of BI according to BIC:
GTR + F + I + G4: ATP6, GTR + F + I + G4: ATP8 + COX2 + ND4L, GTR + F + I + G4: COX1, GTR + F + I + G4: COX3 + ND1, GTR + F + I + G4: Cytb, GTR + F + I + G4: ND2, GTR + F + I + G4: ND3 + ND4 + ND5, GTR + F + I + G4: ND6.
Best-fit model of ML according to BIC:
TIM2 + F + I + G4: ATP6, TIM2 + F + I + I + R4: ATP8 + COX2 + ND4L, TIM2 + F + I + I + R4: COX1, TIM2 + F + I + I + R4: COX3 + ND1, TIM2 + F + R5: Cytb, TIM2 + F + I + I + R4: ND2, GTR + F + I + I + R4: ND3 + ND4 + ND5, TPM2u + F + R4: ND6.
Phylogenetic trees were constructed using Bayesian inference (BI) and maximum likelihood (ML) methods [31,32]. The BI tree was reconstructed using MrBayes 3.2.6 with four Markov chains (three hot chains and one cold chain). Markov chains were run for 1,000,000 generations and were sampled every 100 generations. The consensus trees based on majority rule were assessed by combining the outcomes of duplicated analyses while discarding the first 25% of generations. The ML tree was reconstructed using IQ-TREE with 1000 bootstrap replicates. Phylogenetic trees were visualized and edited using iTOL (https://itol.embl.de/, accessed on 30 November 2023) [33].

3. Results

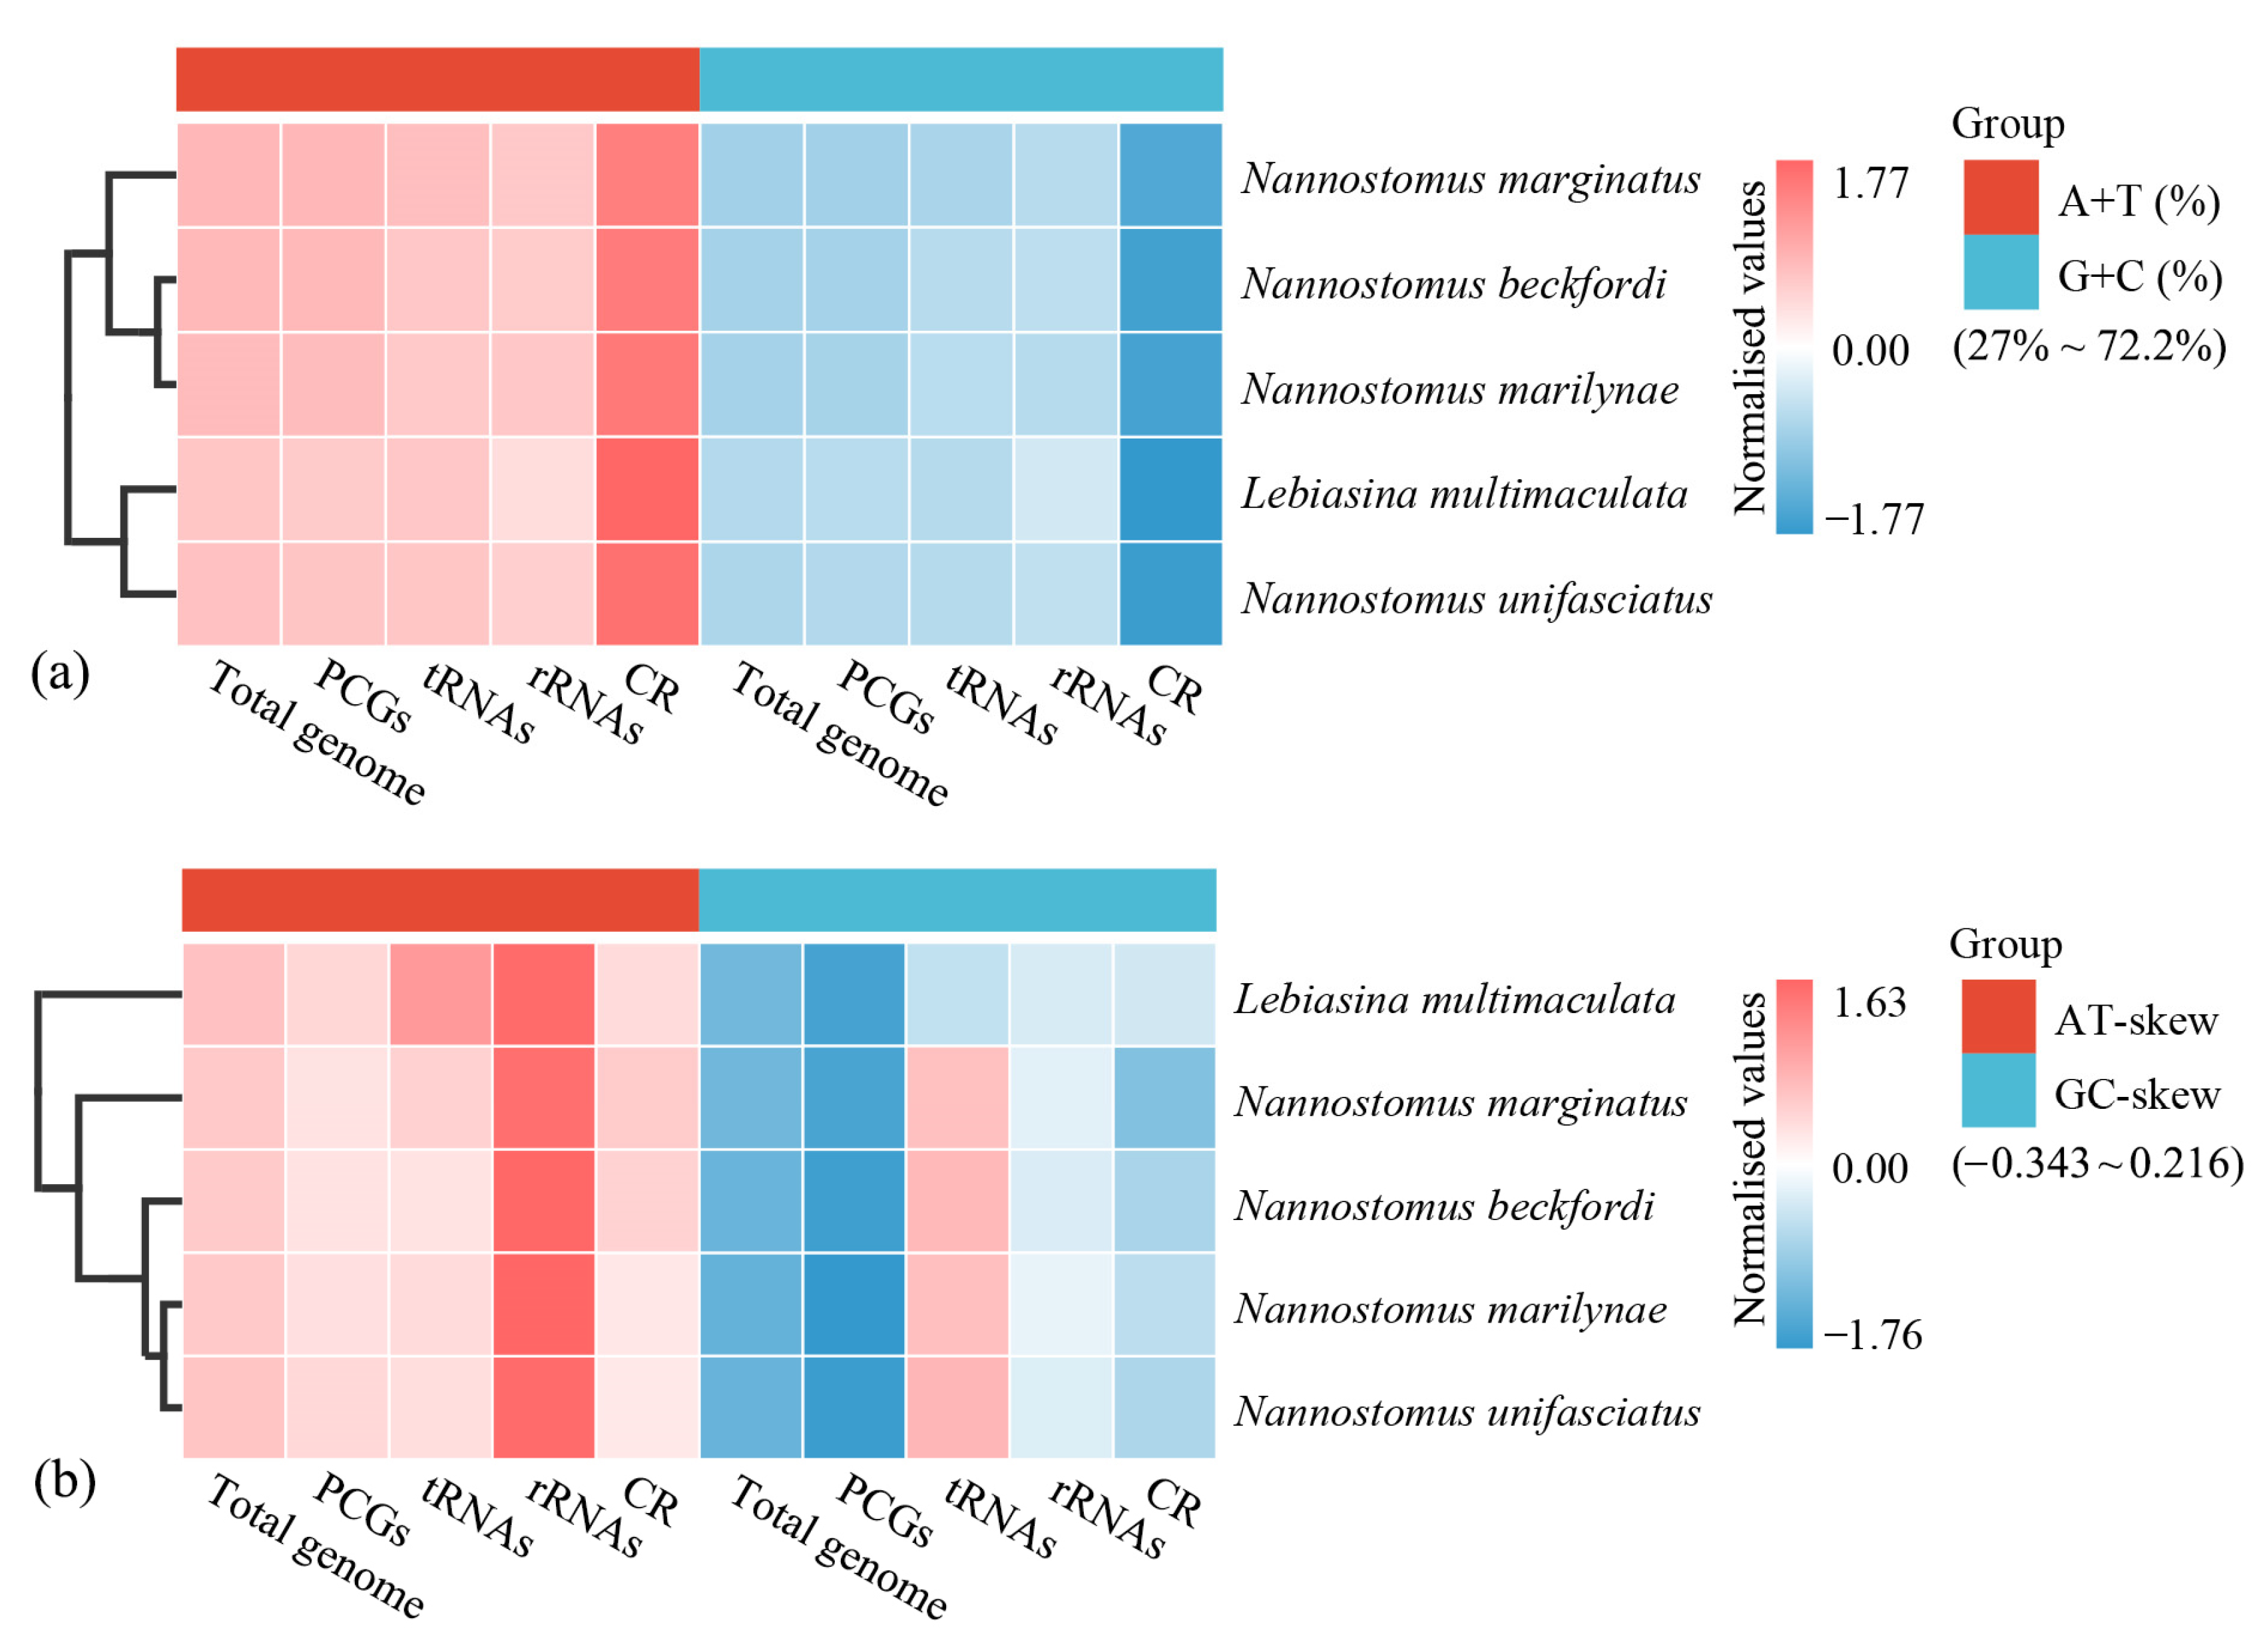
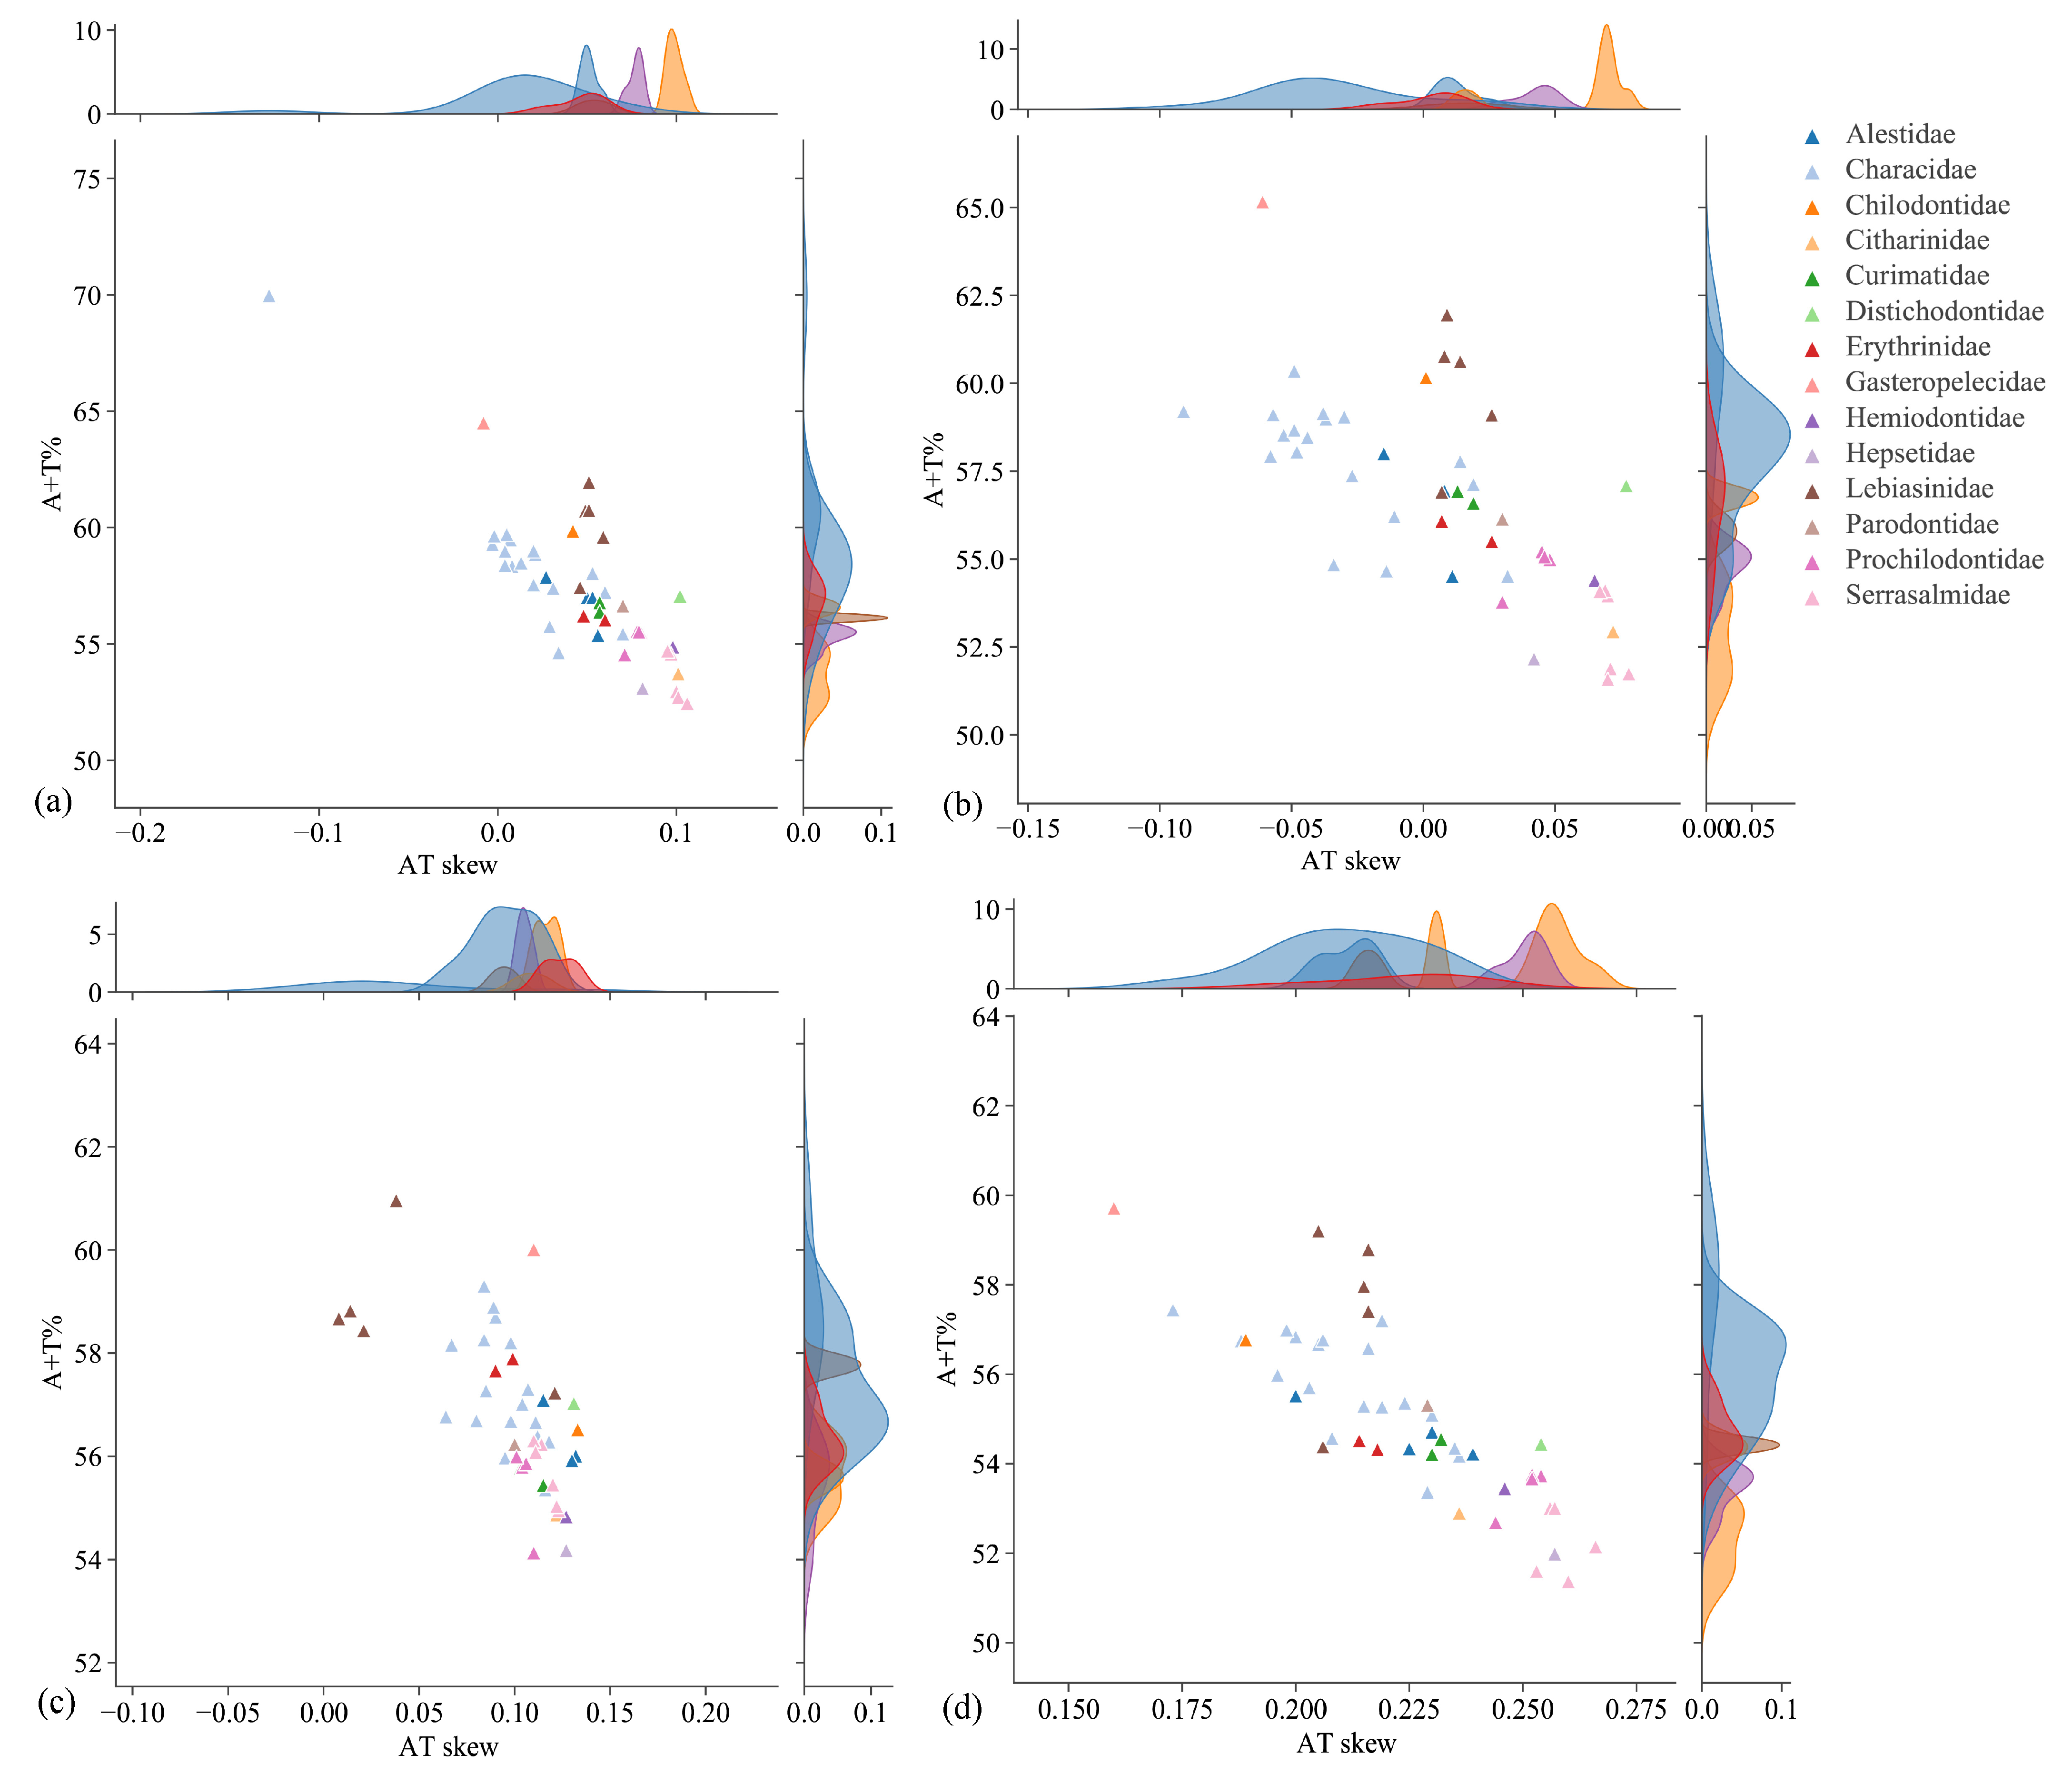
3.1. Genome Organization and Composition

The four complete mitogenomes were classically circular, double-stranded molecules, with sizes of 16,690 bp, 16,667 bp, 16,661 bp, and 16,681 bp (Figure 1). Among these species, N. marginatus had the smallest mitogenome, while N. beckfordi had the largest. The mitogenomes of the four fish contained 13 PCGs, 22 tRNAs, 2 rRNAs, and 1 noncoding CR. Nine genes, including eight tRNAs and ND6, were encoded on the minor strand, while the remaining genes were located on the major strand (Table 2).
The nucleotide composition analysis suggested that four mitogenomes were biased toward A and T (Figure 2a). In addition, this AT bias (A+T > G+C) was also evident in PCGs, RNAs, and CRs. CRs exhibited the highest A+T content, while PCGs, tRNAs, and rRNAs displayed an A+T content similar to that of the total mitogenomes (Figure 2a). The results of the skewness analysis indicated that the AT skews of four mitogenomes were all positive, while the GC skews were predominantly negative (Figure 2b). Differing from L. multimaculata in the same family, the GC skews of tRNAs in Nannostomus were all positive. To determine the nucleotide composition of the order Characiformes, the A+T content and AT skew of 48 mitogenomes (including 14 families: Alestidae, Characidae, Chilodontidae, Citharinidae, Curimatidae, Distichodontidae, Erythrinidae, Gasteropelecidae, Hemiodontidae, Hepsetidae, Lebiasinidae, Parodontidae, Prochilodontidae, and Serrasalmidae) were calculated (Table 1 and Figure 3). The 48 Characiformes mitogenomes had a comparable nucleotide composition; the A+T content was always higher than the G+C content in the total genome (52.45~69.97%), PCGs (51.58~65.16%), tRNAs (54.13~60.96%), and rRNAs (51.37~59.71%). The AT skews were almost positive, indicating a higher occurrence of A than T.
Multiple overlaps between adjacent genes were detected (Table 2). Eight gene overlaps were observed in N. beckfordi and N. unifasciatus, nine in N. marginatus, and ten in N. marilynae, all ranging from 1 to 10 bp. The largest overlaps among the four mitogenomes were all located between ATP8 and ATP6.

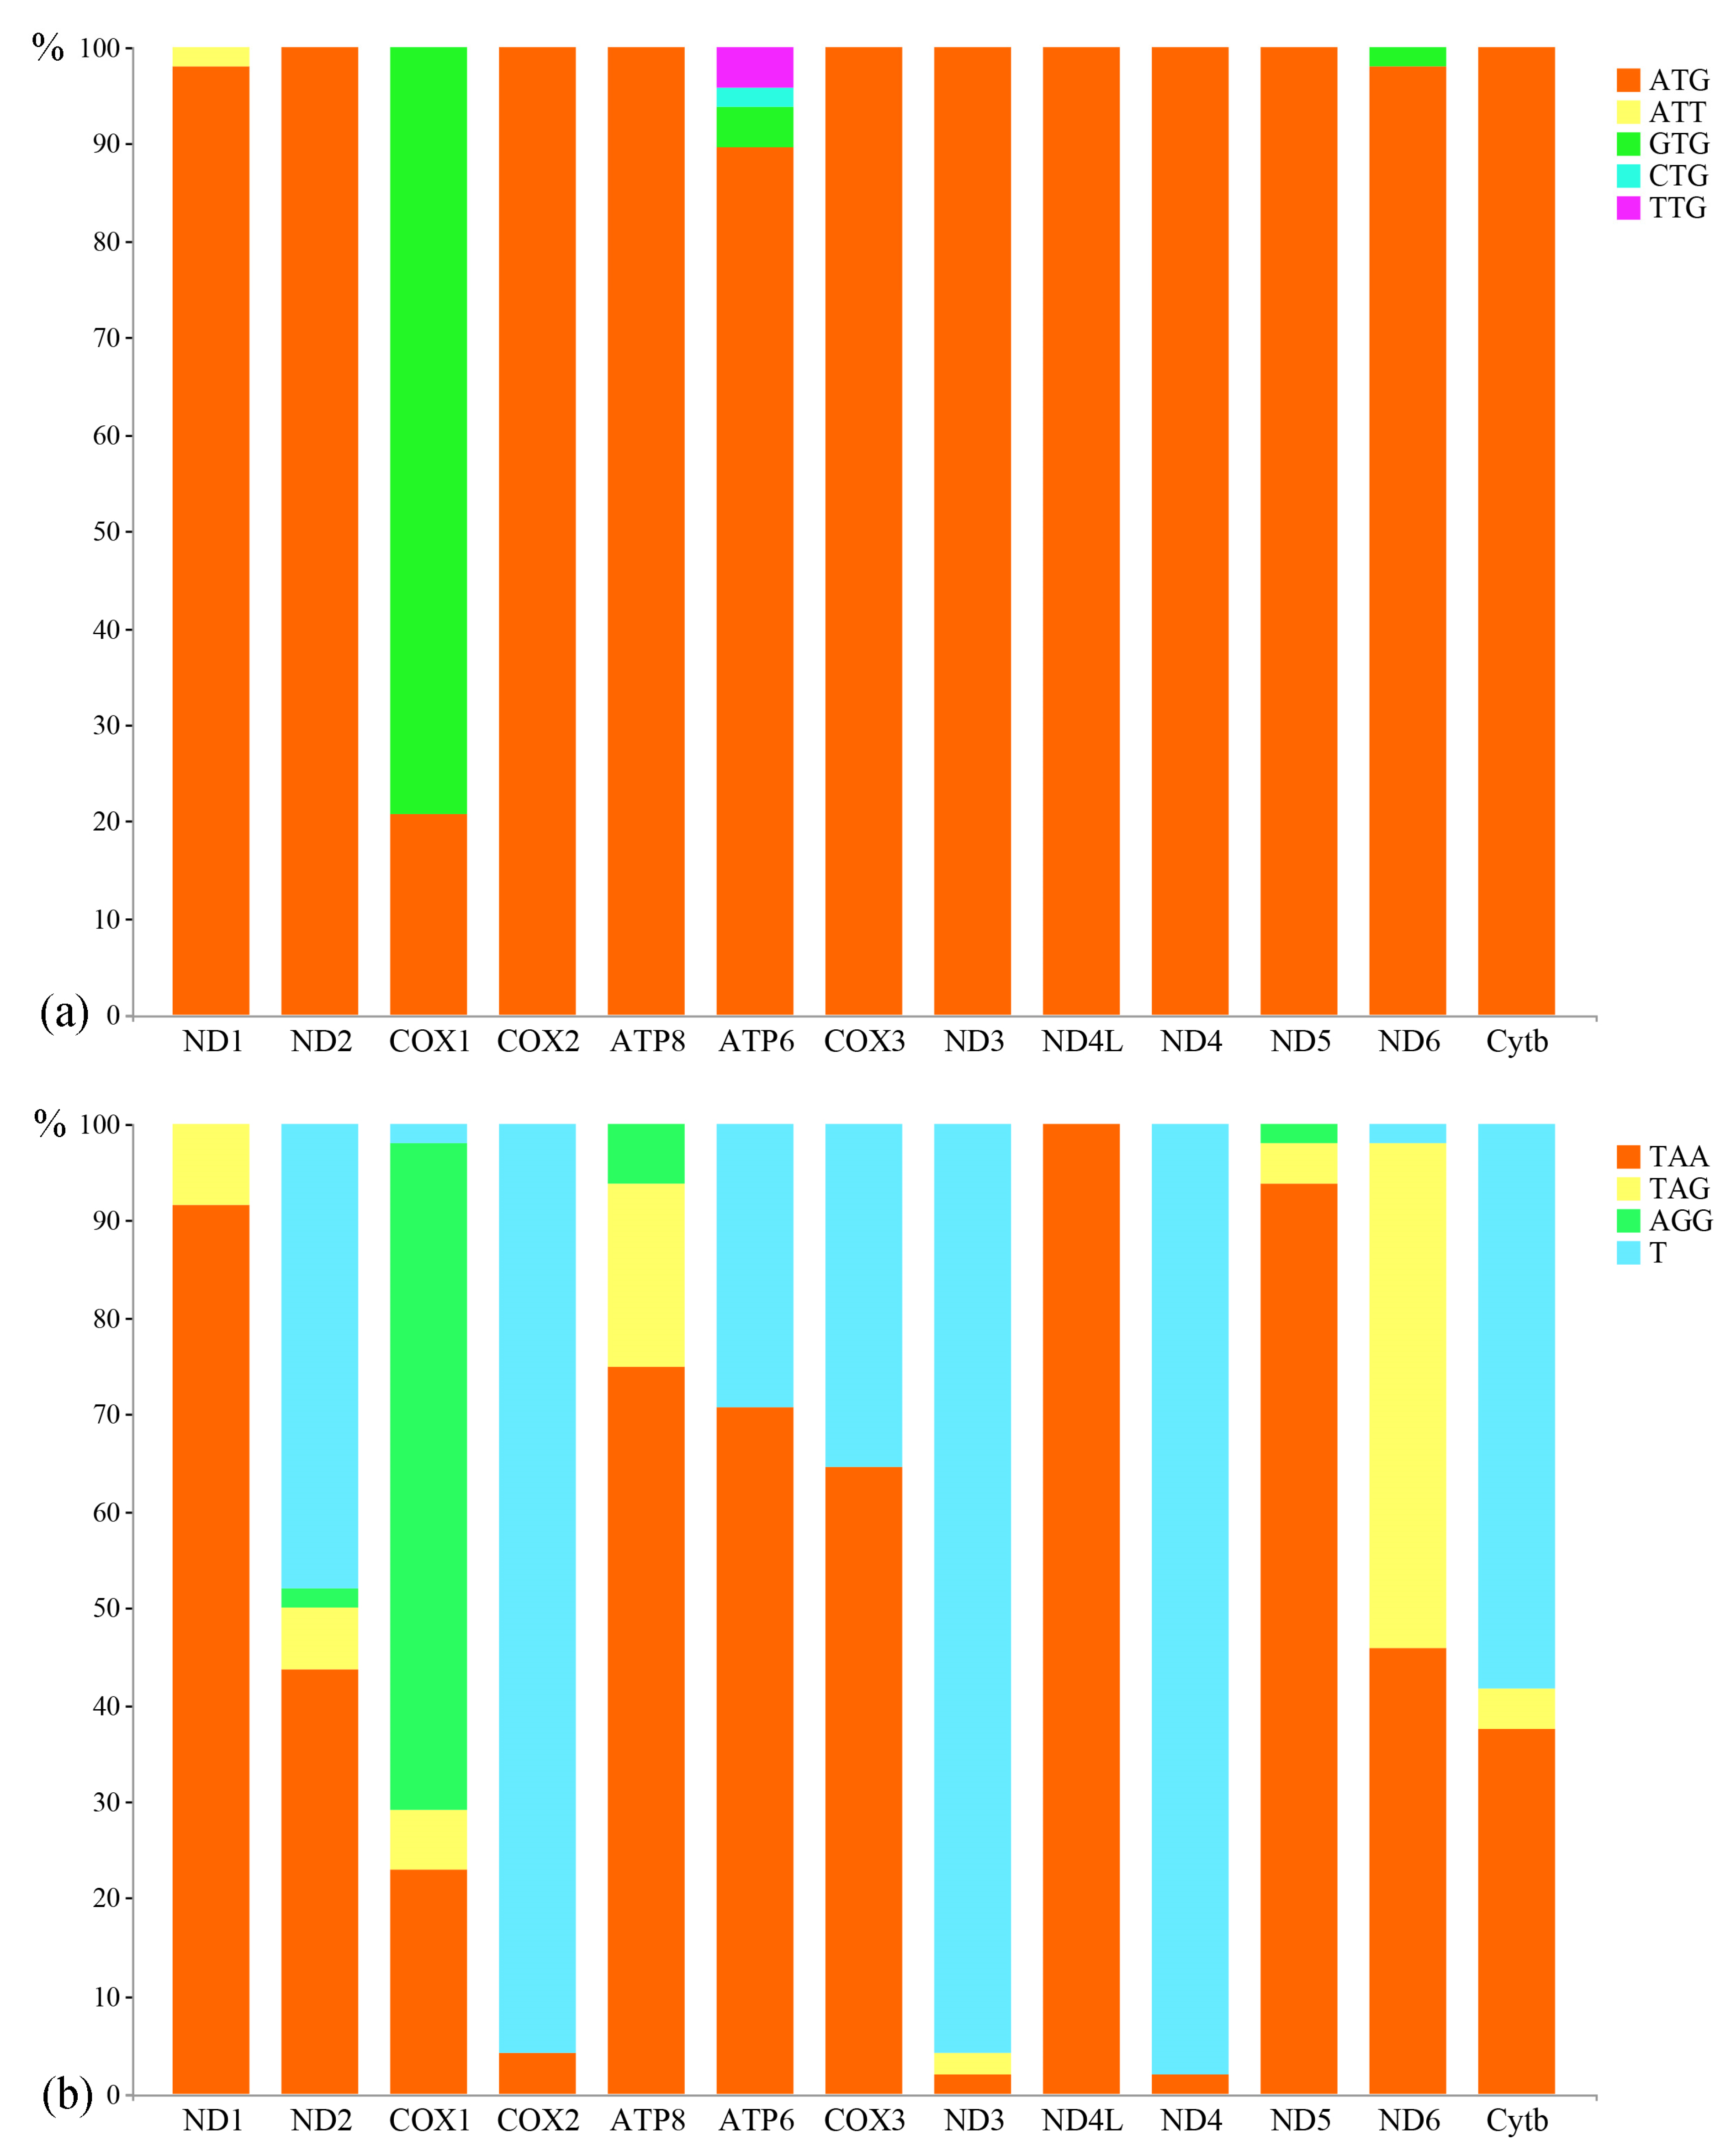
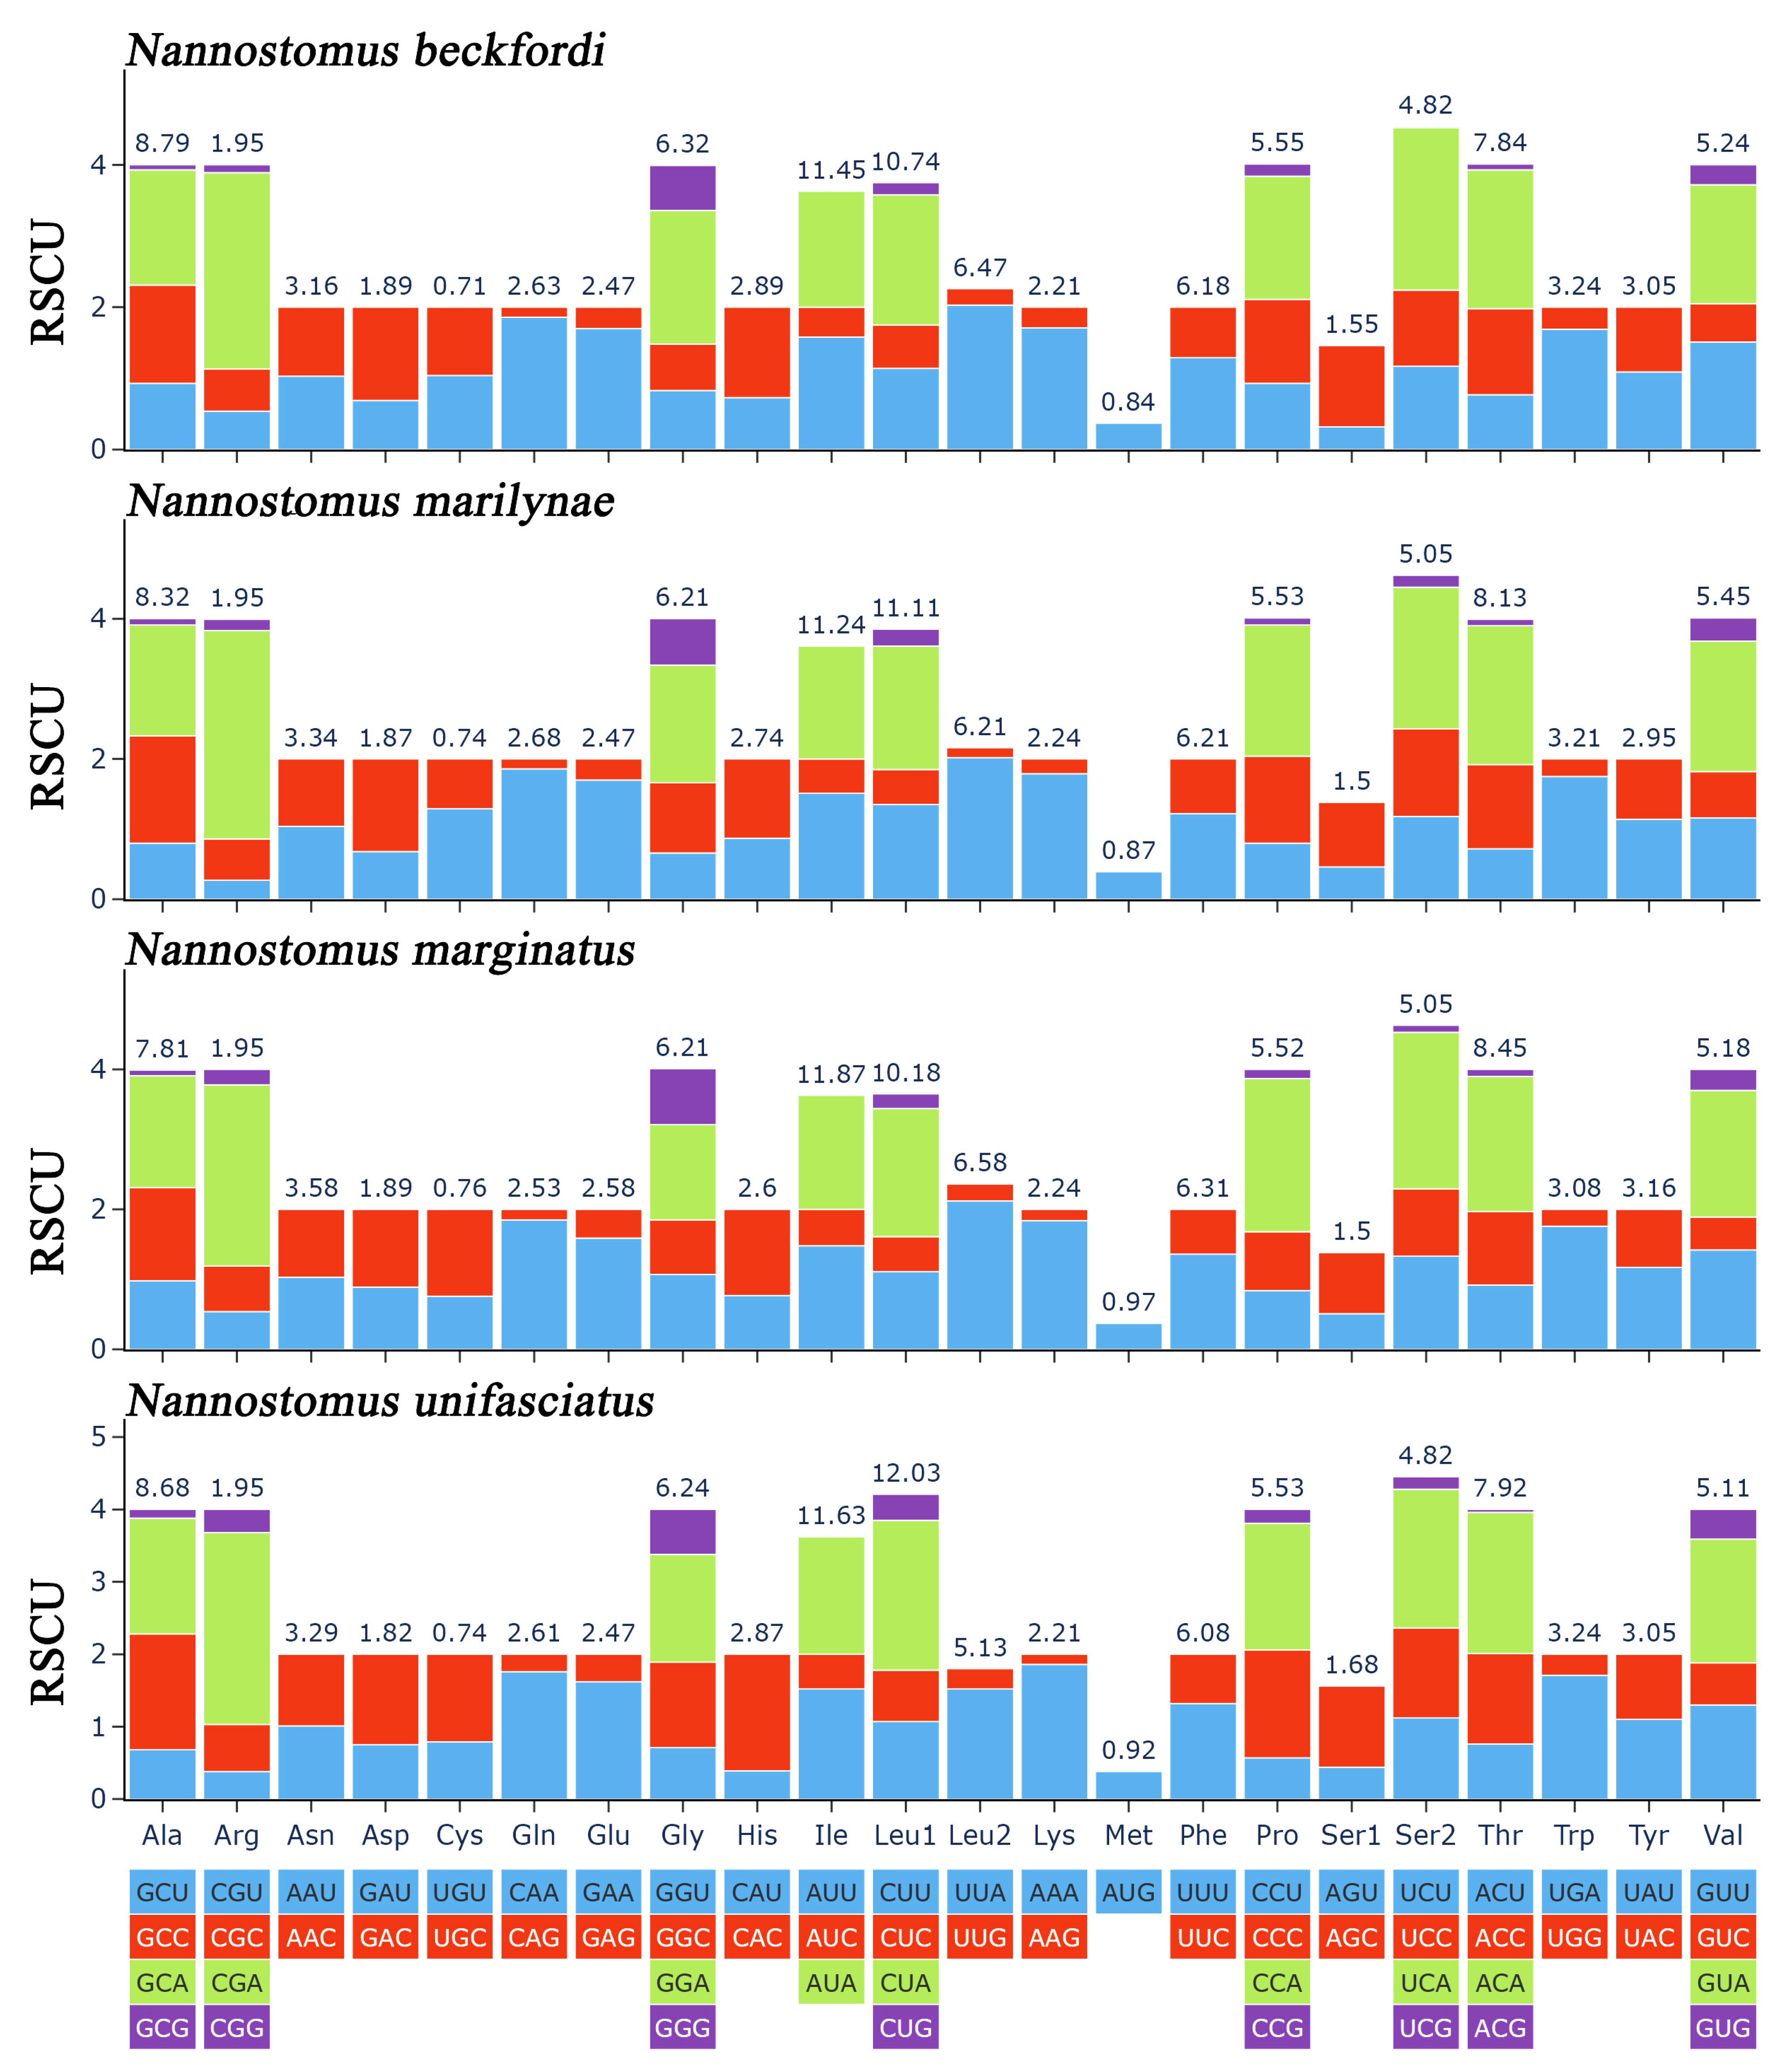
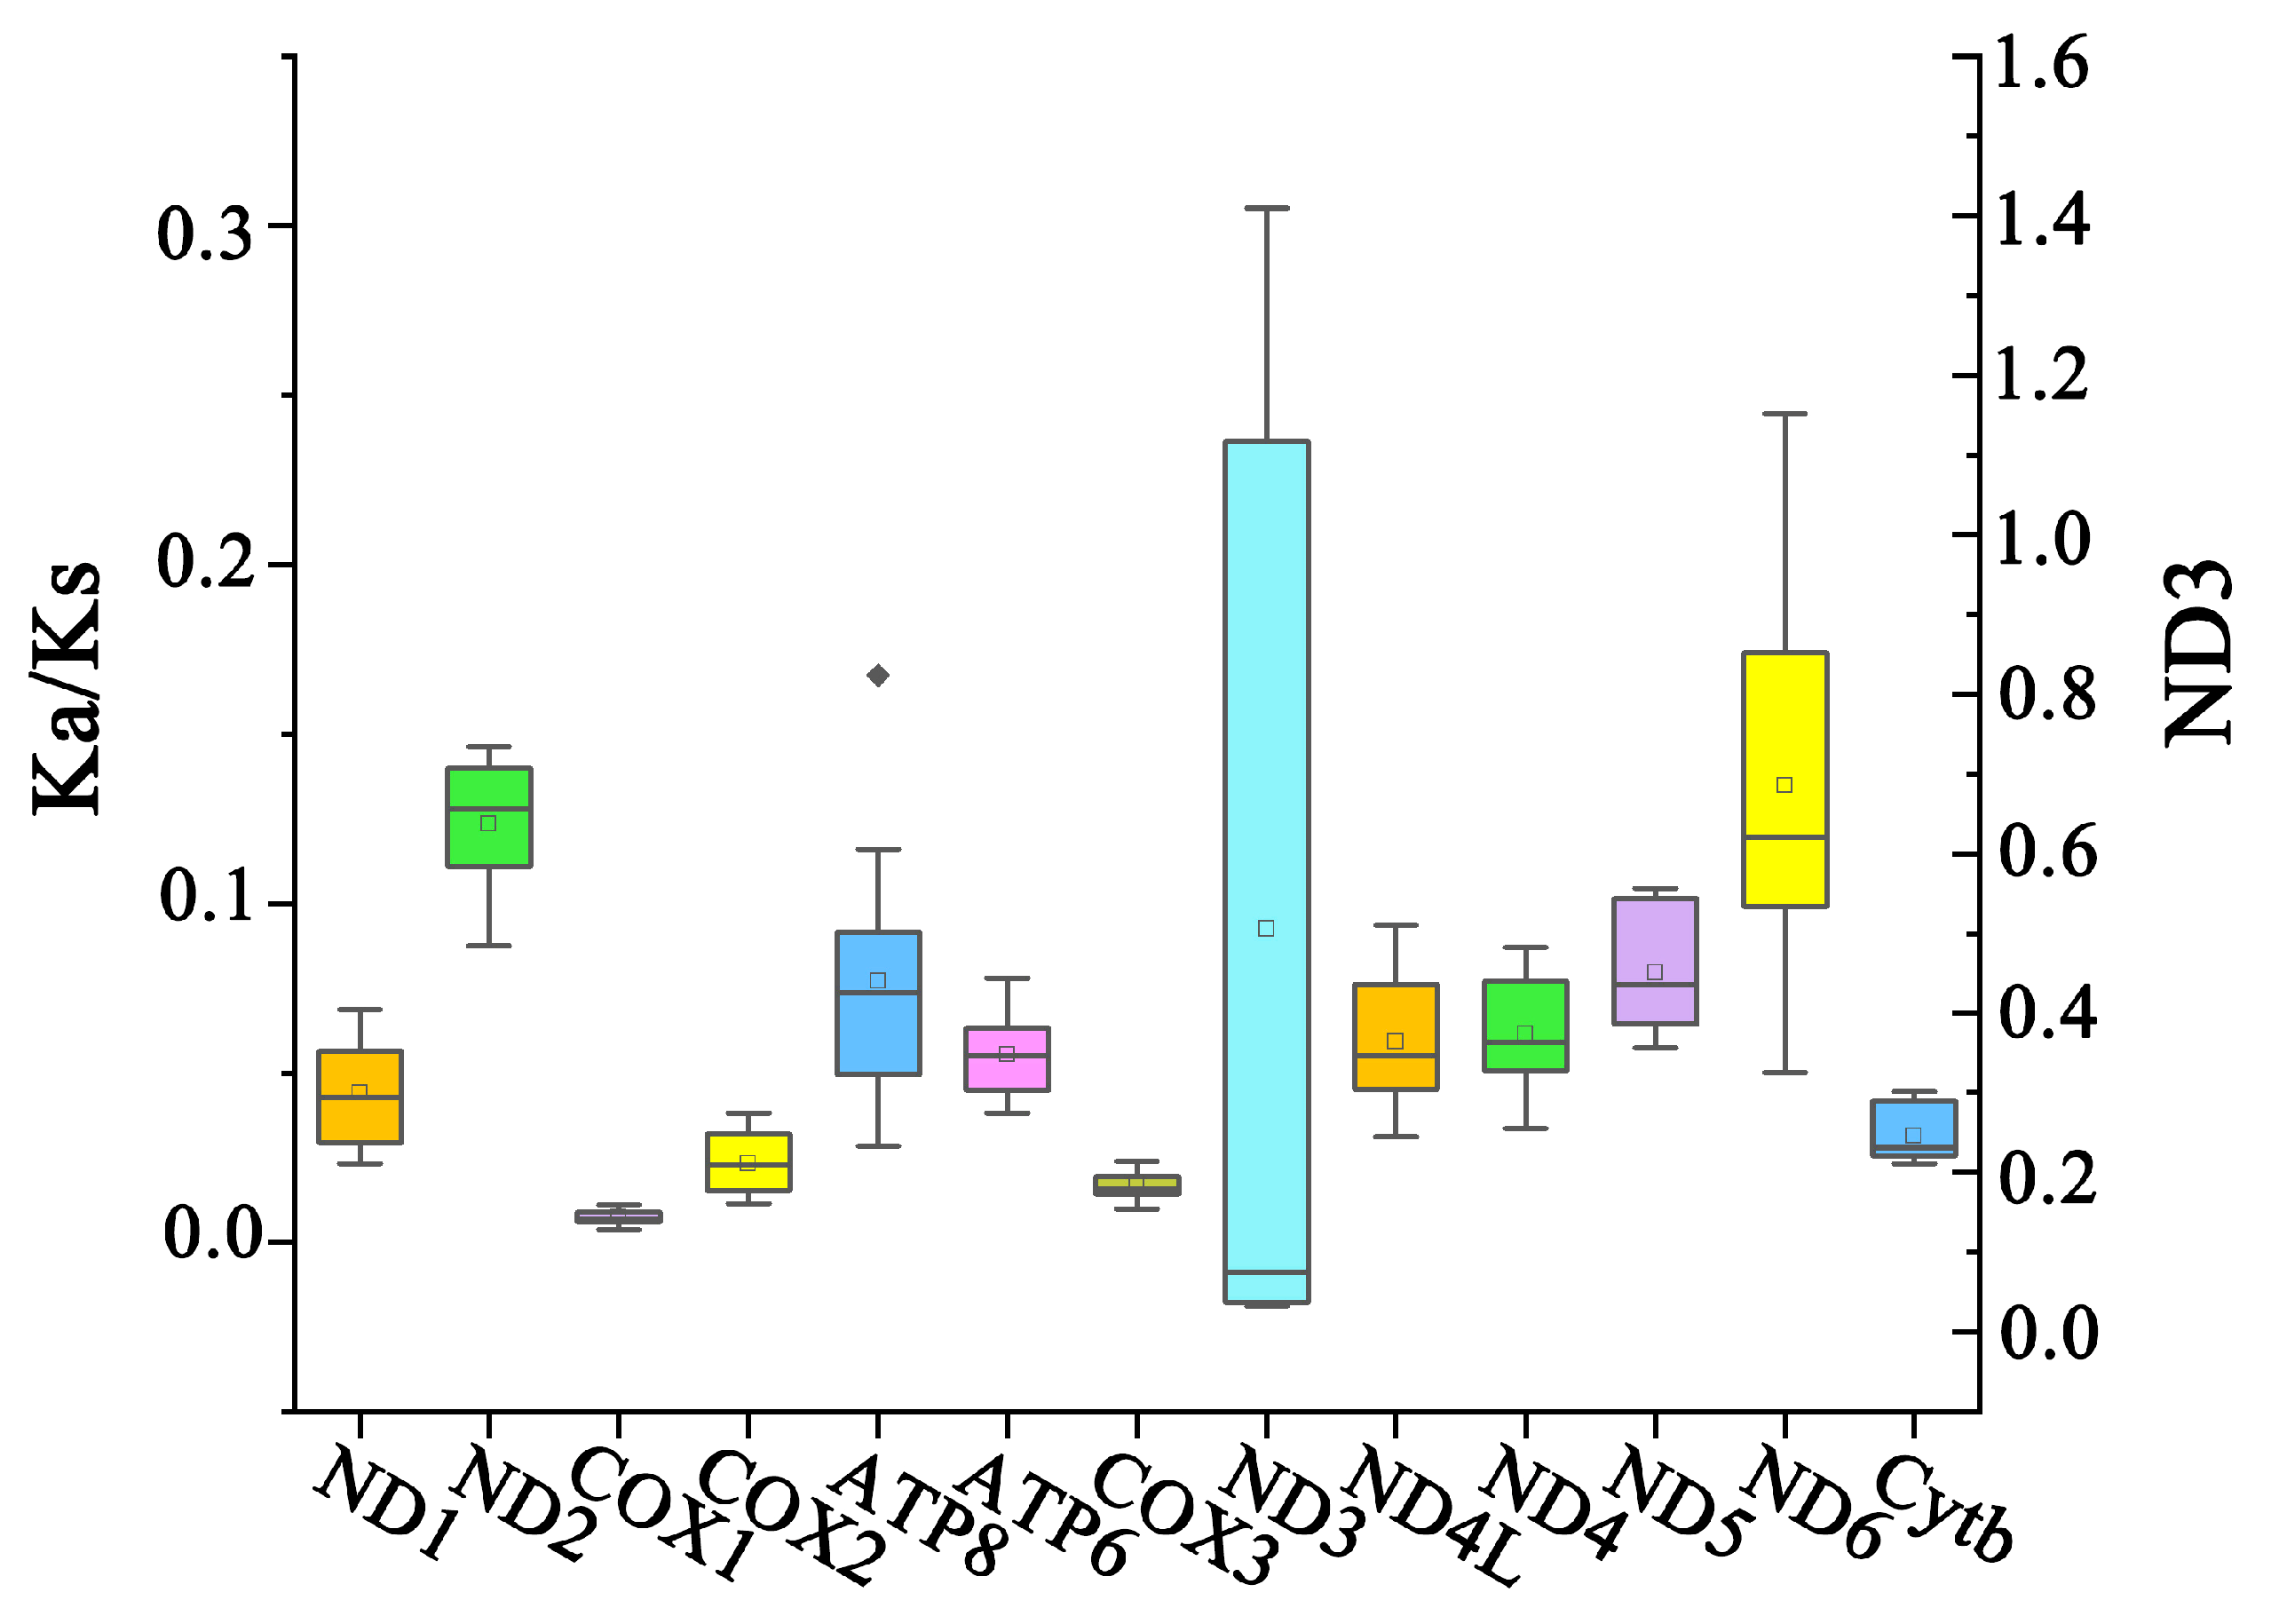
3.2. Protein-Coding Genes and Codon Usage

The total lengths of the PCGs in Nannostomus were 11,431 bp, 11,433 bp, 11,432 bp, and 11,431 bp, accounting for 68.49% (N. beckfordi) to 68.62% (N. marginatus) of their total mitogenomes, respectively. All PCGs were encoded on the major strand, except for ND6 on the minor strand (Figure 1 and Table 2). Among the 13 PCGs presented in these four mitogenomes, ATP8 exhibited the smallest size at 168 bp, while ND5 displayed the largest size at 1839 bp.
The majority of PCGs in the four mitogenomes start with the ATG codon, with the exception of ND1 in N. marginatus, which starts with the ATT codon, and COX1 in all four mitochondrial genomes, which starts with the GTG codon. The termination codon varied across these PCGs, namely TAA, TAG, AGG, and T. Across all mitogenomes, the frequency of the termination codon TAA was consistently higher than that of the other three termination codons, whereas the occurrence of the termination codon AGG was the lowest. The usage of the initiation codon and termination codon in 48 mitogenomes was calculated (Table 1 and Figure 4). The Characiformes species are relatively conservative in their use of initiation codons, and their preferences were almost consistent with those of the four newly sequenced species, starting with ATG (Figure 4). However, COX1 of the Characiformes species mainly started with GTG. All Characiformes species share the termination codons TAA, TAG, AGG, and T (Figure 4). Specifically, ND1, ATP8, ATP6, COX3, ND4L, and ND5 predominantly employ TAA as the termination codon, while COX1 primarily utilizes AGG as the termination codon. Additionally, ND6 mainly uses TAG as the termination codon, and ND2, COX2, ND3, ND4, and Cytb predominantly use T as the termination codon.
An RSCU analysis was conducted to investigate the codon usage patterns in the four mitogenomes of Nannostomus (Figure 5). The RSCUs of the four mitogenomes exhibited a high degree of similarity. In addition, RSCU analysis revealed a preference for A/T nucleotides at the third codon position, which was consistent with the biased usage of A+T nucleotides evident in the frequencies of codons. The evolutionary pattern of PCGs in Nannostomus was analyzed using Ka/Ks ratios (Figure 6). Apart from that of ND3, the Ka/Ks ratios of the PCGs were lower than 1.

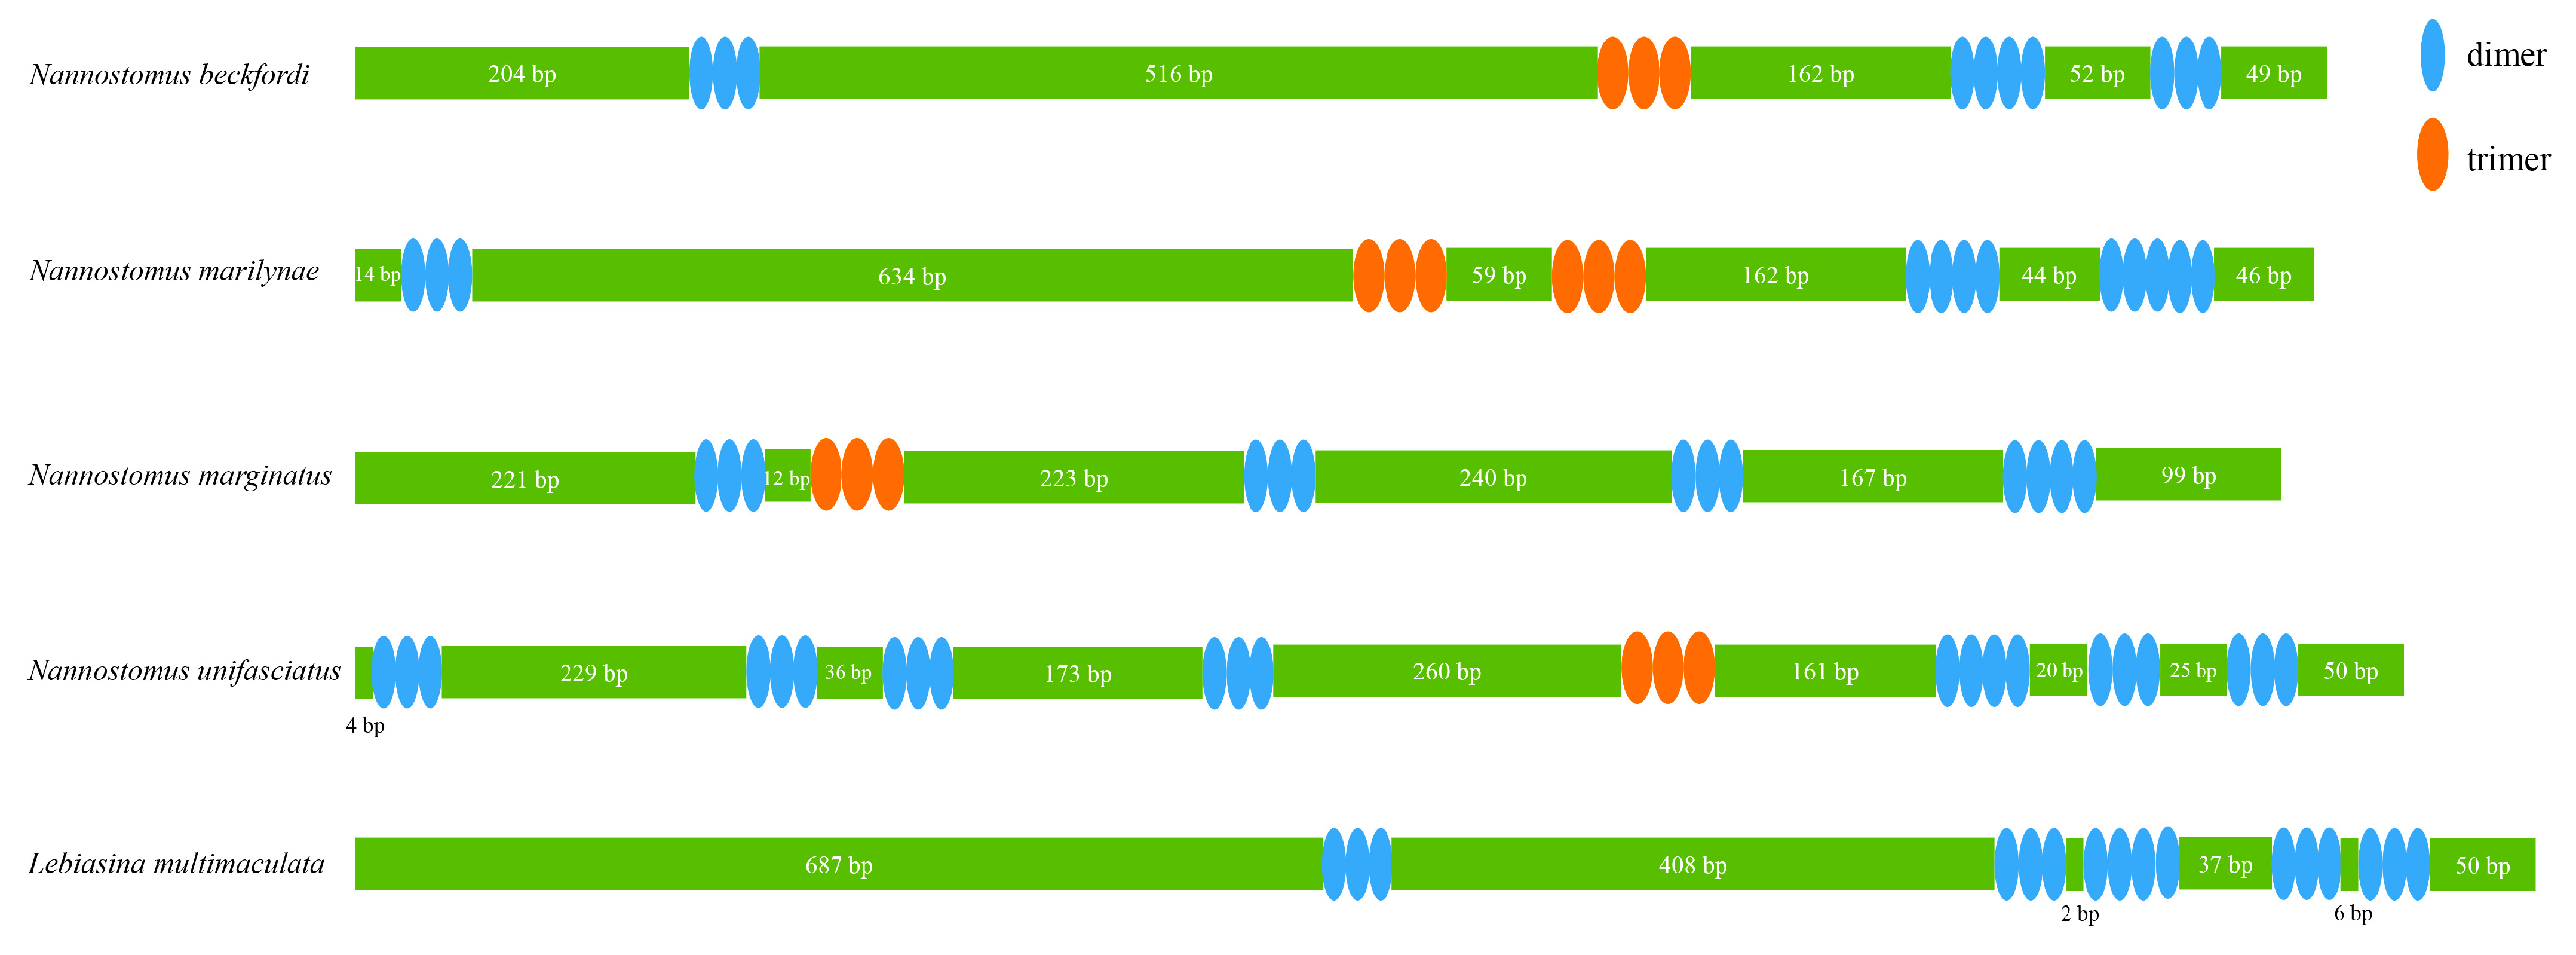
3.3. rRNA, tRNA Genes, and CR

Two rRNAs, 12S rRNA and 16S rRNA, were transcribed from the major strand in the four mitogenomes (Table 2). 12S rRNA was located between tRNA-Phe and tRNA-Val, while 16S rRNA was found between tRNA-Val and tRNA-Leu. The sizes of the 12S rRNA ranged from 953 bp to 956 bp, while the 16S rRNA varied from 1682 bp to 1696 bp in the mitogenomes.
Twenty-two tRNAs (66–76 bp in size) were interspersed in the four mitogenomes altogether, with fourteen from the major strand and eight transcribed from the minor strand (Table 2). The total lengths of the tRNAs were 1563 bp in N. beckfordi, 1559 bp in N. marilynae, 1565 bp in N. marginatus, and 1559 bp in N. unifasciatus, accounting for 9.36%, 9.35%, 9.39%, and 9.35% of their total mitogenomes, respectively.
CR was found between the genes tRNA-Pro and tRNA-Phe in these four mitogenomes. The sizes of CRs in four mitogenomes ranged from 997 bp (N. marginatus) to 1012 bp (N. beckfordi), accounting for 5.98% to 6.06% of the A+T contents in the CRs of the four mitogenomes, exhibiting consistently higher values than PCGs and RNAs, ranging from 69.88% to 72.20% (Figure 2). Lebiasinidae species had CRs of a similar size, but the length of the repeat units and the number of repeats in them were different (Figure 7). The repeat units of CRs were predominantly dimers and, to a lesser extent, trimers.

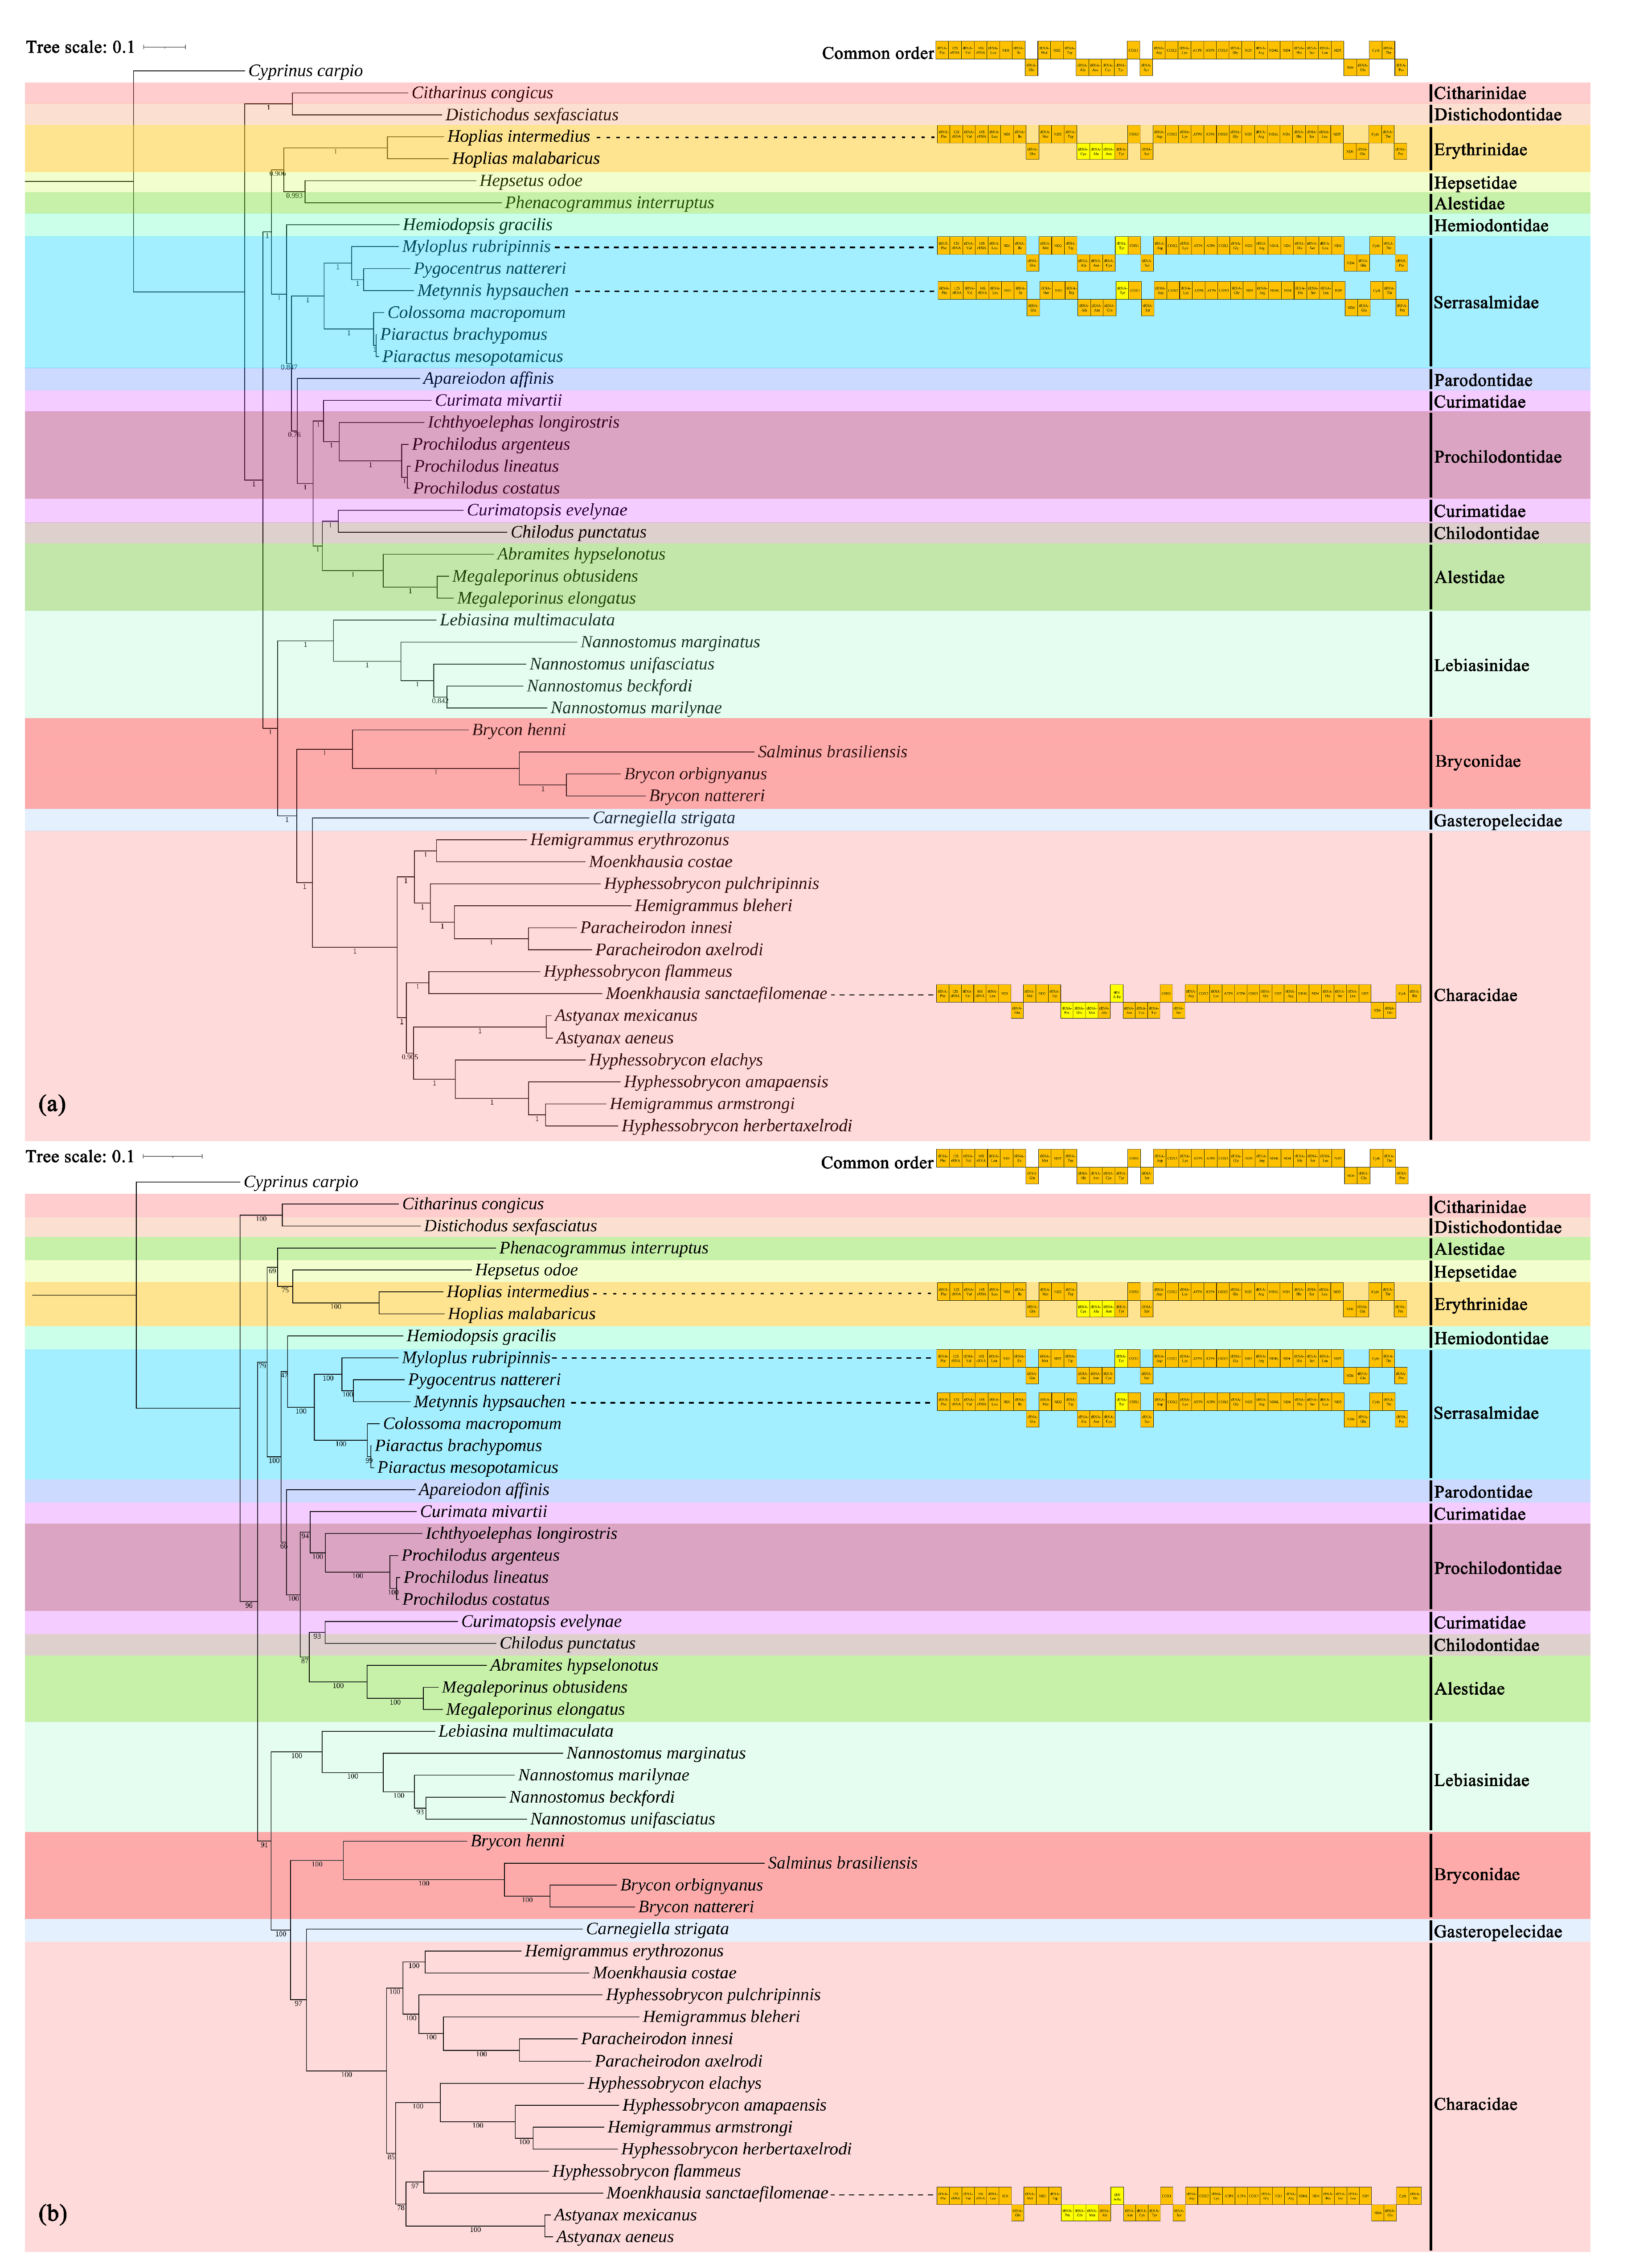
3.4. Phylogenetic Relationships

A total of 48 species from 15 families of the order Characiformes were included in the phylogenetic analyses. Additionally, one species from the order Cypriniformes (C. carpio) was selected as the outgroup to establish the phylogenetic trees, our aim being to understand the phylogenetic relationships within the order Characiformes (Table 1). The BI and ML trees shared a similar topological structure, with well-supported values for each clade (Figure 8). Four Nannostomus species in this study were clustered together with L. multimaculata of the same family. Within the order Characiformes, the families Citharinidae and Distichodontidae diverged with species in other families early in the evolutionary history of Characiformes fishes.

4. Discussion

The mitogenomes of the four fish contained 13 PCGs, 22 tRNAs, 2 rRNAs, and 1 noncoding CR, which is typical of vertebrates [10,34,35]. The gene orders of the four fish were found to be identical to the common order of Characiformes, which was previously sequenced [13,36,37]. For nucleotide composition, four mitogenomes had an AT bias (A+T > G+C), which is consistent with previous studies [13,38]. The AT skews were almost positive, indicating a higher occurrence of A than T, as has also been observed in other published Teleostei genomes [10,39]. Some PCGs in the four mitogenomes start with unusual codons, such as ATT and GTG. Previous studies have documented the occurrence of atypical initiation codons in Characiformes, such as Astyanax paranae and Hemigrammus armstrongi [13,40]. Most of the gene overlap regions appeared between PCGs and PCGs, with the largest overlaps all located between ATP8 and ATP6, consistent with other fish mitogenomes [41,42,43,44]. Apart from ND3, the Ka/Ks ratios of other PCGs were lower than 1. This suggests that purifying selection might play a predominant role in shaping the evolutionary patterns of PCGs, meaning that, in most cases, selection eliminates the deleterious mutation, and the protein is unchanged [45]. COX1 had the lowest average Ka/Ks value, suggesting that it was under drastic selection pressure and evolved slowly [46].
The mitogenome structure of the order Characiformes is generally conserved [47], with infrequent occurrences of gene rearrangement events. Through an examination of the available mitogenomes of the Characiformes species in GenBank (https://www.ncbi.nlm.nih.gov/, accessed on 30 November 2023; Table 1), our investigation revealed instances of gene rearrangement in four species: Hoplias intermedius, Metynnis hypsauchen, Moenkhausia sanctaefilomenae, and Myloplus rubripinnis. However, the structure of CRs varied widely among Lebiasinidae species (Figure 7). Previous research has shown that the CRs of fish vary significantly between different species and even within the same species [47,48].
The phylogenetic trees also emphasized the unstable relationships within the family Characidae, which was consistent with previous studies [13,49]. Some Characidae species were clustered with species from other genera (Figure 8). In studies on the genus Brycon, some suggest that the genus Brycon should be classified under the family Characidae [50,51], while others suggest it should be classified under the family Bryconidae [52,53]. Studies in recent years have mainly supported the classification of the genus Brycon belonging to the family Bryconidae [54]. In the phylogenetic analyses in this study, the phylogenetic relationship of the genus Brycon with other species in the family Characidae was, indeed, distant. Therefore, our study also supports the inference that the genus Brycon should be classified under the family Bryconidae. It is evident that species that have undergone gene rearrangement were clustered together with species of the same family, although M. sanctaefilomenae did not cluster with other species in the same genus. Previous studies have indicated that phylogenetic trees based on PCGs are more stable and representative than those based on RNAs [13,55,56]. Therefore, the phylogenetic analyses based on PCGs in this study suggest that gene rearrangement would not significantly impact the phylogenetic relationships within the order Characiformes. Although the Characiformes mitogenome is relatively conserved [47], gene rearrangement events have been discovered in many taxa. In addition, there are still a large number of Characiformes species whose complete mitogenomes have not yet been published, and our knowledge on the structure of Characiformes mitogenomes, especially the pattern and underlying mechanisms of gene rearrangements, is far from comprehensive. Therefore, it is necessary to obtain mitogenome data on more species of the order Characiformes. The selection of species from the genus Nannostomus in this study, as well as other species from the Lebiasinidae family in previous studies, was limited, thereby hindering the ability to conduct a comprehensive analysis. Consequently, to enhance our comprehension of the relationships within this family, it would be helpful to incorporate a broader range of species in forthcoming research endeavors.

5. Conclusions

In summary, the four mitogenomes exhibited a typical circular structure, with the overall sizes varying from 16,661 bp to 16,690 bp, containing 13 PCGs, 2 rRNAs, 22 tRNAs, and 1 CR. Nucleotide composition analysis suggested that the mitochondrial sequences were biased towards A and T. The gene order of the four Nannostomus pencilfish was similar to that of other Osteichthyes fish. Phylogenetic analyses support the current classification of the family Lebiasinidae. The phylogenetic analyses in this study suggest that gene rearrangement would not significantly impact the phylogenetic relationships within the order Characiformes. These findings provide new data on the phylogeny and classification of the order Characiformes, thereby establishing a theoretical foundation for the sustainable development of aquarium fish markets.

Author Contributions

Conceptualization, H.L.; methodology, W.X.; software, W.X. and K.H.; formal analysis, W.X., J.T. and G.Z.; resources, W.X., J.T. and B.X.; writing—original draft preparation, W.X.; writing—review and editing, H.L., K.H. and T.X.; funding acquisition, W.X. All authors have read and agreed to the published version of the manuscript.

Funding

This research was funded by the Postgraduate Research & Practice Innovation Program of Jiangsu Province (KYCX24_1382).

Institutional Review Board Statement

The study was conducted in accordance with the Declaration of Helsinki and approved by the Institutional Review Board of Nanjing Forestry University, number 2022001.

Informed Consent Statement

Not applicable.

Data Availability Statement

DNA sequences: GenBank accession number OR857846 for Nannostomus beckfordi, OR857847 for Nannostomus marilynae, OR857848 for Nannostomus marginatus, and OR857849 for Nannostomus unifasciatus.

Conflicts of Interest

The authors declare no conflicts of interest.

References

  1. Benzaquem, D.C.; Oliveira, C.; Batista, J.d.S.; Zuanon, J.; Porto, J.I.R. DNA Barcoding in Pencilfishes (Lebiasinidae: Nannostomus) Reveals Cryptic Diversity across the Brazilian Amazon. PLoS ONE 2015, 10, e0112217. [Google Scholar] [CrossRef] [PubMed]
  2. Sember, A.; de Oliveira, E.A.; Ráb, P.; Bertollo, L.A.C.; de Freitas, N.L.; Viana, P.F.; Yano, C.F.; Hatanaka, T.; Marinho, M.M.F.; de Moraes, R.L.R.; et al. Centric Fusions behind the Karyotype Evolution of Neotropical Nannostomus Pencilfishes (Characiforme, Lebiasinidae): First Insights from a Molecular Cytogenetic Perspective. Genes 2020, 11, 91. [Google Scholar] [CrossRef] [PubMed]
  3. Beheregaray, L.B.; Schwartz, T.S.; Möller, L.M.; Call, D.; Chao, N.L.; Caccone, A. A set of microsatellite DNA markers for the one-lined pencilfish Nannostomus unifasciatus, an Amazonian flooded forest fish. Mol. Ecol. Notes 2004, 4, 333–335. [Google Scholar] [CrossRef]
  4. Terencio, M.L.; Schneider, C.H.; Porto, J.I.R. Molecular signature of the D-loop in the brown pencilfish Nannostomus eques (Characiformes, Lebiasinidae) reveals at least two evolutionary units in the Rio Negro basin, Brazil. J. Fish Biol. 2012, 81, 110–124. [Google Scholar] [CrossRef] [PubMed]
  5. Magalhães, A.L.B.; Daga, V.S.; Bezerra, L.A.V.; Vitule, J.R.S.; Jacobi, C.M.; Silva, L.G.M. All the colors of the world: Biotic homogenization-differentiation dynamics of freshwater fish communities on demand of the Brazilian aquarium trade. Hydrobiologia 2020, 847, 3897–3915. [Google Scholar] [CrossRef]
  6. Meng, F.; Huang, Y.; Liu, B.; Zhu, K.; Zhang, J.; Jing, F.; Xia, L.; Liu, Y. The complete mitochondrial genome of Lebiasina astrigata (Characiformes: Lebiasinida) and phylogenetic studies of Characiformes. Mitochondrial DNA Part B 2019, 4, 579–580. [Google Scholar] [CrossRef]
  7. Sassi, F.d.M.C.; Hatanaka, T.; de Moraes, R.L.R.; Toma, G.A.; de Oliveira, E.A.; Liehr, T.; Rab, P.; Bertollo, L.A.C.; Viana, P.F.; Feldberg, E.; et al. An Insight into the Chromosomal Evolution of Lebiasinidae (Teleostei, Characiformes). Genes 2020, 11, 365. [Google Scholar] [CrossRef]
  8. Calcagnotto, D.; Schaefer, S.A.; DeSalle, R. Relationships among characiform fishes inferred from analysis of nuclear and mitochondrial gene sequences. Mol. Phylogenetics Evol. 2005, 36, 135–153. [Google Scholar] [CrossRef] [PubMed]
  9. de Pinna, M.; Zuanon, J.; Py-Daniel, L.R.; Petry, P. A new family of neotropical freshwater fishes from deep fossorial Amazonian habitat, with a reappraisal of morphological characiform phylogeny (Teleostei: Ostariophysi). Zool. J. Linn. Soc. 2018, 182, 76–106. [Google Scholar] [CrossRef]
  10. Xu, W.; Lin, S.; Liu, H. Mitochondrial genomes of five Hyphessobrycon tetras and their phylogenetic implications. Ecol. Evol. 2021, 11, 12754–12764. [Google Scholar] [CrossRef]
  11. Wang, J.; Xu, W.; Liu, Y.; Bai, Y.; Liu, H. Comparative mitochondrial genomics and phylogenetics for species of the snakehead genus Channa Scopoli, 1777 (Perciformes: Channidae). Gene 2023, 857, 147186. [Google Scholar] [CrossRef]
  12. Boore, J.L. Animal mitochondrial genomes. Nucleic Acids Res. 1999, 27, 1767–1780. [Google Scholar] [CrossRef]
  13. Xu, W.; Wang, J.; Xu, R.; Jiang, H.; Ding, J.; Wu, H.; Wu, Y.; Liu, H. Comparative mitochondrial genomics of tetras: Insights into phylogenetic relationships in Characidae. Biologia 2022, 77, 2905–2914. [Google Scholar] [CrossRef]
  14. Chang, Y.-S.; Huang, F.-L.; Lo, T.-B. The complete nucleotide sequence and gene organization of carp (Cyprinus carpio) mitochondrial genome. J. Mol. Evol. 1994, 38, 138–155. [Google Scholar] [CrossRef] [PubMed]
  15. Zhu, H.-F.; Wang, Z.-Y.; Wang, Z.-L.; Yu, X.-P. Complete mitochodrial genome of the crab spider Ebrechtella tricuspidata (Araneae: Thomisidae): A novel tRNA rearrangement and phylogenetic implications for Araneae. Genomics 2019, 111, 1266–1273. [Google Scholar] [CrossRef]
  16. Zhu, S.-R.; Fu, J.-J.; Wang, Q.; Li, J.-L. Identification of Channa species using the partial cytochrome c oxidase subunit I (COI) gene as a DNA barcoding marker. Biochem. Syst. Ecol. 2013, 51, 117–122. [Google Scholar] [CrossRef]
  17. Serrao, N.R.; Steinke, D.; Hanner, R.H. Calibrating Snakehead Diversity with DNA Barcodes: Expanding Taxonomic Coverage to Enable Identification of Potential and Established Invasive Species. PLoS ONE 2014, 9, e99546. [Google Scholar] [CrossRef]
  18. Powell, A.F.; Barker, F.K.; Lanyon, S.M. Empirical evaluation of partitioning schemes for phylogenetic analyses of mitogenomic data: An avian case study. Mol. Phylogenet. Evol. 2013, 66, 69–79. [Google Scholar] [CrossRef] [PubMed]
  19. Chandhini, S.; Vargheese, S.; Philip, S.; Kumar, V.J.R. Deciphering the mitochondrial genome of Malabar snakehead, Channa diplogramma (Teleostei; Channidae). Biologia 2020, 75, 741–748. [Google Scholar] [CrossRef]
  20. Hu, Y.; Xing, W.; Hu, Z.; Liu, G. Phylogenetic Analysis and Substitution Rate Estimation of Colonial Volvocine Algae Based on Mitochondrial Genomes. Genes 2020, 11, 115. [Google Scholar] [CrossRef]
  21. Casal, C.M.V. Global Documentation of Fish Introductions: The Growing Crisis and Recommendations for Action. Biol. Invasions 2006, 8, 3–11. [Google Scholar] [CrossRef]
  22. Perna, N.T.; Kocher, T.D. Patterns of nucleotide composition at fourfold degenerate sites of animal mitochondrial genomes. J. Mol. Evol. 1995, 41, 353–358. [Google Scholar] [CrossRef]
  23. Diao, C.; Xi, Y.; Xiao, T. Identification and analysis of key genes in osteosarcoma using bioinformatics. Oncol. Lett. 2018, 15, 2789–2794. [Google Scholar] [CrossRef]
  24. Kumar, S.; Stecher, G.; Li, M.; Knyaz, C.; Tamura, K. MEGA X: Molecular Evolutionary Genetics Analysis across Computing Platforms. Mol. Biol. Evol. 2018, 35, 1547–1549. [Google Scholar] [CrossRef]
  25. Lowe, T.M.; Eddy, S.R. tRNAscan-SE: A Program for Improved Detection of Transfer RNA Genes in Genomic Sequence. Nucleic Acids Res. 1997, 25, 955–964. [Google Scholar] [CrossRef] [PubMed]
  26. Zhang, D.; Gao, F.; Jakovlic, I.; Zou, H.; Zhang, J.; Li, W.X.; Wang, G.T. PhyloSuite: An integrated and scalable desktop platform for streamlined molecular sequence data management and evolutionary phylogenetics studies. Mol. Ecol. Resour. 2020, 20, 348–355. [Google Scholar] [CrossRef]
  27. Katoh, K.; Standley, D.M. MAFFT Multiple Sequence Alignment Software Version 7: Improvements in Performance and Usability. Mol. Biol. Evol. 2013, 30, 772–780. [Google Scholar] [CrossRef] [PubMed]
  28. Ranwez, V.; Douzery, E.J.P.; Cambon, C.; Chantret, N.; Delsuc, F. MACSE v2: Toolkit for the Alignment of Coding Sequences Accounting for Frameshifts and Stop Codons. Mol. Biol. Evol. 2018, 35, 2582–2584. [Google Scholar] [CrossRef]
  29. Kalyaanamoorthy, S.; Minh, B.Q.; Wong, T.K.F.; Von Haeseler, A.; Jermiin, L.S. ModelFinder: Fast model selection for accurate phylogenetic estimates. Nat. Methods 2017, 14, 587–589. [Google Scholar] [CrossRef]
  30. Liddle, A.R. Information criteria for astrophysical model selection. Mon. Not. R. Astron. Soc. Lett. 2007, 377, L74–L78. [Google Scholar] [CrossRef]
  31. Yang, Z. Maximum likelihood phylogenetic estimation from DNA sequences with variable rates over sites: Approximate methods. J. Mol. Evol. 1994, 39, 306–314. [Google Scholar] [CrossRef] [PubMed]
  32. Huelsenbeck, J.P.; Ronquist, F. MRBAYES: Bayesian inference of phylogenetic trees. Bioinformatics 2001, 17, 754–755. [Google Scholar] [CrossRef] [PubMed]
  33. Zhou, T.; Xu, K.; Zhao, F.; Liu, W.; Li, L.; Hua, Z.; Zhou, X. itol.toolkit accelerates working with iTOL (Interactive Tree of Life) by an automated generation of annotation files. Bioinformatics 2023, 39, btad339. [Google Scholar] [CrossRef] [PubMed]
  34. Montaña-Lozano, P.; Moreno-Carmona, M.; Ochoa-Capera, M.; Medina, N.S.; Boore, J.L.; Prada, C.F. Comparative genomic analysis of vertebrate mitochondrial reveals a differential of rearrangements rate between taxonomic class. Sci. Rep. 2022, 12, 5479. [Google Scholar] [CrossRef] [PubMed]
  35. Jia, Y.; Qiu, G.; Cao, C.; Wang, X.; Jiang, L.; Zhang, T.; Geng, Z.; Jin, S. Mitochondrial genome and phylogenetic analysis of Chaohu duck. Gene 2023, 851, 147018. [Google Scholar] [CrossRef] [PubMed]
  36. Pasa, R.; Menegídio, F.B.; Rodrigues-Oliveira, I.H.; da Silva, I.B.; de Campos, M.L.C.B.; Rocha-Reis, D.A.; Heslop-Harrison, J.S.; Schwarzacher, T.; Kavalco, K.F. Ten Complete Mitochondrial Genomes of Gymnocharacini (Stethaprioninae, Characiformes). Insights Into Evolutionary Relationships and a Repetitive Element in the Control Region (D-loop). Front. Ecol. Evol. 2021, 9, 650783. [Google Scholar] [CrossRef]
  37. Zhu, Q.; Luo, S.; Pan, S.; Su, X.; Liu, Z.; Chen, J. Complete mitogenome of Gymnocorymbus ternetzi (Characiformes: Characidae: Gymnocorymbus) and phylogenetic implications. Mitochondrial DNA Part B 2022, 7, 58–59. [Google Scholar] [CrossRef]
  38. Liu, H.; Sun, C.; Zhu, Y.; Li, Y.; Wei, Y.; Ruan, H. Mitochondrial genomes of four American characins and phylogenetic relationships within the family Characidae (Teleostei: Characiformes). Gene 2020, 762, 145041. [Google Scholar] [CrossRef] [PubMed]
  39. Wang, J.; Tai, J.; Zhang, W.; He, K.; Lan, H.; Liu, H. Comparison of seven complete mitochondrial genomes from Lamprologus and Neolamprologus (Chordata, Teleostei, Perciformes) and the phylogenetic implications for Cichlidae. ZooKeys 2023, 1184, 115–132. [Google Scholar] [CrossRef]
  40. Silva, D.M.Z.d.A.; Utsunomia, R.; Ruiz-Ruano, F.J.; Oliveira, C.; Foresti, F. The complete mitochondrial genome sequence of Astyanax paranae (Teleostei: Characiformes). Mitochondrial DNA Part B 2016, 1, 586–587. [Google Scholar] [CrossRef]
  41. Kundu, S.; Kang, H.-E.; Kim, A.R.; Lee, S.R.; Kim, E.-B.; Amin, M.H.F.; Andriyono, S.; Kim, H.-W.; Kang, K. Mitogenomic Characterization and Phylogenetic Placement of African Hind, Cephalopholis taeniops: Shedding Light on the Evolution of Groupers (Serranidae: Epinephelinae). Int. J. Mol. Sci. 2024, 25, 1822. [Google Scholar] [CrossRef] [PubMed]
  42. Bai, Y.; Yang, K.; Ye, L.; Gao, X. Complete Mitogenome and Phylogenetic Analyses of Galerita orientalis Schmidt-Goebel, 1846 (Insecta: Coleoptera: Carabidae: Galeritini). Genes 2022, 13, 2199. [Google Scholar] [CrossRef] [PubMed]
  43. Li, Y.; Yi, H.; Zhu, Y. Novel insights into adaptive evolution based on the unusual AT-skew in Acheilognathus gracilis mitogenome and phylogenetic relationships of bitterling. Gene 2024, 902, 148154. [Google Scholar] [CrossRef] [PubMed]
  44. Yang, M.; Yang, Z.; Liu, C.; Lee, X.; Zhu, K. Characterization of the Complete Mitochondrial Genome of the Spotted Catfish Arius maculatus (Thunberg, 1792) and Its Phylogenetic Implications. Genes 2022, 13, 2128. [Google Scholar] [CrossRef] [PubMed]
  45. Hurst, L.D. The Ka/Ks ratio: Diagnosing the form of sequence evolution. Trends Genet. 2002, 18, 486–487. [Google Scholar] [CrossRef]
  46. Hassanin, A.; Léger, N.; Deutsch, J. Evidence for Multiple Reversals of Asymmetric Mutational Constraints during the Evolution of the Mitochondrial Genome of Metazoa, and Consequences for Phylogenetic Inferences. Syst. Biol. 2005, 54, 277–298. [Google Scholar] [CrossRef] [PubMed]
  47. Xu, W.; Ding, J.; Lin, S.; Xu, R.; Liu, H. Comparative mitogenomes of three species in Moenkhausia: Rare irregular gene rearrangement within Characidae. Int. J. Biol. Macromol. 2021, 183, 1079–1086. [Google Scholar] [CrossRef]
  48. Padhi, A. Geographic variation within a tandemly repeated mitochondrial DNA D-loop region of a North American freshwater fish, Pylodictis olivaris. Gene 2014, 538, 63–68. [Google Scholar] [CrossRef] [PubMed]
  49. Mirande, J.M. Morphology, molecules and the phylogeny of Characidae (Teleostei, Characiformes). Cladistics 2019, 35, 282–300. [Google Scholar] [CrossRef]
  50. Lima, F.C.; Albrecht, M.P.; Pavanelli, C.S.; Vono, V. Threatened fishes of the world: Brycon nattereri Günther, 1864 (Characidae). Environ. Biol. Fishes 2008, 83, 207–208. [Google Scholar] [CrossRef]
  51. de Siqueira-Silva, D.H.; Silva, A.P.d.S.; Costa, R.d.S.; Senhorini, J.A.; Ninhaus-Silveira, A.; Veríssimo-Silveira, R. Preliminary study on testicular germ cell isolation and transplantation in an endangered endemic species Brycon orbignyanus (Characiformes: Characidae). Fish Physiol. Biochem. 2021, 47, 767–776. [Google Scholar] [CrossRef] [PubMed]
  52. Travenzoli, N.M.; Silva, P.C.; Santos, U.; Zanuncio, J.C.; Oliveira, C.; Dergam, J.A. Cytogenetic and Molecular Data Demonstrate that the Bryconinae (Ostariophysi, Bryconidae) Species from Southeastern Brazil Form a Phylogenetic and Phylogeographic Unit. PLoS ONE 2015, 10, e0137843. [Google Scholar] [CrossRef] [PubMed]
  53. Arruda, P.S.S.; Ferreira, D.C.; Oliveira, C.; Venere, P.C. DNA Barcoding Reveals High Levels of Divergence among Mitochondrial Lineages of Brycon (Characiformes, Bryconidae). Genes 2019, 10, 639. [Google Scholar] [CrossRef] [PubMed]
  54. Oliveira, C.; Avelino, G.S.; Abe, K.T.; Mariguela, T.C.; Benine, R.C.; Ortí, G.; Vari, R.P.; e Castro, R.M.C. Phylogenetic relationships within the speciose family Characidae (Teleostei: Ostariophysi: Characiformes) based on multilocus analysis and extensive ingroup sampling. BMC Evol. Biol. 2011, 11, 275. [Google Scholar] [CrossRef] [PubMed]
  55. Alvarez, F.; Cortinas, M.N.; Musto, H. The Analysis of Protein Coding Genes Suggests Monophyly ofTrypanosoma. Mol. Phylogenet. Evol. 1996, 5, 333–343. [Google Scholar] [CrossRef]
  56. Han, J.-H.; Cho, M.-H.; Kim, S.B. Ribosomal and protein coding gene based multigene phylogeny on the family Streptomycetaceae. Syst. Appl. Microbiol. 2012, 35, 1–6. [Google Scholar] [CrossRef]
Figure 1. Mitogenomes of Nannostomus beckfordi (a), Nannostomus marilynae (b), Nannostomus marginatus (c), and Nannostomus unifasciatus (d). Yellow blocks: CR, green blocks: rRNAs, light purple blocks: tRNAs, dark purple blocks: PCGs.
Animals 14 01598 g001
Figure 2. Nucleotide composition of various datasets of mitogenomes. Hierarchical clustering of Lebiasinidae species (y-axis) based on the content (a) and skewness (b).
Animals 14 01598 g002
Figure 3. A+T content vs. AT-skew in the 48 mitogenomes of the order Characiformes. (a) Total genome; (b) PCGs; (c) tRNAs; (d) rRNAs.
Animals 14 01598 g003
Figure 4. Initiation codon (a) and termination codon (b) usage for the mitochondrial genome protein-coding genes of 48 Characiformes species.
Animals 14 01598 g004
Figure 5. RSCUs of three species of Nannostomus; the termination codon is not included.
Animals 14 01598 g005
Figure 6. Ka/Ks values for the 13 PCGs of four Nannostomus mitogenomes.
Animals 14 01598 g006
Figure 7. The organization of the control region in five Lebiasinidae mitochondrial genomes. The colored ovals indicate the tandem repeats; the remaining regions are shown with green boxes.
Animals 14 01598 g007
Figure 8. The BI (a) and ML (b) phylogenetic trees based on the nucleotide datasets for 13 PCGs from the mitogenomes of 49 species, with the common gene order and rearrangement within Characiformes (yellow boxes indicate the events of gene rearrangement).
Animals 14 01598 g008
Table 1. The mitogenomes of Characiformes and Cypriniformes used in this study.
Order.FamilyGenusSpeciesSize (bp)Accession No.
CharaciformesAlestidaeAbramitesAbramites hypselonotus16,685MW541938.1
MegaleporinusMegaleporinus elongatus16,774KU980144.1
Megaleporinus obtusidens16,682KY825191.1
PhenacogrammusPhenacogrammus interruptus16,652AB054129.1
BryconidaeBryconBrycon henni16,885KP027535.1
Brycon nattereri16,837MT428073.1
Brycon orbignyanus16,802KY825192.1
SalminusSalminus brasiliensis17,721KM245047.1
CharacidaeAstyanaxAstyanax aeneus16,769BK013055.1
Astyanax mexicanus16,768BK013062.1
HemigrammusHemigrammus armstrongi16,789MW742324.1
Hemigrammus bleheri17,021LC074360.1
Hemigrammus erythrozonus16,710MT484070.1
HyphessobryconHyphessobrycon amapaensis17,824MW742322.1
Hyphessobrycon elachys17,224MW315747.1
Hyphessobrycon flammeus16,008MW315748.1
Hyphessobrycon herbertaxelrodi17,417MT769327.1
Hyphessobrycon pulchripinnis17,618MW331227.1
MoenkhausiaMoenkhausia costae15,811MW366831.1
Moenkhausia sanctaefilomenae18,437MW407181.1
ParacheirodonParacheirodon axelrodi17,100AB898197.1
Paracheirodon innesi16,962KT783482.1
ChilodontidaeChilodusChilodus punctatus16,869AP011984.1
CitharinidaeCitharinusCitharinus congicus16,453AP011985.1
CurimatidaeCurimataCurimata mivartii16,705KP025764.1
CurimatopsisCurimatopsis evelynae16,779AP011988.1
DistichodontidaeDistichodusDistichodus sexfasciatus16,555AB070242.1
ErythrinidaeHopliasHoplias intermedius16,629KU523584.1
Hoplias malabaricus16,638AP011992.1
GasteropelecidaeCarnegiellaCarnegiella strigata17,852AP011983.1
HemiodontidaeHemiodopsisHemiodopsis gracilis16,731AP011990.1
HepsetidaeHepsetusHepsetus odoe16,803AP011991.1
LebiasinidaeLebiasinaLebiasina multimaculata16,899AP006766.1
NannostomusNannostomus beckfordi16,690OR857846
Nannostomus marilynae16,667OR857847
Nannostomus marginatus16,661OR857848
Nannostomus unifasciatus16,681OR857849
ParodontidaeApareiodonApareiodon affinis16,679AP011998.1
ProchilodontidaeIchthyoelephasIchthyoelephas longirostris16,840KP025763.1
ProchilodusProchilodus argenteus16,697KR014816.1
Prochilodus costatus16,699KR014817.1
Prochilodus lineatus16,699KM245045.1
SerrasalmidaeColossomaColossoma macropomum16,703KP188830.1
MetynnisMetynnis hypsauchen16,737MH358334.1
MyloplusMyloplus rubripinnis16,662MH358336.1
PiaractusPiaractus brachypomus16,722KJ993871.2
Piaractus mesopotamicus16,722KM245046.1
PygocentrusPygocentrus nattereri16,706AP012000.1
CypriniformesCyprinidaeCyprinusCyprinus carpio16,592OL693871.1
Table 2. General features of the mitogenomes of Nannostomus beckfordi, Nannostomus marilynae, Nannostomus marginatus, and Nannostomus unifasciatus.
GenePositionSize (bp)OrientationCodonIntergenic Nucleotides
(bp)
FromToInitiationTermination
tRNA-Phe1/1/1/170/70/71/7070/70/7/70+/+/+/+ 0/0/0/0
12S rRNA71/71/72/711026/1025/1024/1024956/955/953/954+/+/+/+ 0/0/0/0
tRNA-Val1026/1025/1024/10241097/1096/1095/109572/72/72/72+/+/+/+ −1/−1/−1/−1
16S rRNA1098/1097/1096/10962793/2786/2777/27851696/1690/1682/1690+/+/+/+ 0/0/0/0
tRNA-Leu2796/2789/2779/27882871/2864/2854/286376/76/76/76+/+/+/+ 2/2/1/2
ND12872/2865/2852/28643846/3839/3826/3838975/975/975/975+/+/+/+ATG/ATG/ATT/ATGTAG/TAA/TAA/TAA0/0/−3/0
tRNA-Ile3851/3843/3832/38423922/3914/3903/391372/72/72/72+/+/+/+ 4/3/5/3
tRNA-Gln3921/3913/3902/39123991/3983/3972/398271/71/71/71−/−/−/− −2/−2/−2/−2
tRNA-Met3992/3983/3973/39864061/4052/4042/405570/70/70/70+/+/+/+ 0/−1/0/3
ND24062/4053/4043/40565106/5099/5087/51001045/1047/1045/1045+/+/+/+ATG/ATG/ATG/ATGT/TAG/T/T0/0/0/0
tRNA-Trp5107/5098/5088/51015178/5169/5160/517272/72/73/72+/+/+/+ 0/−2/0/0
tRNA-Ala5182/5173/5163/51765250/5241/5231/524469/69/69/69−/−/−/− 3/3/2/3
tRNA-Asn5252/5243/5233/52465324/5315/5305/531873/73/73/73−/−/−/− 1/1/1/1
tRNA-Cys5354/5346/5337/53495420/5411/5402/541467/66/66/66−/−/−/− 29/30/31/30
tRNA-Tyr5421/5412/5403/54155490/5481/5470/548370/70/68/69−/−/−/− 0/0/0/0
COX15492/5483/5472/54857048/7039/7028/70411557/1557/1557/1557+/+/+/+GTG/GTG/GTG/GTGAGG/AGG/AGG/AGG1/1/1/1
tRNA-Ser7040/7031/7020/70337110/7101/7090/710371/71/71/71−/−/−/− −9/−9/−9/−9
tRNA-Asp7115/7106/7096/71087184/7175/7165/717770/70/70/70+/+/+/+ 4/4/5/4
COX27198/7189/7180/71927888/7879/7870/7882691/691/691/691+/+/+/+ATG/ATG/ATG/ATGT/T/T/T13/13/14/14
tRNA-Lys7889/7880/7871/78837962/7953/7944/795674/74/74/74+/+/+/+ 0/0/0/0
ATP87964/7955/7946/79588131/8122/8113/8125168/168/168/168+/+/+/+ATG/ATG/ATG/ATGTAA/TAA/TAA/TAA1/1/1/1
ATP68122/8113/8104/81168805/8796/8787/8799684/684/684/684+/+/+/+ATG/ATG/ATG/ATGTAA/TAA/TAA/TAA−10/−10/−10/−10
COX38805/8796/8787/87999590/9581/9572/9584786/786/786/786+/+/+/+ATG/ATG/ATG/ATGTAA/TAA/TAA/TAA−1/−1/−1/−1
tRNA-Gly9590/9581/9572/95849662/9652/9647/965573/72/76/72+/+/+/+ −1/−1/−1/−1
ND39663/9653/9648/965610,008/9998/9993/10,001346/346/346/346+/+/+/+ATG/ATG/ATG/ATGT/T/T/T0/0/0/0
tRNA-Arg10,009/9999/9994/10,00210,079/10,067/10,063/10,07171/69/70/70+/+/+/+ 0/0/0/0
ND4L10,080/10,068/10,064/10,07210,376/10,364/10,360/10,368297/297/297/297+/+/+/+ATG/ATG/ATG/ATGTAA/TAA/TAA/TAA0/0/0/0
ND410,370/10,358/10,354/10,36211,750/11,738/11,734/11,7421381/1381/1381/1381+/+/+/+ATG/ATG/ATG/ATGT/T/T/T−7/−7/−7/−7
tRNA-His11,752/11,740/11,735/11,74411,821/11,808/11,804/11,81370/69/70/70+/+/+/+ 1/1/0/1
tRNA-Ser11,822/11,809/11,805/11,81411,889/11,876/11,872/11,88168/68/68/68+/+/+/+ 0/0/0/0
tRNA-Leu11,891/11,878/11,874/11,88311,963/11,950/11,946/11,95573/73/73/73+/+/+/+ 1/1/1/1
ND511,964/11,951/11,947/11,95613,802/13,789/13,785/13,7941839/1839/1839/1839+/+/+/+ATG/ATG/ATG/ATGTAA/TAA/TAA/TAA0/0/0/0
ND613,799/13,786/13,782/13,79114,317/14,304/14,300/14,309519/519/519/519−/−/−/−ATG/ATG/ATG/ATGTAG/TAA/TAG/TAA−4/−4/−4/−4
tRNA-Glu14,318/14,305/14,301/14,31014,386/14,372/14,369/14,37769/68/69/68−/−/−/− 0/0/0/0
Cytb14,392/14,378/14,375/14,38315,534/15,520/15,518/15,5251143/1143/1144/1143+/+/+/+ATG/ATG/ATG/ATGTAA/TAA/T/TAA5/5/5/5
tRNA-Thr15,536/15,522/15,519/15,52715,607/15,595/15,592/15,59972/74/74/73+/+/+/+ 1/1/0/1
tRNA-Pro15,609/15,597/15,596/15,60115,678/15,666/15,664/15,67070/70/69/70−/−/−/− 1/1/3/1
CR15,679/15,667/15,665/15,67116,690/16,667/16,661/16,6811012/1001/997/1011 0/0/0/0
Disclaimer/Publisher’s Note: The statements, opinions and data contained in all publications are solely those of the individual author(s) and contributor(s) and not of MDPI and/or the editor(s). MDPI and/or the editor(s) disclaim responsibility for any injury to people or property resulting from any ideas, methods, instructions or products referred to in the content.

