
Hemogram-Derived Inflammatory Markers in Cats with Chronic Kidney Disease

Abstract
:Simple Summary
Abstract
1. Introduction
2. Materials and Methods
Statistical Analysis
3. Results
4. Discussion
5. Conclusions
Author Contributions
Funding
Institutional Review Board Statement
Informed Consent Statement
Data Availability Statement
Acknowledgments
Conflicts of Interest
References
- Lulich, J.P.; Osborne, C.A.; O’Brien, T.D.; Polzin, D.J. Feline renal failure: Questions, answers, questions. Compend. Contin. Educ. Pract. Vet. 1992, 14, 127–152. [Google Scholar]
- Bartlett, P.C.; Van Buren, J.W.; Bartlett, A.D.; Zhou, C. Case-control study of risk factors associated with feline and canine chronic kidney disease. Vet. Med. Int. 2010, 2010, 957570. [Google Scholar] [CrossRef]
- SDMA Impacts How Veterinarians Diagnose and Manage Kidney Disease in Dogs and Cats. Available online: https://www.idexx.com/files/sdma-data-white-paper.pdf (accessed on 5 June 2024).
- Jepson, R.E.; Brodbelt, D.; Vallance, C.; Syme, H.M.; Elliott, J. Evaluation of predictors of the development of azotemia in cats. J. Vet. Intern. Med. 2009, 23, 806–813. [Google Scholar] [CrossRef] [PubMed]
- Syme, H.M.; Markwell, P.J.; Pfeiffer, D.; Elliott, J. Survival of cats with naturally occuring chronic renal failure is related to severity of proteinuria. J. Vet. Intern. Med. 2006, 20, 528–535. [Google Scholar] [CrossRef] [PubMed]
- Boyd, L.; Langston, C.; Thompson, K.; Zivin, K.; Imanishi, M. Survival in cats with naturally occurring chronic kidney disease (2000–2002). J. Vet. Intern. Med. 2008, 22, 1111–1117. [Google Scholar] [CrossRef] [PubMed]
- Brown, C.A.; Elliott, J.; Schmiedt, C.W.; Brown, S.A. Chronic Kidney Disease in Aged Cats: Clinical Features, Morphology, and Proposed Pathogeneses. Vet. Pathol. 2016, 53, 309–326. [Google Scholar] [CrossRef]
- Morais, G.B.; Viana, D.A.; Verdugo, J.M.; Roselló, M.G.; Porcel, J.O.; Rocha, D.D.; Xavier Júnior, F.A.F.; Barbosa, K.D.S.M.; Silva, F.M.O.; Brito, G.A.C.; et al. Morphological characterization of ckd in cats: Insights of fibrogenesis to be recognized. Microsc. Res. Tech. 2018, 81, 46–57. [Google Scholar] [CrossRef]
- Chakrabarti, S.; Syme, H.M.; Brown, C.A.; Elliott, J. Histomorphometry of feline chronic kidney disease and correlation with markers of renal dysfunction. Vet. Pathol. 2013, 50, 147–155. [Google Scholar] [CrossRef]
- McLeland, S.M.; Cianciolo, R.E.; Duncan, C.G.; Quimby, J.M. A comparison of biochemical and histopathologic staging in cats with chronic kidney disease. Vet. Pathol. 2015, 52, 524–534. [Google Scholar] [CrossRef]
- Lourenço, B.N.; Coleman, A.E.; Tarigo, J.L.; Berghaus, R.D.; Brown, C.A.; Rissi, D.R.; Stanton, J.B.; Brown, S.A.; Schmiedt, C.W. Evaluation of profibrotic gene transcription in renal tissues from cats with naturally occurring chronic kidney disease. J. Vet. Intern. Med. 2020, 34, 1476–1487. [Google Scholar] [CrossRef]
- Haag-Weber, M.; Horl, W.H. Dysfunction of polymorphonu-clear leukocytes in uremia. Semin. Nephrol. 1996, 16, 192–201. [Google Scholar] [PubMed]
- Keegan, R.F.; Webb, C.B. Oxidative stress and neutrophil function in cats with chronic renal failure. J. Vet. Intern. Med. 2010, 24, 514–519. [Google Scholar] [CrossRef]
- Petrucci, G.N.; Lobo, L.; Queiroga, F.; Martins, J.; Prada, J.; Pires, I.; Henriques, J. Neutrophil-to-lymphocyte ratio is an independent prognostic marker for feline mammary carcinomas. Vet. Comp. Oncol. 2021, 19, 482–491. [Google Scholar] [CrossRef] [PubMed]
- Chiti, L.E.; Martano, M.; Ferrari, R.; Boracchi, P.; Giordano, A.; Grieco, V.; Buracco, P.; Iussich, S.; Giudice, C.; Miniscalco, B.; et al. Evaluation of leukocyte counts and neutrophil-to-lymphocyte ratio as predictors of local recurrence of feline injection site sarcoma after curative intent surgery. Vet. Comp. Oncol. 2020, 18, 105–116. [Google Scholar] [CrossRef] [PubMed]
- Fries, R.C.; Kadotani, S.; Stack, J.P.; Kruckman, L.; Wallace, G. Prognostic Value of Neutrophil-to-Lymphocyte Ratio in Cats With Hypertrophic Cardiomyopathy. Front. Vet. Sci. 2022, 9, 813524. [Google Scholar] [CrossRef] [PubMed]
- Neumann, S. Neutrophil-to-lymphocyte and platelet-to-lymphocyte ratios in dogs and cats with acute pancreatitis. Vet. Clin. Pathol. 2021, 50, 45–51. [Google Scholar] [CrossRef] [PubMed]
- Gori, E.; Pierini, A.; Lippi, I.; Lubas, G.; Marchetti, V. Leukocytes ratios in feline systemic inflammatory response syndrome and sepsis: A retrospective analysis of 209 cases. Animals 2021, 11, 1644. [Google Scholar] [CrossRef]
- Donato, G.; Pennisi, M.G.; Persichetti, M.F.; Archer, J.; Masucci, M. A Retrospective Comparative Evaluation of Selected Blood Cell Ratios, Acute Phase Proteins, and Leukocyte Changes Suggestive of Inflammation in Cats. Animals 2023, 13, 2579. [Google Scholar] [CrossRef]
- Brito, G.M.C.; Fontenele, A.M.M.; Carneiro, E.C.R.L.; Nogueira, I.A.L.; Cavalcante, T.B.; Vale, A.A.M.; Monteiro, S.C.M.; Filho, N.S. Neutrophil-to-Lymphocyte and Platelet-to-Lymphocyte Ratios in Nondialysis Chronic Kidney Patients. Int. J. Inflam. 2021, 2021, 6678960. [Google Scholar] [CrossRef]
- Mureșan, A.V.; Russu, E.; Arbănași, E.M.; Kaller, R.; Hosu, I.; Arbănași, E.M.; Voidăzan, S.T. The Predictive Value of NLR, MLR, and PLR in the Outcome of End-Stage Kidney Disease Patients. Biomedicines 2022, 10, 1272. [Google Scholar] [CrossRef]
- Li, L.; Chen, K.; Wen, C.; Ma, X.; Huang, L. Association between systemic immune-inflammation index and chronic kidney disease: A population-based study. PLoS ONE 2024, 19, 0292646. [Google Scholar] [CrossRef] [PubMed]
- Jewell, D.E.; Tavener, S.K.; Hollar, R.L.; Panickar, K.S. Metabolomic changes in cats with renal disease and calcium oxalate uroliths. Metabolomics 2022, 18, 68. [Google Scholar] [CrossRef] [PubMed]
- Krofič Žel, M.; Tozon, N.; Nemec Svete, A. Plasma and erythrocyte glutathione peroxidase activity, serum selenium concentration, and plasma total antioxidant capacity in cats with IRIS stages I-IV chronic kidney disease. J. Vet. Intern. Med. 2014, 28, 130–136. [Google Scholar] [CrossRef] [PubMed]
- Krofič Žel, M.; Nemec Svete, A.; Jakovac Strajn, B.; Pavšič Vrtač, K.; Vovk, T.; Kejžar, N.; Pavlin, D. The effect of a specific chicken based renal diet as monotherapy on clinical, biochemical, urinary and serum oxidative stress parameters in cats with CKD stage 1 and 2. Slov. Vet. Res. 2023, 60, 25–35. [Google Scholar] [CrossRef]
- IRIS Staging of Ckd 2019. Available online: http://www.iris-kidney.com/pdf/IRIS_Staging_of_CKD_modified_2019.pdf (accessed on 5 January 2020).
- Schober, P.; Boer, C.; Schwarte, L.A. Correlation Coefficients: Appropriate Use and Interpretation. Anesth. Analg. 2018, 126, 1763–1768. [Google Scholar] [CrossRef] [PubMed]
- Tagawa, M.; Shimbo, G.; Miyahara, K. Prognostic role of lymphocyte to monocyte ratio in feline high-grade lymphomas. Can. Vet. J. 2021, 62, 1095–1103. [Google Scholar] [PubMed]
- Solak, Y.; Yilmaz, M.I.; Sonmez, A.; Saglam, M.; Cakir, E.; Unal, H.U.; Gok, M.; Caglar, K.; Oguz, Y.; Yenicesu, M.; et al. Neutrophil to Lymphocyte Ratio Independently Predicts Cardiovascular Events in Patients with Chronic Kidney Disease. Clin. Exp. Nephrol. 2013, 17, 532–540. [Google Scholar] [CrossRef] [PubMed]
- Altunoren, O.; Akkus, G.; Sezal, D.T.; Ciftcioglu, M.; Guzel, F.B.; Isiktas, S.; Torun, G.I.; Uyan, M.; Sokmen, M.F.; Sevim, H.A.; et al. Does neutrophyl to lymphocyte ratio really predict chronic kidney disease progression? Int. Urol. Nephrol. 2019, 51, 129–137. [Google Scholar] [CrossRef] [PubMed]
- Kato, S.; Abe, T.; Lindholm, B.; Maruyama, S. Neutrophil/Lymphocyte Ratio: A Promising Prognostic Marker in Patients with Chronic Kidney Disease. Inflamm. Cell Signal 2015, 2, 132–137. [Google Scholar]
- Woziwodzka, K.; Dziewierz, A.; Pawica, M.; Panek, A.; Krzanowski, M.; Gołasa, P.; Latacz, P.; Burkat, M.; Kuźniewski, M.; Krzanowska, K. Neutrophil-to-Lymphocyte Ratio Predicts Long-Term All-Cause Mortality in Patients with Chronic Kidney Disease Stage 5. Folia Med. Cracoviensia 2019, 59, 55–70. [Google Scholar] [CrossRef]
- Zhang, J.; Lu, X.; Wang, S.; Li, H. High Neutrophil-to-Lymphocyte Ratio and Platelet-to-Lymphocyte Ratio Are Associated with Poor Survival in Patients with Hemodialysis. BioMed. Res. Int. 2021, 2021, 9958081. [Google Scholar] [CrossRef]
- Umeres-Francia, G.; Rojas-Fernández, M.; Añazco, P.H.; Benites-Zapata, V. Neutrophil to Lymphocyte Ratio and Platelet to Lymphocyte Ratio as a Risk Factor for Mortality in Peruvian Adults with Chronic Kidney Disease. Ren. Replace. Ther. 2022, 8, 30. [Google Scholar] [CrossRef]
- Duan, S.; Sun, L.; Zhang, C.; Wu, L.; Nie, G.; Huang, Z.; Xing, C.; Zhang, B.; Yuan, Y. Association of Platelet-to-Lymphocyte Ratio with Kidney Clinicopathologic Features and Renal Outcomes in Patients with Diabetic Kidney Disease. Int. Immunopharmacol. 2021, 93, 107413. [Google Scholar] [CrossRef]
- Betjes, M.G.; Langerak, A.W.; van der Spek, A.; de Wit, E.A.; Litjens, N.H. Premature aging of circulating T cells in patients with end-stage renal disease. Kidney Int. 2011, 80, 208–217. [Google Scholar] [CrossRef] [PubMed]
- Meijers, R.W.; Litjens, N.H.; de Wit, E.A.; Langerak, A.W.; van der Spek, A.; Baan, C.C.; Weimar, W. Uremia causes premature ageing of the T cell compartment in end-stage renal disease patients. Immun. Ageing 2012, 9, 19. [Google Scholar] [CrossRef]
- Kim, S.M.; Kim, H.W. Relative lymphocyte count as a marker of progression of chronic kidney disease. Int. Urol. Nephrol. 2014, 46, 1395–1401. [Google Scholar] [CrossRef]
- Kralova-Kovarikova, S.; Leva, L.; Knotek, Z.; Toman, M. Changes in lymphocyte function and subset counts in cats with spontaneous chronic kidney disease. Vet. Med. 2016, 61, 553–559. [Google Scholar] [CrossRef]
- Zahorec, R. Neutrophil-to-lymphocyte ratio, past, present, and future perspectives. Bratisl. Lek. Listy 2021, 122, 474–488. [Google Scholar] [CrossRef] [PubMed]
- Kovesdy, C.P.; George, S.M.; Anderson, J.E.; Kalantar-Zadeh, K. Outcome predictability of biomarkers of protein-energy wasting and inflammation in moderate and advanced chronic kidney disease. Am. J. Clin. Nutr. 2009, 90, 407–414. [Google Scholar] [CrossRef]
- Agarwal, R.; Light, R.P. Patterns and prognostic value of total and differential leukocyte count in chronic kidney disease. Clin. J. Am. Soc. Nephrol. 2011, 6, 1393–1399. [Google Scholar] [CrossRef]
- King, J.N.; Tasker, S.; Gunn-Moore, D.A.; Strehlau, G.; BENRIC (Benazepril in Renal Insufficiency in Cats) Study Group. Prognostic factors in cats with chronic kidney disease. J. Vet. Intern. Med. 2007, 21, 906–916. [Google Scholar] [CrossRef]
- Arai, Y.; Kanda, E.; Iimori, S.; Noda, Y.; Sasaki, S.; Sohara, E.; Okado, T.; Rai, T. Low white blood cell count is independently associated with chronic kidney disease progression in the elderly: The CKD-ROUTE study. Clin. Exp. Nephrol. 2018, 22, 291–298. [Google Scholar] [CrossRef]
- Latimer, K.; Prasse, K.W. Leukocytes. In Duncan & Prasse’s Veterinary Laboratory Medicine: Clinical Pathology, 4th ed.; Latimer, K., Mahaffey, E.A., Prasse, K.W., Eds.; Blackwell Publishing: Ames, Iowa, 2003; pp. 46–79. [Google Scholar]
- Howard, L.A.; Woolcock, A.D.; Christian, J.A.; Moore, G.E. Thrombocytosis in 158 cats (2011–2018). J. Feline Med. Surg. 2023, 25, 1098612X231185680. [Google Scholar] [CrossRef] [PubMed]
- Rizzo, F.; Tappin, S.W.; Tasker, S. Thrombocytosis in cats: A retrospective study of 51 cases (2000–2005). J. Feline Med. Surg. 2007, 9, 319–325. [Google Scholar] [CrossRef]
- Benson, K.K.; Quimby, J.M.; Shropshire, B.; Summers, S.C.; Dowers, K.L. Evaluation of platelet function in cats with and without kidney disease: A pilot study. J. Feline Med. Surg. 2021, 23, 715–721. [Google Scholar] [CrossRef]
- Stockham, S.L.; Scott, M.A. Hemostasis. In Fundamentals of Veterinary Clinical Pathology; Stockham, S.L., Scott, M.A., Eds.; Blackwell: Ames, Iowa, 2002; pp. 155–226. [Google Scholar]
- López-Escobar, A.; Madurga, R.; Castellano, J.M.; de Aguiar, S.R.; Velázquez, S.; Bucar, M.; Jimeno, S.; Ventura, P.S. Hemogram as marker of in-hospital mortality in COVID-19. J. Investig. Med. 2021, 69, 962–969. [Google Scholar] [CrossRef] [PubMed]
- Zhou, D.; Yang, H.; Zeng, L.; Yang, W.; Guo, F.; Cui, W.; Chen, C.; Zhao, J.; Wu, S.; Yang, N.; et al. Calculated inflammatory markers derived from complete blood count results, along with routine laboratory and clinical data, predict treatment failure of acute peritonitis in chronic peritoneal dialysis patients. Ren. Fail. 2023, 45, 2179856. [Google Scholar] [CrossRef]
- Zhu, X.; Cheang, I.; Xu, F.; Gao, R.; Liao, S.; Yao, W.; Zhou, Y.; Zhang, H.; Li, X. Long-term prognostic value of inflammatory biomarkers for patients with acute heart failure: Construction of an inflammatory prognostic scoring system. Front. Immunol. 2022, 13, 1005697. [Google Scholar] [CrossRef] [PubMed]
- Asaduzzaman, M.D.; Bhuia, M.R.; Alam, Z.N.; Bari, M.Z.J.; Ferdousi, T. Role of hemogram-derived ratios in predicting intensive care unit admission in COVID-19 patients: A multicenter study. IJID Reg. 2022, 3, 234–241. [Google Scholar] [CrossRef]
- Ozdemir, A.; Kocak, S.Y.; Karabela, S.N.; Yılmaz, M. Can systemic immune inflammation index at admission predict in-hospital mortality in chronic kidney disease patients with SARS-CoV-2 infection? Nefrologia 2022, 42, 549–558. [Google Scholar] [CrossRef]
- Tvedten, H.W.; Ljusner, J.; Lilliehöök, I.E. Enumeration of feline platelets in ethylenediamine tetra-acetic acid anticoagulated blood with the ADVIA 2120 system and two manual methods: Leucoplate and Thrombo-TIC. J. Vet. Diagn. Investig. 2013, 25, 493–497. [Google Scholar] [CrossRef] [PubMed]
- Tvedten, H.W.; Bäcklund, K.; Lilliehöök, I.E. Reducing error in feline platelet enumeration by addition of Iloprost to blood specimens: Comparison to prostaglandin E1 and EDTA. Vet. Clin. Pathol. 2015, 44, 179–187. [Google Scholar] [CrossRef] [PubMed]
- Tvedten, H.W.; Andersson, V.; Lilliehöök, I.E. Feline Differential Leukocyte Count with ProCyte Dx: Frequency and Severity of a Neutrophil-Lymphocyte Error and How to Avoid It. J. Vet. Intern. Med. 2017, 31, 1708–1716. [Google Scholar] [CrossRef] [PubMed]
- Habenicht, L.M.; Webb, T.L.; Clauss, L.A.; Dow, S.W.; Quimby, J.M. Urinary cytokine levels in apparently healthy cats and cats with chronic kidney disease. J. Feline Med. Surg. 2013, 15, 99–104. [Google Scholar] [CrossRef] [PubMed]
- Lawson, J.S.; Syme, H.M.; Wheeler-Jones, C.P.; Elliott, J. Urinary active transforming growth factor β in feline chronic kidney disease. Vet. J. 2016, 214, 1–6. [Google Scholar] [CrossRef]
- Uva, A.; Cavalera, M.A.; Gusatoaia, O.; Donghia, R.; Gernone, F.; Silvestrino, M.; Zatelli, A. Inflammatory Status and Chronic Kidney Disease in Cats: Old and New Inflammatory Markers—A Pilot Prospective Study. Animals 2023, 13, 3674. [Google Scholar] [CrossRef]


| Control Group | IRIS 1+2 | IRIS 3+4 | |
|---|---|---|---|
| n | 32 | 62 (20 IRIS 1/42 IRIS 2) | 26 (13 IRIS 3/13 IRIS 4) |
| Sex (M/F) | 18/14 | 35/27 | 9/17 |
| Age NN (years) | 6.5 a (3.0–19.0) [25th: 4.6–75th: 10.0] | 10.0 (4.3–12.5) [25th: 6.0–75th: 14.0] | 12.5 (4.9–10.3) [25th: 10.0–75th: 15.8] |
| Body Weight NN (kg) | 4.68 (2.80–8.00) [25th: 3.8–75th: 5.6] | 4.58 (2.72–9.10) [25th: 3.8–75th: 5.9] | 3.25 b (2.00–7.40) [25th: 3.0–75th: 4.3] |
| Urea NN (mmol/L) | 10.2 (6.4–14.2) [25th: 8.2–75th: 11.1] | 11.3 (6.3–30.9) [25th: 9.2–75th: 14.3] | 34.3 c (19.8–34.3) [25th: 25.8–75th: 58.1] |
| Creatinine NN (µmol/L) | 131.5 d (90.9–148.1) [25th: 116.2–75th: 135.9] | 163.7 e (104.8–246.2) [25th:137.7–75th: 182.9] | 415.4 (254.70–2473.8) [25th: 290.1–75th: 738.8] |
| RBC N (×1012/L) | 8.64 ± 1.53 (4.47–11.48) | 8.76 ± 1.46 (5.31–13.13) | 6.67 ± 1.51 c (3.38–9.77) |
| HGB N (g/L) | 125.6 ± 16.2 (91.0–151.0) | 121.9 ± 20.9 (54.0–163.0) | 98.8 ± 19.3 c (67.0–139.0) |
| HCT N (L/L) | 0.41 ± 0.06 (0.28–0.50) | 0.39 ± 0.06 (0.23–0.52) | 0.30 ± 0.06 c (0.15–0.440) |
| USG | 1.067 (1.034–1.080) [25th: 1.060–75th: 1.070] (n = 8) | 1.050 (1.016–1.082) [25th: 1.032–75th: 1.064] (n = 45) | |
| UPC | 0.139 (0.066–0.222) [25th: 0.090–75th: 0.160] (n = 9) | 0.160 (0.061–17.020) [25th: 0.099–75th: 0.320] (n = 45) | 0.864 c (0.143–3.760) [25th: 0.545–75th: 1.164] (n = 20) |
| Control Group | IRIS 1+2 | IRIS 3+4 | |
|---|---|---|---|
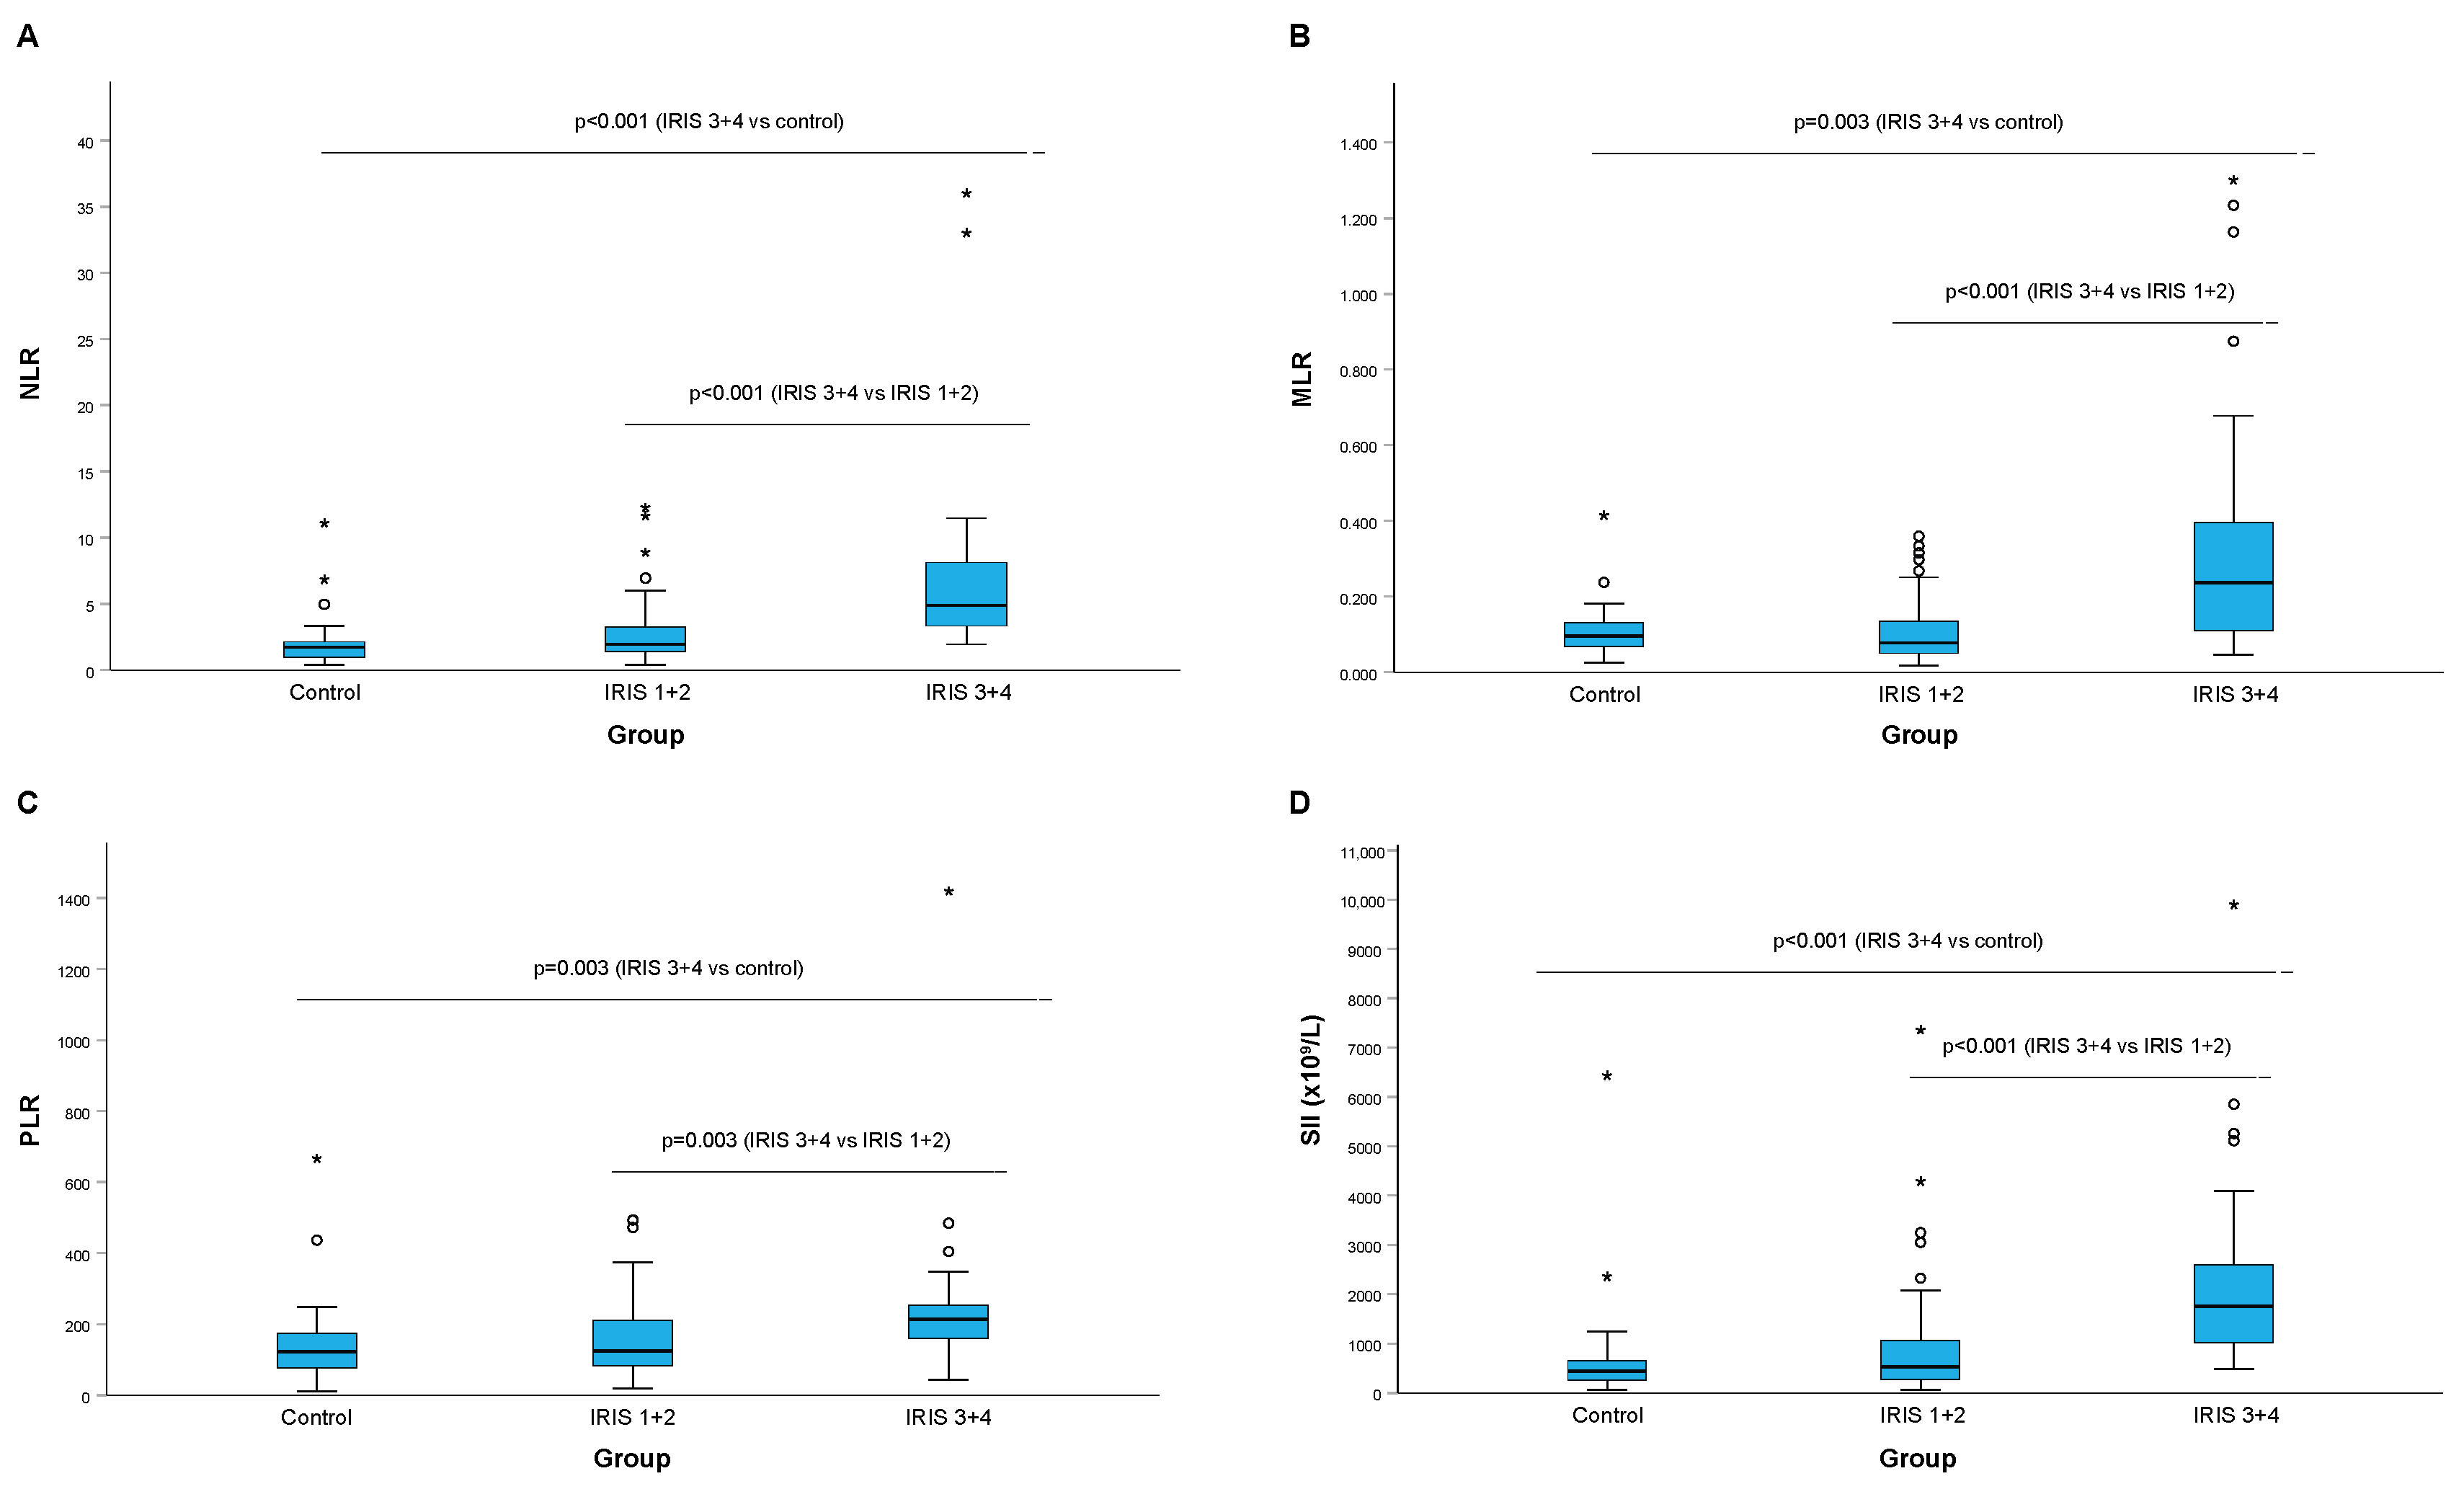
| NLR | 1.70 (0.42–11.09) [25th: 0.97–75th: 2.18] | 1.94 (0.39–11.88) [25th: 1.24–75th: 3.29] | 4.87 a (1.93–36.00) [25th: 3.21–75th: 8.12] |
| MLR | 0.095 (0.026–0.414) [25th: 0.067–75th: 0.132] | 0.075 (0.017; 0.359) [25th: 0.0475–75th: 0.136] | 0.240 b (0.046; 1.300) [25th: 0.110–75th: 0.550] |
| PLR | 123.3 (11.3–666.7) [25th: 74.11–75th: 175.9] | 124.9 (18.2–494.3) [25th: 80.4–75th: 214.6] | 205.6 c (42.4–1420.0) [25th: 157.7–75th: 253.7] |
| SII (×109/L) | 431.0 (53.4–6433.3) [25th: 261.2–75th: 659.7] | 527.9 (60.5–7360.6) [25th: 274.9–75th: 1056.4] | 1705.4 a (477.1–9900.0) [25th: 982.7–75th: 2600.2] |
| NLR | MLR | PLR | SII (×109/L) | |
|---|---|---|---|---|
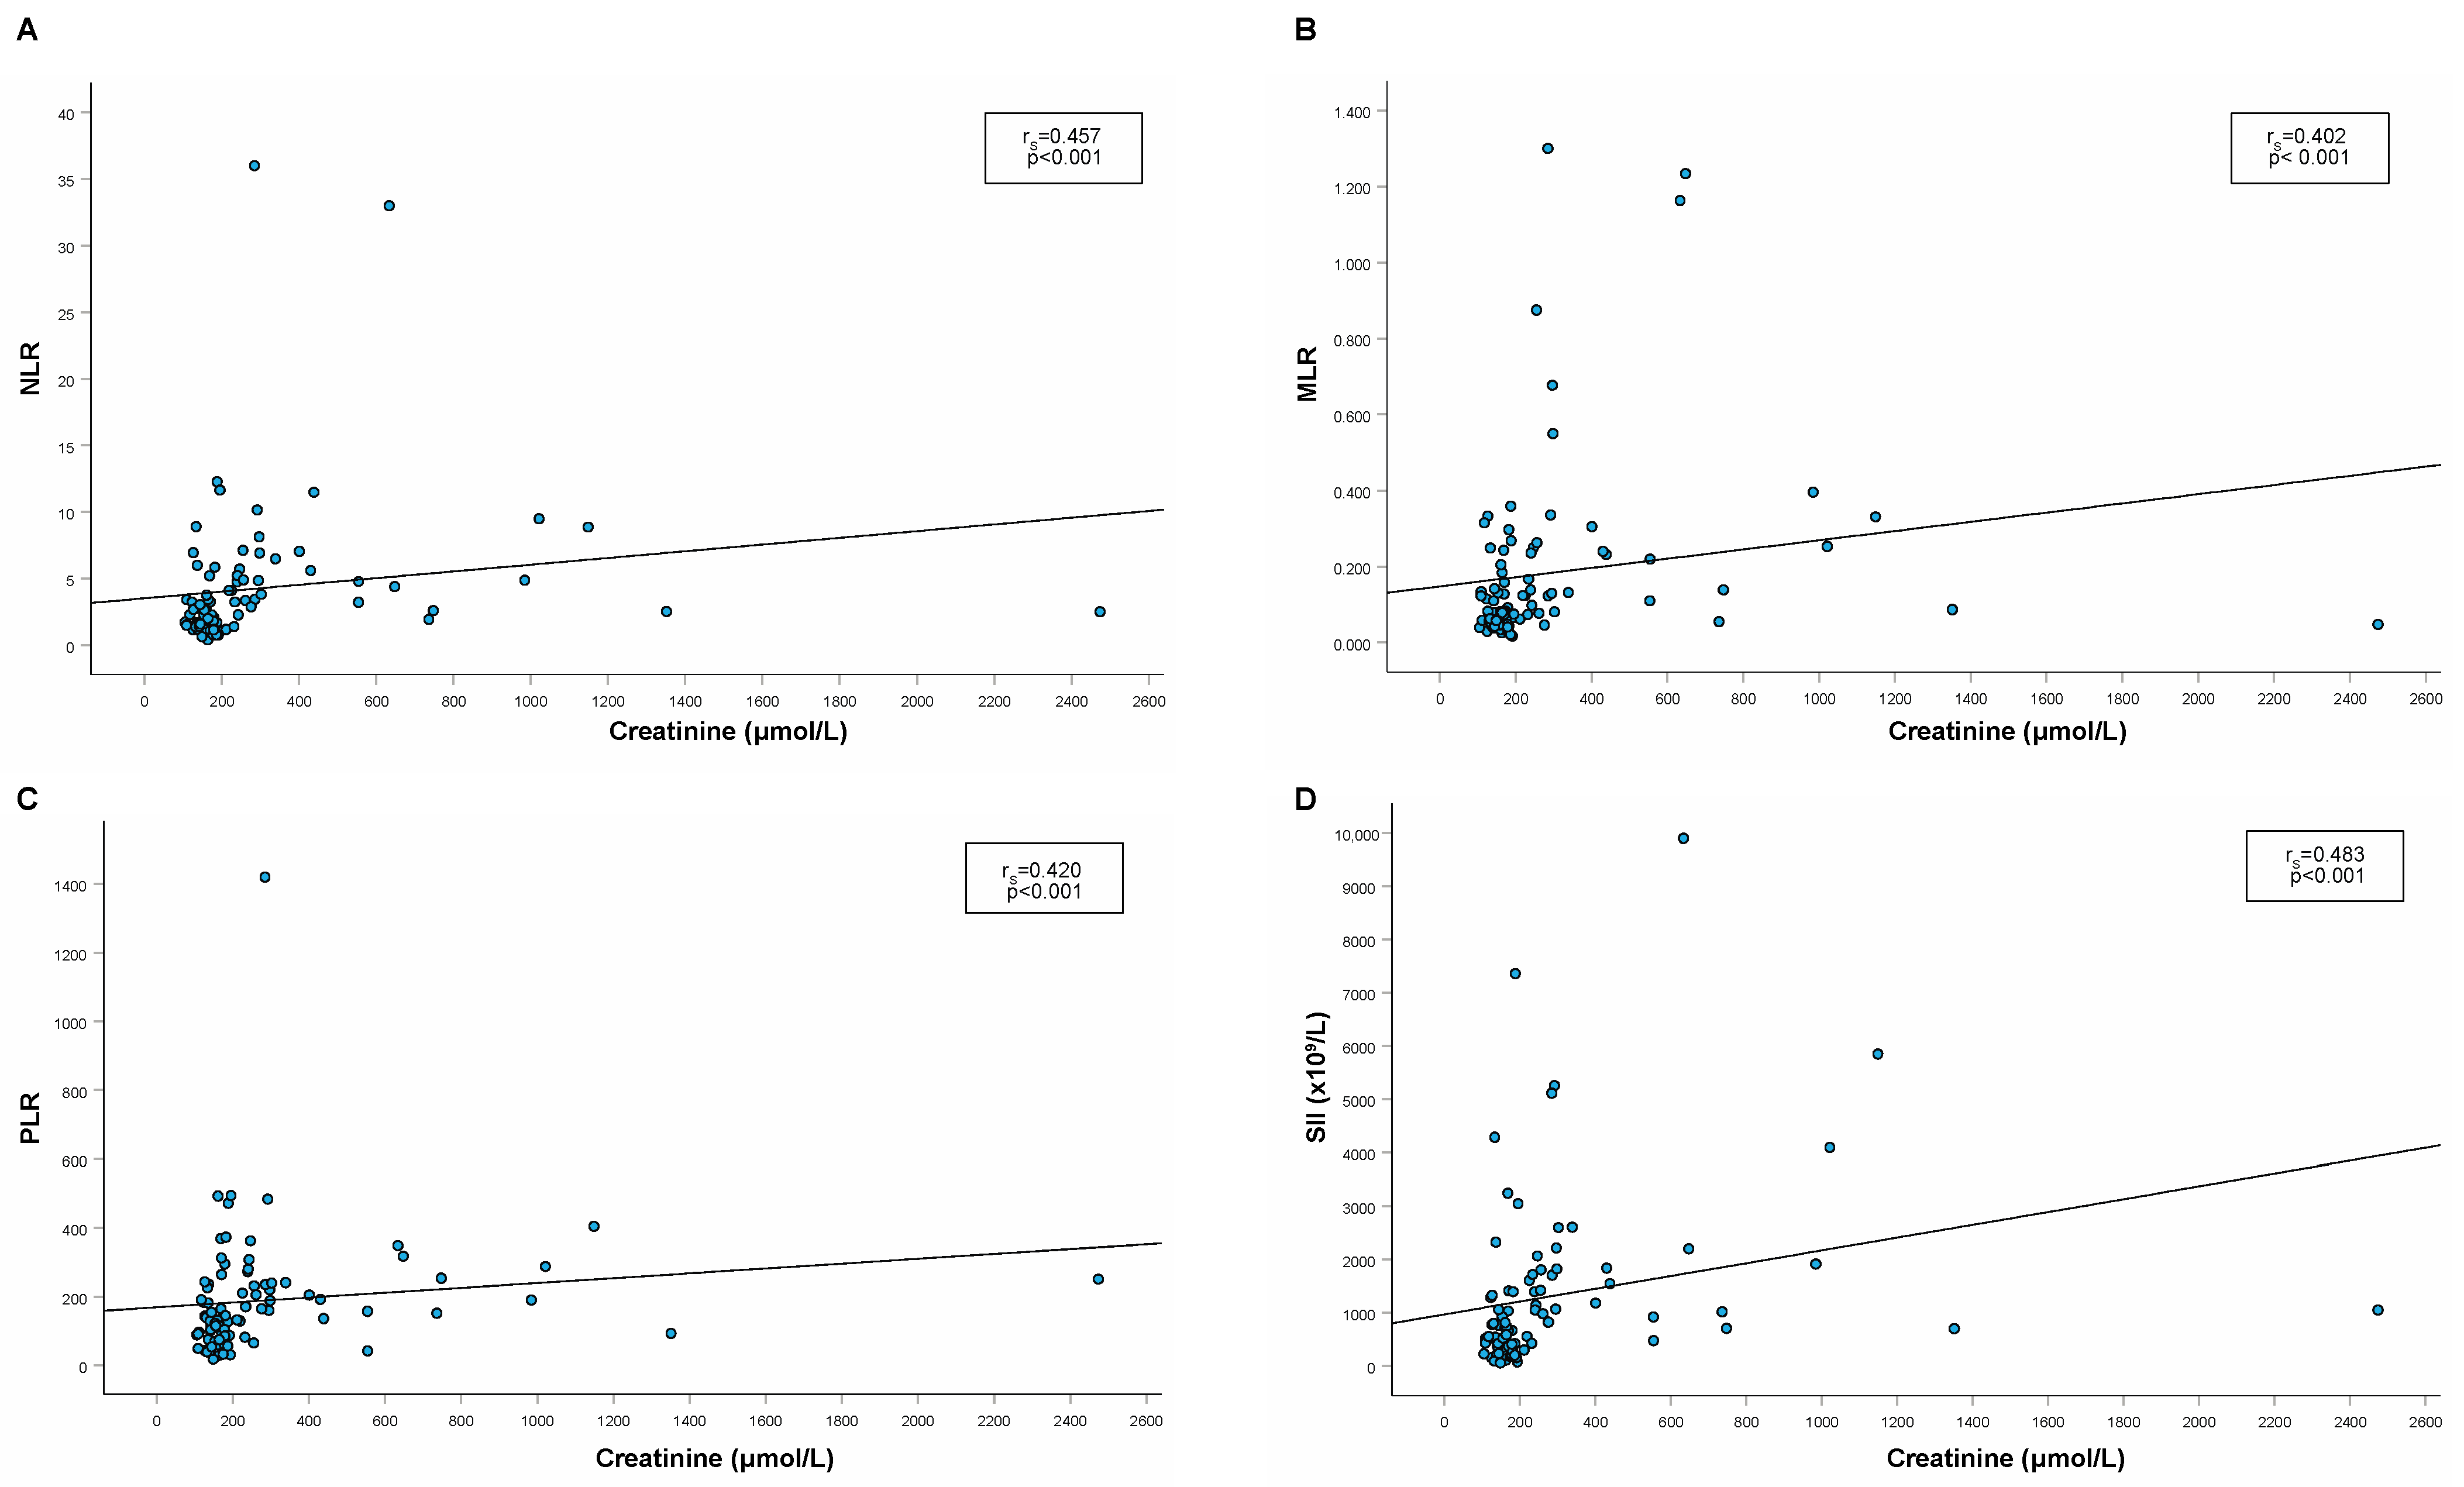
| RBC (×1012/L) (n = 88) | rS = −0.553 p < 0.001 | rS = −0.396 p < 0.001 | rS = −0.458 p < 0.001 | rS = −0.600 p < 0.001 |
| HGB (g/L) (n = 88) | rS = −0.436 p < 0.001 | rS = −0.286 p = 0.007 | rS = −0.354 p < 0.001 | rS = −0.530 p < 0.001 |
| HCT (L/L) (n = 88) | rS = −0.554 p < 0.001 | rS = −0.421 p < 0.001 | rS = −0.465 p < 0.001 | rS = −0.637 p < 0.001 |
| USG (n = 67) | rS = −0.584 p < 0.001 | rS = −0.462 p < 0.001 | rS = −0.439 p < 0.001 | rS = −0.638 p < 0.001 |
| UPC (n = 65) | rS = 0.641 p < 0.001 | rS = 0.549 p < 0.001 | rS = 0.451 p < 0.001 | rS = 0.661 p < 0.001 |
| Change in Hemogram | IRIS 1+2 (n = 62) | IRIS 3+4 (n = 26) |
|---|---|---|
| Leukopenia (WBC < 6.3 × 10⁹/L) | 19 (30.6%) | 2 (7.7%) |
| Lymphopenia (L < 2.0 × 10⁹/L) | 31 (50%) | 19 (73.1%) |
| Neutrophilia (N > 13.4 × 10⁹/L) | 2 (3.2%) | 7 (26.9%) |
| Neutropenia (N < 3.0 × 10⁹/L) | 13 (21.0%) | 2 (7.7%) |
| Monocytosis (M > 1.0 × 10⁹/L) | 0 (0%) | 2 (7.7%) |
| Thrombocytosis (P > 626.4 × 10⁹/L) | 0 (0%) | 2 (7.7%) |
| Thrombocytopenia (P < 156.4 × 10⁹/L) | 11 (17.7%) | 3 (11.5%) |
Disclaimer/Publisher’s Note: The statements, opinions and data contained in all publications are solely those of the individual author(s) and contributor(s) and not of MDPI and/or the editor(s). MDPI and/or the editor(s) disclaim responsibility for any injury to people or property resulting from any ideas, methods, instructions or products referred to in the content. |
© 2024 by the authors. Licensee MDPI, Basel, Switzerland. This article is an open access article distributed under the terms and conditions of the Creative Commons Attribution (CC BY) license (https://creativecommons.org/licenses/by/4.0/).
Share and Cite
Krofič Žel, M.; Nemec Svete, A.; Tozon, N.; Pavlin, D. Hemogram-Derived Inflammatory Markers in Cats with Chronic Kidney Disease. Animals 2024, 14, 1813. https://doi.org/10.3390/ani14121813
Krofič Žel M, Nemec Svete A, Tozon N, Pavlin D. Hemogram-Derived Inflammatory Markers in Cats with Chronic Kidney Disease. Animals. 2024; 14(12):1813. https://doi.org/10.3390/ani14121813
Chicago/Turabian StyleKrofič Žel, Martina, Alenka Nemec Svete, Nataša Tozon, and Darja Pavlin. 2024. "Hemogram-Derived Inflammatory Markers in Cats with Chronic Kidney Disease" Animals 14, no. 12: 1813. https://doi.org/10.3390/ani14121813