Simple Summary
As variations in the determination of basal endogenous losses can affect the estimation of the nutritional value of diets, this study used a proteomics approach to identify the composition of endogenous proteins in the ileal digesta of growing pigs fed with a nitrogen-free diet and a casein diet. The nitrogen-free diet increased the expression of proteins related to intestinal inflammation, the activation of innate antimicrobial host defense, cellular autophagy, and epithelial turnover in the ileal digesta. In contrast, the casein diet increased the proteins related to pancreatic and intestinal digestive secretions. These findings suggest that a casein diet could provide a more accurate estimation of basal endogenous losses.
Abstract
The accurate estimation of basal endogenous losses (BEL) of amino acids at the ileum is indispensable to improve nutrient utilization efficiency. This study used a quantitative proteomic approach to identify variations in BEL in the ileal digesta of growing pigs fed a nitrogen-free diet (NFD) or a casein diet (CAS). Eight barrow pigs (39.8 ± 6.3 kg initial body weight (BW)) were randomly assigned to a 2 × 2 crossover design. A total of 348 proteins were identified and quantified in both treatments, of which 101 showed a significant differential abundance between the treatments (p < 0.05). Functional and pathway enrichment analyses revealed that the endogenous proteins were associated with intestinal metabolic function. Furthermore, differentially abundant proteins (DAPs) in the digesta of pigs fed the NFD enriched terms and pathways that suggest intestinal inflammation, the activation of innate antimicrobial host defense, an increase in cellular autophagy and epithelial turnover, and reduced synthesis of pancreatic and intestinal secretions. These findings suggest that casein diets may provide a more accurate estimation of BEL because they promote normal gastrointestinal secretions. Overall, proteomic and bioinformatic analyses provided valuable insights into the composition of endogenous proteins in the ileal digesta and their relationship with the functions, processes, and pathways modified by diet composition.
1. Introduction
Standardized ileal digestibility (SID) values of amino acids are commonly used to improve nutrient utilization efficiency [1,2]. Calculating SID values requires the determination of the amino acid basal endogenous losses (BEL) [3]. Regardless of the dietary composition or feeding conditions, the gastrointestinal tract constantly synthesizes and secretes proteins into the intestinal lumen for the digestion and absorption of dietary components, which also acts as the first line of immune defense in the intestine [4]. These endogenous secretions, including saliva, bile, gastric, pancreatic, and intestinal secretions, as well as mucoproteins, intestinal epithelial cell shedding, bacterial proteins, and plasma proteins [5,6], are quantitatively greater than those of dietary origin [7,8]. Approximately 60–80% of the proteins secreted into the intestinal lumen are digested and reabsorbed [8], whereas the non-reabsorbed amino acids from endogenous proteins are quantified at the end of the ileum of pigs to estimate the endogenous losses of amino acids [9]. In pigs, BELs of amino acids are typically determined by feeding them a nitrogen-free diet (NFD) or a diet containing highly digestible protein [10,11,12,13,14,15]. However, while these methodologies determine the BEL of amino acids and allow for the standardization of ileal digestibility values, discrepancies in method selection arise because of variations in the estimated endogenous amino acids, which can affect the accuracy of estimating the nutritional value of dietary ingredients [3,16].
Furthermore, these methodologies do not provide information on the origin of the endogenous nitrogen responsible for the variations in amino acids found in the ileal flow, making it challenging to explain inconsistencies between methodologies or within the same method. Although previous studies have identified and quantified the sources of endogenous secretions leading to the amino acids found in the ileal digesta using different methodologies [4,17,18], these methodologies can be costly or challenging to implement routinely [6,19].
With advances in biotechnology, proteomic approaches based on mass spectrometry (MS) have emerged. These approaches allow the identification and quantification of numerous proteins of endogenous origin and the assessment of the impact of different dietary factors on intestinal secretions, even without prior knowledge of the proteins present in the sample [20]. This study aimed to use proteomics to identify and quantify endogenous proteins secreted in the intestine and those remaining in the ileal digesta of pigs fed an NFD and a diet containing highly digestible proteins. Gene Ontology (GO) and Kyoto Encyclopedia of Genes and Genomes (KEGG) pathway enrichment analyses were performed on the identified proteins to elucidate their functions and metabolic pathways associated with the variations in basal endogenous losses observed with different diets, which will provide a better understanding of the response of intestinal physiology to diet.
2. Materials and Methods
2.1. Experimental Design and Collection of Digesta Samples
The Institutional Committee for the Care and Use of Experimental Animals of the Faculty of Veterinary Medicine and Zootechnics of the UNAM approved the animal experimental procedures (Protocol SICUAE.DC-2021/2-2). The committee adhered to the guidelines of the Official Mexican Standard (NOM-062-ZOO-1999) [21] and the International Guiding Principles for Biomedical Research Involving Animals [22].
Eight barrows (GP8 × Fertilis, PIC) with an initial body weight (BW) of 39.8 ± 6.3 kg were surgically implanted with a T cannula in the distal ileum [23]. The pigs were individually housed in metabolic cages with slat floors (0.80 m2) equipped with a feeder and a nipple drinker. The cages were kept in a room with a controlled temperature (22–24 °C) and natural light. The pigs were randomly allocated to the AB (n = 4) or BA (n = 4) sequence in a 2 × 2 crossover design. In the AB sequence, pigs received the nitrogen-free diet (NFD) in period 1 and the casein diet (CAS) in period 2, while in the BA sequence, pigs received CAS in period 1 and the NFD in period 2; there were a total of 8 observations per treatment. Each experimental period lasted seven days, with a seven-day washout interval between experimental periods to enable the animals to return to their normal metabolic state before starting the next period. Table 1 shows the composition and nutrient content of the experimental diets. Titanium dioxide was added to the diets as a digestibility marker. (Ileal digestibility data not present.) The experimental diets were balanced in nutrients, except protein, to meet the nutrient recommendations for growing pigs [24]. Feeding was restricted to 2.5 times the digestible energy requirement for maintenance of 110 kcal/kg BW0.75 [25]. Feed was provided twice daily, and the pigs had ad libitum access to water throughout the experiment. Digesta samples were collected for 12 h on days six and seven of each period using plastic bags tied to the cannula cylinder [26]. At the end of the collection, the samples from each pig and each period were homogenized, and a 50 mL aliquot was stored at −80 °C for proteomic analyses.

Table 1.
Composition and nutrient content of experimental diets.
2.2. Proteomic Analysis of the Ileal Digesta
The ileal digesta samples were thawed (4 °C), homogenized, and centrifuged at 3000 rpm for 3 min. Supernatants were collected after centrifugation and the protein concentration of each sample was determined using a Bradford Protein Assay Quick Start kit (Bio-Rad Laboratories, Hercules, CA, USA) and a bovine serum albumin standard curve. Three technical replicates for each treatment were used for proteomic analyses to reduce individual variation. For the technical replicates, equiponderant proteins from the supernatant of each digesta sample were pooled per treatment and divided into three equal parts (n = 3) [27]. The supernatant proteins were precipitated with methanol–chloroform, and the resulting pellets was enzymatically digested using the iST Sample Preparation iST® kit (PreOmics, Munich, Germany) according to the protocol established by the manufacturer. The resulting peptides were dried using a Savant DNA120 SpeedVac Concentrator (Thermo Fisher Scientific, Waltham, MS, USA) and then resuspended with “LC-load” reagent (PreOmics, Munich, Germany). An aliquot of 2.5 μL from a stock of alcohol dehydrogenase 1 (ADH1) from Saccharomyces cerevisiae (Uniprot, accession number P00330; 1 pmol/μL) was added as an internal standard to each sample to obtain a final concentration of 25 fmol/µL (final volume of 100 μL). Finally, samples were stored at −20 °C until LC-MS analysis.
Label-free identification and quantification by MS was carried out using the methodology described by Rios-Castro [28], with some modifications; briefly, tryptic peptides were separated on an HSS T3 C18 column (Waters, Milford, MA, USA; 75 μm × 150 mm, 100 Å pore size, 1.8 μm particle size) using a UPLC ACQUITY M-Class with mobile phase A (0.1% formic acid (FA) in H2O) and mobile phase B (0.1% FA in acetonitrile (ACN)) under the gradient 0 min 7% B, 121.49 min 40% B, 123.15 to 126.46 min 85% B, and 129 to 130 min 7% B, at a flow of 400 nL·min−1 and 45 °C. The spectrum data were acquired in a Synapt G2-Si mass spectrometer (Waters, Milford, MA, USA) using nano electrospray ionization and ion mobility separation (IM-MS) using a data-independent acquisition (DIA) approach through High-Definition Multiplexed MS/MS (HDMSE) mode. For the ionization source, parameters were set with the following values: 2.75 kV in the sampling capillary, 30 V in the sampling cone, 30 V in the source offset, 70 °C for the source temperature, 0.5 bar for the nanoflow gas, and 150 L·h−1 for the purge gas flow. Two chromatograms were acquired (low- and high-energy chromatograms) in positive mode in a range of m/z 50−2000 with a scan time of 500 ms. No collision energy was applied to obtain the low-energy chromatograms, while for the high-energy chromatograms, the precursor ions were fragmented in the transfer cell using a collision energy ramp from 19 to 55 eV.
The data generated in the mass spectrometer in *.raw format were analyzed and quantified using the Progenesis QI v3.0.3 proteomics software (Waters, Milford, CT, USA) against the Sus scrofa reference database downloaded from UNIPROT (https://www.uniprot.org/ accessed on 31 January 2023). Sequences were concatenated in reverse sense in the same *.Fasta file used to apply the target–decoy strategy to deliver false-positive estimations. The parameters for the protein identification were trypsin as the cutting enzyme and one missed cleavage site allowed; carbamidomethyl (C) as fixed modification; and oxidation (M), amidation (C-terminal), desamidation (Q, N), and phosphorylation (S, T, Y) as variable modifications. Fragment mass tolerance was set to 20 ppm and 10 ppm for peptides. The protein false discovery rate was set to <1%. All false-positive identifications (reversed proteins) and proteins with 1 peptide identified were discarded for subsequent analysis. Protein quantification was performed using the Top3 method. This method quantifies proteins by averaging the spectrometric signal of the three most intense tryptic peptides of each protein for quantification [29].
2.3. Statistical and Bioinformatic Analysis
Statistical analyses and data visualization were performed using normalized protein quantification values for each protein. A one-way ANOVA was used to perform the significance test to determine differences in protein abundance between treatments. Fold change (FC) was calculated as the CAS/NFD ratio. Proteins with a p-value < 0.05 and log2 FC greater than 0.5 or less than −0.5 were considered differentially abundant proteins (DAP). A heatmap and volcano plot were generated using the R v.4.2.2 software (http://www.R-project.org accessed on 2 June 2023). GO (http://geneontology.org/ accessed on 2 June 2023 ) and KEGG pathway (http://www.genome.jp/kegg/ accessed on 2 June 2023) enrichment analyses were performed to assess the functions and biological pathways associated with the proteins identified in the digesta using the online platform ShinyGO against the Sus scrofa database [30]. The GO terms and KEGG pathways were considered significantly enriched with a p-value < 0.05, corrected by FDR (FDR < 0.05). GO enrichment analysis was used to classify the proteins into biological processes (BPs), cellular components (CCs), and molecular functions (MFs).
3. Results
3.1. Proteomic Characterization of Endogenous Proteins in the Ileal Digesta
In total, 348 endogenous proteins were identified and quantified in the ileal digesta. Table 2 shows the 20 most abundant endogenous proteins found in the ileal digesta. These proteins accounted for approximately 40% of the endogenous proteins identified in the ileal digesta of growing pigs fed the NFD or CAS diets. A complete list of the identified proteins is provided in Supplementary Material Table S1.
Table 2.
Top 20 most abundant endogenous proteins in the digesta.
GO and KEGG enrichment analyses were performed using the 348 identified proteins. The top 20 GO terms enriched for BPs, CCs, and MFs are shown in Figure 1. Additionally, the proteins identified in pig digesta significantly enriched eight KEGG pathways (Figure 1D). GO terms and KEGG pathways were associated with the maintenance of gut epithelium and function. A list of the proteins in each GO term and KEGG pathway is available in the Supplementary Material Table S2.
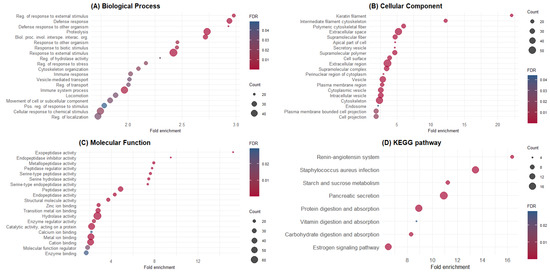
Figure 1.
Gene Ontology and KEGG pathway enrichment analysis of ileal endogenous proteins. (A) Biological process; (B) cellular compartment; (C) molecular function; (D) KEGG pathways. The y-axis shows significantly enriched GO terms and pathways, whereas the x-axis denotes fold enrichment. The size of dots represents the number of genes within this term or pathway, and dots’ colors represent the enrichment FDR.
3.2. Analysis of DAPs
Protein abundance analysis identified 101 DAPs between the NFD and CAS treatments. Figure 2 illustrates the changes in the abundance values of proteins and p-values using a volcano plot, and hierarchical clustering of the DAPs confirmed the presence of two distinct groups (Figure 3).
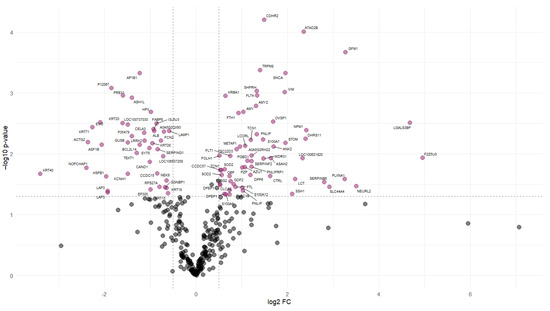
Figure 2.
Volcano plot of differentially abundant proteins. Volcano plot representing each protein with a dot. The “x” axis represents the log2 FC between CAS and NFD and the “y” axis represents the p-value (−log10). The dashed lines indicate the significance limit in the p-value and FC. Gray dots represent proteins with non-significant changes in abundance. Colored dots represent proteins that significantly increase (right) or decrease (left) their abundance in the digesta of pigs fed CAS diets.
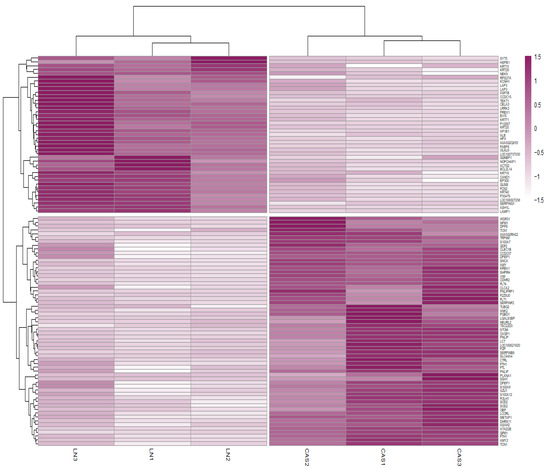
Figure 3.
Heatmap of differentially abundant proteins (DAPs). Heatmap representing the hierarchical clustering of DAPs. Rows correspond to proteins and columns to samples. Colors represent the abundance values of proteins between NFD and CAS treatments.
The analysis revealed 60 proteins with high abundance in the CAS treatment (Table 3) and 41 in the NFD treatment (Table 4).
Table 3.
Proteins with high abundance in the digesta of pigs fed CAS diets.
Table 4.
Proteins with high abundance in the digesta of pigs fed NFD.
Separate GO and KEGG pathway enrichment analyses were performed for DAPs, which were highly abundant in the digesta of pigs fed CAS or NFD. Functional enrichment analysis of DAPs in the digesta of CAS-fed pigs revealed 17 GO terms significantly enriched for MFs and a CC term, cellular space (Figure 4A), and the KEGG pathway enrichment analysis revealed six significantly enriched pathways (Figure 4B). In contrast, DAPs in the NFD treatment revealed nine significantly enriched GO terms (Figure 4A) and four KEGG pathways (Figure 4B). The list of proteins within each GO term and KEGG pathway is available in the Supplementary Material Table S3.
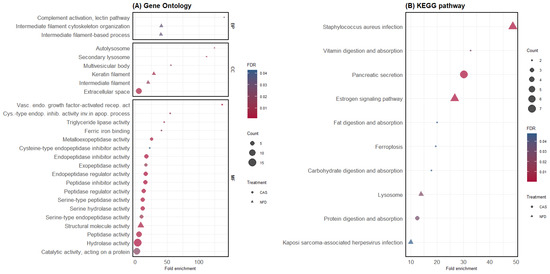
Figure 4.
GO and KEGG pathway enrichment analysis of differentially abundant proteins. (A) GO enrichment analysis. The y-axis shows significantly enriched GO terms; BP: biological process, MF: molecular function, CC: cellular component (for each treatment (CAS and NFD)). The x-axis represents the fold enrichment, and the size of the dots represents the number of genes within each term. The colors of the dots represent the FDR enrichment. (B) KEGG pathway enrichment analysis. The x-axis displays the fold enrichment and the pathways enriched in CAS and NFD.
4. Discussion
The quantification of basal endogenous losses and the factors that affect them is essential to improve nitrogen use efficiency [19]. A proteomic approach was utilized to identify and quantify the endogenous protein composition in the ileal digesta of pigs fed NFD and CAS. The identified proteins give rise to the amino acids determined by conventional methods in ileal digestibility studies. Therefore, the findings of this study represent an approach to identify the origin of endogenous losses modified by diet composition, complementing the available information about endogenous protein losses [31]. A large number of endogenous proteins were identified in the ileal digesta. Functional enrichment analysis is a method for assigning functional annotations to proteins and grouping them into GO terms and KEGG pathways, reducing the complexity of individual protein analysis. This analysis allowed for the identification of biological and metabolic changes in the intestine modified by dietary composition, providing deeper insights into the impacts of the diets on basal endogenous loss secretions.
The identified endogenous proteins were associated with metabolic and physiological functions of the intestine, including nutrient transport, digestion, absorption, and immune responses, similar to other proteomic studies in pigs [27,32,33,34,35]. The intestinal epithelium is exposed to various external stimuli, leading to the expression of proteins that interact with feed and microorganisms in the intestinal lumen [36]. In this study, we identified proteins associated with the response to external stimuli, including chemical, physical, and other organismal stimuli. In addition, processes related to the immune response, the regulation of localization, cellular transport, and proteolysis were also highlighted.
To maintain physiological functions and intestinal homeostasis, the intestine contains secretory cells responsible for the continuous release of significant quantities of proteins into the intestinal lumen [37]. The secretory cells in the intestinal epithelium include mucus-producing goblet cells, antimicrobial peptide-secreting Paneth cells, hormone-secreting enteroendocrine cells, and rare infection-mediating tuft cells. These epithelial cells provide the first line of chemical and physical defense against external factors to ensure a stable internal environment, supporting efficient digestion and absorption of nutrients [38]. These findings align with the results of the present study, which identified enriched terms associated with extracellular proteins and proteins secreted by vesicles. Notably, Annexin A4 (ANXA4), which promotes membrane fusion and is essential for exocytosis [39], was abundant in the digesta. Moreover, GO enriched terms were associated with catalytic, regulatory, or inhibitory enzymatic activity. At the molecular level, catalytic functions are indispensable for the regulation of inflammatory processes, extracellular tissue degradation, and intracellular particle breakdown in the intestine. Therefore, under physiological and pathological conditions, the gastrointestinal tract secretes a substantial quantity of proteases, including those originating from the pancreas and intestinal epithelium [40]. This study revealed a high abundance of proteases, such as Meprin A beta subunit (MEP1B), in the digesta. Meprins are metalloproteinases with a highly glycosylated domain that are abundantly expressed in the apical region of the ileal epithelial cells [41,42]. The Meprin A beta subunit regulates shedding of mucus secreted by goblet cells through proteolytic cleavage of MUC2, which leads to its release [42,43]. Although an increase in mucus secretion has been observed in animals fed an NFD [44], no differences were detected in the proteins associated with mucus secretion that were identified in this study (MUC2, MUC13, MEP1B, KLK1, ADAM10, CLCA1, and FCGBP) [43].
Furthermore, the intestinal secretion of endogenous protease inhibitors helps maintain intestinal homeostasis and protects biologically important proteins, such as immune-active proteins [40]. Alpha-2 macroglobulin (A2M), identified in the digesta, inhibits endopeptidases of all catalytic types, preventing the degradation of endogenous biologically active proteins without interfering with the active site of the protease [45]. In the intestine, immunoglobulin production is essential for protecting the epithelial barrier. Through proteomic analyses, immunoglobulins and their fragments have been identified as some of the most abundant endogenous proteins in the digesta [32,33,34], consistent with our findings, where different immunoglobulin fragments were identified. Additionally, Ig lambda chain C and IgA constant regions were the two most abundant proteins in the digesta. Despite the observed reduction in immunoglobulin production under nutrient deprivation [46], no differences were observed between the treatments in our study, likely due to the increased starch availability in NFD, which could have modulated the microbiota and increased immunoglobulin production [46].
Enzymatic secretion is one of the main components of endogenous loss in the ileum [5,19]. In this study, the proteins identified in the digesta enriched pathways associated with the digestion and absorption of proteins, carbohydrates, lipids, vitamins, and minerals, similar to previous proteomics findings in the digesta of growing pigs [35]. Of these, 19 corresponded to pancreatic secretions. Research in pigs has shown that pancreatic secretions typically account for approximately 5% of endogenous nitrogen secreted in the intestine [5]. Diet composition alters enzyme secretion, and in starch-rich diets, an increase in salivary and pancreatic amylases as well as sucrase-isomaltase and maltase-glucoamylase in the intestine has been observed [47]. In this study, maltase-glucoamylase and sucrase-isomaltase were the most abundant proteins in the digesta, although no differences were observed between the treatments. The absence of differences could be due to a compensatory increase in maltase-glucoamylase in pigs fed the NFD, as in situations of decreased amylase activity, its secretion increases to hydrolyze starch [33]. This is consistent with the reduction in pancreatic amylase (AMY and AMY2) levels observed in NFD-fed pigs. Furthermore, nutrient deprivation has been associated with a decrease in the synthesis and secretion of pancreatic enzymes [46,47,48], similar to the findings of this study, where NFD-fed pigs showed decreased secretion of pancreatic proteases and lipases, along with other intestinal peptidases and proteins involved in the digestion and absorption of vitamins and minerals.
High dietary carbohydrate levels have been associated with an increased abundance of pathogenic bacteria [49], potentially promoting the enrichment of the S. aureus infection pathway in the digesta and increasing this pathway in pigs fed NFD. Within this pathway, the protein Ficolin-2 (FCN2), which is overexpressed in the digesta of NFD-fed pigs, participates in the complement activation lectin pathway by binding to lipoteichoic acid present in the cell walls of Gram-positive bacteria, including S. aureus [50,51]. The complement activation lectin pathway is crucial for innate antimicrobial host defense [52]. In addition to pathogens, lectin receptors recognize endosome derivatives and damage-associated molecular patterns in extracellular tissues [49,51]. Therefore, along with the enrichment of the autolysosome and lysosome pathways, these results suggest an increase in cellular autophagy in pigs fed NFD. Nutrient deficiency, including amino acid deficiency, decreases mTOR activity. mTOR phosphorylates the autophagy-initiating complex and inhibits autophagosome biogenesis.
Consequently, during prolonged periods of starvation, cellular autophagy increases, and autolysosome degradation products are recycled to maintain homeostasis and regulate cellular functions [53]. Furthermore, autophagy is promoted by the overgrowth of pathogenic bacteria [53]. These factors compromise the function of the intestinal barrier by stimulating a pro-inflammatory environment that increases cell renewal and preserves tissue integrity [50,51].
Intestinal epithelial cells exhibit a rapid turnover rate characterized by migration, differentiation, and cell renewal every 3–5 days, which is crucial for protecting integrity and maintaining intestinal functions [54,55,56]. Previous studies have identified epithelial cell desquamation as a major source of endogenous proteins in the ileum [5]. In this study, the proteins identified in the digesta enriched terms associated with the cytoskeleton, with keratin being the most abundant. Keratin and keratin filaments are resistant to cleavage by proteolytic enzymes because they are stabilized by numerous cross-linked disulfide bonds [57]. In the intestinal epithelium, undifferentiated crypt cells express K18, whereas villus cells express K20 [58,59]. The abundance of these keratins in the digesta of pigs fed the NFD suggests an increase in intestinal epithelial cell turnover [60], which is consistent with previous findings demonstrating increased epithelial desquamation in animals fed NFD.
The increased rate of intestinal renewal may explain the enrichment of the estrogen signaling pathway in the digesta. This pathway is crucial for regulating epithelial cell proliferation and differentiation in the intestine, where estrogen acts as a transcription regulator [61,62]. Additionally, this pathway regulates the electrolyte balance and contributes to intestinal HCO3 secretion [63]. In NFD-fed pigs, this pathway was upregulated compared to CAS-fed pigs. Moreover, the high abundance of leucine-rich protein (LRRIQ3), which is implicated in intestinal repair [50], in the digesta of NFD-fed pigs suggests an increase in cell renewal. The presence of EP300, PREX1, and RPS27A proteins, which enrich the Kaposi’s sarcoma-associated herpesvirus infection pathway and growth differentiation factor 2 (GDF2), which stimulates cell differentiation, proliferation, and migration in enterocytes, intestinal stem cells, and goblet cells under conditions of inflammation [64,65,66], supports the hypothesis of increased intestinal epithelial cell shedding in NFD-fed pigs.
In the gastrointestinal tract, the renin–angiotensin system regulates the intestinal environment by modulating various physiological processes such as gastrointestinal motility, fluid secretion, and absorption, as well as the uptake of peptides, amino acids, glucose, and sodium [67,68]. Angiotensin-converting enzyme (ACE2), a cell membrane-bound carboxypeptidase predominantly expressed in the ileum, is essential for the function of the sodium-dependent amino acid transporter B(0)AT1 [69]. Previous proteomic studies conducted on the intestines of pigs have observed the enrichment of this pathway in the digesta [35], a finding consistent with the results of the present study. Additionally, it has been noted that endogenous secretions exhibit increased ACE inhibitory bioactivity [70], suggesting a potential mechanism of intestinal homeostasis aimed at regulating intestinal secretions.
5. Conclusions
In conclusion, the proteomic analyses performed in this study enabled the identification of endogenous proteins in the ileal digesta. The findings suggest that pigs fed a casein diet could be a better alternative for basal endogenous loss estimation due to promoting normal intestinal secretion and maintaining intestinal health. Basal endogenous losses can impact the nutrient requirements of protein and amino acids due to the metabolic cost associated with the synthesis and turnover of endogenous proteins in the intestine. Therefore, identifying endogenous proteins could significantly enhance the development of nutritional strategies aimed at maximizing nutrient utilization in pigs. While label-free proteomics sacrifices some precision, this approach could be considered a complementary and cost-effective method for characterizing and quantifying endogenous proteins in the ileal digesta under different feeding conditions. Comprehension of the factors that influence endogenous ileal losses is essential for improving nutrient utilization efficiency.
Supplementary Materials
The following supporting information can be downloaded at https://www.mdpi.com/article/10.3390/ani14132000/s1: Table S1. Abundance of endogenous proteins identified in the digesta of growing pigs fed NFD and CAS diets; Table S2. Gene Ontology and KEGG pathway enrichment analysis of ileal endogenous proteins. Biological process (BP), cellular compartment (CC), molecular function (MF), and KEGG pathways; Table S3. Gene Ontology (GO) and KEGG pathway enrichment analysis of differentially abundant proteins (DAPs). Biological process (BP), molecular function (MF), and cellular component (CC).
Author Contributions
Conceptualization, G.M.-L., T.C.R.d.S. and I.E.Á.-A.; methodology, G.M.-L. and I.E.Á.-A.; software, I.E.Á.-A. and G.M.-L.; formal analysis, I.E.Á.-A. and E.R.H.; investigation, G.M.-L. and I.E.Á.-A.; resources, G.M.-L. and T.C.R.d.S.; data curation, I.E.Á.-A.; writing—original draft preparation, I.E.Á.-A. and G.M.-L.; writing—review and editing, I.E.Á.-A., G.M.-L., T.C.R.d.S., E.R.H. and S.G.R.; funding acquisition, G.M.-L. All authors have read and agreed to the published version of the manuscript.
Funding
This research was supported partially by the National Institute of Agricultural and Livestock Forestry Research (INIFAP-México) for financial support of the Research Project SIGI (Number 13202534765).
Institutional Review Board Statement
The animal study protocol was approved by the Institutional Committee for the Care and Use of Experimental Animals of the Faculty of Veterinary Medicine and Zootechnics of the UNAM (Protocol SICUAE.DC-2021/2-2; approval date: 25 June 2021).
Informed Consent Statement
Not applicable.
Data Availability Statement
The mass spectrometry proteomics data have been deposited in the ProteomeXchange Consortium via the PRIDE (https://www.ebi.ac.uk/pride/ accessed on 24 May 2024) partner repository with the dataset identifier PXD052560.
Acknowledgments
Mass spectrometry-based proteomics was performed at the Genomics, Proteomics and Metabolomics Core Facility (UGPM), LaNSE, CINVESTAV-IPN; hence, we want to thank ChemE, Nataly Ramos Buendía, and Emmanuel Ríos Castro for their help during sample preparation and LC-MS analysis.
Conflicts of Interest
The authors declare no conflicts of interest.
References
- Lee, S.A.; Jo, H.; Kong, C.; Kim, B.G. Use of Digestible Rather than Total Amino Acid in Diet Formulation Increases Nitrogen Retention and Reduces Nitrogen Excretion from Pigs. Livest. Sci. 2017, 197, 8–11. [Google Scholar] [CrossRef]
- Pomar, C.; Andretta, I.; Remus, A. Feeding Strategies to Reduce Nutrient Losses and Improve the Sustainability of Growing Pigs. Front. Vet. Sci. 2021, 8, 742220. [Google Scholar] [CrossRef] [PubMed]
- Stein, H.H.; Sève, B.; Fuller, M.F.; Moughan, P.J.; de Lange, C.F.M. Invited Review: Amino Acid Bioavailability and Digestibility in Pig Feed Ingredients: Terminology and Application. J. Anim. Sci. 2007, 85, 172–180. [Google Scholar] [CrossRef] [PubMed]
- Miner-Williams, W.; Deglaire, A.; Benamouzig, R.; Fuller, M.F.; Tomé, D.; Moughan, P.J. Endogenous Proteins in the Ileal Digesta of Adult Humans Given Casein-, Enzyme-Hydrolyzed Casein-or Crystalline Amino-Acid-Based Diets in an Acute Feeding Study. Eur. J. Clin. Nutr. 2014, 68, 363–369. [Google Scholar] [CrossRef] [PubMed]
- Nyachoti, C.; de Lange, C.; McBride, B.; Schulze, H. Significance of Endogenous Gut Nitrogen Losses in the Nutrition of Growing Pigs: A Review. Can. J. Anim. Sci. 1997, 77, 149–163. [Google Scholar] [CrossRef]
- Adeola, O.; Xue, P.C.; Cowieson, A.J.; Ajuwon, K.M. Basal Endogenous Losses of Amino Acids in Protein Nutrition Research for Swine and Poultry. Anim. Feed Sci. Technol. 2016, 221, 274–283. [Google Scholar] [CrossRef]
- Nasset, E.S.; Ju, J.S. Mixture of Endogenous and Exogenous Protein in the Alimentary Tract. J. Nutr. 1961, 74, 461–465. [Google Scholar] [CrossRef]
- Souffrant, W.; Rérat, A.; Laplace, J.; Darcy-Vrillon, B.; Köhler, R.; Corring, T.; Gebhardt, G.; Bernard, F.; Jähnichen, M.; Schneider, B.; et al. Exogenous and Endogenous Contributions to Nitrogen Fluxes in the Digestive Tract of Pigs Fed a Casein Diet. III. Recycling of Endogenous Nitrogen. Reprod. Nutr. Dev. 1993, 33, 373–382. [Google Scholar] [CrossRef] [PubMed]
- Ravindran, V. Feed-Induced Specific Ileal Endogenous Amino Acid Losses: Measurement and Significance in the Protein Nutrition of Monogastric Animals. Anim. Feed Sci. Technol. 2016, 221, 304–313. [Google Scholar] [CrossRef]
- Kong, C.; Ragland, D.; Adeola, O. Ileal Endogenous Amino Acid Flow Response to Nitrogen-Free Diets with Differing Ratios of Corn Starch to Dextrose in Pigs. Asian-Australas. J. Anim. Sci. 2014, 27, 1124–1130. [Google Scholar] [CrossRef]
- Adedokun, S.A.; Dong, K.; Harmon, D.L. Evaluating the Effects of Adaptation Length, Dietary Electrolyte Balance, and Energy Source on Ileal Endogenous Amino Acid Losses in Pigs Fed Nitrogen-Free Diets. Can. J. Anim. Sci. 2019, 99, 532–541. [Google Scholar] [CrossRef]
- Park, C.S.; Adeola, O. Basal Ileal Endogenous Losses of Amino Acids in Pigs Determined by Feeding Nitrogen-Free Diet or Low-Casein Diet or by Regression Analysis. Anim. Feed Sci. Technol. 2020, 267, 114550. [Google Scholar] [CrossRef]
- Deglaire, A.; Moughan, P.J.; Tomé, D. A Casein Hydrolysate Does Not Enhance Ileal Endogenous Protein Flows Compared with the Parent Intact Casein When Fed to Growing Pigs. Curr. Dev. Nutr. 2019, 3, nzy083. [Google Scholar] [CrossRef]
- Brestenský, M.; Nitrayová, S.; Patráš, P. Ileal Endogenous Losses in Pigs Feeding a Protein-Free Diet or Diets with Different Contents of Casein or Crystalline Amino Acids. Arch. Anim. Nutr. 2017, 71, 210–218. [Google Scholar] [CrossRef] [PubMed]
- Mariscal-Landín, G.; Reis de Souza, T.C. Endogenous Ileal Losses of Nitrogen and Amino Acids in Pigs and Piglets Fed Graded Levels of Casein. Arch. Anim. Nutr. 2006, 60, 454–466. [Google Scholar] [CrossRef] [PubMed]
- Jansman, A.J.M.; Smink, W.; Van Leeuwen, P.; Rademacher, M. Evaluation through Literature Data of the Amount and Amino Acid Composition of Basal Endogenous Crude Protein at the Terminal Ileum of Pigs. Anim. Feed Sci. Technol. 2002, 98, 49–60. [Google Scholar] [CrossRef]
- Corring, T.; Souffrant, W.B.; Darcy-Vrillon, B.; Gebhartd, G.; Laplace, J.P.; Rerat, A. Exogenous and Endogenous Contribution to Nitrogen Fluxes in the Digestive Tract of Pigs Fed a Casein Diet. I. Contributions of Nitrogen from the Exocrine Pancreatic Secretion and the Bile. Reprod. Nutr. Dev. 1990, 30, 717–722. [Google Scholar] [CrossRef] [PubMed][Green Version]
- Duvaux, C.; Guilloteau, P.; Toullec, R.; Sissons, J.; Duvaux, C.; Sissons, J.W. A New Method of Estimating the Proportions of Different Proteins in a Mixture Using Amino Acid Profiles: Application to Undigested Proteins in the Preruminant Calf. Ann. Zootech. 1990, 39, 9–18. [Google Scholar] [CrossRef]
- Ravindran, V. Progress in Ileal Endogenous Amino Acid Flow Research in Poultry. J. Anim. Sci. Biotechnol. 2021, 12, 5. [Google Scholar] [CrossRef]
- Verberkmoes, N.C.; Russell, A.L.; Shah, M.; Godzik, A.; Rosenquist, M.; Halfvarson, J.; Lefsrud, M.G.; Apajalahti, J.; Tysk, C.; Hettich, R.L.; et al. Shotgun Metaproteomics of the Human Distal Gut Microbiota. ISME J. 2009, 3, 179–189. [Google Scholar] [CrossRef]
- NOM-062-ZOO-1999; Especificaciones Técnicas Para La Producción, Cuidado y Uso de Los Animales de Laboratorio. Norma Oficial Mexicana: Mexico City, Mexico, 2001.
- CIOMS. International Guiding Principles for Biomedical Research Involving Animals. In The Development of Science-Based Guide-Lines for Laboratory Animal Care; NCBI Bookshelf: Geneva, Switzerland, 2012. [Google Scholar]
- Reis de Souza, T.C.; Mar-Botello, B.; Mariscal-Landín, G. Canulación de Cerdos Posdestete Para Pruebas de Digestibilidad Ileal: Desarrollo de Una Metodología. Técnica Pecu. México 2000, 38, 143–150. [Google Scholar]
- NRC. Nutrient Requirements of Swine; Eleventh Revised; National Academy Press: Washington, DC, USA, 2012.
- INRA. L’alimentation Des Animaux Monogastriques: Porc, Lapin, Volaille; Institut National de la Recherche Agronomique: Paris, France, 1984. [Google Scholar]
- Reis de Souza, T.C.; Ávila Árres, I.E.; Ramírez Rodríguez, E.; Mariscal-Landín, G. Effects of Kafirins and Tannins Concentrations in Sorghum on the Ileal Digestibility of Amino Acids and Starch, and on the Glucose and Plasma Urea Nitrogen Levels in Growing Pigs. Livest. Sci. 2019, 227, 29–36. [Google Scholar] [CrossRef]
- Qin, C.; Qiu, K.; Sun, W.; Jiao, N.; Zhang, X.; Che, L.; Zhao, H.; Shen, H.; Yin, J. A Proteomic Adaptation of Small Intestinal Mucosa in Response to Dietary Protein Limitation. Sci. Rep. 2016, 6, 36888. [Google Scholar] [CrossRef] [PubMed]
- Ríos-Castro, E.; Souza, G.H.M.F.; Delgadillo-Álvarez, D.M.; Ramírez-Reyes, L.; Torres-Huerta, A.L.; Velasco-Suárez, A.; Cruz-Cruz, C.; Hernández-Hernández, J.M.; Tapia-Ramírez, J. Quantitative Proteomic Analysis of MARC-145 Cells Infected with a Mexican Porcine Reproductive and Respiratory Syndrome Virus Strain Using a Label-Free Based DIA Approach. J. Am. Soc. Mass Spectrom. 2020, 31, 1302–1312. [Google Scholar] [CrossRef] [PubMed]
- Silva, J.C.; Gorenstein, M.V.; Li, G.-Z.; Vissers, J.P.C.; Geromanos, S.J. Absolute Quantification of Proteins by LCMSE. Mol. Cell. Proteom. 2006, 5, 144–156. [Google Scholar] [CrossRef] [PubMed]
- Ge, S.X.; Jung, D.; Yao, R. ShinyGO: A Graphical Gene-Set Enrichment Tool for Animals and Plants. Bioinformatics 2020, 36, 2628–2629. [Google Scholar] [CrossRef] [PubMed]
- Cowieson, A.J.; Klausen, M.; Pontoppidan, K.; Faruk, M.U.; Roos, F.F.; Giessing, A.M.B. Identification of Peptides in the Terminal Ileum of Broiler Chickens Fed Diets Based on Maize and Soybean Meal Using Proteomics. In Proceedings of the Animal Production Science; CSIRO: Pullenvale, QLD, Australia, 2017; Volume 57, pp. 1738–1750. [Google Scholar]
- Le Gall, M.; Quillien, L.; Guéguen, J.; Rogniaux, H.; Sève, B. Identification of Dietary and Endogenous Ileal Protein Losses in Pigs by Immunoblotting and Mass Spectrometry. J. Nutr. 2005, 135, 1215–1222. [Google Scholar] [CrossRef] [PubMed]
- Recoules, E.; Sabboh-Jourdan, H.; Narcy, A.; Lessire, M.; Harichaux, G.; Labas, V.; Duclos, M.J.; Réhault-Godbert, S. Exploring the in Vivo Digestion of Plant Proteins in Broiler Chickens. Poult. Sci. 2017, 96, 1735–1747. [Google Scholar] [CrossRef] [PubMed]
- Li, J.; Tan, B.; Tang, Y.; Liao, P.; Yao, K.; Ji, P.; Yin, Y. Extraction and Identification of the Chyme Proteins in the Digestive Tract of Growing Pigs. Sci. China Life Sci. 2018, 61, 1396–1406. [Google Scholar] [CrossRef]
- Tröscher-Mußotter, J.; Tilocca, B.; Stefanski, V.; Seifert, J. Analysis of the Bacterial and Host Proteins along and across the Porcine Gastrointestinal Tract. Proteomes 2019, 7, 4. [Google Scholar] [CrossRef]
- Haber, A.L.; Biton, M.; Rogel, N.; Herbst, R.H.; Shekhar, K.; Smillie, C.; Burgin, G.; Delorey, T.M.; Howitt, M.R.; Katz, Y.; et al. A Single-Cell Survey of the Small Intestinal Epithelium. Nature 2017, 551, 333–339. [Google Scholar] [CrossRef] [PubMed]
- Gelberg, H.B. Comparative Anatomy, Physiology, and Mechanisms of Disease Production of the Esophagus, Stomach, and Small Intestine. Toxicol. Pathol. 2014, 42, 54–66. [Google Scholar] [CrossRef] [PubMed]
- Gieryńska, M.; Szulc-Dąbrowska, L.; Struzik, J.; Mielcarska, M.B.; Gregorczyk-Zboroch, K.P. Integrity of the Intestinal Barrier: The Involvement of Epithelial Cells and Microbiota—A Mutual Relationship. Animals 2022, 12, 145. [Google Scholar] [CrossRef] [PubMed]
- Peng, Y.; Zhang, Z.; Zhang, A.; Liu, C.; Sun, Y.; Peng, Z.; Liu, Y. Membrane-Cytoplasm Translocation of Annexin A4 Is Involved in the Metastasis of Colorectal Carcinoma. Aging 2021, 13, 10312–10325. [Google Scholar] [CrossRef] [PubMed]
- Vergnolle, N. Protease Inhibition as New Therapeutic Strategy for GI Diseases. Gut 2016, 65, 1215–1224. [Google Scholar] [CrossRef]
- Bond, J.S.; Matters, G.L.; Banerjee, S.; Dusheck, R.E. Meprin Metalloprotease Expression and Regulation in Kidney, Intestine, Urinary Tract Infections and Cancer. FEBS Lett. 2005, 579, 3317–3322. [Google Scholar] [CrossRef]
- Werny, L.; Colmorgen, C.; Becker-Pauly, C. Regulation of Meprin Metalloproteases in Mucosal Homeostasis. Biochim. Biophys. Acta Mol. Cell Res. 2022, 1869, 119158. [Google Scholar] [CrossRef] [PubMed]
- Paone, P.; Cani, P.D. Mucus Barrier, Mucins and Gut Microbiota: The Expected Slimy Partners? Gut 2020, 69, 2232–2243. [Google Scholar] [CrossRef]
- Zhou, H.; Wu, W.; Mahmood, T.; Chen, Y.; Xu, Y.; Wang, Y.; Yuan, J. Comparison of Endogenous Amino Acid Losses in Broilers When Offered Nitrogen-Free Diets with Differing Ratios of Dextrose to Corn Starch. Sci. Rep. 2022, 12, 5689. [Google Scholar] [CrossRef]
- Vandooren, J.; Itoh, Y. Alpha-2-Macroglobulin in Inflammation, Immunity and Infections. Front. Immunol. 2021, 12, 803244. [Google Scholar] [CrossRef]
- Parsons, B.W.; Drysdale, R.L.; Cvengros, J.E.; Utterback, P.L.; Rochell, S.J.; Parsons, C.M.; Emmert, J.L. Quantification of Secretory IgA and Mucin Excretion and Their Contributions to Total Endogenous Amino Acid Losses in Roosters That Were Fasted or Precision-Fed a Nitrogen-Free Diet or Various Highly Digestible Protein Sources. Poult. Sci. 2023, 102, 102554. [Google Scholar] [CrossRef] [PubMed]
- Kurz, A.; Seifert, J. Factors Influencing Proteolysis and Protein Utilization in the Intestine of Pigs: A Review. Animals 2021, 11, 3551. [Google Scholar] [CrossRef] [PubMed]
- He, L.; Wu, L.; Xu, Z.; Li, T.; Yao, K.; Cui, Z.; Yin, Y.; Wu, G. Low-Protein Diets Affect Ileal Amino Acid Digestibility and Gene Expression of Digestive Enzymes in Growing and Finishing Pigs. Amino Acids 2016, 48, 21–30. [Google Scholar] [CrossRef] [PubMed]
- Vitko, N.P.; Spahich, N.A.; Richardson, A.R. Glycolytic Dependency of High-Level Nitric Oxide Resistance and Virulence in Staphylococcus Aureus. mBio 2015, 6, e00045-15. [Google Scholar] [CrossRef] [PubMed]
- Prossomariti, A.; Sokol, H.; Ricciardiello, L. Nucleotide-Binding Domain Leucine-Rich Repeat Containing Proteins and Intestinal Microbiota: Pivotal Players in Colitis and Colitis-Associated Cancer Development. Front. Immunol. 2018, 9, 1039. [Google Scholar] [CrossRef] [PubMed]
- Drouin, M.; Saenz, J.; Chiffoleau, E. C-Type Lectin-Like Receptors: Head or Tail in Cell Death Immunity. Front. Immunol. 2020, 11, 251. [Google Scholar] [CrossRef] [PubMed]
- Lynch, N.J.; Roscher, S.; Hartung, T.; Morath, S.; Matsushita, M.; Maennel, D.N.; Kuraya, M.; Fujita, T.; Schwaeble, W.J. L-Ficolin Specifically Binds to Lipoteichoic Acid, a Cell Wall Constituent of Gram-Positive Bacteria, and Activates the Lectin Pathway of Complement. J. Immunol. 2004, 172, 1198–1202. [Google Scholar] [CrossRef] [PubMed]
- Nakatogawa, H. Mechanisms Governing Autophagosome Biogenesis. Nat. Rev. Mol. Cell Biol. 2020, 21, 439–458. [Google Scholar] [CrossRef] [PubMed]
- Gebert, N.; Cheng, C.-W.; Kirkpatrick, J.M.; Di Fraia, D.; Yun, J.; Schädel, P.; Pace, S.; Garside, G.B.; Werz, O.; Rudolph, K.L.; et al. Region-Specific Proteome Changes of the Intestinal Epithelium during Aging and Dietary Restriction. Cell Rep. 2020, 31, 107565. [Google Scholar] [CrossRef]
- Qi, D.; Shi, W.; Black, A.R.; Kuss, M.A.; Pang, X.; He, Y.; Liu, B.; Duan, B. Repair and Regeneration of Small Intestine: A Review of Current Engineering Approaches. Biomaterials 2020, 240, 119832. [Google Scholar] [CrossRef]
- Modina, S.C.; Aidos, L.; Rossi, R.; Pocar, P.; Corino, C.; Di Giancamillo, A. Stages of Gut Development as a Useful Tool to Prevent Gut Alterations in Piglets. Animals 2021, 11, 1412. [Google Scholar] [CrossRef]
- Bragulla, H.H.; Homberger, D.G. Structure and Functions of Keratin Proteins in Simple, Stratified, Keratinized and Cornified Epithelia. J. Anat. 2009, 214, 516–559. [Google Scholar] [CrossRef] [PubMed]
- Zhou, Q.; Toivola, D.M.; Feng, N.; Greenberg, H.B.; Franke, W.W.; Omary, M.B. Keratin 20 Helps Maintain Intermediate Filament Organization in Intestinal Epithelia. Mol. Biol. Cell 2003, 14, 2959–2971. [Google Scholar] [CrossRef] [PubMed]
- Mun, J.; Hur, W.; Ku, N.-O. Roles of Keratins in Intestine. Int. J. Mol. Sci. 2022, 23, 8051. [Google Scholar] [CrossRef] [PubMed]
- Iwatsuki, H.; Suda, M. Maturation of Three Kinds of Keratin Networks in the Absorptive Cells of Rabbit Duodenum. Acta Histochem. Cytochem. 2005, 38, 237–245. [Google Scholar] [CrossRef]
- Chen, C.; Gong, X.; Yang, X.; Shang, X.; Du, Q.; Liao, Q.; Xie, R.; Chen, Y.; Xu, J. The Roles of Estrogen and Estrogen Receptors in Gastrointestinal Disease. Oncol. Lett. 2019, 18, 5673–5680. [Google Scholar] [CrossRef] [PubMed]
- Soler, L.; Stella, A.; Seva, J.; Pallarés, F.J.; Lahjouji, T.; Burlet-Schiltz, O.; Oswald, I.P. Proteome Changes Induced by a Short, Non-Cytotoxic Exposure to the Mycoestrogen Zearalenone in the Pig Intestine. J. Proteom. 2020, 224, 103842. [Google Scholar] [CrossRef] [PubMed]
- Yang, X.; Guo, Y.; He, J.; Zhang, F.; Sun, X.; Yang, S.; Dong, H. Estrogen and Estrogen Receptors in the Modulation of Gastrointestinal Epithelial Secretion. Oncotarget 2017, 8, 97683–97692. [Google Scholar] [CrossRef] [PubMed]
- Ye, R.D. The Rho Guanine Nucleotide Exchange Factor P-Rex1 as a Potential Drug Target for Cancer Metastasis and Inflammatory Diseases. Pharmacol. Res. 2020, 153, 104676. [Google Scholar] [CrossRef]
- Shao, Q.; Chen, Z.-M. Feedback Regulation between Phosphatidylinositol-3,4,5-Trisphosphate Dependent Rac Exchange Factor 1 and Transforming Growth Factor Β1 and Prognostic Value in Gastric Cancer. World J. Gastroenterol. 2020, 26, 21–34. [Google Scholar] [CrossRef]
- Yin, J.; Zhao, Z.; Huang, J.; Xiao, Y.; Rehmutulla, M.; Zhang, B.; Zhang, Z.; Xiang, M.; Tong, Q.; Zhang, Y. Single-Cell Transcriptomics Reveals Intestinal Cell Heterogeneity and Identifies Ep300 as a Potential Therapeutic Target in Mice with Acute Liver Failure. Cell Discov. 2023, 9, 77. [Google Scholar] [CrossRef] [PubMed]
- Jaworska, K.; Koper, M.; Ufnal, M. Gut Microbiota and Renin-Angiotensin System: A Complex Interplay at Local and Systemic Levels. Am. J. Physiol.-Gastrointest. Liver Physiol. 2021, 321, G355–G366. [Google Scholar] [CrossRef] [PubMed]
- Zizzo, M.G.; Serio, R. The Renin–Angiotensin System in Gastrointestinal Functions. In Angiotensin; Elsevier: Amsterdam, The Netherlands, 2023; pp. 681–697. [Google Scholar]
- Ferreira-Duarte, M.; Oliveira, L.C.G.; Quintas, C.; Esteves-Monteiro, M.; Duarte-Araújo, M.; Sousa, T.; Casarini, D.E.; Morato, M. Actividad Catalítica ACE y ACE2 en el Contenido Fecal a Lo Largo Del Intestino. Neurogastroenterol. Motil. 2023, 35, e14598. [Google Scholar] [CrossRef] [PubMed]
- Dave, L.A.; Montoya, C.A.; Rutherfurd, S.M.; Moughan, P.J. Gastrointestinal Endogenous Proteins as a Source of Bioactive Peptides—An In Silico Study. PLoS ONE 2014, 9, e98922. [Google Scholar] [CrossRef] [PubMed]


Disclaimer/Publisher’s Note: The statements, opinions and data contained in all publications are solely those of the individual author(s) and contributor(s) and not of MDPI and/or the editor(s). MDPI and/or the editor(s) disclaim responsibility for any injury to people or property resulting from any ideas, methods, instructions or products referred to in the content. |
© 2024 by the authors. Licensee MDPI, Basel, Switzerland. This article is an open access article distributed under the terms and conditions of the Creative Commons Attribution (CC BY) license (https://creativecommons.org/licenses/by/4.0/).