Article

A Comparative Analysis of the Gene Expression Profiles in the Mammary Glands of Lactating and Nonlactating Mares at the Second Month of Gestation

1
Equus Research Center, College of Animal Science, Inner Mongolia Agricultural University, Hohhot 010018, China
2
Animal Quarantine & Disease Control Center, Darhan-Muminggan Joint County, Baotou 014500, China
3
Xilingol League Animal Husbandry Work Station, Xilinhot 026099, China
*
Author to whom correspondence should be addressed.
These authors contributed equally to this work.
Animals 2024, 14(16), 2319; https://doi.org/10.3390/ani14162319 (registering DOI)
Submission received: 30 June 2024 / Revised: 4 August 2024 / Accepted: 5 August 2024 / Published: 9 August 2024
(This article belongs to the Section Equids)

Abstract

:

Simple Summary

To explore molecular regulation related to lactation during pregnancy, the mammary glands of pregnant Mongolian mares during lactation and non-lactation were sequenced and analyzed for differentially expressed genes. We screened milk protein-related genes (CSN1S1, CSN3, and LALBA), genes related to the lipid metabolism process (DGAT1, LEP, and LEPR), and genes closely related to lactation events (FAT1 and LTF), which can be used as candidate genes for selecting lactation traits in Mongolian mares.

Abstract

To investigate molecular regulation involved in lactation during pregnancy, this study focused on the transcriptomic profiles of mammary tissue from lactating and non-lactating Mongolian mares at the second month of gestation. A total of 4197 differentially expressed genes were identified by comparing mammary tissues from pregnant mares at two different states, including 1974 differentially expressed genes such as the milk protein-related genes a-s1-casein (CSN1S1), k-casein (CSN3), lactalbumin (LALBA), and lactoferrin (LTF), which were highly expressed in the lactating mares group, and overall, these differentially expressed genes were mainly associated with biological processes such as endoplasmic reticulum protein processing, the Toll-like receptor signaling pathway, steroid biosynthesis, cytokine–cytokine receptor interactions, and amino sugar and nucleotide glycolysis. These findings serve as a foundation for investigating the molecular underpinnings of lactation in pregnant equids.

1. Introduction

The development of the horse industry has gone through a long process of change. The use of horses in power-related roles in service and transportation and as tools for combat, grazing, and hunting has been gradually completely replaced by machinery; the modern horse industry has developed in new directions of economy, tourism, recreation, and entertainment while driving the development of other industry chains. The traditional horse industry continues to decline and is in urgent need of transformation and upgrading. To produce greater economic and social benefits, the unique nutritional and health care role of mare’s milk and its related products and the comprehensive development and utilization of the horse industry around the world have become important directions for the development of horse breeding.
Mare’s milk is reportedly consumed regularly by 30 million people around the world, such as in Mongolia and Kazakhstan in Central Asia, the residents of which consume mare’s milk mainly in the form of fermented products and refer to these beverages as koumiss, airag, or chigee; the consumption of mare’s milk is also common in some European countries [1,2]. In addition to the use of this milk as a valuable source of nutrition, it has long been regarded as a medicine in the former Soviet Union and West Asia because of its health-promoting properties [2]. The growing interest in mare’s milk has been driven to a large extent by information about its positive health effects and the similarity of its composition to human milk.
Mare’s milk is rich in nutrients, including proteins, fats, sugars, phosphorus, calcium, vitamin C, and many other components [3]. The fat content of mare’s milk is significantly lower than that of human milk and cow’s milk, but the proportion of unsaturated fatty acids is greater than that of cow’s milk and close to that of human milk, which is effective in preventing hypercholesterolemia and atherosclerosis [4,5]. Moreover, mare’s milk has high levels of whey and casein proteins, with a concentration between those of human milk and cow’s milk, and the ratio and spongy structure of the granular micelles make it physiologically easier to digest than cow’s milk [6,7]. In addition, the whey protein contents of mare’s milk and human milk are similar and higher than that of cow’s milk. Whey proteins are involved in the conversion of glucose and galactose to lactose, which is an important carbohydrate source for foals [7,8]. It has been shown that the calcium-to-phosphorus ratio of mare’s milk (1.6–1.8:1) is more favorable for the normal growth of hatchling skeletons than that of cow’s milk (approximately 1.4:1) and is closer to that of human milk (approximately 1.9:1) [6]. In addition, mare’s milk is used in various fields, such as for the treatment and prevention of tuberculosis and other bacterial infections, due to its high levels of other bioactive substances, such as lysozyme, and antibacterial and antiviral active ingredients, such as lactoferrin [9]. Lactoferrin not only improves the digestion of nutrients by increasing the surface area of the intestinal mucosa but also promotes the establishment of the intestinal microbiota in newborns [10,11]. These characteristics of horse milk have led to a renewed interest in its lactation performance; however, horses are currently in a state of unselected breeding for milk production with untapped milk production potential, and they generally produce far less milk than the predicted optimum.
In production practice, we found that some mares continue to lactate during gestation or even remain in lactation for a long period of time, a phenomenon we believe may be useful for breeding high-yielding Mongolian dairy horse lines. Therefore, we explored the differentially expressed genes and signaling pathways related to lactation traits during pregnancy. In this study, we sequenced the mammary glands of Mongolian mares during gestational lactation and non-lactation and analyzed the differentially expressed genes to identify candidate genes related to lactation in Mongolian mares. The results of this study will lay the foundation for analyzing the molecular mechanism of lactation and understanding the characteristics of equine milk production.

2. Materials and Methods

2.1. Collection of Equine Mammary Gland Samples

The animal experiments were reviewed and approved by the Animal Protection and Use Committee of the Inner Mongolia Agricultural University. Mammary gland tissues from lactating and non-lactating healthy 6–8-year-old Mongolian mares in the second month of gestation were obtained separately from the slaughterhouse in East Wuzhumu Banner, Xilin Gol, Inner Mongolia Autonomous Region. Half of the breast tissue samples were snap-frozen in liquid nitrogen and stored at −80 °C until analysis. The other half was fixed in paraformaldehyde and stored at −4 °C until analysis.

2.2. Histomorphology Examination

The experimental horse mammary tissue was fixed with 4% paraformaldehyde, dehydrated with a graded ethanol series, washed with xylene, embedded in paraffin, sectioned at a thickness of 7 µm, prepared for tissue sectioning, stained with H&E, and finally photographed under a light microscope.

2.3. RNA Extraction, Library Preparation, and Sequencing

Total RNA was extracted from tissue samples using the TRIzol method, and the purity and integrity of total RNA were examined using a NanoDrop 2000 spectrophotometer (Thermo Scientific, Waltham, MA, USA) and Agilent 2100 instruments (Agilent, Santa Clara, CA, USA). The libraries were constructed using an Illumina RNA library prep kit (NEB, Ipswich, MA, USA), and after library construction, their quality, concentration, and size were detected using a Qubit 2.0 (Thermo Scientific, MA, USA) and Agilent 2100 bioanalyzer (Agilent, CA, USA). After meeting the expected standards, sequencing was performed with the Illumina HiSeqTM 2500 (Illumina, San Diego, CA, USA) platform.

2.4. Quality Control and Alignment

To ensure the quality and credibility of the data, the sequencing data were filtered using SOAPnuke [12] (v2.1.0). The filtered RNA-seq reads were mapped to the horse reference genome (EquCab3.0) using HISAT2 [13]. After quality control, the second-generation clean sequence reads were compared to the reference transcript sequence using Bowtie2 [14]. The comparison results of Bowtie2 were counted using RSEM [15] (V1.3.1) to obtain the number of reads compared to each transcript for each breast tissue sample and converted to gene expression values (fragments per kilobase per million bases, FPKM) [16], and paired-end reads from the same fragments were counted as fragments, which, in turn, determined the expression levels of the genes and transcripts.

2.5. Screening of Differentially Expressed Genes (DEGs)

To compare the FPKM density distribution of genes/transcripts from different samples as a whole, we performed a principal component analysis (PCA) of the FPKM values for all samples. Based on the results of expression quantification, we screened the samples for genes and transcripts with significant differences in expression levels at different stages. DESeq2 [17] (V1.22.2) was used for differential expression significance analysis, and the screening thresholds were FDR (false discovery rate) < 0.05 and log2FC (fold change) > 1 or <−1.

2.6. Gene Ontology (GO) and Kyoto Encyclopedia of Genes and Genomes (KEGG) Pathway Enrichment Analysis

Gene classification and biological function annotation were performed using the online DAVID database. The symbols of differentially expressed genes between samples (adjusted p < 0.05) were submitted to DAVID. GO and KEGG enrichment analyses were performed for differentially expressed, upregulated, and downregulated genes between samples. Horse genes labeled in the GO and KEGG databases were enriched and analyzed as background genes.

2.7. Quantitative Real-Time PCR (qPCR)

TRIzol was used to harvest RNA from samples from the lactation and non-lactation groups, and the RNA samples were converted to cDNA using a reverse transcription kit (Prime Script™ RT Master Mix) (Takara, Kyoto, Japan). Using GAPDH as a control, the reaction system (25 µL) was prepared according to the instructions provided for TB Green®Premix Ex TaqTM II (Takara, Kyoto, Japan). The data were analyzed by the 2−∆∆Ct method to determine the expression levels of the genes in the lactation and non-lactation groups of Mongolian mares. The parallel experiment included at least three replicates, and the data are expressed as the mean ± SD. The differences between groups were compared with the GraphPad Prism 9.0 software, and the differences were considered significant when p < 0.05. The primers are shown in Supplementary Table S3.

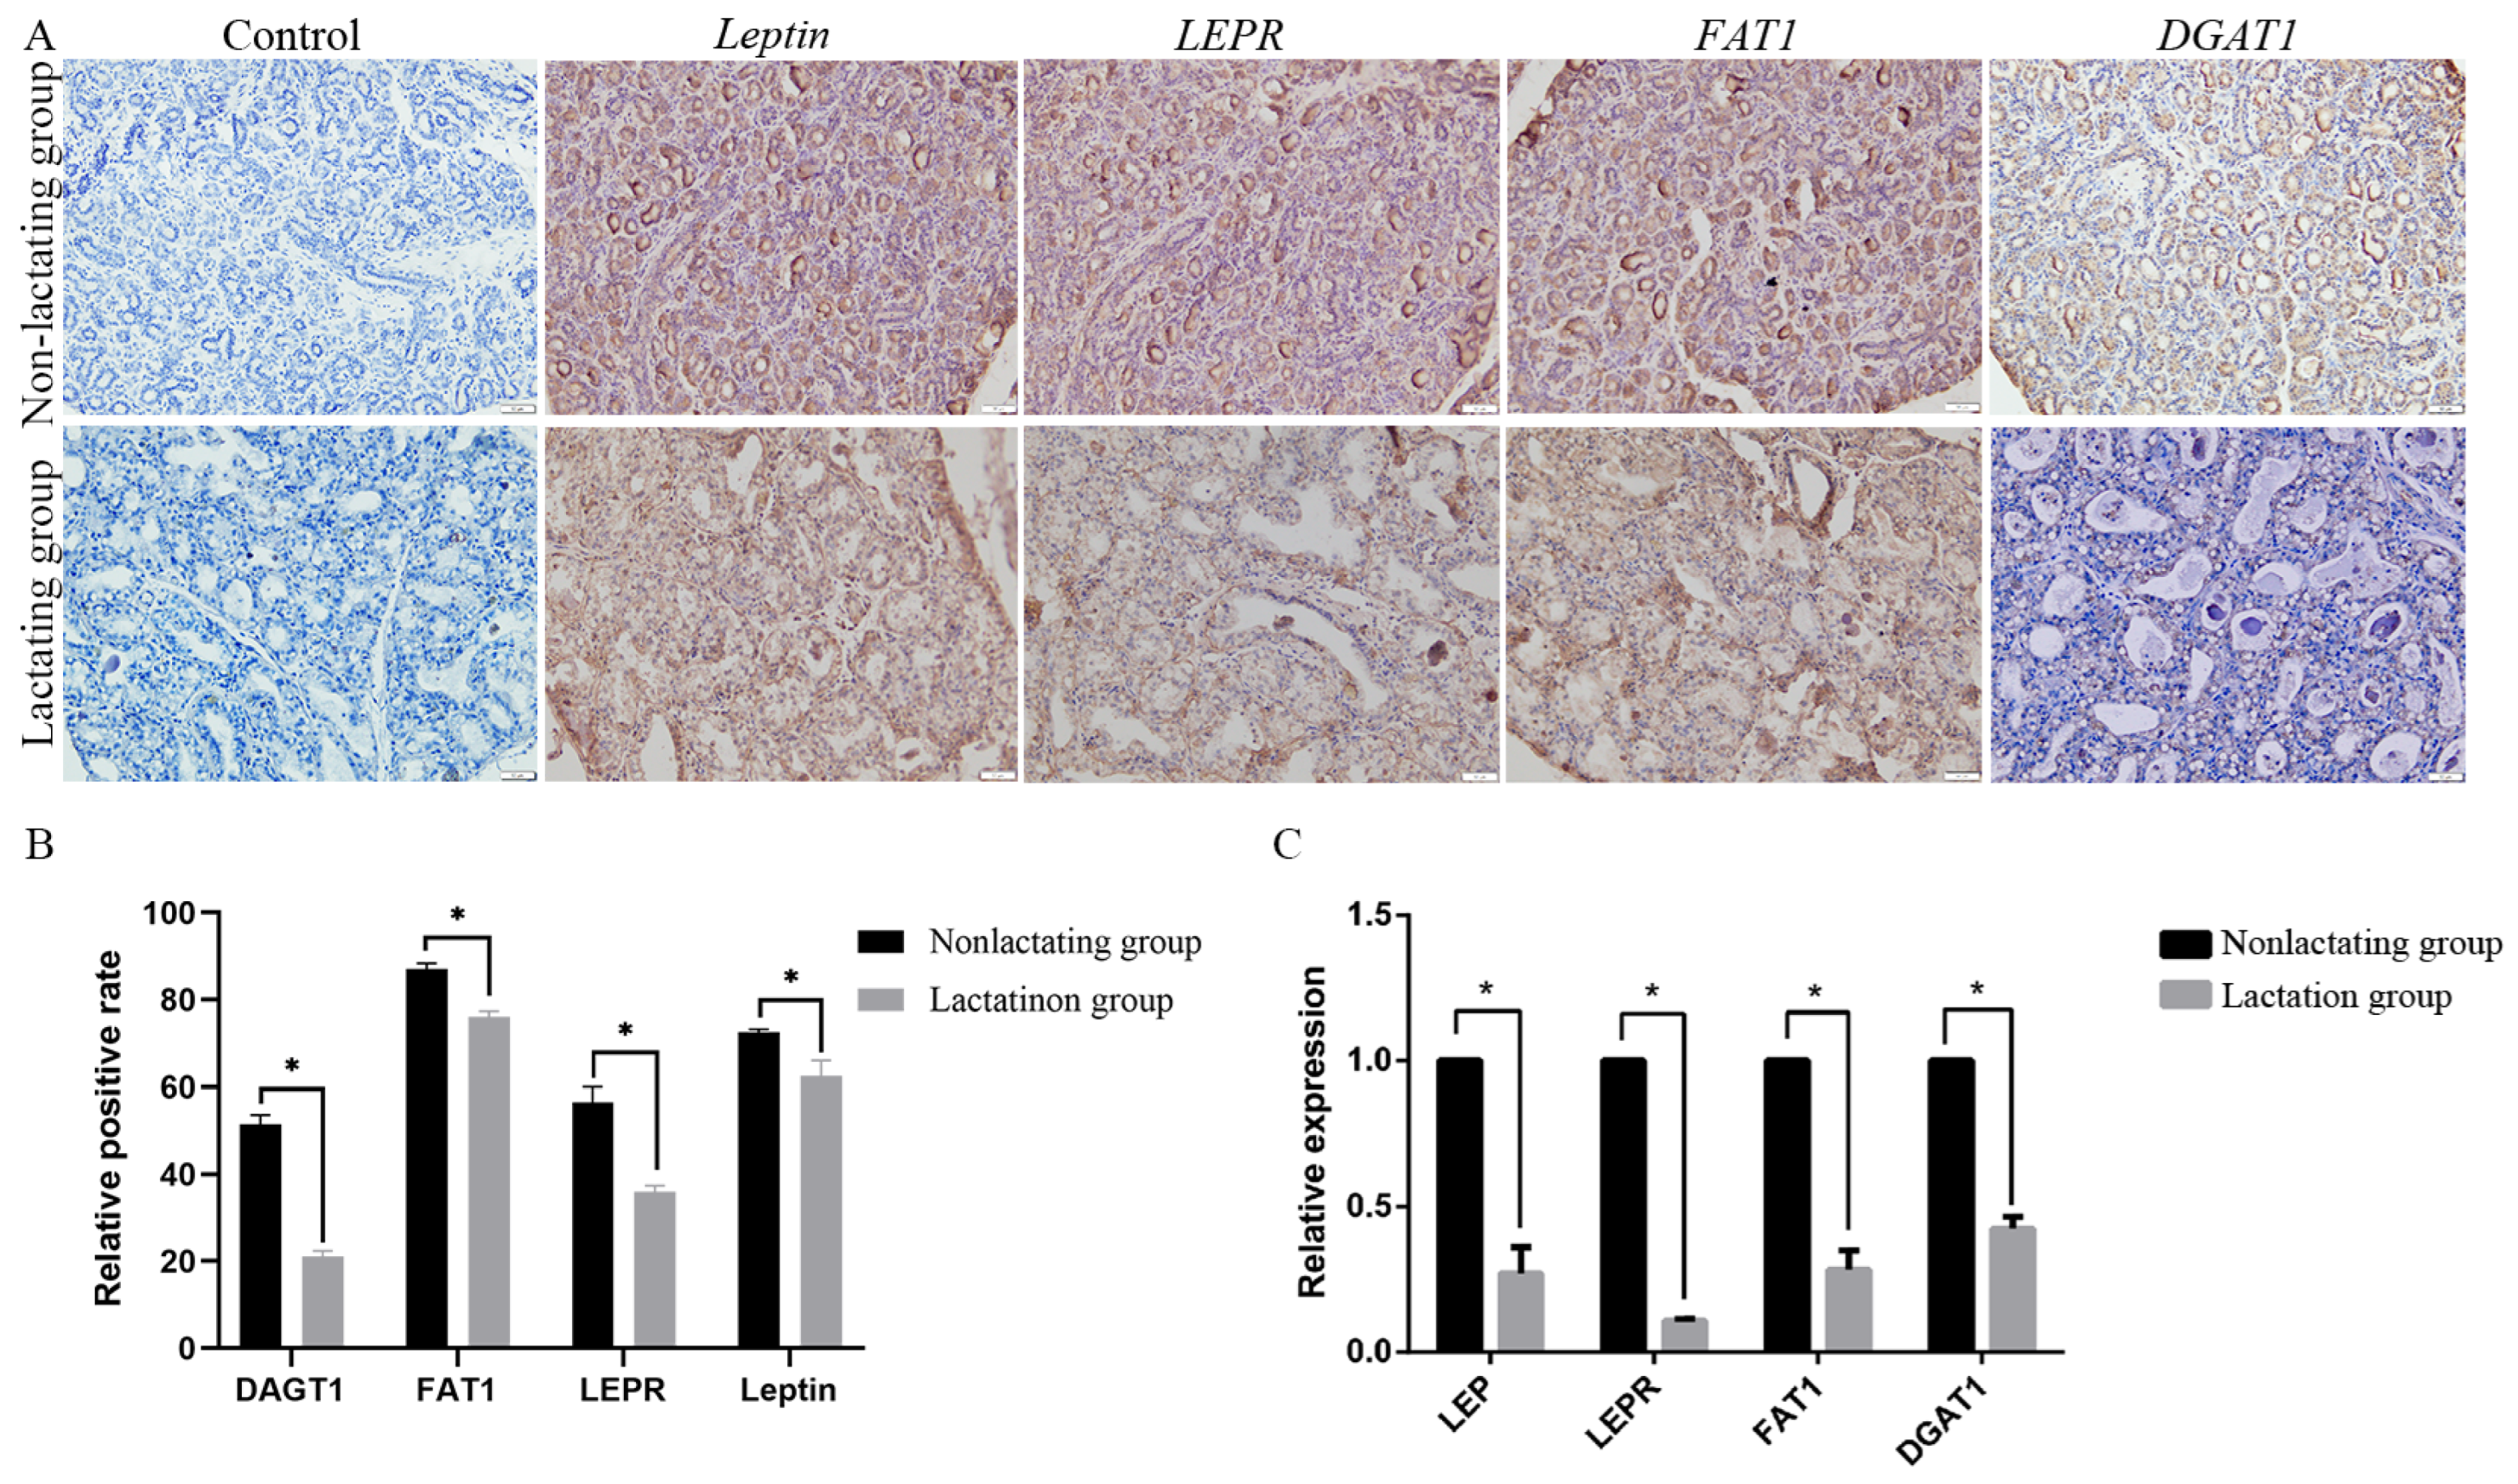
2.8. Immunohistochemistry

Dehydrated mammary gland specimens from Mongolian mares (n = 3/group) were embedded in paraffin blocks. Cross sections of 7 μm in thickness were obtained from each block using a microtome (RM 2245, Leica, Wetzlar, Germany) and collected on glass slides and air-dried for 30 min. After dilution of the antibodies using Antibody Dilution Buffer according to the antibody instruction manual, primary antibodies against CSN3 (AF0187, Affinity, MEL, AUS), FAT1 (DF8943, Affinity), DGAT1 (DF13368, Affinity), LEP (DF8583, Affinity), LEPR (DF7139, Affinity), LTF (DF8059, Affinity), CSN1S1 (DF13271, Affinity), and LALBA (A6233, ABclonal, Woburn, MA, USA) were incubated with the slides overnight at 4 °C. After the slides were rinsed in PBS for 5 min, the slides were then incubated dropwise with biotin-labeled secondary antibody for 10 min at room temperature. Finally, a DAB horseradish peroxidase colorimetric kit (DA1015, Solarbio, Beijing, China) was used for color development, and images were captured with a microscope imaging system (Zeiss, Oberkochen, Germany).

2.9. Statistical Analysis

To assess significant differences in gene expression across gestations, two-way ANOVA was used to assess probability (p) values. Differences were considered significant when p < 0.05.

3. Results

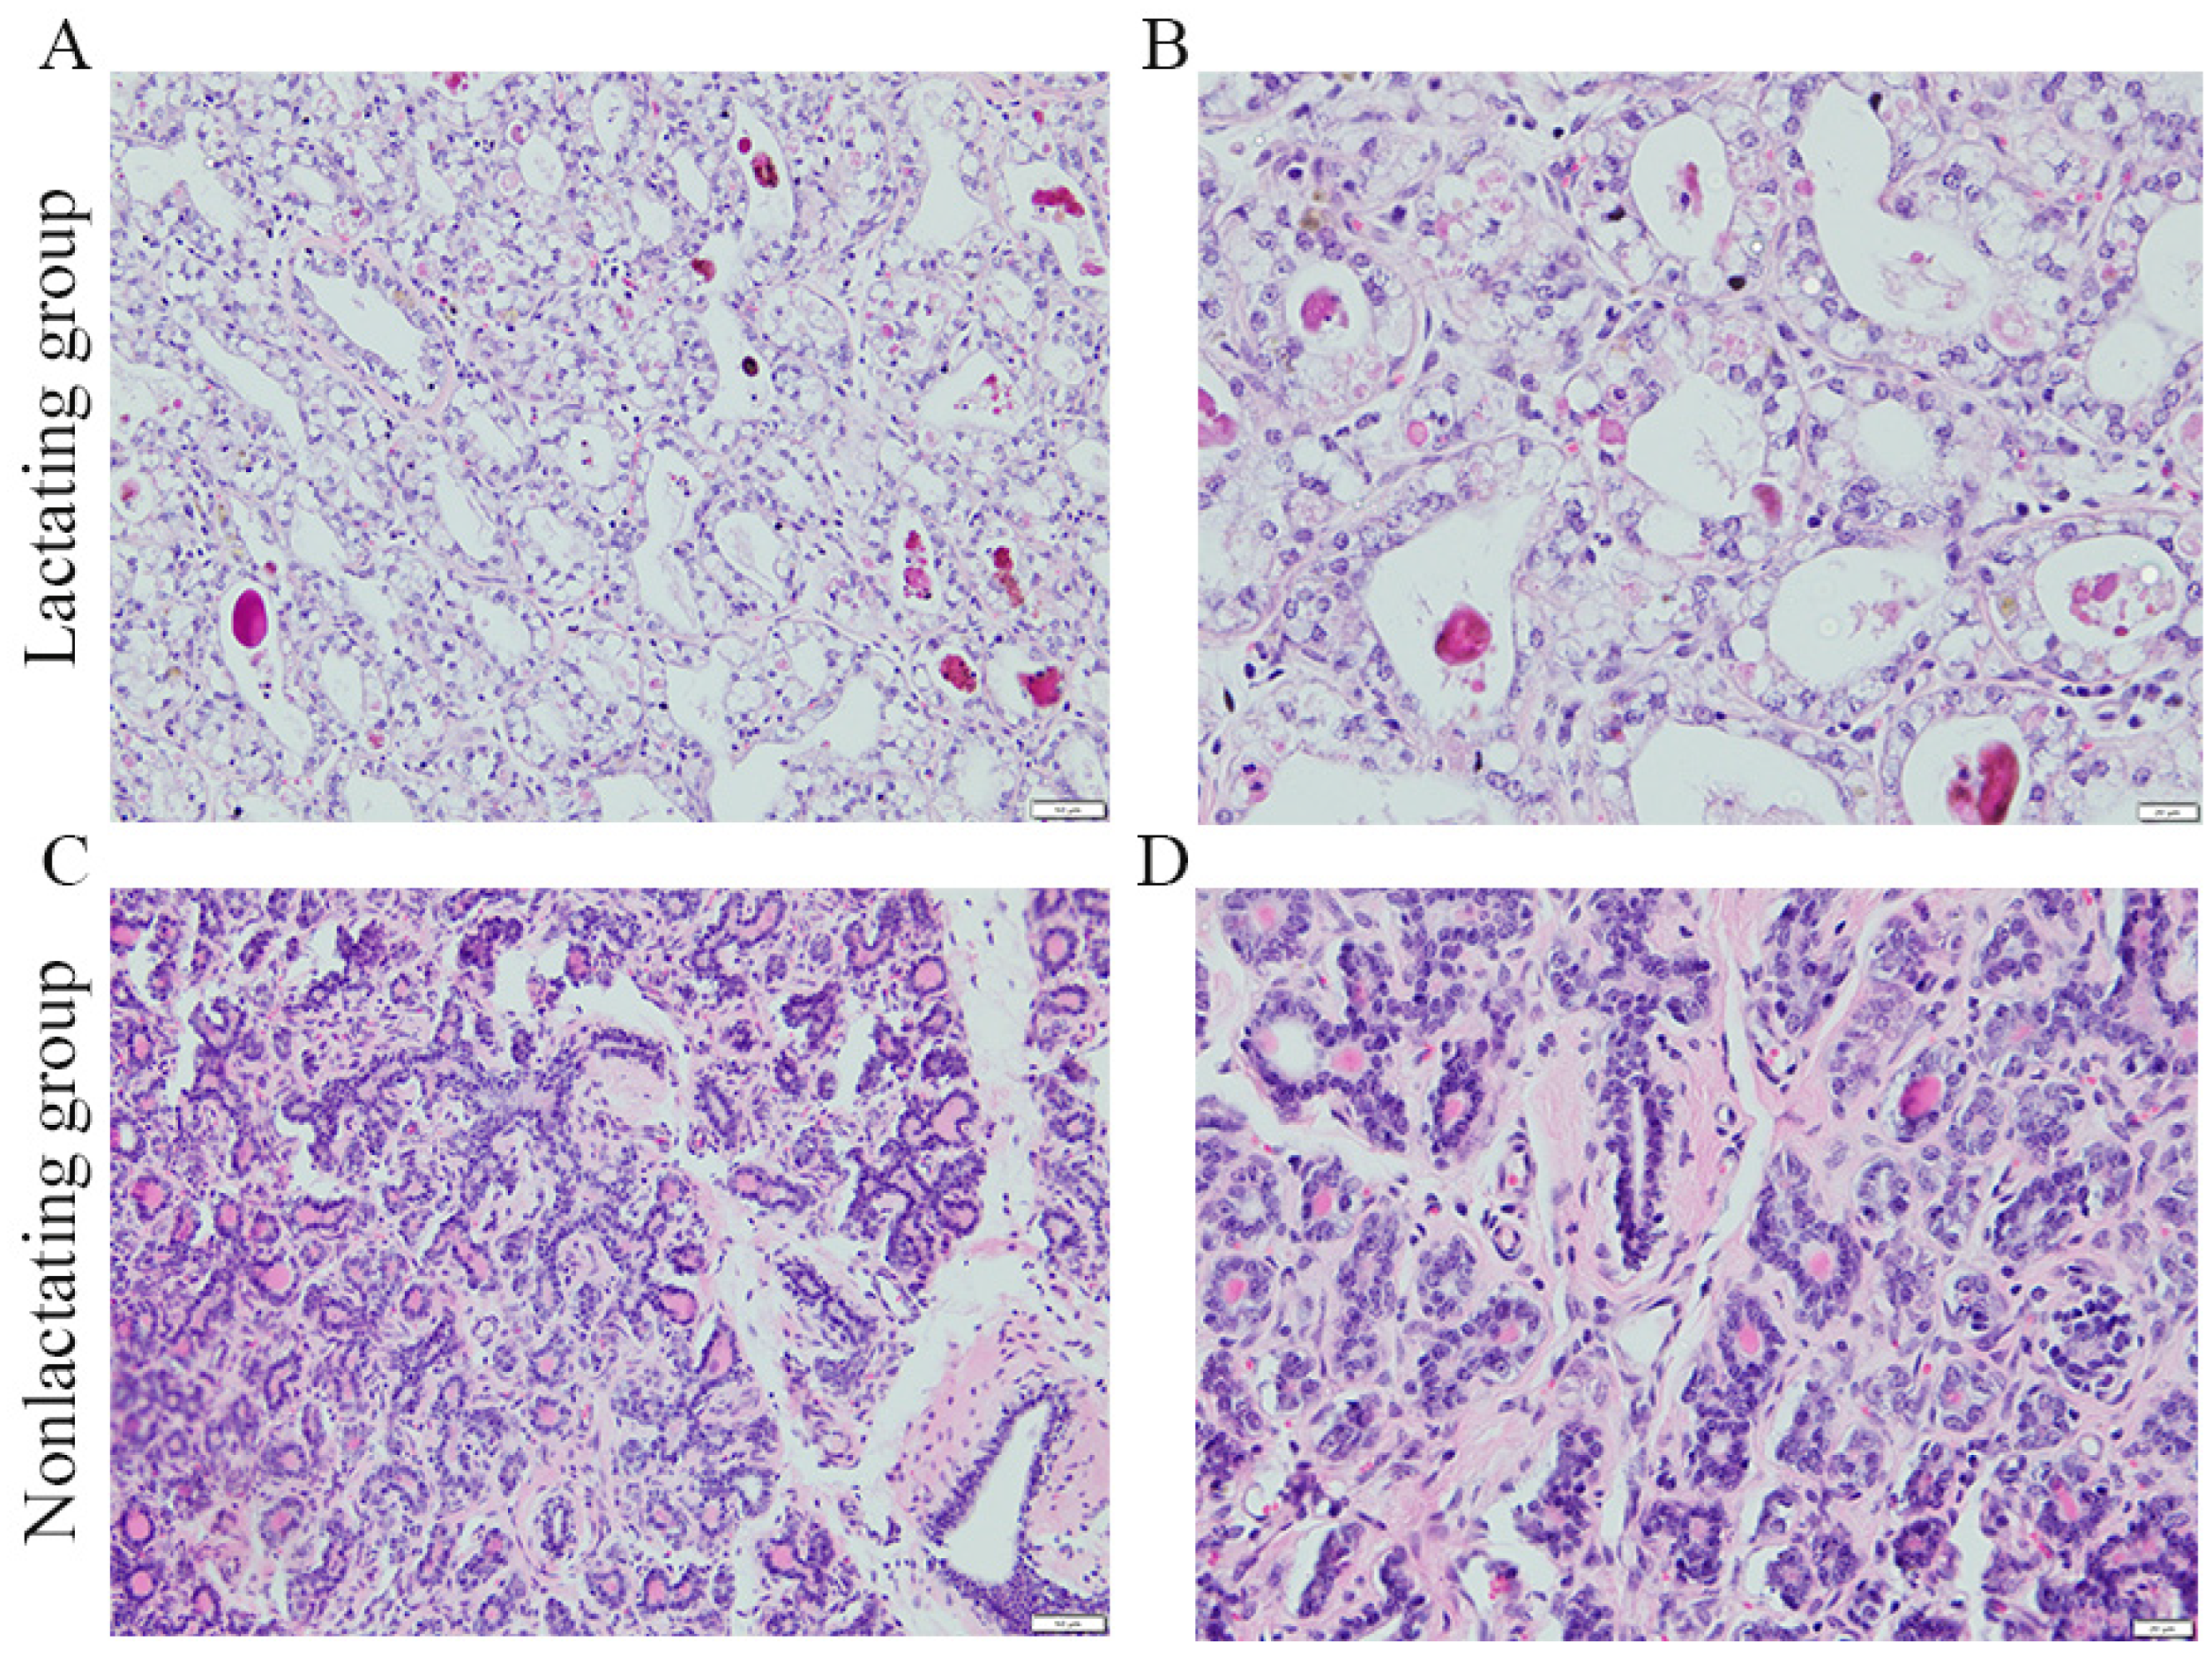
3.1. Histomorphometric Analysis of Horse Mammary Glands

We first studied the morphological and microscopic features of the mammary glands by performing HE staining of the paraffin sections of different tissue samples. The morphological differences in the mammary glands in different lactation states at the second month of gestation are shown in Figure 1. The lobules of the mammary glands in the lactating state were filled with a large number of mature alveolar structures, and the ducts were markedly thickened (Figure 1A,B). In the non-lactating state, the mammary glands were characterized by the presence of large amounts of fat and connective tissue, and the alveoli were smaller and fewer in number (Figure 1C,D). These results indicate that there are significant differences in the mammary tissue morphology between lactating and non-lactating mares.

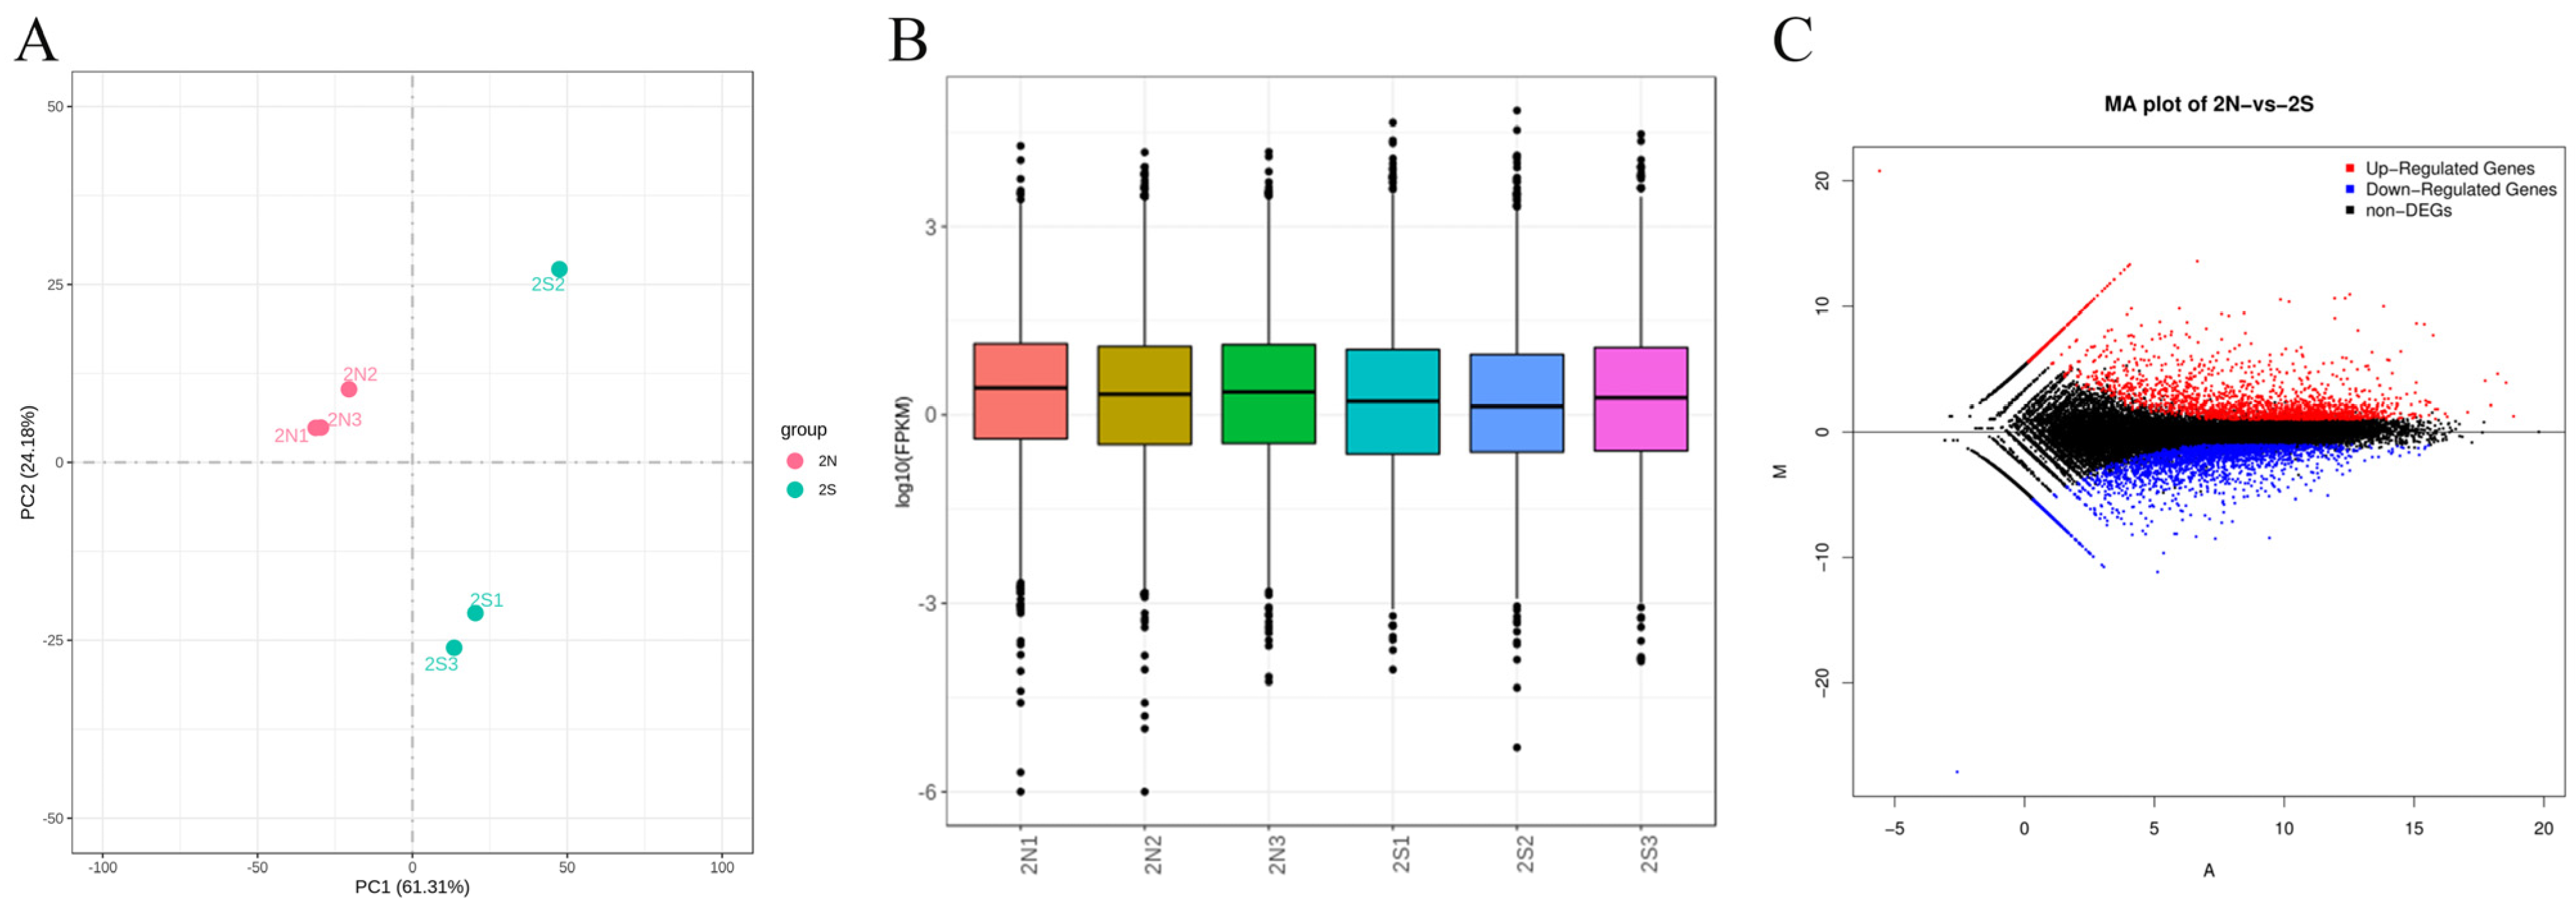
3.2. Basic Statistical Analysis Results of Sequencing Data

To analyze the gene expression profiles in the non-lactating and lactating groups during pregnancy, we sequenced six RNA libraries from Mongolian horse mammary tissues during these two periods, and the original sequence reads were quality-controlled and filtered by the sequencing platform. After removing the contaminated and low-quality reads, the total number of clean reads obtained was 386,339,097, and the clean base content of each sample reached 16,734,242,700 bp or more. The percentage of Q20 bases was greater than 97.7%, the percentage of Q30 bases was greater than 93.4%, and the total GC content after filtration ranged from 41.3.8% to 46.6%, which is close to 50% (Supplementary Table S1). The sequencing libraries generated from the gestational non-lactating and lactating groups had comparison rates of ≥95.95% with the reference genome (Supplementary Table S2).

3.3. Differential Expression Analysis Results

We analyzed all samples using a principal component analysis. The samples within the gestational lactating and non-lactating groups were clustered with each other, the similarity of the expression patterns between samples was high, and the differences between the groups were large with clear subgrouping (Figure 2A). A comparison of the FPKM density distribution of genes in different samples revealed that the FPKM distribution between samples in the gestational lactation and non-lactation groups was good overall (Figure 2B). A total of 4197 genes were differentially expressed between the non-lactation and lactation groups during pregnancy. When the threshold values were q < 0.05 and |log2-fold change| ≥ 1, 1974 of these differentially expressed genes were highly expressed in the gestational lactation group, and 2223 differentially expressed genes were highly expressed in the gestational non-lactation group (Figure 2C).

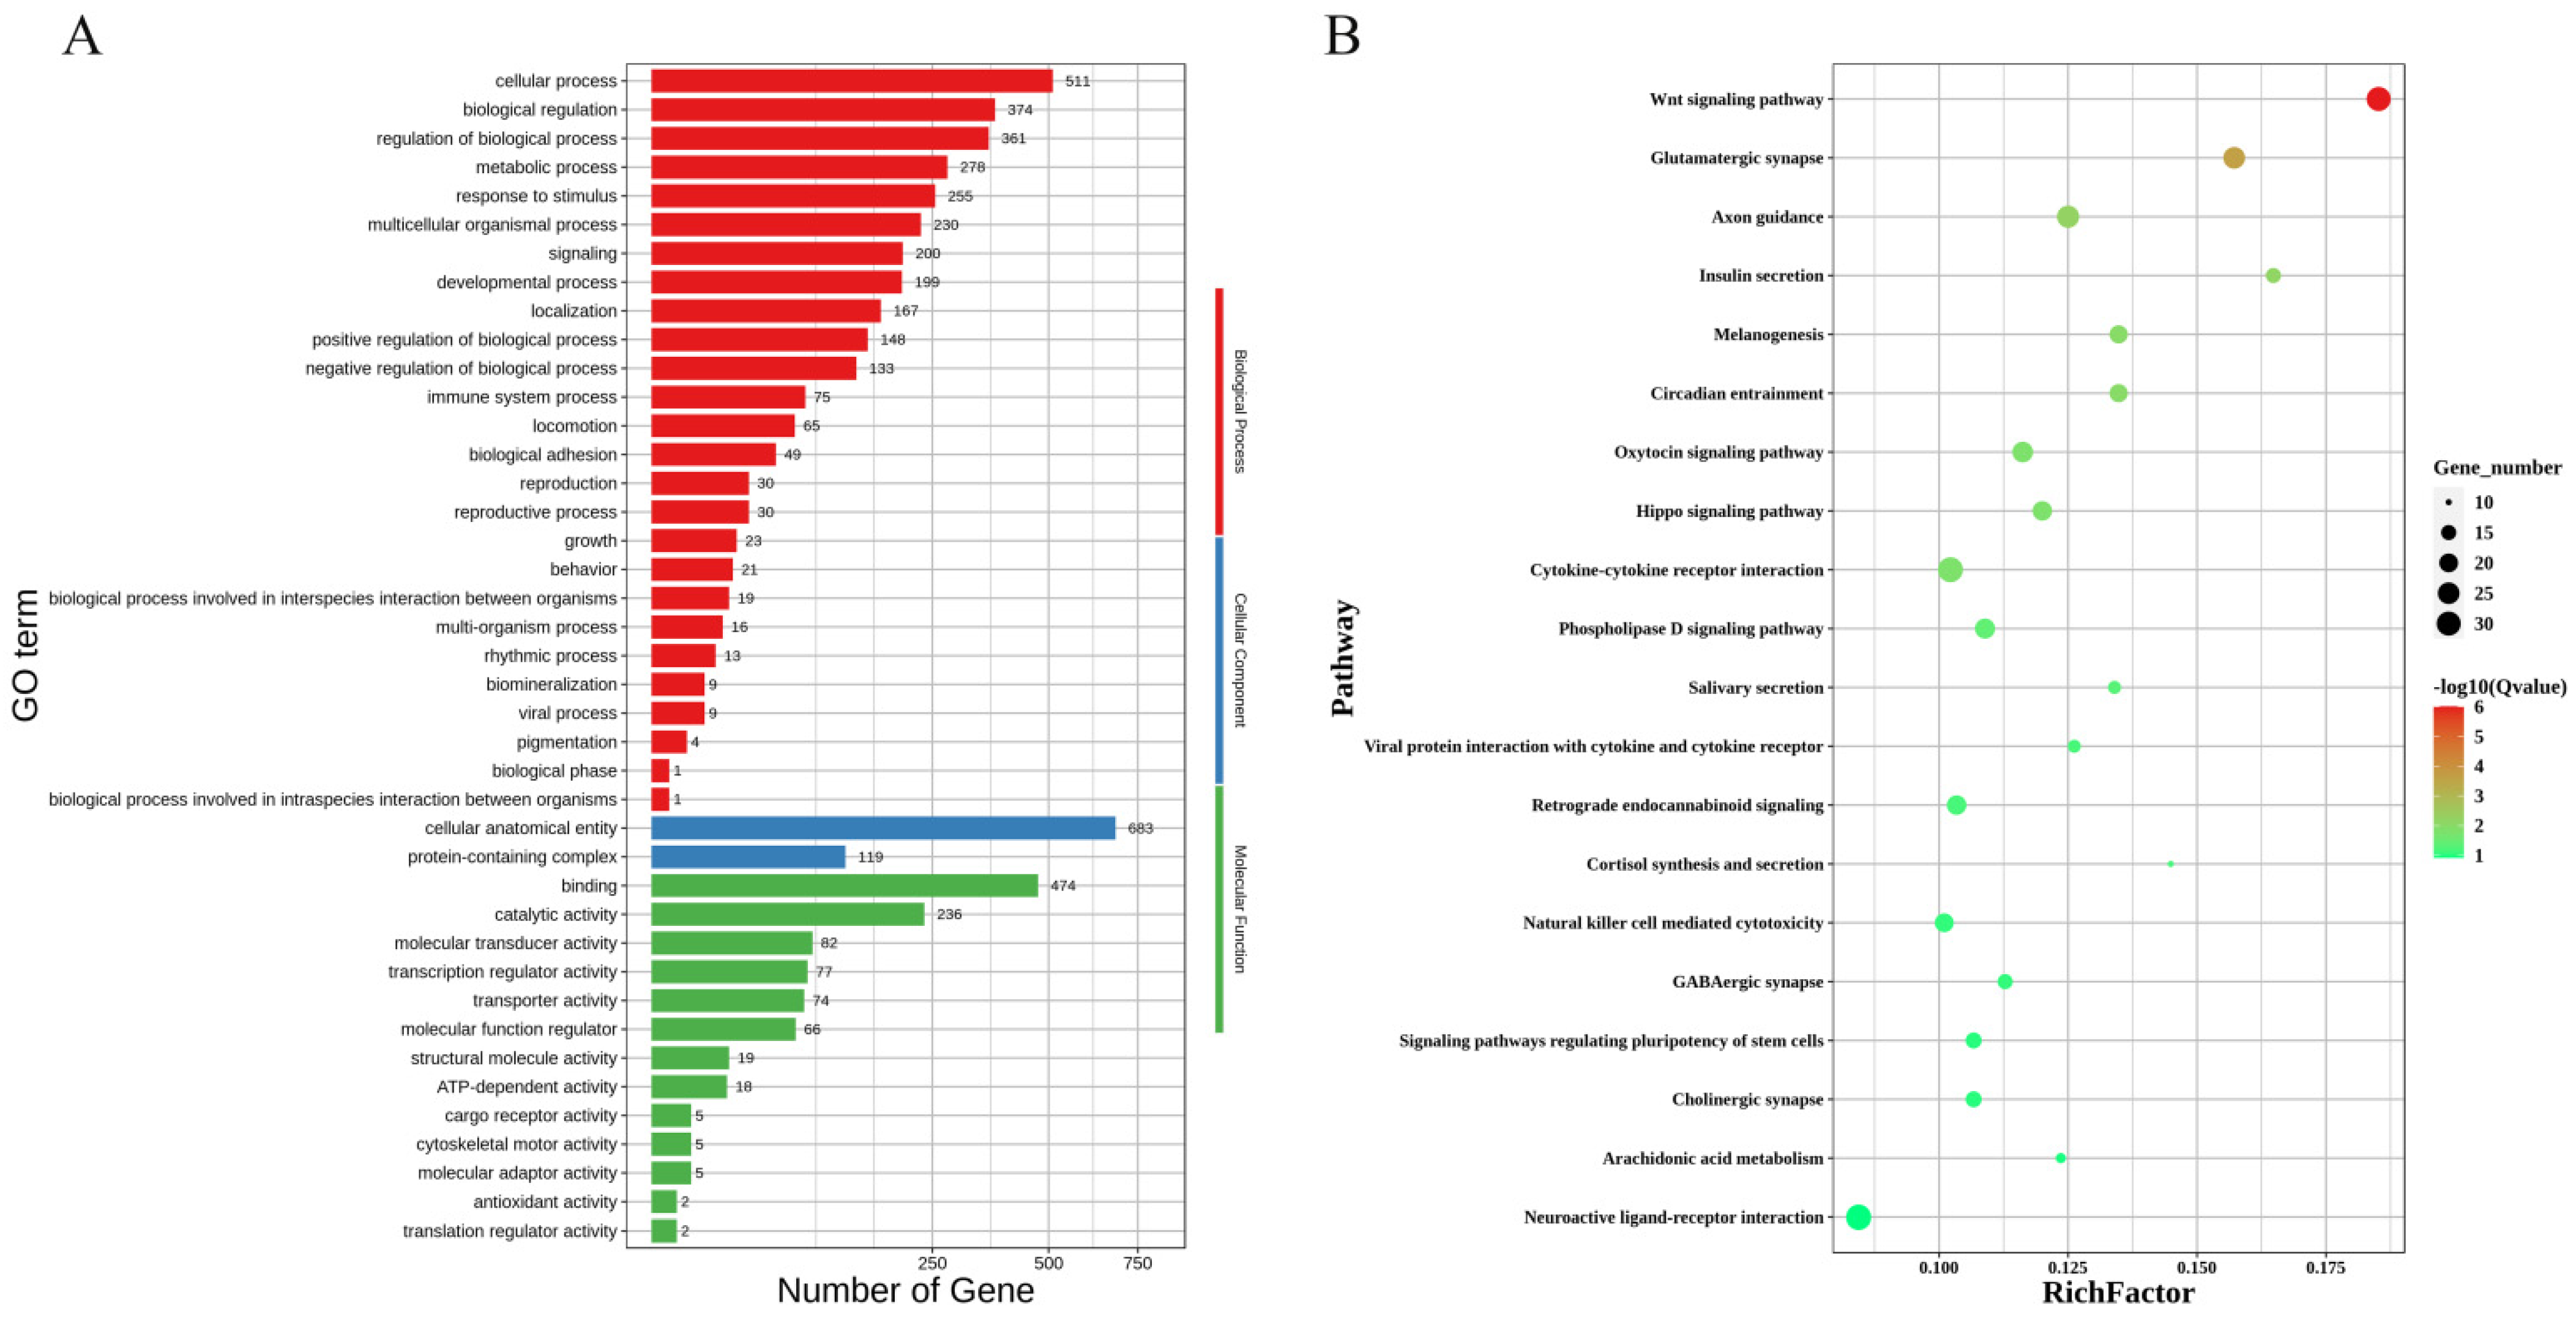
3.4. GO and KEGG Pathway Enrichment Analysis of DEGs

To obtain a more complete picture of the DEGs, we performed a GO functional enrichment analysis using DAVID. The GO enrichment analysis of highly expressed genes in the lactation group during pregnancy revealed that 42 GO terms were significantly enriched. There were 26 annotations at the biological process level, mainly including the cellular process, metabolic process, developmental process, and reproduction. At the cellular component level, the main annotation was the protein-containing complex. At the molecular function level, there were 14 annotations, mainly including binding, catalytic activity, and transporter activity. The GO annotations of the differentially expressed genes are shown in Figure 3A. The KEGG pathway enrichment analysis revealed that 20 pathways were significantly enriched (p < 0.05), including protein processing in the endoplasmic reticulum, the Toll-like receptor signaling pathway, steroid biosynthesis, cytokine–cytokine receptor interaction, amino sugar and nucleotide sugar metabolism, and the PPAR signaling pathway. The pathway annotations of some differentially expressed genes are listed in Figure 3B.
The GO enrichment analysis of the highly expressed genes in the non-lactation group during pregnancy revealed 41 GO entries at significant levels. There were 26 entries at the biological process level, including the regulation of the biological process, multicellular organismal process, and signaling; the cellular component level was mainly annotated to protein-containing complexes; and there were 13 entries at the molecular function level, including transcription regulator activity and molecular function regulator (Figure 4A). The KEGG pathway enrichment analysis revealed significant enrichment of the WNT signaling, insulin secretion, arachidonic acid metabolism, and oxytocin signaling pathways (Figure 4B). The different metabolic pathways in these results reveal differences in the metabolic activity between the two groups.

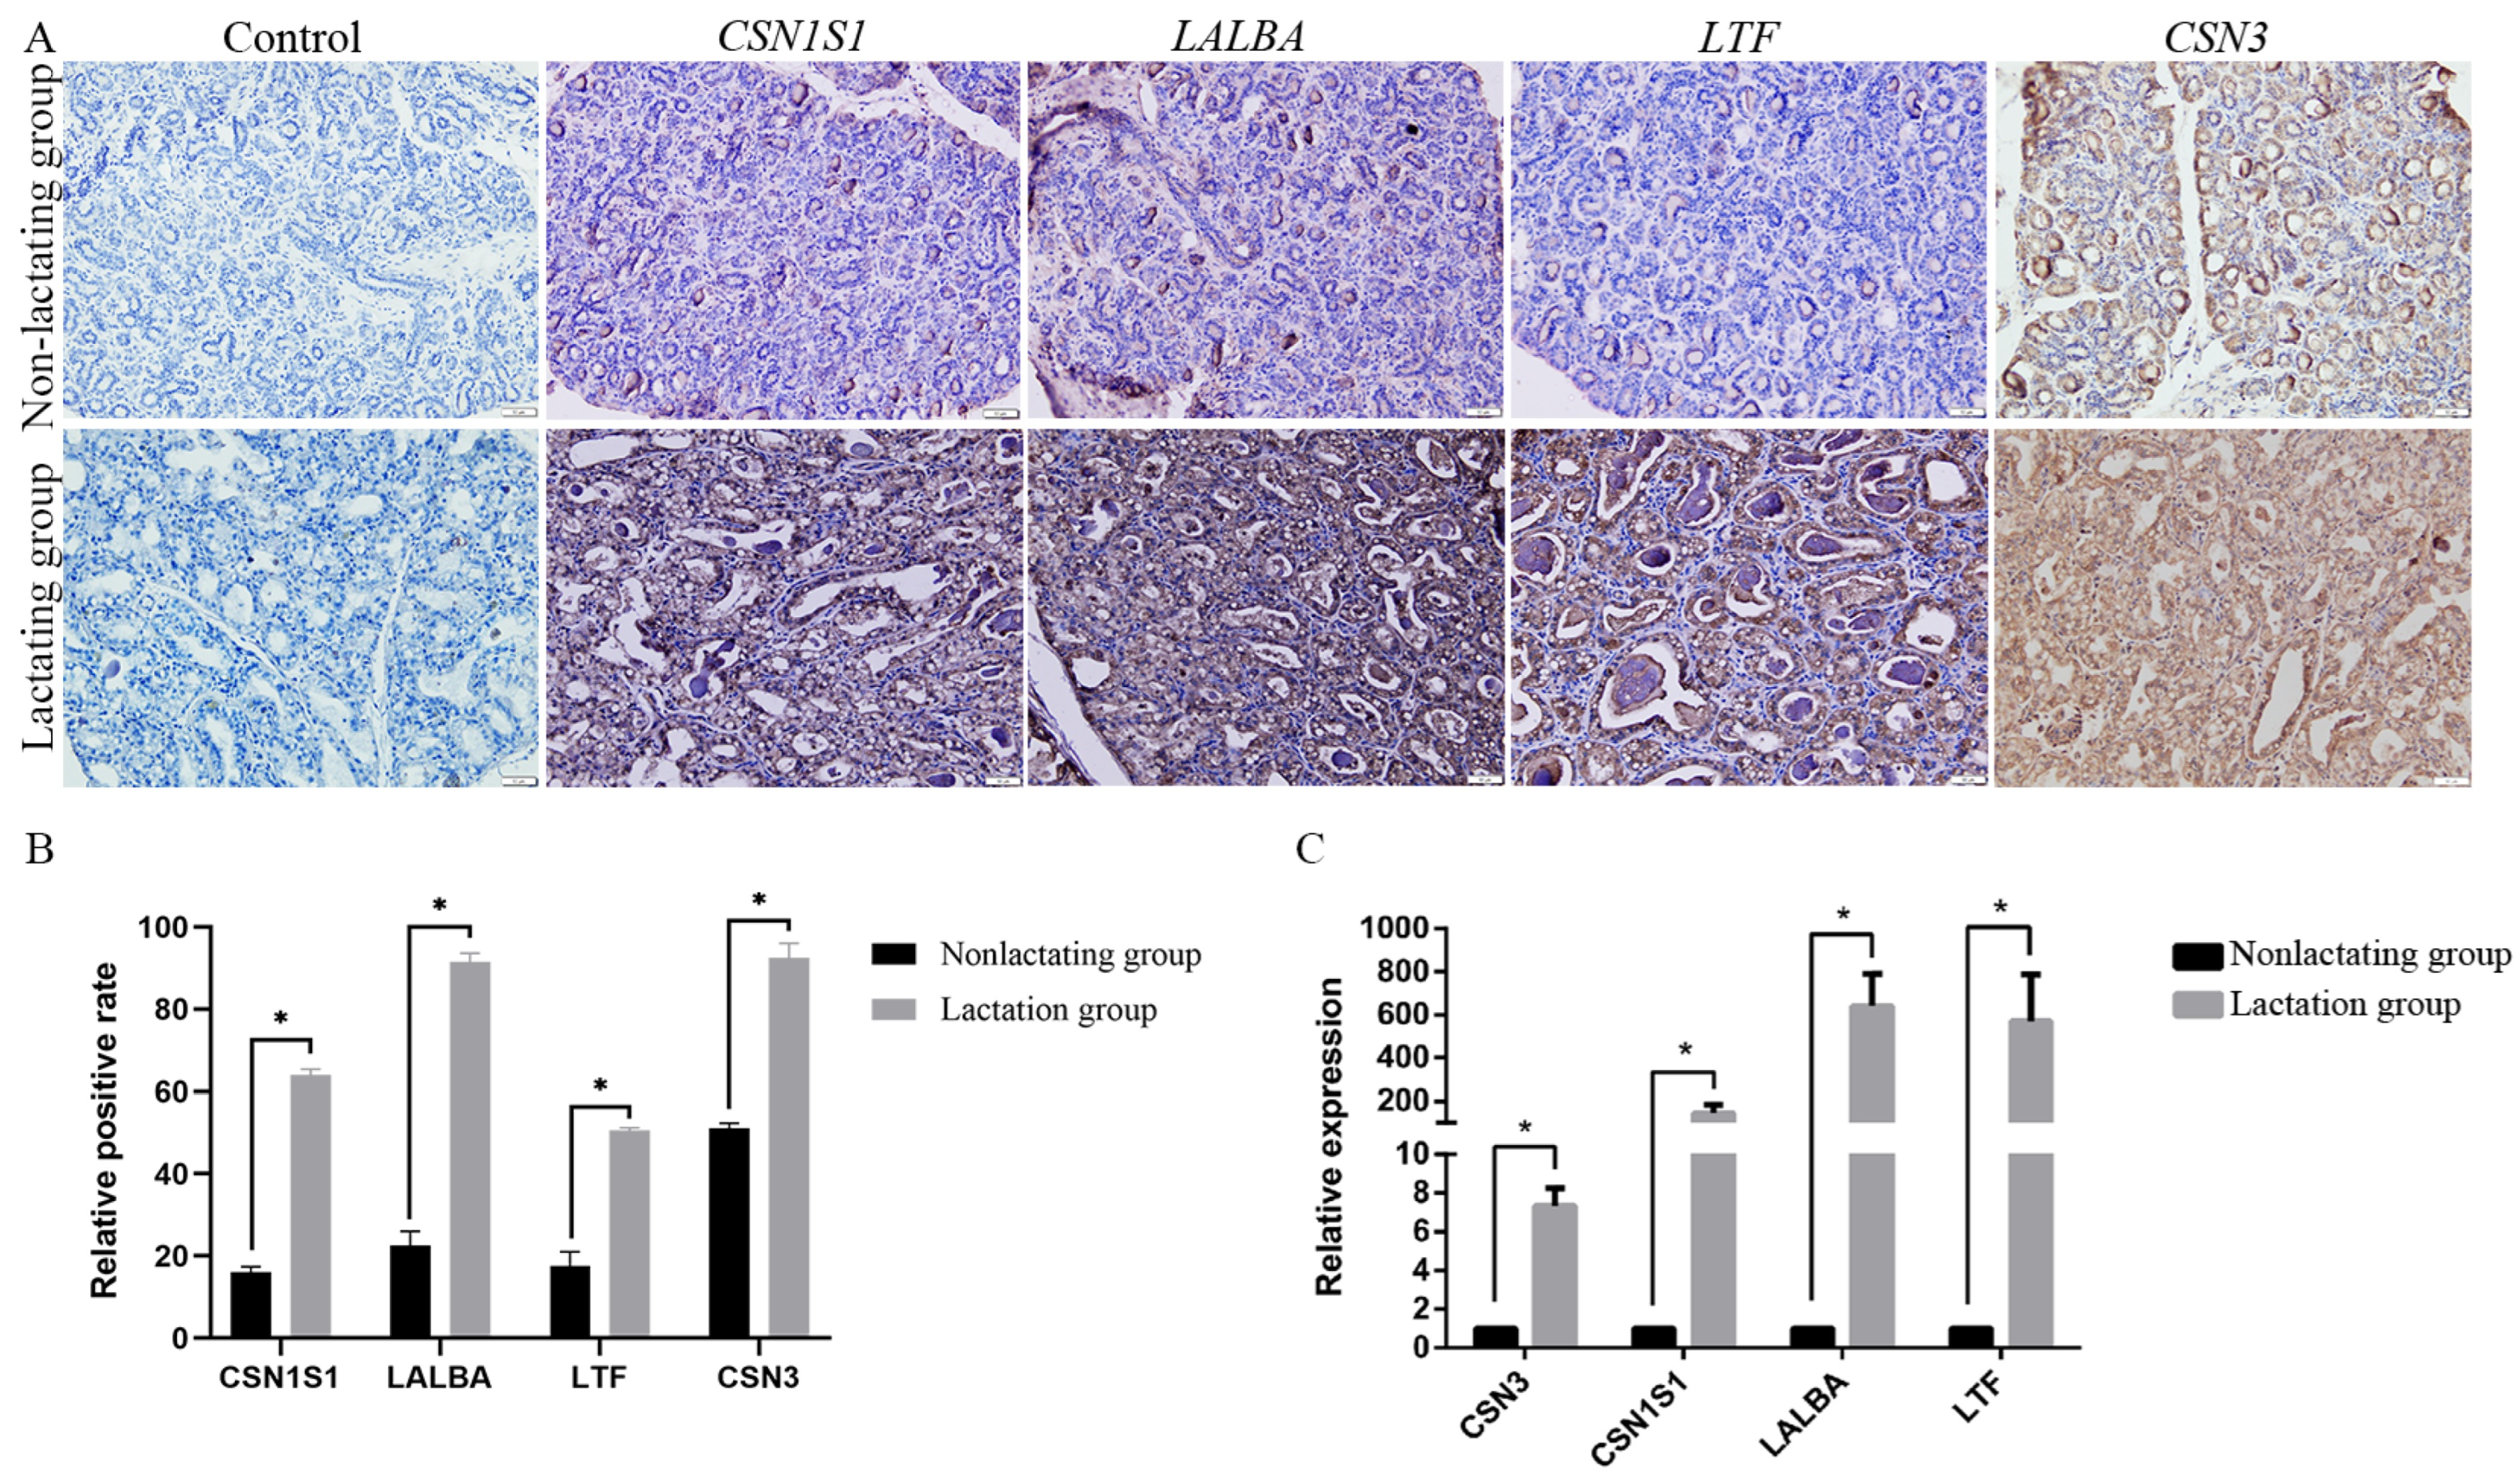
3.5. Gene Expression Patterns

To investigate the differences in the gene expression patterns between the lactation and non-lactation groups during pregnancy, we analyzed the genes that were differentially expressed between the lactation and non-lactation groups and selected genes related to the genes encoding the milk proteins α-s1-casein (CSN1S1) and k-casein (CSN3), whey proteins (LALBA), and the lactation event-related gene lactoferrin (LTF) in the lactation group for a fluorescence quantitative PCR analysis to confirm the accuracy of the transcriptome sequencing data. Overall, the gene expression patterns in the mammary tissues were consistent with the results of the transcriptome analysis, with CSN3, CSN1S1, LALBA, and LTF showing significantly greater mRNA expression in the lactation group than in the non-lactation group (Figure 5B). In addition, the expressions of CSN3, CSN1S1, LALBA, and LTF in equine mammary tissues were examined using immunohistochemistry, and the results confirm the RNA-seq and qPCR results, indicating that the CSN3, CSN1S1, LALBA, and LTF proteins were highly expressed in the lactation group during pregnancy (Figure 5A,C).
In contrast, the genes related to lipid metabolic process diacylglycerol O-acyltransferase 1 (DGAT1), leptin (LEP), and leptin receptor (LEPR) and a gene closely related to lactation events, tyrosine protein kinase (JAK1), were selected from the non-lactation group for qPCR to confirm the RNA-seq results. The results show that the gene expression patterns in the mammary tissues were consistent with the results of the transcriptome analysis, and the mRNA expression levels of LEP, LEPR, FAT1, and DGAT1 were significantly greater in the non-lactation group than in the lactation group (Figure 6B). The subsequent immunohistochemical results also confirm the consistency of LEP, LEPR, FAT1, and DGAT1 expression in the equine mammary tissues with the RNA-seq and qPCR results, indicating that the LEP, LEPR, FAT1, and DGAT1 proteins were highly expressed in the non-lactation group during pregnancy (Figure 6A,C).

4. Discussion

Lactation is a process by which milk is secreted by the mammary glands of female mammals and is promoted by a variety of hormones. Moreover, various genes and regulatory molecules are expressed at different stages of lactation and play crucial roles in lactation regulation. To improve the milk production performance of mares, an in-depth understanding of the molecular biology of the lactating mammary gland, such as the expression and regulatory mechanisms of lactation-related genes, is essential.
Transcriptome sequencing of mammary tissue from lactating and non-lactating pregnant mares revealed that 4197 genes were differentially expressed. Among these genes, 1974 were highly expressed in the gestational lactation group, and 2223 differentially expressed genes were highly expressed in the gestational non-lactation group (Figure 2C). Multiple GO classifications and KEGG pathways were found to be involved. The genes highly expressed in the lactation group included CSN3, CSN1S1, LALBA, and LTF. Among them, CSN1S1 and CSN3 are genes involved in the synthesis of casein, an important protein that has significant effects on milk fat and protein percentage; it has also been demonstrated that casein is closely related to milk production performance in horses [18]. Its deficiency slows the transportation of other casein proteins in goats [19]. In goats, multiple mutations with causal effects on the milk protein and casein contents, cheese yield, and flavor have been identified in the CSN1S1 gene [20]. The CSN1S1 genotype was significantly associated with the rennet coagulation time, curd firming time, and curd firmness in Sarda sheep [21]. In cows, the effects of the CSN1S1 genotype on the protein, casein, and whey protein contents are conflicting, with some suggesting that the BB type is better [22]. In contrast, some suggest that the BC type is better, and others indicate that neither has an effect [22,23]. However, milk from the C variant has a slightly lower fat content [24]. Furthermore, CSN1S1 polymorphisms are associated with the total milk protein content in the Polish Primitive Horse [25]. Some researchers have investigated the differences in the mRNA expression of milk fat in Kazakh horses with different milk yields, and the results show that the gene expression values of LALBA, CSN1S1, and CNS3 were higher in the high-yield group than in the low-yield group, and their DEGs were analyzed by KEGG pathway enrichment, and the amino sugar and nucleotide sugar metabolism pathways were highly enriched, which is a result that is consistent with our research result [18].
The primary function of CSN3 is to stabilize casein micelles, and enzymatic cleavage of this protein initiates coagulation. In mice, the knockout of the CSN3 gene, although it does not affect the expression of other milk proteins, leads to the destabilization of casein granules in mammary gland alveoli and reduces lactation in mammals [26]. In cattle, variants of the CSN3 gene are consistently correlated with the curdling time, milk protein content, and cheese yield [20,27]. In dairy goats, CSN3 expression was significantly and positively correlated with the protein content of milk, but the correlations with the milk yield and fat content were not significant [28]. Consistent with these findings, there were also significant correlations between CSN3 genotypes and the milk protein and casein contents in Sarda sheep [21]. A study on the effects of the CSN3 polymorphism on the milk yield, fat content, casein content, and lactose content revealed that the CSN3 BB type had a high milk yield and casein content [29].
Similar to casein genes, LALBA was highly expressed in the mammary tissue of mares in the lactation group during pregnancy. LALBA is part of the lactose synthase complex, which is involved in the formation of lactose and promotes milk production and secretion and is a plausible candidate gene for milk yield traits [30]. During the lactation cycle in humans, cows, and mice, LALBA is expressed at levels similar to those of other milk protein genes, and its expression levels increase dramatically with the onset of lactation [31]. Bleck et al. [32] reported that the concentration of LALBA in milk was positively correlated with the amounts of protein, fat, and lactose in the milk. Sheep LALBA gene polymorphisms were highly correlated with the milk protein and fat contents in the Churra breed [33]. Moreover, LALBA gene polymorphisms are significantly associated with milk production performance, and mutations in this gene affect the milk production performance of cows [34]. However, the effects of this gene and the genotype of CSN1S1 on the milk process quality were not significant [23]. Moreover, the regulatory variants of the LALBA gene seemed to have no significant effect on the milk composition or coagulation properties of Sarda sheep [21]. This gene may be associated with a high lactose content in equine milk and has a crucial role in equine lactation.
Lactoferrin (LTF) is a multifunctional glycoprotein widely found in human and mammalian milk. It is involved in immunomodulation and has a variety of functions, such as antibacterial, anti-inflammatory, antiviral, and antioxidant activities. The immunomodulatory role of LTF lies in its ability to regulate innate and adaptive immunity [35]. It has been shown that the breed of horse and the duration of lactation have significant effects on the amount of LTF in milk, and the polymorphisms of the LTF gene are breed-specific. The highest level of LTF was found in the Polish Warmblood Horse compared with the Polish Primitive Horse and the Polish Coldblood Horse, and the concentration of LTF in horse milk was the highest at the fifth week of postnatal life until it decreased significantly at the tenth week of postnatal life [36]. Consistent with these findings, the expression of the porcine LTF gene was found to decrease gradually with lactation, indicating that it is closely related to mammary gland development [37]. In addition, Yang Kun et al. [38] reported that the average daily milk yield differed among Ili horses with different genotypes of LTF (GG > GA > AA). Similarly, in Chinese Holstein cows, polymorphisms in the LTF gene were significantly correlated with milk production shapes, such as the average daily milk yield and milk fat percentage [39].
In addition, the expression profiles of lipid metabolism-related genes were significantly different between the two groups. Among them, DGAT1 is one of the many proteins that make up the TAG synthesis pathway [40]. This gene plays an important role in the formation of milk fat in mammary epithelial cells, and its polymorphism is closely related to the synthesis of milk fat, which is an important quantitatively inherited trait in the lactation process [41]. Studies have shown that the DGAT1 gene is critical for mammary gland development and milk synthesis in mice [42]. Additionally, DGAT1 plays a key role in increasing milk TAG [43]. Strucken et al. [44] reported that DGAT1 has highly significant effects on milk yield and milk fat at the peak of the laying season. In contrast, Bionaz M [45] indicated that DGAT1 is less important for overall milk fat synthesis than other genes involved in TAG synthesis, but relative mRNA abundance is moderately upregulated during early lactation.
Leptin, encoded and regulated by the LEP gene, is a protein hormone secreted mainly by white fat, and its activity is mediated by the transmembrane receptor OB-R, which is encoded and regulated by LEPR [46]. Leptin can be synthesized and secreted by mammary epithelial cells, and its absence leads to a significant weakening of mammary duct branching in mice, which affects their development [47,48]. Leptin can increase the expression of the β-casein gene in the mammary tissue of dairy goats during lactation [49]. Wang Nan [50] reported that leptin activated the PI3K–AKT–mTOR signaling pathway and upregulated the expression levels of the milk fat synthesis-related genes ACC, FASN, DGAT1, and SREBP1, thereby increasing milk fat synthesis. In addition, LEP and LEPR gene mutations inhibit lipid metabolism [51]. Leptin knockdown in the transverse colon of mice resulted in a decreased expression of genes related to lipid synthesis [52]. In the present study, we found that lower expressions of DGAT1, LEP, and LEPR during the lactation stage in horses inhibited milk fat synthesis, which may be responsible for the lower fat content in equine milk than in cow milk.
Regarding the study of different milk production in horses, in addition to the study of mRNAs of horse milk lipids, there are laboratories that have used RNA-Seq technology to study the differentially expressed miRNAs between the milk production phenotypes of high- and low-producing Kazakh horses, and a total of 83 differentially expressed miRNA and 2415 genes have been identified, which are enriched for mammary gland development, mammary gland morphogenesis, tissue development, the PI3K-Akt signaling pathway, insulin signaling pathway, Wnt signaling pathway, and TGF-β signaling pathway. The insulin signaling pathway and the Wnt signaling pathway were also enriched in our analysis, indicating the importance of this pathway in equine lactation [53].
There was also a report that genome-wide DNA methylation profiles of high- and low-milk-yielding Kazakh equine blood were investigated using deep whole-genome bisulfite sequencing, and 27,172 differentially methylated regions and 8268 differentially methylated region-associated genes (DMGs) were identified, and their functional enrichment analysis of overlapping differentially methylated genes in combination with WGBS-seq and RNA-seq data revealed that nine DMGs in the AGE-RAGE and PI3K-Akt signaling pathways, including GJA1, RAC1, LTBP1, TIAM1, SERPINB6, DGKG, IL7, FN1, and COL1A1, were the ones that might play a decisive role in milk production in Kazakh horses [54].
In our study, through an enrichment analysis of differentially expressed genes in the lactation and non-lactation groups, we screened genes encoding milk protein-related genes (CSN1S1, CSN3, and LALBA), genes related to lipid metabolism processes (DGAT1, LEP, and LEPR), and genes that are closely related to lactation events (FAT1 and LTF), which can be used as candidate genes to select for mare lactation traits. In addition, there were differences in metabolic activities between the two groups, e.g., amino sugar and nucleotide sugar metabolism were highly enriched in the lactation group, whereas arachidonic acid metabolism was highly enriched in the non-lactation group. Furthermore, the PPAR signaling pathway was highly enriched in the gestational lactation group, and it may also play a key role in mare lactation.

5. Conclusions

In summary, we analyzed the mammary glands’ transcriptome expression differences between lactating and non-lactating mares in the second month of gestation using RNA-seq and obtained a total of 4197 DEGs, and their functional analyses are of theoretical and practical reference value for the further development of molecular breeding research in dairy horses.

Supplementary Materials

The following supporting information can be downloaded at https://www.mdpi.com/article/10.3390/ani14162319/s1, Supplementary Table S1: Quality control of Mongolian horse mammary RNA-seq data; Supplementary Table S2: The reads were aligned to the reference genome; Supplementary File S1: Equine reference genome information; Supplementary Table S3: qPCR primers for DEG validations; Supplementary Table S4: RNA-seq data statistics.

Author Contributions

Conceptualization, G.B., M.D., T.U. and M.W.; investigation, T.U., M.W. and Y.S.; formal analysis, M.W., M.Y. and X.W.; validation, B.Z., X.W. and Y.S.; software, Y.M.; writing—original draft preparation, G.B., T.U. and M.W.; writing—review and editing, G.B.; visualization, T.U., B.Z., M.Y. and Y.M.; supervision, X.W.; resources, Y.M. and M.D.; project administration, G.B. and M.D.; funding acquisition, G.B. and M.D. All authors have read and agreed to the published version of the manuscript.

Funding

This work was supported by the Inner Mongolia Autonomous Region Key R&D Project (2023YFDZ0002) and the basic scientific research operating expenses project of universities directly under the Inner Mongolia Autonomous Region (BR221208).

Institutional Review Board Statement

All sampling procedures were approved by the Laboratory Animal Welfare and Ethics Committee of the Inner Mongolia Agricultural University and were conducted in accordance with the prescribed standards.

Informed Consent Statement

Not applicable.

Data Availability Statement

RNA-seq raw data were deposited in the following NCBI database: BioProjects PRJNA1142614.

Conflicts of Interest

The authors have no relevant financial or non-financial interests to disclose.

References

  1. Wang, J.; Guo, Z.; Zhang, Q.; Yan, L.; Chen, W.; Liu, X.M.; Zhang, H.P. Fermentation characteristics and transit tolerance of probiotic Lactobacillus casei Zhang in soymilk and bovine milk during storage. J. Dairy Sci. 2009, 92, 2468–2476. [Google Scholar] [CrossRef] [PubMed]
  2. Martuzzi, F.; Franceschi, P.; Formaggioni, P. Fermented Mare Milk and Its Microorganisms for Human Consumption and Health. Foods 2024, 13, 493. [Google Scholar] [CrossRef] [PubMed]
  3. Burenbayaer; Zhao, J.J.; Qiao, X.H. Nutrition and health care function of mare’s milk. Mod. Anim. Husb. 2023, 3, 43. (In Chinese) [Google Scholar] [CrossRef]
  4. Barreto, I.; Urbano, S.A.; Oliveira, C.A.A.; Macedo, C.S.; Borba, L.H.F.; Chags, B.M.E.; Rangel, A.H.N. Chemical composition and lipid profile of mare colostrum and milk of the quarter horse breed. PLoS ONE 2020, 15, e0238921. [Google Scholar] [CrossRef] [PubMed]
  5. Musaev, A.; Sadykova, S.; Anambayeva, A.; Saizhanova, M.; Balkanay, G.; Kolbaev, M. Mare’s Milk: Composition, Properties, and Application in Medicine. Arch. Razi Inst. 2021, 76, 1125–1135. [Google Scholar] [CrossRef]
  6. Xue, Q.G.; Schey, K.L.; Volety, A.K.; Chu, F.L.; La Peyre, J.F. Purification and characterization of lysozyme from plasma of the eastern oyster (Crassostrea virginica). Comp. Biochem. Physiol. Part B Biochem. Mol. Biol. 2004, 139, 11–25. [Google Scholar] [CrossRef]
  7. Pecka, E.; Dobrzanski, Z.; Zachwieja, A.; Szulc, T.; Czyz, K. Studies of composition and major protein level in milk and colostrum of mares. Anim. Sci. J. 2012, 83, 162–168. [Google Scholar] [CrossRef]
  8. Reiter, A.S.; Reed, S.A. Lactation in horses. Anim. Front. Rev. Mag. Anim. Agric. 2023, 13, 96–100. [Google Scholar] [CrossRef] [PubMed]
  9. Andersen, J.H.; Osbakk, S.A.; Vorland, L.H.; Traavik, T.; Gutteberg, T.J. Lactoferrin and cyclic lactoferricin inhibit the entry of human cytomegalovirus into human fibroblasts. Antivir. Res. 2001, 51, 141–149. [Google Scholar] [CrossRef]
  10. Superti, F. Lactoferrin from Bovine Milk: A Protective Companion for Life. Nutrients 2020, 12, 2562. [Google Scholar] [CrossRef]
  11. Li, N.; Xie, Q.; Chen, Q.; Evivie, S.E.; Liu, D.; Dong, J.; Huo, G.; Li, B. Cow, Goat, and Mare Milk Diets Differentially Modulated the Immune System and Gut Microbiota of Mice Colonized by Healthy Infant Feces. J. Agric. Food Chem. 2020, 68, 15345–15357. [Google Scholar] [CrossRef]
  12. Chen, Y.; Chen, Y.; Shi, C.; Huang, Z.; Zhang, Y.; Li, S.; Li, Y.; Ye, J.; Yu, C.; Li, Z.; et al. SOAPnuke: A MapReduce acceleration-supported software for integrated quality control and preprocessing of high-throughput sequencing data. GigaScience 2018, 7, 1–6. [Google Scholar] [CrossRef] [PubMed]
  13. Kim, D.; Langmead, B.; Salzberg, S.L. HISAT: A fast spliced aligner with low memory requirements. Nat. Methods 2015, 12, 357–360. [Google Scholar] [CrossRef]
  14. Langmead, B. Aligning short sequencing reads with Bowtie. Curr. Protoc. Bioinform. 2010, 11, Unit 11.7. [Google Scholar] [CrossRef]
  15. Li, B.; Dewey, C.N. RSEM: Accurate transcript quantification from RNA-Seq data with or without a reference genome. BMC Bioinform. 2011, 12, 323. [Google Scholar] [CrossRef]
  16. Trapnell, C.; Williams, B.A.; Pertea, G.; Mortazavi, A.; Kwan, G.; van Baren, M.J.; Salzberg, S.L.; Wold, B.J.; Pachter, L. Transcript assembly and quantification by RNA-Seq reveals unannotated transcripts and isoform switching during cell differentiation. Nat. Biotechnol. 2010, 28, 511–515. [Google Scholar] [CrossRef] [PubMed]
  17. Love, M.I.; Huber, W.; Anders, S. Moderated estimation of fold change and dispersion for RNA-seq data with DESeq2. Genome Biol. 2014, 15, 550. [Google Scholar] [CrossRef]
  18. Yu, X.; Fang, C.; Liu, L.; Zhao, X.; Liu, W.; Cao, H.; Lv, S. Transcriptome study underling difference of milk yield during peak lactation of Kazakh horse. J. Equine Vet. Sci. 2021, 102, 103424. [Google Scholar] [CrossRef] [PubMed]
  19. Chanat, E.; Martin, P.; Ollivier-Bousquet, M. Alpha(S1)-casein is required for the efficient transport of beta- and kappa-casein from the endoplasmic reticulum to the Golgi apparatus of mammary epithelial cells. J. Cell Sci. 1999, 112 Pt 19, 3399–3412. [Google Scholar] [CrossRef]
  20. Martin, P.; Szymanowska, M.; Zwierzchowski, L.; Leroux, C. The impact of genetic polymorphisms on the protein composition of ruminant milks. Reprod. Nutr. Dev. 2002, 42, 433–459. [Google Scholar] [CrossRef]
  21. Noce, A.; Pazzola, M.; Dettori, M.L.; Amills, M.; Castello, A.; Cecchinato, A.; Bittante, G.; Vacca, G.M. Variations at regulatory regions of the milk protein genes are associated with milk traits and coagulation properties in the Sarda sheep. Anim. Genet. 2016, 47, 717–726. [Google Scholar] [CrossRef] [PubMed]
  22. Gai, N.; Uniacke-Lowe, T.; O’Regan, J.; Faulkner, H.; Kelly, A.L. Effect of Protein Genotypes on Physicochemical Properties and Protein Functionality of Bovine Milk: A Review. Foods 2021, 10, 2409. [Google Scholar] [CrossRef] [PubMed]
  23. Citek, J.; Samkova, E.; Brzakova, M.; Hanus, O.; Vecerek, L.; Hostickova, I.; Jozova, E.; Hasonova, L.; Halova, K. CSN1S1 and LALBA Polymorphisms and Other Factors Influencing Yield, Composition, Somatic Cell Score, and Technological Properties of Cow’s Milk. Animals 2023, 13, 2079. [Google Scholar] [CrossRef] [PubMed]
  24. Jia, R.; Fu, Y.; Xu, L.; Li, H.; Li, Y.; Liu, L.; Ma, Z.; Sun, D.; Han, B. Associations between polymorphisms of SLC22A7, NGFR, ARNTL and PPP2R2B genes and Milk production traits in Chinese Holstein. BMC Genom. Data 2021, 22, 47. [Google Scholar] [CrossRef] [PubMed]
  25. Cieslak, J.; Wodas, L.; Borowska, A.; Pawlak, P.; Czyzak-Runowska, G.; Wojtowski, J.; Puppel, K.; Kuczynska, B.; Mackowski, M. 5’-flanking variants of equine casein genes (CSN1S1, CSN1S2, CSN2, CSN3) and their relationship with gene expression and milk composition. J. Appl. Genet. 2019, 60, 71–78. [Google Scholar] [CrossRef] [PubMed]
  26. Moioli, B.; D’Andrea, M.; Pilla, F.J.S.R.R. Candidate genes affecting sheep and goat milk quality. Small Rumin. Res. 2007, 68, 179–192. [Google Scholar] [CrossRef]
  27. Bittante, G.; Penasa, M.; Cecchinato, A. Invited review: Genetics and modeling of milk coagulation properties. J. Dairy Sci. 2012, 95, 6843–6870. [Google Scholar] [CrossRef] [PubMed]
  28. Li, L. Expression Analysis of CSN1S2, CSN2 and CSN3 Genes in Mammary Glands of XINONG SAANEN Dairy Goat; Northwest Agriculture & Forestry University: Xianyang, China, 2009. [Google Scholar]
  29. Fan, B.L.; Li, N.; Hu, X.X.; Wu, C.X. Cloning, sequencing and polymorphism analyzing of the exon 4 of the kappa-casein gene in yak. Prog. Nat. Sci. 2000, 10, 769. (In Chinese) [Google Scholar]
  30. Layman, D.K.; Lonnerdal, B.; Fernstrom, J.D. Applications for alpha-lactalbumin in human nutrition. Nutr. Rev. 2018, 76, 444–460. [Google Scholar] [CrossRef]
  31. Sharp, J.A.; Lefevre, C.; Nicholas, K.R. Lack of functional alpha-lactalbumin prevents involution in Cape fur seals and identifies the protein as an apoptotic milk factor in mammary gland involution. BMC Biol. 2008, 6, 48. [Google Scholar] [CrossRef]
  32. Bleck, G.T.; Bremel, R.D. Correlation of the alpha-lactalbumin (+15) polymorphism to milk production and milk composition of Holsteins. J. Dairy Sci. 1993, 76, 2292–2298. [Google Scholar] [CrossRef] [PubMed]
  33. Garcia-Gamez, E.; Gutierrez-Gil, B.; Sahana, G.; Sanchez, J.P.; Bayon, Y.; Arranz, J.J. GWA analysis for milk production traits in dairy sheep and genetic support for a QTN influencing milk protein percentage in the LALBA gene. PLoS ONE 2012, 7, e47782. [Google Scholar] [CrossRef] [PubMed]
  34. Martins, L.F.; Milazzotto, M.P.; Feitosa, W.B.; Coutinho, A.R.; Simoes, R.; Marques, M.G.; Assumpcao, M.E.; Visintin, J.A. Sequence variation of the alpha-lactalbumin gene in Holstein and Nellore cows. Anim. Biotechnol. 2008, 19, 194–198. [Google Scholar] [CrossRef] [PubMed]
  35. Cao, X.; Ren, Y.; Lu, Q.; Wang, K.; Wu, Y.; Wang, Y.; Zhang, Y.; Cui, X.S.; Yang, Z.; Chen, Z. Lactoferrin: A glycoprotein that plays an active role in human health. Front Nutr 2022, 9, 1018336. [Google Scholar] [CrossRef] [PubMed]
  36. Cieslak, J.; Wodas, L.; Borowska, A.; Sadoch, J.; Pawlak, P.; Puppel, K.; Kuczynska, B.; Mackowski, M. Variability of lysozyme and lactoferrin bioactive protein concentrations in equine milk in relation to LYZ and LTF gene polymorphisms and expression. J. Sci. Food Agric. 2017, 97, 2174–2181. [Google Scholar] [CrossRef] [PubMed]
  37. Zhong, F.; Wang, X. Isolation and expression of porcine lactoferrin gene. Prog. Vet. Med. 1999, 20, 47. (In Chinese) [Google Scholar] [CrossRef]
  38. Yang, K.; Gao, Y.; Wu, M.L.; Lan, X.Y.; Lei, C.C.; Chen, H.; Liu, W.J.; Dang, R.H. Polymorphism of LTF gene and its Correlation with lactation performance in Yili horse. J. Domest. Anim. Ecol. 2018, 39, 24. (In Chinese) [Google Scholar]
  39. Li, Z.Q.; Ma, S.H.; Xu, J.; Wen, L.; Tian, L.; Liu, L.X.; Zhang, L. Genetic polymorphism of LF gene and its associations with milk traits and mastitis of Chinese Holstein cattle. Acta Agric. Zhejiangensis 2016, 28, 1142. (In Chinese) [Google Scholar] [CrossRef]
  40. Coleman, R.A.; Lee, D.P. Enzymes of triacylglycerol synthesis and their regulation. Prog. Lipid Res. 2004, 43, 134–176. [Google Scholar] [CrossRef]
  41. Invernizzi, G.; Thering, B.J.; McGuire, M.A.; Savoini, G.; Loor, J.J. Sustained upregulation of stearoyl-CoA desaturase in bovine mammary tissue with contrasting changes in milk fat synthesis and lipogenic gene networks caused by lipid supplements. Funct. Integr. Genom. 2010, 10, 561–575. [Google Scholar] [CrossRef]
  42. Cases, S.; Zhou, P.; Shillingford, J.M.; Wiseman, B.S.; Fish, J.D.; Angle, C.S.; Hennighausen, L.; Werb, Z.; Farese, R.V., Jr. Development of the mammary gland requires DGAT1 expression in stromal and epithelial tissues. Development 2004, 131, 3047–3055. [Google Scholar] [CrossRef] [PubMed]
  43. Grisart, B.; Farnir, F.; Karim, L.; Cambisano, N.; Kim, J.J.; Kvasz, A.; Mni, M.; Simon, P.; Frere, J.M.; Coppieters, W.; et al. Genetic and functional confirmation of the causality of the DGAT1 K232A quantitative trait nucleotide in affecting milk yield and composition. Proc. Natl. Acad. Sci. USA 2004, 101, 2398–2403. [Google Scholar] [CrossRef] [PubMed]
  44. Strucken, E.M.; Laurenson, Y.C.; Brockmann, G.A. Go with the flow-biology and genetics of the lactation cycle. Front. Genet. 2015, 6, 118. [Google Scholar] [CrossRef] [PubMed]
  45. Bionaz, M.; Loor, J.J. Gene networks driving bovine milk fat synthesis during the lactation cycle. BMC Genom. 2008, 9, 366. [Google Scholar] [CrossRef] [PubMed]
  46. Tartaglia, L.A. The leptin receptor. J. Biol. Chem. 1997, 272, 6093–6096. [Google Scholar] [CrossRef] [PubMed]
  47. Hu, X.; Juneja, S.C.; Maihle, N.J.; Cleary, M.P. Leptin--a growth factor in normal and malignant breast cells and for normal mammary gland development. J. Natl. Cancer Inst. 2002, 94, 1704–1711. [Google Scholar] [CrossRef] [PubMed]
  48. Baratta, M.; Grolli, S.; Tamanini, C. Effect of leptin in proliferating and differentiated HC11 mouse mammary cells. Regul. Pept. 2003, 113, 101–107. [Google Scholar] [CrossRef] [PubMed]
  49. Li, M.; Li, Q. Expression and function of Leptin and its receptor in mammary gland of goat. Sci. Agric. Sin. 2008, 41, 4187–4193. (In Chinese) [Google Scholar] [CrossRef] [PubMed]
  50. Nan, W. Study on the Regulation Effect of Leptin on Milk Fat Synthesis in Dairy Cows; Northeast Agricultural University: Harbin, China, 2021. [Google Scholar]
  51. Duquenne, M.; Folgueira, C.; Bourouh, C.; Millet, M.; Silva, A.; Clasadonte, J.; Imbernon, M.; Fernandois, D.; Martinez-Corral, I.; Kusumakshi, S.; et al. Leptin brain entry via a tanycytic LepR-EGFR shuttle controls lipid metabolism and pancreas function. Nat. Metab. 2021, 3, 1071–1090. [Google Scholar] [CrossRef]
  52. Kim, J.E.; Choi, Y.J.; Lee, S.J.; Gong, J.E.; Lim, Y.; Hong, J.T.; Hwang, D.Y. Molecular Characterization of Constipation Disease as Novel Phenotypes in CRISPR-Cas9-Generated Leptin Knockout Mice with Obesity. Int. J. Mol. Sci. 2020, 21, 9464. [Google Scholar] [CrossRef]
  53. Liu, L.; Fang, C.; Sun, Y.; Liu, W. Evaluation of key miRNAs during early pregnancy in Kazakh horse using RNA sequencing. PeerJ 2021, 9, e10796. [Google Scholar] [CrossRef] [PubMed]
  54. Liu, L.; Zhang, Y.; Ma, H.; Cao, H.; Liu, W. Integrating genome-wide methylation and transcriptome-wide analyses to reveal the genetic mechanism of milk traits in Kazakh horses. Gene 2023, 856, 147143. [Google Scholar] [CrossRef] [PubMed]
Figure 1. Immunohistochemical staining of mammary gland tissues from lactating and non-lactating mares. (A) Lactating status; 20 µm. (B) Lactating status; 50 µm. (C) Non-lactating status; 20 µm. (D) Non-lactating status; 50 µm.
Animals 14 02319 g001
Figure 2. A quality assessment and basic statistics of the sequencing data. (A) A principal component analysis of the mammary gland tissue samples. (B) Boxplots of the relative log expression of genes in the mammary gland tissue samples. (C) Differential genes in the lactating and non-lactating groups during pregnancy. 2N1, 2N2, 2N3: non-lactation group; 2S1, 2S2, 2S3: lactation group.
Animals 14 02319 g002
Figure 3. An enrichment analysis of highly expressed genes in the lactating group. (A) A GO enrichment analysis of the up-regulated genes in the lactating group. (B) A KEGG pathway enrichment analysis of the up-regulated genes in the lactating group.
Animals 14 02319 g003
Figure 4. An enrichment analysis of the highly expressed genes in the non-lactating group. (A) A GO analysis of the upregulated genes in the non-lactating group. (B) A KEGG pathway enrichment analysis of the upregulated genes in the non-lactating group.
Animals 14 02319 g004
Figure 5. (A) Immunohistochemistry of CSN3, CSN1S1, LALBA, and LTFCSN3 proteins in mammary tissue of lactating pregnant mares. (B) Quantitative statistics for (A). (C) qPCR was used to detect expressions of CSN3, CSN1S1, LALBA, and LTF genes in equine mammary tissues. * indicates p < 0.05. Data are presented as mean ± SD (n = 3).
Animals 14 02319 g005
Figure 6. (A) Immunohistochemistry of CSN3, CSN1S1, LALBA, and LTFCSN3 proteins in mammary tissue of nonlactating pregnant mares. (B) Quantitative statistics for (A). (C) qPCR was used to detect expression of LEP, LEFR, FAT1, and DGAT1 genes in equine mammary tissues. * indicates p < 0.05. Data are presented as mean ± SD (n = 3).
Animals 14 02319 g006
Disclaimer/Publisher’s Note: The statements, opinions and data contained in all publications are solely those of the individual author(s) and contributor(s) and not of MDPI and/or the editor(s). MDPI and/or the editor(s) disclaim responsibility for any injury to people or property resulting from any ideas, methods, instructions or products referred to in the content.

