Article

Comparative Proteomic Identification of Ram Sperm before and after In Vitro Capacitation

1
College of Animal Science and Technology, Anhui Agricultural University, Hefei 230036, China
2
Yunnan Animal Science and Veterinary Institute, Kunming 650224, China
3
Center of Agriculture Technology Cooperation and Promotion of Dingyuan County, Chuzhou 233200, China
*
Authors to whom correspondence should be addressed.
These authors contributed equally to this work.
Animals 2024, 14(16), 2363; https://doi.org/10.3390/ani14162363
Submission received: 14 July 2024 / Revised: 10 August 2024 / Accepted: 12 August 2024 / Published: 15 August 2024
(This article belongs to the Section Animal Reproduction)

Abstract

:

Simple Summary

Capacitation confers competency to spermatozoa to fertilize the oocyte, yet its regulatory mechanisms are not fully understood. Thus, we aimed to investigate the comparative proteomic profiling in ram spermatozoa under non-capacitating (NC) and capacitating (CAP) conditions in vitro using a liquid chromatography–tandem mass spectrometry (LCMS/MS) combined with tandem mass tag (TMT) labeling strategy. Functional enrichment analysis indicated that the differentially abundant proteins Prune Exopolyphosphatase 1, Galactose-1-Phosphate Uridylyltransferase, and ATP Citrate Lyase were strictly related to energy production and conversion, and Phosphoglycolate phosphatase, Glucosamine-6-Phosphate Deaminase 1 and 2 were related to metabolism, RNA processing, and vesicular transport pathways. Furthermore, the networks of protein–protein interaction indicated a strong interaction among these differential proteins in annotated pathways such as ubiquitin and transport metabolism. Together, our results provided the database for studying the differentially expressed proteins during ram sperm capacitation.

Abstract

Ram sperm undergo a sequence of physiological and biochemical changes collectively termed as capacitation to perform oocyte fertilization. However, the protein changes induced by capacitation remain in need of further exploration. Thus, the present study investigated the comparative proteomic profiling in ram spermatozoa under non-capacitating (NC) and capacitating (CAP) conditions in vitro using a liquid chromatography–tandem mass spectrometry combined with tandem mass tag labeling strategy. As a results, 2050 proteins were identified and quantified; 348 of them were differentially abundant, with 280 of the proteins upregulated and 68 of the proteins downregulated between the CAP and NC spermatozoa, respectively. Functional enrichment analysis indicated that the differentially abundant proteins Prune Exopolyphosphatase 1, Galactose-1-Phosphate Uridylyltransferase, and ATP Citrate Lyase were strictly related to energy production and conversion, and Phosphoglycolate phosphatase, Glucosamine-6-Phosphate Deaminase 1 and 2 were related to metabolism, RNA processing, and vesicular transport pathways. Furthermore, the networks of protein–protein interaction indicated a strong interaction among these differential proteins in annotated pathways such as ubiquitin and transport metabolism. Our findings indicate that capacitation progress might be regulated through different pathways, providing insights into mechanisms involved in ram sperm capacitation and fertility.

1. Introduction

Mammalian spermatozoa cannot fertilize oocytes immediately after ejaculation; they need to acquire fertilizing capacity in the female genital tract through a time-dependent process called capacitation [1,2]. However, as a highly specialized cell, sperm is thought to be largely quiescent in terms of transcriptional and translational activity [3,4]. In recent years, some scholars have suggested that translation of new proteins from mRNA transcripts can take place during sperm capacitation [5]. Sperm capacitation is mainly dependent on post-translational modifications, such as phosphorylation of pre-existing sperm proteins, and phosphorylation of tyrosine residues is a consistent indicator of sperm capacitation [6]. Many studies have shown that inhibiting tyrosine phosphorylation can block sperm capacitation, acrosome reactions, and in vitro fertilization [7,8]. Studies have identified phosphorylated and other proteins that play key roles in sperm capacitation in humans, mice, wild boars, buffalo, and other species [8,9,10,11,12,13]. However, the proteomic characteristics of sheep sperm before and after capacitation have not been studied until now.
Proteomic studies have provided novel information for sperm capacitation. There are a cascade of proteins involved in energy production, signaling, cell–cell adhesion, motility performance, changes in ROS and pHi, cytoskeleton reorganization, and ionic transport during sperm capacitation [14,15], in humans [16,17,18], mice [12,19], boars [20] and other mammals; examples are NADPH oxidase 5 (NOX5) as an active generator of ROS that expresses in human and ram sperm [21], and Proacrosin as a carbohydrate-binding protein that is associated with several low-molecular-weight proteins that may be related to active forms of acrosin in human, bull, boar and ram spermatozoa. More specifically, elevated ROS levels increase the levels of tyrosine-nitrated and S-glutathionylated proteins in human sperm capacitation and AR [22,23,24,25]. In ram spermatozoa, dihydrolipoamide acetyltransferase, a component of pyruvate dehydrogenase complex (DLAT), is upregulated after capacitation; this is associated with energy production, and also affects ROS levels during capacitation [26]. In addition, studies have demonstrated that Ras-related C3 botulinum toxin substrate 1 protein (Rac1), as a member of Rho protein family, has been found to participate in the actin cytoskeleton remodeling of the acrosome apical region during sperm capacitation [27,28]. Ionic channel proteins such as Anoctamin 1 (TMEM16A), and Transient Receptor Potential Vanilloid family member sub type 1 and 4 (TRPV1 and TRPV4) activate ion currents and affect hyperactivated motility during capacitation [29,30,31]. Furthermore, the following are also involved: tyrosine phosphorylation-related proteins, such as A-kinase anchoring proteins (AKAPs) and Sperm plasma membrane-associated protein (SMAP) in humans [32,33], Phosphorylated protein of 32 KD (p32) in boar [34], Ca2+-binding tyrosine-phosphorylation-regulated protein (CABYR) and Serpin peptidase inhibitor clade E, member 2 (SERPINE2) in mice [35,36]. All this knowledges about sperm capacitation has been obtained based on proteomic techniques.
Because the quality of semen has a great impact on the fertility of sheep, the obstacle of the sperm fertilization process is an important factor for the low sperm fertilization rate, and sperm capacitation is a prerequisite for successful sperm fertilization. In the current study, we employed a quantitative proteomic technique to investigate changes in protein components during ram spermatozoa capacitation in vitro. This may help to identify the differential proteins during capacitation that are essential for maintaining sperm function, aiming to replenish knowledge of the molecular mechanism leading to post-ejaculation ram sperm maturation from a proteomic perspective.

2. Materials and Methods

2.1. Experimental Design and Workflow

This experimental research involving animals was carried out following welfare guidelines, and ethical approval was provided by the Animal Care Committee, Anhui Agricultural University (No. AHAU2020023, 4 January 2020). The TMT-based quantitative proteomic technique was used to identify and characterize the protein differences in spermatozoa before and after in vitro capacitation. The experimental design and workflow are shown in Figure S1. Each three out of the nine samples were mixed randomly in equal volumes to form a biosample, with a total of three mixed biosamples in each group (non-capacitating group and capacitating group). The protein extraction, TMT labeling, and mass spectrometry were performed for protein identification and were followed by bioinformatics analysis.

2.2. Animal and Sample Collection

Healthy adult rams (n = 9) with no significant differences in age (2 years of age), weight, height, and body length were selected. They were housed at a breed protection farm of the Jianghuai Watershed Comprehensive Experimental Station (Dingyuan, China). Fresh ejaculates were collected via an artificial vagina from nine rams in the presence of a teaser ewe. After collection, sperm motility and density were immediately evaluated using the Computer-Assisted Sperm Analysis System (CASA, sperm classanalyzer-5.4.0.0; MICROPTIC Supply, Barcelona, Spain). Only those ejaculates with a motility greater than 80% and a density greater than 3 × 10⁹/mL were used in the subsequent experiment [37]. To ensure the amount of qualified ejaculates, the ram could be collected again two days later. Three out of the nine samples were mixed randomly in equal volumes to form a biosample, and a total of three mixed biosamples were used in our experimental replication (n = 3). The above three biosamples were immediately prediluted with the sperm TALP culture medium (IVL03-100ML, Caisson, Smithfield, VA, USA) and centrifuged at 700× g for 10 min to isolated sperm (deposit) and seminal plasma (liquid supernatant) [38]. Then, sperm were wash twice with PBS by centrifugation (400× g, 5 min) and divided into two parts: one part was used as the non-capacitating (NC) sample resource, the other part was used for capacitation.

2.3. Sperm Capacitation

For sperm capacitation, each deposit was washed with 1 mL sperm–TALP culture medium and centrifuged at 400× g for 5 min. Afterwards, each deposit was rediluted in the sperm–TALP culture medium to 1 × 10⁷ sperm/mL. Every 100 µL was carefully transferred into the bottom of round-bottom tube, which contained 1 mL of pre-heated sperm–TALP culture medium, 50 µg sodium heparin and 2% (v/v) estrous ovine serum, collectively referred to as capacitation solution. The round-bottom tube was placed gently at an angle of 45°, followed by sperm capacitation using the upstream method at 38.5 °C and 5% (v/v) CO2 for 240 min to obtain the capacitating (CAP) sample resource [26,39]. To stimulate AR, 10 µL of the calcium ionophore A23187 (1.0 mM in DMSO, diluted to 100 µM in Sp-TALP when used, CSN pharm, Chicago, IL, USA) was added to 90 µL of the spermatozoa from the above NC and CAP groups to achieve the final concentration of 10 µM, before incubation at 38.5 °C for 30 min [40]. After incubation, all samples from two groups were centrifuged (500× g, 5 min) to obtain the deposit (sperm), the sperm were wash thrice with PBS by centrifugation (400× g, 5 min), and aliquots of 1 × 10⁷ AR sperm were collected. A small part of each sample (10 µL) was reserved for detection of sperm capacitation, and the rest was stored immediately at −80 °C until TMT and parallel reaction monitoring (PRM) analyses.
For determining the capacitation status, the CAP group and the CN group were fixed in 100 µL of PBS with 2% (v/v) paraformaldehyde for 10 min at 24 °C, and centrifuged at 200× g for 5 min. The precipitate was washed twice with 1.5 mL ammonium acetate (0.1 moL/L) and the precipitate was resuspended in 200 µL PBS. The suspension liquid (20 µL) was pipetted into each tube for smearing and stained with 0.25% Coomassie Brilliant Blue G-250 for 5 min. Samples were air-dried and observed under a 200-times (10 × 20) phase-contrast optical microscope combined with an OPLENIC imaging system for the determination of sperm capacitation [8,41]. Additionally, to support these capacitive changes in sperm, we performed Western blot analysis of the level of tyrosine phosphorylation protein (Tyr-P), which is a known reliable sign of sperm capacitation. In Western blot, anti-Tyr-P (CST9411, 1:20, Ipswich, MA, USA) was used, and anti-α-tubulin (Proteintech66031-1-Ig, 1:300, Wuhan, China) was used as a control [40].

2.4. Protein Extraction and Digestion

Each sample (approximately 1 × 10⁷ sperm cells) was sonicated three times on ice, using a high-intensity ultrasonic processor (Scientz) in lysis buffer 8 moL/L urea (Sigma, St. Louis, MO, USA), 2 mmoL/L EDTA (Sigma, St. Louis, MO, USA), 10 mmoL/L DDT (Sigma, St. Louis, MO, USA) and 1% protease inhibitor cocktail (SparkJade, Shandong, China), followed by centrifugation at 20,000× g for 10 min at 4 °C [42]. Then, the supernatant was transferred into a clean tube for the protein extraction and digestion, according to a previous report [43]. The protein concentration was determined by a BCA Kit (Beyotime, Shanghai, China), detected by 10% (w/v) SDS-PAGE, and 20 µg protein was loaded onto each electrophoretic lane. Six electrophoretic bands were clear and uniform, with good parallelism in each gel swim-lane (Figure S2), which indicated that proteins were good for subsequent experiments. Based on the BCA results, each protein sample (30 mg) was subjected to enzymolysis.

2.5. TMT Labeling

After trypsin digestion, the peptides were desalted using a Strata X C18 SPE column (Phenomenex, Torrance, CA, USA) and dried by vacuum centrifugation. The desalted peptides (100 µg) from each sample were dissolved in 0.5 moL/L TEAB solution and labeled using the TMT Labeling Kit (ThermoFisher Scientific, Waltham, MA, USA) according to the manufacturer’s protocol. In brief, the above peptide dissolved solution was incubated with the TMT regent (1 unit of labeling reagent was used for 100 µg of peptide), which was reconstituted in 24 μL ACN, for 2 h at room temperature. Then, three pooled fractions of the capacitating sperm group were labeled with 126 (CAP1), 127 (CAP2), and 128 (CAP3) tags, while the non-capacitating sperm group was labeled with 129 (NC1), 130 (NC2), and 131 (NC3) tags, respectively. The reaction was stopped with 8% ammonium hydroxide. Differently labeled peptides were mixed equally, desalted and vacuum dried [42,43,44].

2.6. High-pH Liquid Chromatographic (HPLC) Separation of Peptides

Peptides were fractionated by high-pH reverse-phase HPLC, using Betasil C18 column (5 μm particles, 10 mm ID, 250 mm length, Thermo, Waltham, MA, USA). Briefly, peptides were first separated with a gradient of 8% to 32% acetonitrile (pH 9.0) over 60 min, into 60 fractions. Following this, the peptides were combined into 14 fractions and dried by vacuum centrifuging.

2.7. LC-MS/MS Analysis

The peptides were dissolved in 0.1% (v/v) formic acid (solvent A) and directly loaded onto a reversed-phase C18 analytical column (Thermo Scientific, 15 cm length, 75 μm i.d.). The gradient comprised an increase in solvent B from 8% to 23% (0.1% formic acid in 90% acetonitrile) over 26 min, 23% to 35% for 8 min, climbing to 80% for 40 min, and sustained at 80% for the last 3 min, all at a constant flow rate (500 nL/min) on an EASY-nLC 1000 UPLC system.
The separated peptides were injected into nano electrospray ionization (NSI) sources for ionization, with the voltage set to 2.0 kV, then tandem mass spectrometry (MS/MS) was performed with Q ExactiveTM Plus (Thermo Scientific, USA), which was coupled online to the UPLC. Intact peptides were detected in the Orbitrap. A full-scan range of MS was set to 400–1500 m/z at a resolution of 70,000. The scan range of MS/MS started at 100 m/z, and the resolution was 17,500. A data-dependent acquisition (DDA) mode was used to collect data. Namely, the top 20 peptide parent ions with the highest signal intensity were selected, and fragmented using 30% of the fragmentation energy in the HCD collision pool. Then, MS/MS was performed in the same order. The setting parameters were the following: the automatic gain control (AGC) was 5 × 10⁴, the signal threshold was 63,000 ions/s, the maximum injection time was 80 ms, and the dynamic exclusion time for MS and MS/MS scanning was 30 s.

2.8. Data Analysis

We used the Maxquant software (v1.5.2.8) to retrieve MS/MS data. The search parameters were specified as follows: the database was Ovis_aries_Uniprot_9940 (23109 sequences), and a reverse decoy database and a common pollution database were added to calculate the false discovery rate (FDR) caused by random matching and eliminate the effects of contaminated proteins, respectively. Trypsin/P was specified as a cleavage enzyme. Two missed enzymatic cleavage sites were allowed, seven amino acid residues as the minimum peptide, and the maximum modification of the peptide was set to five. Mass tolerance for precursor ions was set as 20 ppm and 5 ppm in the first and main search, respectively. The mass error tolerance for fragment ions was 0.02 Da. Cysteine alkylation was set as a fixed modification, and oxidation of methionine, acetylation and deamination of the N-terminal protein were set as variable modifications. TMT-6 plex was used as a quantitative method, FDR was set as 1%, and unique peptides ≥ 1 per protein for all protein identification.

2.9. Bioinformatic Analysis

The UniProt-GOA database (http://www.ebi.ac.uk/GOA/ (accessed on 10 August 2022)) combined with the InterProScan tool (https://www.ebi.ac.uk/interpro/ (accessed on 10 August 2022)) were applied to annotate the Gene Ontology (GO) functional information of proteins, which included three categories: biological process, cellular component and molecular function. Simultaneously, the InterProScan was also used to annotate the proteins’ functional domain based on the protein sequence-alignment method. For Kyoto Encyclopedia of Genes and Genomes (KEGG) pathway enrichment, the KASS service (https://www.genome.jp/tools/kaas/ (accessed on 10 August 2022)), combined with the DAVID tool (https://david.ncifcrf.gov/ (accessed on 10 August 2022)), was performed to annotate the protein information [45]. WoLF PSORT service (https://www.genscript.com/wolf-psort.html (accessed on 14 August 2022)) was used for protein subcellular localization prediction, and STRING (http://www.string-db.org/ (accessed on 14 August 2022)) was conducted to form the protein–protein interaction (PPI) network of the differentially abundant proteins (DAPs). Additionally, hierarchical clustering was performed by the R language. The DAPs were filtered for all categories which were enriched in at least one of the clusters with p < 0.05. The filtered p value matrix was transformed by the function x = −log10, x values were z-transformed, and z scores were then clustered by one-way hierarchical clustering. The “heatmap.2” from “gplots” R-package was used to visualize cluster membership. Blast tool (http://blast.ncbi.nlm.nih.gov/Blast.cgi (accessed on 18 August 2022)) was performed to give the protein–protein interaction of DAPs at a confidence score > 0.7. The visual diagram was shown by R package “networkD3” (https://cran.r-project.org/web/packages/networkD3/ (accessed on 18 August 2022)).

2.10. Parallel Reaction Monitoring (PRM) for Verification

To verify protein expression levels obtained by TMT LC-MS/MS analysis, the expression levels of differentially abundant proteins (unique peptide ≥ 2, FC ≥ 1.5, p < 0.05) in two groups were selected randomly and quantified by a PRM assay. Peptides were prepared according to the TMT. Peptide mixtures (1 μg) were introduced into the mass spectrometer via an in-house packed C18 column (Thermo Scientific, 15 cm length, 75 μm i.d.). Chromatographic separation was performed using the EASY-nLC 1000 UPLC system (500 nL/min, Thermo, Waltham, MA, USA). We used one-hour liquid chromatography gradients with acetonitrile ranging from 8 to 35% over 50 min. PRM analysis was performed using a Q-ExactiveTM mass spectrometer (Thermo Fisher Scientific, Bremen, Germany). The mass spectrometer was operated in the positive ion mode with the following parameters: full scan was performed with an m/z scan range of 350–1000 and the electrospray voltage was 2.0 kV. Intact peptides were detected in the Orbitrap at a resolution of 35,000. Peptides were then selected for MS/MS using the NCE setting of 25, and the fragments were detected in the Orbitrap at a resolution of 17,500. A data-independent procedure that alternated between one MS scan was followed by 20 PRM scans at a resolution of 17,500. Automatic gain control (AGC) was set at 3 × 10⁶ with a maximum injection time of 120 ms. The targeted peptides were isolated within a 1.6 window. Ion activation/dissociation was performed at a normalized collision energy of 25 in higher-energy dissociation (HCD) collision cells. The raw data obtained were analyzed using the Thermo Scientific Proteome Discoverer 1.3 software (Thermo Fisher Scientific, Bremen, Germany). The false discovery rate was set to 0.01 for proteins or peptides, and Skyline software 2.6 (MacCoss Lab, University of Washington) was used for quantitative data processing and proteomic analysis. Peptide settings: enzyme was set as Trypsin [KR/P], and max missed cleavage set as 0. The peptide length was set as 7–25, variable modification was set as Carbamidomethyl on Cys and oxidation on Met, and max variable modifications was set as 3. Transition settings: precursor charges were set as 2, 3, ion charges were set as 1, ion types were set as b, y. The product ions were set from ion 3 to the last ion, and the ion match tolerance was set as 0.02 Da.

2.11. Statistical Analysis

IBM SPSS statistics 26 was employed to analyze the data for kinematic parameters of spermatozoa between NC and CAP groups from rams, and a two-tailed Fisher’s exact test with Bonferroni correction (p < 0.05) was employed to test the enrichment of DAPs against all identified proteins. Functional enrichment with a corrected p < 0.05 was considered significant.

3. Results

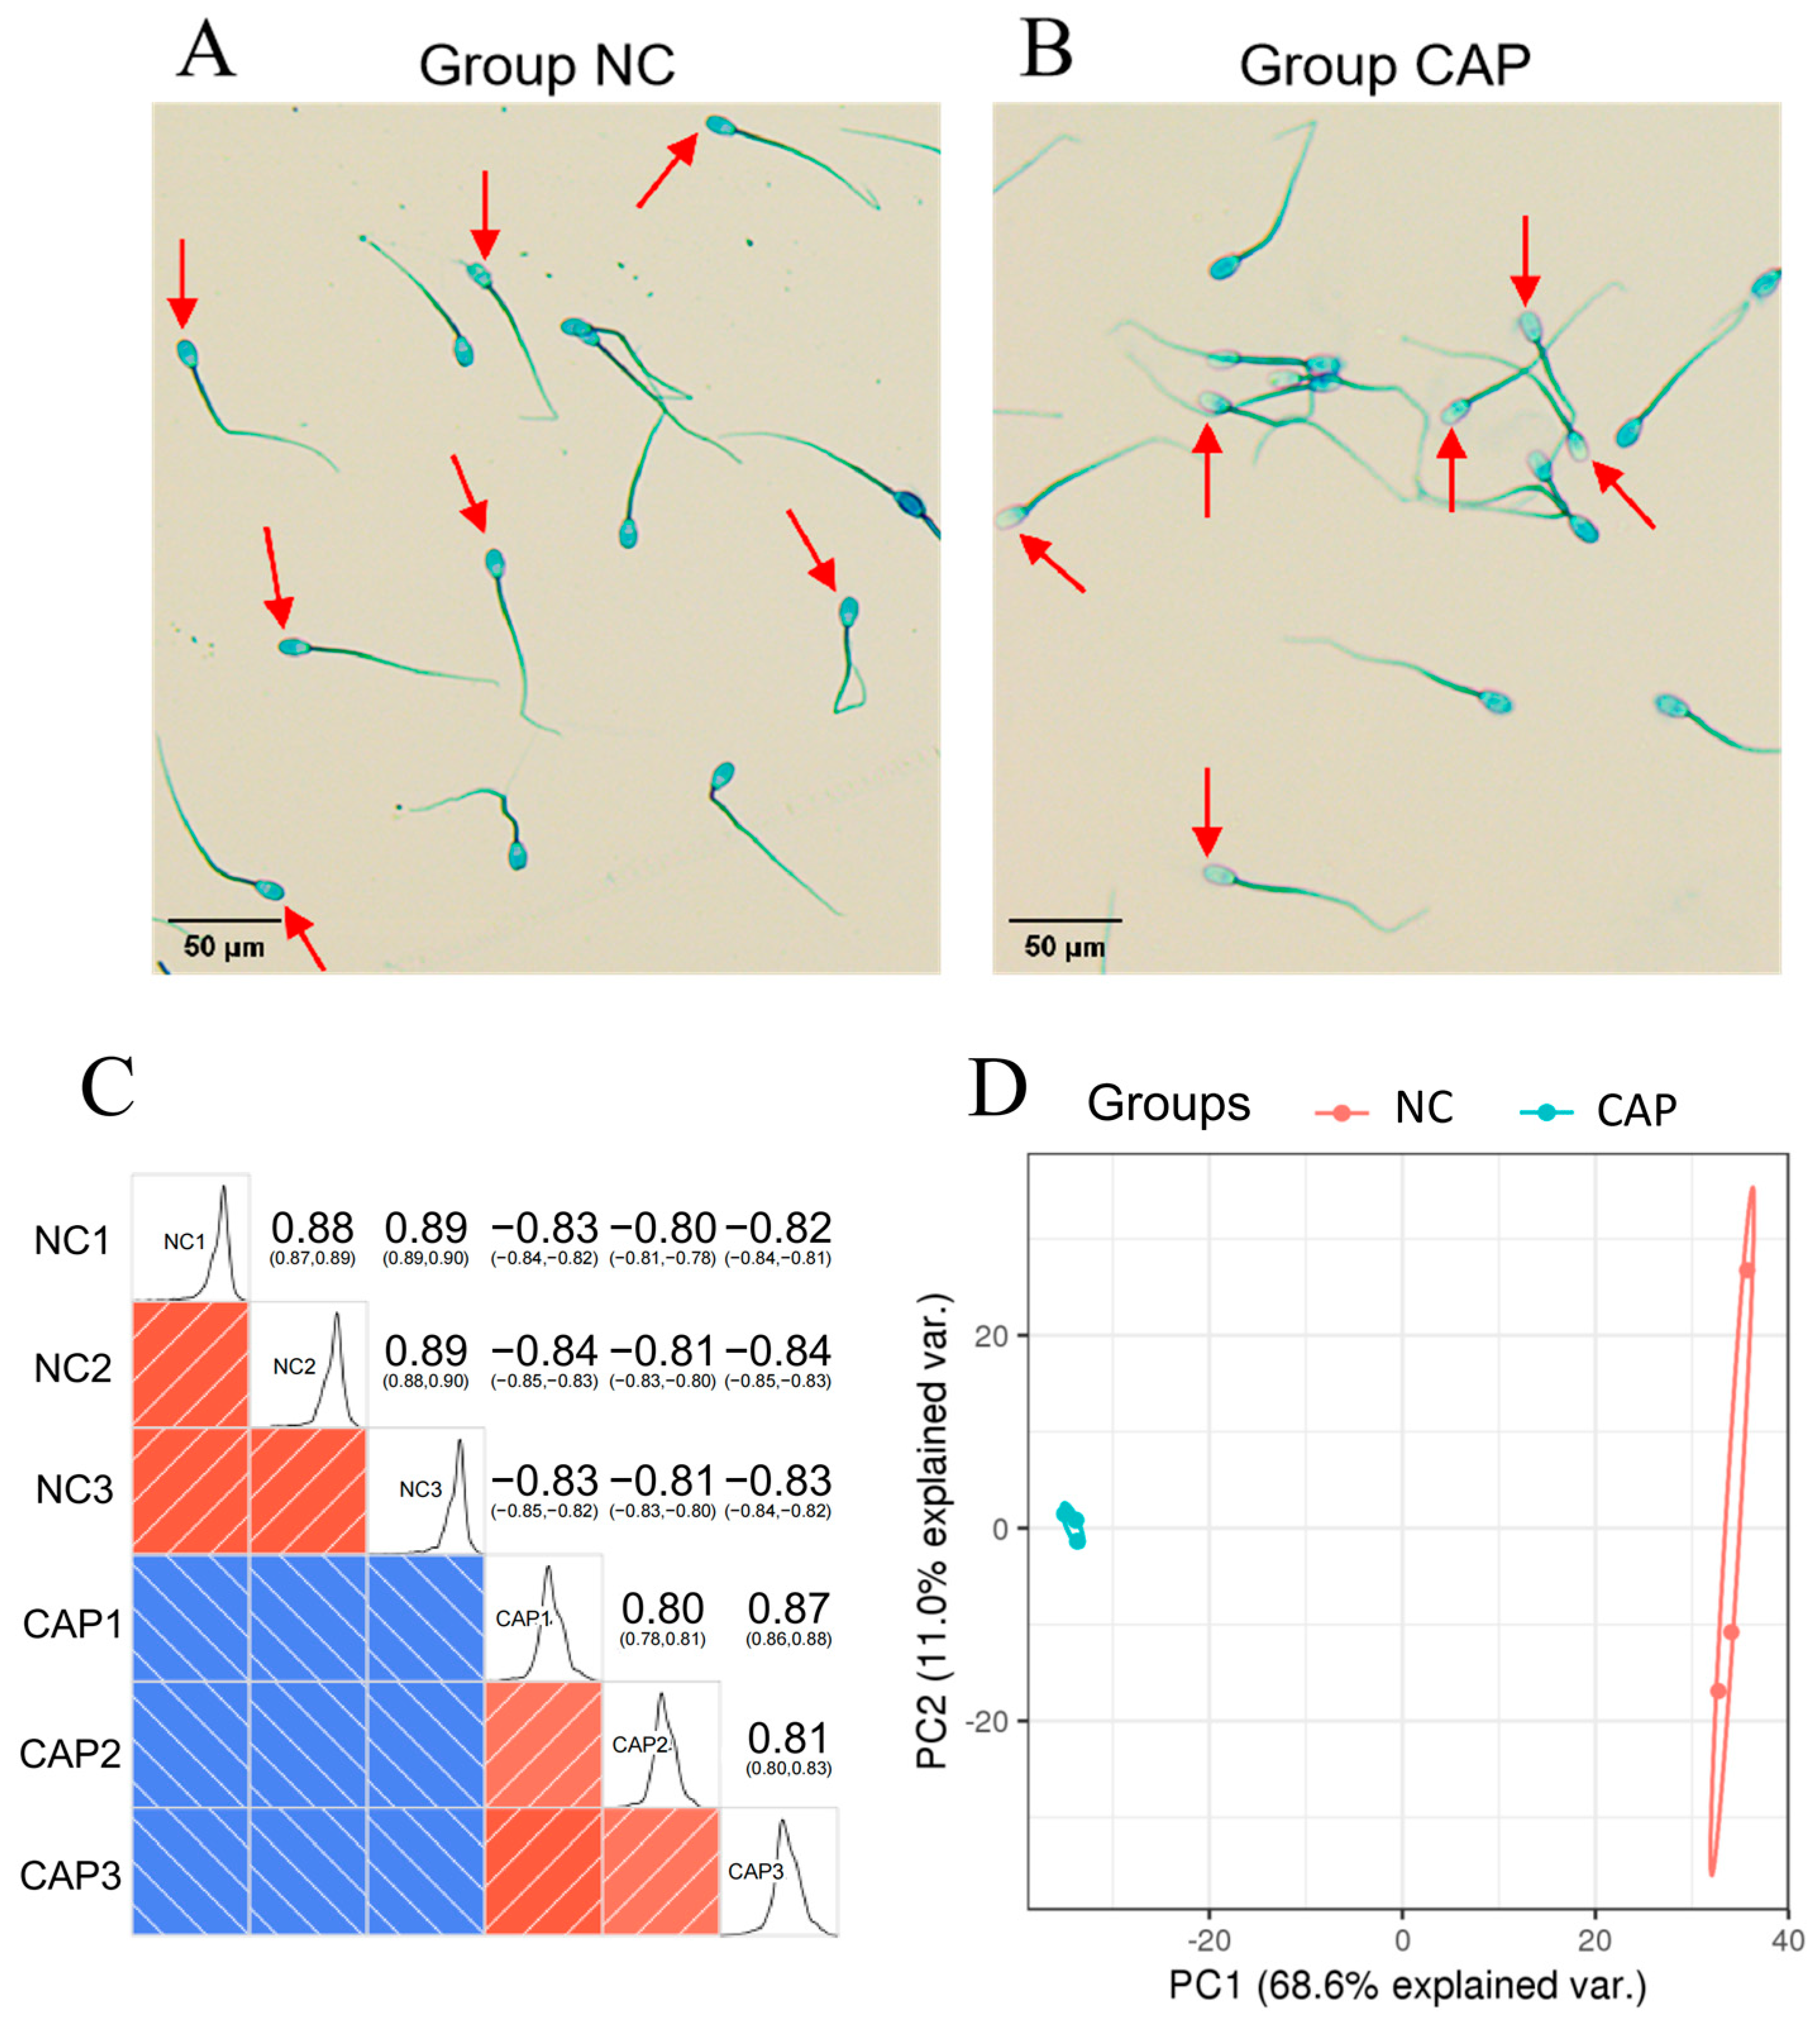
3.1. Evaluation of Capacitation, Tyrosine Phosphorylation Level, and Kinetic Parameters of Sperm before and after Capacitation

Spermatozoa from non-capacitation and capacitation were isolated and pooled for protein extraction, TMT labeling and mass spectrometry analysis. For capacitation, spermatozoa were stained with G-250 staining, using electron microscopes to observe the result of the sperm of G-250 staining, and sperm tails were dyed green to pale blue. The acrosomal region of sperm without capacitation was blue (Figure 1A) and the acrosomal region of sperm after capacitation was either unstained or pale blue (Figure 1B). The sperm acrosome membrane ruptured after AR, and the acrosomal region was dyed in pale blue, due to glycoprotein released. In addition, we counted the number of sperm that has undergone AR (an important indicator of sperm capacitation) per 500 spermatozoa. Three smears were performed per sample. The average AR rate was greater than 60% and sperm capacitation was determined (Figure S3). Also, the expression level of Tyr-P was significantly upregulated (p < 0.05) after sperm capacitation (Figure S4, Table S1). These were evidence of capacitive changes in sperm. Motility kinematic parameters of sperm before and after capacitation were also assessed using the CASAS. Sperm motility (MOT), curvilinear velocity (VCL), straight-linear velocity (VSL) and average path velocity (VAP) were significantly increased (p < 0.05) after capacitation, compared to before capacitation. However, the average lateral amplitude of the sperm head (ALH) significantly decreased (p < 0.05) after capacitation (Table 1, Supplementary File). After capacitation, sperm-tail oscillation amplitude increased, gradually becoming hyperactivated. The acrosome contents of spermatozoa became swollen and the plasma membrane ruptured. Variation in the above parameters also illustrated this point.
The mass spectrometry proteomics information was supplied, regarding data availability: data have been submitted to the ProteomeXchange Consortium (http://proteomecentral.proteomexchange.org/cgi/GetDataset (accessed on 20 August 2022)) via the iProX partner repository, with the dataset identifier PXD023101. A total of 18,894 peptide fragments were identified from 42,404 matched spectrums, with 2378 corresponding proteins in two groups, of which 2050 proteins were quantified (Figure S5 and Table S2). Pearson correlation coefficients of biological replicates showed high correlation for the two group samples (Figure 1C), suggesting the high reproducibility of sample preparation and quality of sequencing data. Principal component (PC) analysis of all detected proteins showed that proteins from two groups were separated into two distinct clusters (Figure 1D), which indicates that non-capacitating and capacitating spermatozoa have significantly different protein abundance.

3.2. Identification of Differentially Abundant Proteins

Fold change of the DAPs between the comparable groups (CAP vs. NC) was determined based on the screening criteria group ratio (fold change > 1.2 or <0.83, p < 0.05). These DAPs were effectively separated using RStudio (version 3.5.1, 2018), as shown in the volcano plot (Figure 2A); a total of 348 DAPs were identified, where 68 and 280 proteins showed highly expressed abundance in NC and CAP groups, respectively (Table S3). Among the DAPs, the characterized protein Albumin (ALB) showed the highest relative upregulation and the protein Hemoglobin subunit beta (HBB) showed the highest relative downregulation between the comparable groups. The top 15 upregulated and downregulated proteins of ram spermatozoa in CAP compared to NC are given in Table 2 and Table 3, respectively. These DAPs were mainly distributed in the cytoplasm (37.9%), in extracellular space (21.6%), the nucleus (15.5%), and mitochondria (8.3%) (Figure 2B). Overall categories of these DAPs will help to understand their functions; 284 of the 348 proteins were classified into groups, including post-translational modification (PTM), protein turnover, chaperones, energy production and conversion, intracellular trafficking, secretion, and vesicular transport. Some proteins were classified as having an unknown function (Figure S6, Table S4).

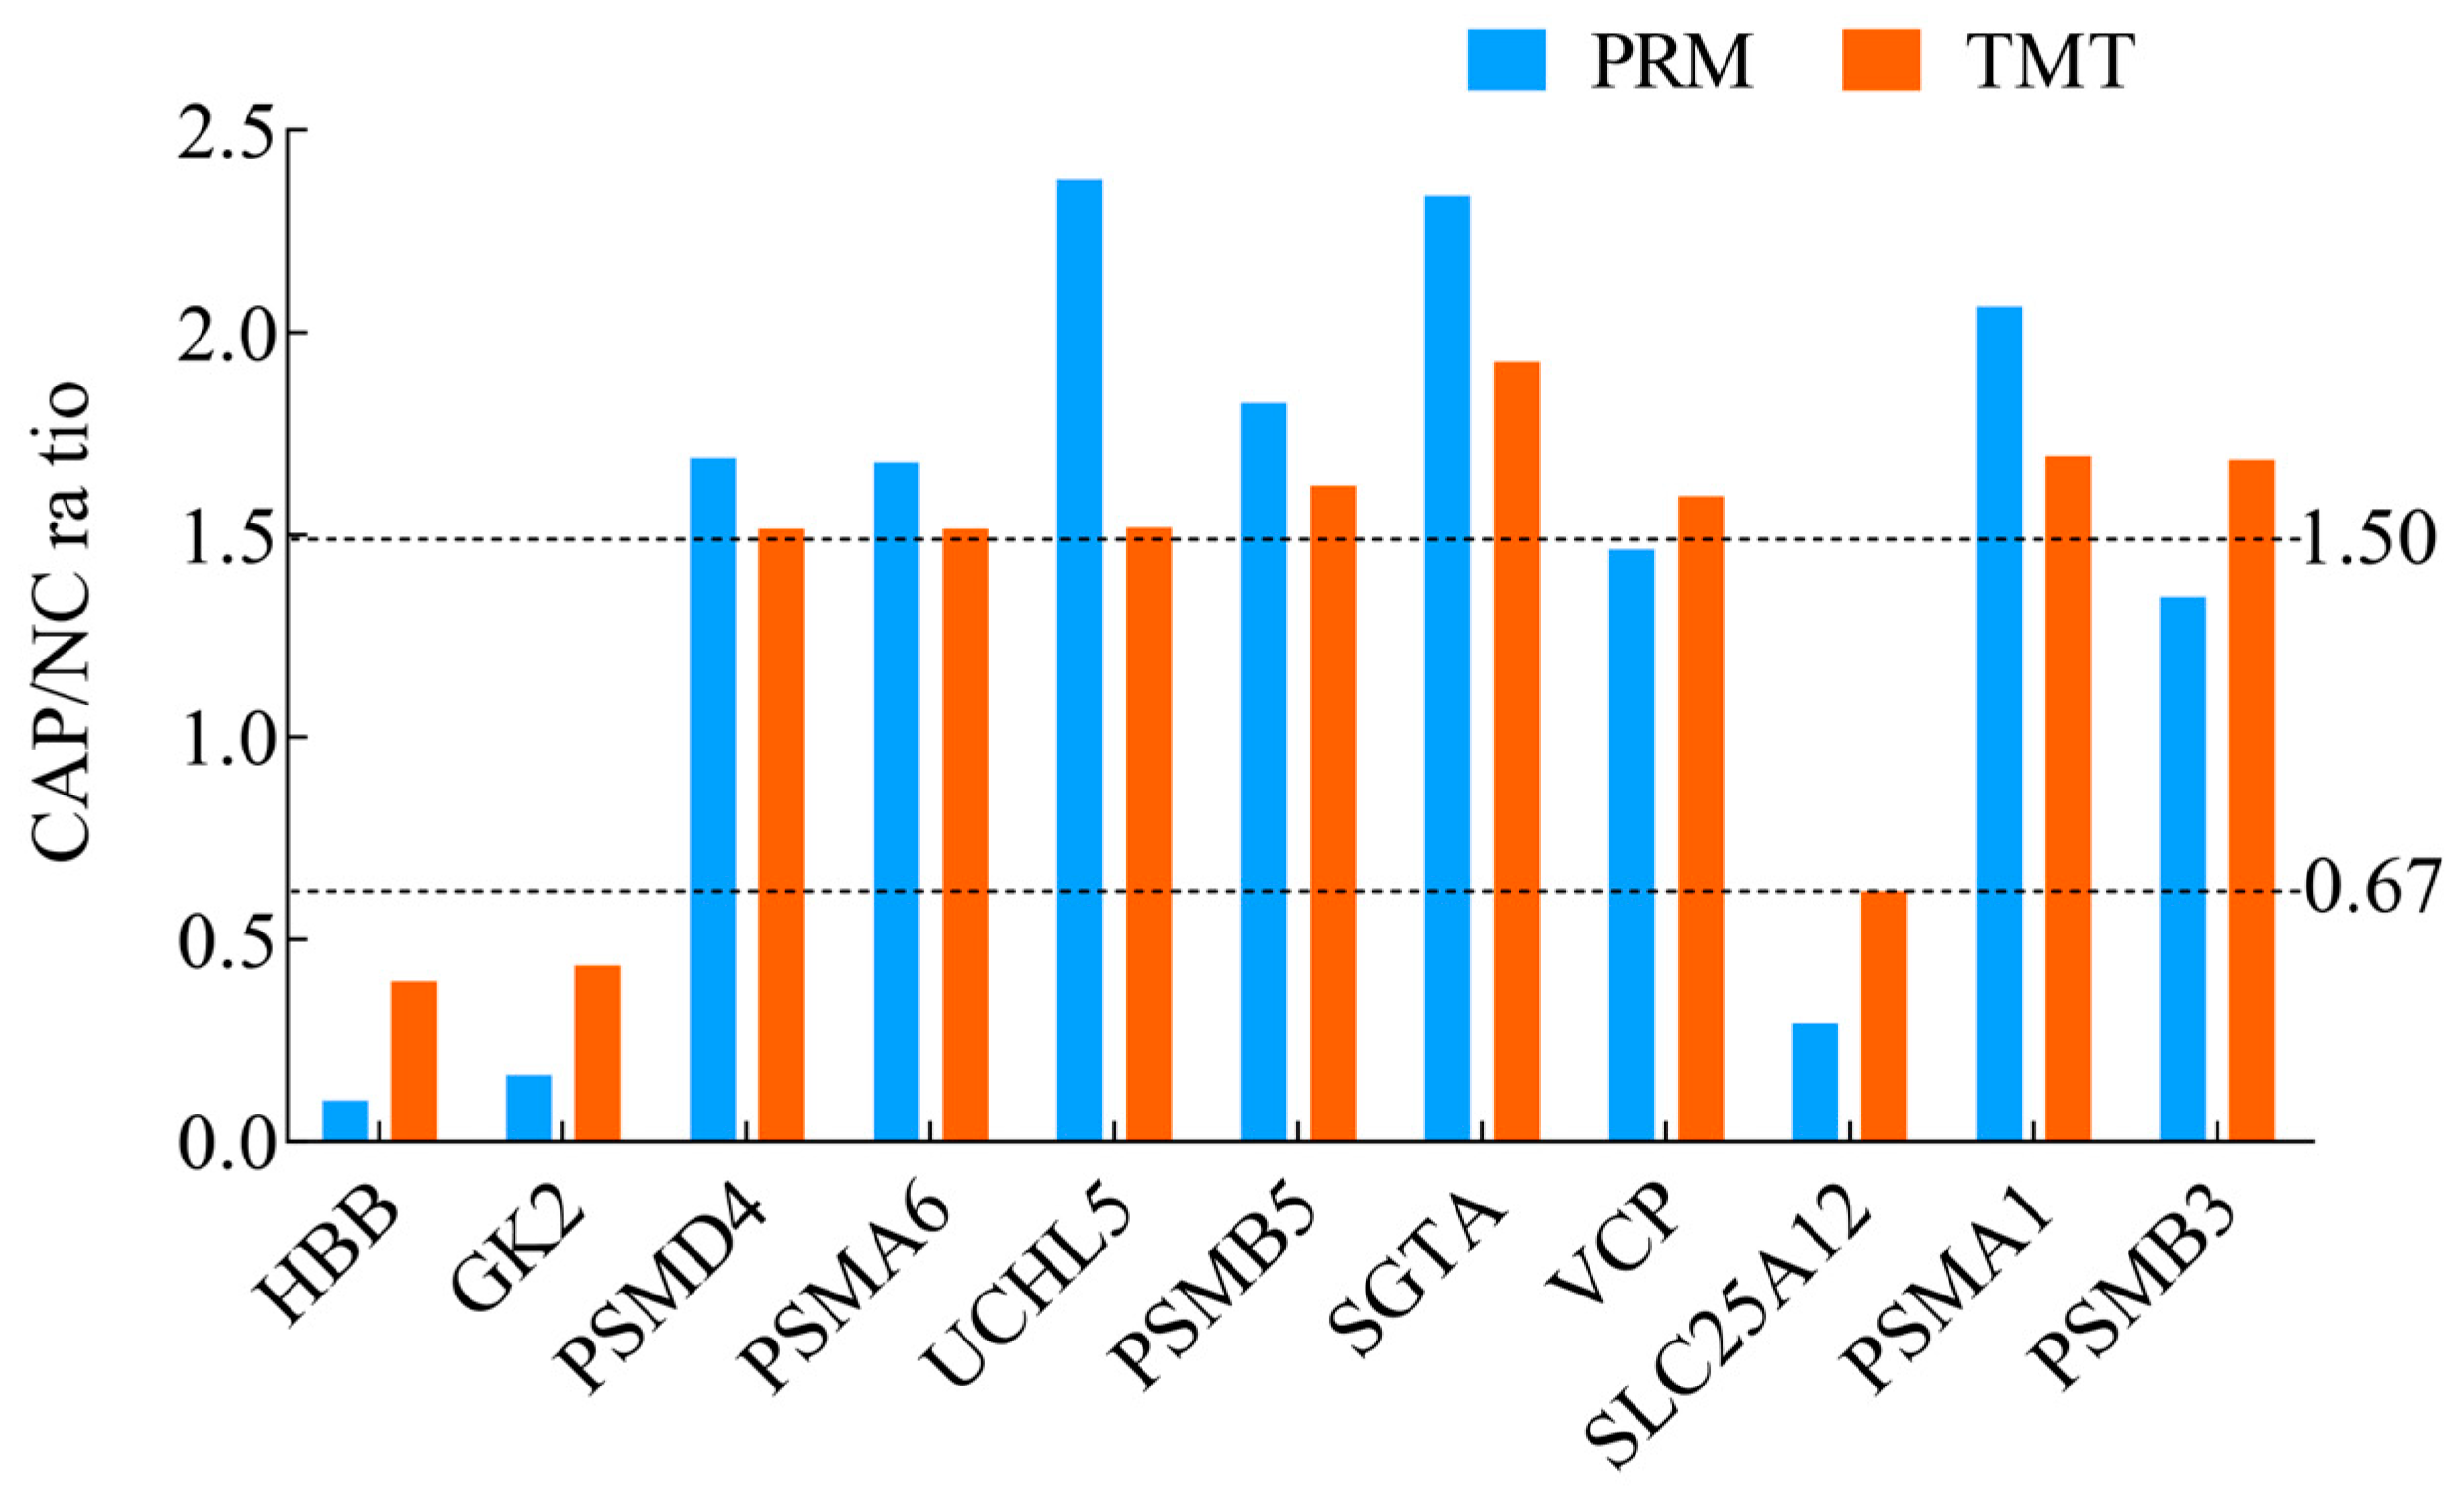
3.3. Validation of Selected DAPs by PRM

For more authentication of TMT LC-MS/MS proteomic data, we performed PRM verification. Raw data of PRM have been submitted to the PRIDE repository (https://www.ebi.ac.uk/pride/ (accessed on 20 August 2022)) and acquired the dataset identifier PXD034330. Here, the peptide information used for PRM quantification is shown in Table S5, and 11 target DAPs with a change over 1.5-fold and at least two unique peptides for validation, namely, GK2, PSMD4, PSMA6, UCHL5, PSMB5, HBB, SGTA, VCP, SLC25A12, PSMA1 and PSMB3 (Figure 3, Table S6). Among them, HBB, GK2 and SLC25A12 were downregulated (CAP/NC ratio < 0.67), whereas the expressions of PSMD4, PSMA6, UCHL5, PSMB5, SGTA, and PSMA1 were upregulated (CAP/NC ratio > 1.50). The PRM results showed a similar trend to the TMT results, which indicated that the proteomics data were reliable.

3.4. Functional Enrichment Analysis Based on DAPs

To explore the potential roles of DAPs in the comparable group (CAP/NC), we conducted GO terms and KEGG pathway. A total of348 DAPs were mainly clustered into 25 GO categories within ‘biological process’ (BP), ‘cellular component’ (CC), and ‘molecular function’ (MF), based on their GO annotation. Each DAP was assigned more than one term. DAPs were associated with cellular, metabolic, and single-organism processes, biological regulation, response to stimulus, and localization in 13 BP terms; their main enrichment categories included cell, organelle, extracellular region, and membrane in seven CC terms; and these DAPs were mainly involved in binding and catalytic activity in five MF terms (Figure 4A, Table S7). KEGG was utilized for functional pathway annotation of all DAPs, and only part of the proteins were mapped to the pathways such as four disease-related signaling pathways (Figure 4B, Table S8). Based on the molecular function in GO enrichment analysis, partial differential proteins were strictly related to ATP production during sperm capacitation, such as ATP6V1H and ATP6V1F (Table 4).

3.5. Protein Network Analysis

STRING was used to acquire PPI information of DAPs (p < 0.05) and perform the PPI visual network diagram. A total of 81 proteins with the closest interaction relationship with a confidence score > 0.7 (high confidence) were screened out and the protein networks were plotted [46] (Figure 5, Table S9). Compared to ram spermatozoa before capacitation, most of the functional modules were upregulated after capacitation, except for NDUFAB1, NDUFS4, UQCRQ, ATP5IF1, ATP5PD and W5NZM0 (uncharacterized protein in database). Furthermore, significantly positive associations between PSMA2, PSMB7, UBA52, NEDD8, RAD23B, PPIB, NT5E, UGP2, SORD, and W5Q420 (uncharacterized protein in database) abundance and spermatozoa capacitation were observed (Log2Ratio > 1.01). For the PPI degree of connectivity, 13 target proteins with a degree of connectivity over 25 were collected, such as PSMD2, PSMD4, PSMD1, PSMA5, PSMA2, and PSMA1, which had a strong interaction among themselves and were annotated to the ubiquitination functional pathway (All Log2Ratio > 0.59).

4. Discussion

As a highly specialized cell, sperm is thought to be largely quiescent in terms of transcriptional and translational activity. As a result, once it has left the male reproductive tract, the sperm is essentially operating with a static population of proteins, with functions such as post-translational modification (PTM) of proteins as one of its specific functions before fertilizing the oocyte [47,48]. Typically, capacitation begins with the removal of sperm plasma-membrane stabilizing factors that trigger an efflux of cholesterol, calcium and bicarbonate influx, and an increase in intracellular pH. These events result in an elevation in the protein tyrosine phosphorylation and sperm hyperactivation [33,49,50]. Based on our result, the level of the protein tyrosine phosphorylation was increased after capacitation, which provided evidence for these capacitive changes in ram spermatozoa.
However, given the limited understanding of the capacitation process, deciphering the molecular mechanism involved remains the research focus in the field of reproduction. Known proteomic techniques such as MS, iTRAQ and TMT, are credible strategies to help investigate the alteration of sperm components during sperm capacitation, and the molecular mechanisms have been elucidated in humans [10,17], mice [12,19], and boar [51]. Zhang et al. investigated proteomic profiling in buffalo spermatozoa before and after capacitation using the TMT strategy: 1461 proteins were quantified, and 93 DAPs were screened. These DAPs were mainly involved in pathways of oxidative phosphorylation, metabolic and PPAR signaling pathways, and acquired marker proteins such as CYLC1, CYLC2, SLC26A8, and VAMP4 [41]. In addition, Peris-Frau et al. compared the changes in protein profile in fresh vs. cryopreservation Manchega ram sperm during in vitro capacitation by RP-LC-MS/MS; results indicated that the expression abundances of 14 proteins related to mitochondrial activity, sperm motility, apoptosis-stress response, etc., were significantly different [26,52]. These findings provide insights into acquiring marker proteins and the mechanisms that are associated with sperm capacitation at the molecular level. In this study, we monitored the dynamic changes in protein expression levels during ram sperm capacitation in vitro, using the LC-MS/MS. A total of 2050 proteins were quantified, including 348 DAPs that are 280 upregulated and 68 that are downregulated after capacitation, respectively. In the clusters of orthologous group (COG) categories of those DAPs, 284 were classified into groups, including PTM, protein turnover, chaperones, energy production and conversion, inorganic ion transport and metabolism, intracellular trafficking, secretion, vesicular transport, cytoskeleton, etc. This was consistent with the published reports that mammalian sperm capacitation-related proteins are categorized into multiple groups, namely, sperm motility and differentiation-related proteins (including energy-related enzymes, structural proteins, activator signal transducers), sperm–zona pellucida interaction and sperm–oolemma penetration proteins, acrosome biogenesis and acrosome-reaction proteins, nuclear proteins, peripheral proteins, and PTM proteins [53]. Interestingly, proteins like PGP (phosphoglycolate phosphatase), which was upregulated during ram spermatozoa capacitation in vitro, categorized into inorganic ion transport and metabolism. It catalyzes glycerol production from glycerol-3-phosphate, a metabolic intermediate of glucose, lipid and energy metabolism. It also has protein tyrosine phosphatase activity, for protein tyrosine phosphorylation, a cAMP-dependent pathway that operates in capacitated spermatozoa [54]. Partial proteins strictly related to sperm capacitation with a significant difference between the two groups (CAP vs. NC), such as ALB, with the highest upregulated abundance, have been shown to extract cholesterol out of the sperm cell membrane with an HCO3-dependent mode, which can activate protein kinase A (PKA) during capacitation; this results in a reorganization of the phospholipid distribution in the cell membrane bilayer, thereby facilitating cholesterol depletion by ALB (Hereng et al., 2014). HBB was a DAP with the highest downregulated abundance, and could facilitate intracellular transport and storage of oxygen (O2) in sperm. Downregulation of HBB might reduce the transport of O2 to the outside of cells, which facilitates ATP production [55]. This could directly affect the fertilization potential, due to the increase in sperm motility, and could affect the calcium pathway, activating capacitation and the subsequent acrosome reaction [56].
We found that several PSMs (the 26S proteasome), such as PSMA2 and PSMB7, were significantly upregulated in the ram capacitation sperm; PSMD2, PSMD4, PSMD1, PSMA5, and PSMA1 had a PPI degree of connectivity greater than 25. Our results corresponded with a previous study conducted by Choi YJ et al., in which PSMA4, PSMB1 and PSMB10 were upregulated in boar sperm capacitation [57]. Ubiquitination is one of the canonical PTMs of target proteins, using covalent attachment of the small chaperone protein ubiquitin. In general, the ubiquitin proteasome system (UPS) is responsible for the degradation and turnover of abnormal, short-lived or damaged proteins in eukaryotic cells. It involves the remodeling of sperm plasma membrane and acrosome during sperm capacitation, and sperm–ZP interaction [57]. Conventional UPS covalently modifies substrate proteins with poly-ubiquitin chains and targets them for recognition and degradation by PSM; a holoenzyme with specific affinity for ubiquitinated proteins, it is involved in many regulatory pathways, comprising a 20S core and a peripheral 19S regulatory particle. During capacitation, the 26S proteasome could be activated by PKA, and the substrate protein is recognized by the 19S regulatory particle and phosphorylation at serine/threonine residues through a feed-back loop [58]. In boar spermatozoa, subunits PSMA1-7 (Proteasome 20S Subunit Alpha 1-7) of 20S were not post-translationally modified, with the exception of subunit PSMD4 (Proteasome 26S Subunit, Non-ATPase 4) of 19S during the course of capacitation [59]. Other 26S proteasome non-ATPase regulatory subunits, such as PSMD13 (Proteasome 26S Subunit, Non-ATPase 13) could negatively mediate the degradation of mutant membrane-associated proteins by the ubiquitination-mediated proteasomal pathway [60]. PSMD6 (Proteasome 26S Subunit, Non-ATPase 6) maintains the integrity of the 26S complex by maintaining the lid structure [61]. Alternatively, PSMB7 (Proteasome 20S Subunit Beta 7) is also important for proteasome assembly. PSMB5 precursors exist in a series of stage-specific spermatogenic cells [62], and are modulated by small GTPases, which facilitate cytoskeleton remodeling in the AR process [63]. We found that the abundance of DAPs such as PSMA1, PSMA5, PSMB2, PSMB4, PSMB5, PSMB7, PSMD1, PSMD2, PSMD4, PSMD6, and PSMD13 were higher in ram spermatozoa after capacitation than before capacitation. These PSM families were classified into the category of PTM, protein turnover, and chaperones, although the description of PSMD6 and PSMD13 were uncharacterized in Ovis aries. These results indicate the benefits of these subunits in accelerating sperm capacitation through ubiquitin proteasome pathways.
Other proteins involved in energy production and conversion were mainly located in the nucleus (PRUNE1), cytoplasm (GALT, ACLY, ATP6V1H, ATP6V1F, ATP5PD, ATP5IF1) and mitochondria (ATP6V1B2). Except for ATP5PD and ATP5IF1, they were more abundant in ram spermatozoa following capacitation compared with before. ATP5PD (ATP Synthase Peripheral Stalk Subunit D), a mitochondrial membrane ATP synthase (F1F0-ATP synthase), catalyzes ATP synthesis from ADP in the presence of an electrochemical gradient of protons across the inner membrane during oxidative phosphorylation. ATP5PD leads to ROS accumulation under normoxia [64]. Downregulation of ATP5PD helps maintain a small amount of ROS during sperm capacitation. Additionally, ATP5IF1 (ATP Synthase Inhibitory Factor Subunit 1) is the most characterized regulator of F1F0-ATP synthase [65], and binds to the enzyme which limits ATP hydrolysis when the mitochondrial membrane potential falls below a threshold. Downregulated expression of ATP5IF1 and F1F0-ATP synthase during energized conditions, and other specific agonists (such as A2AdoR), stimulate the activation of sperm soluble adenylyl cyclase, which converts ATP to cAMP in non-capacitating sperm; an increase in cAMP activates PKA activity, and accelerates sperm capacitation in mammals [66,67]. PRUNE1 (Prune Exopolyphosphatase 1) belongs to the phosphoesterase DHH superfamily-pertaining protein, and has cyclic nucleotide phosphodiesterase (PDE) activity [68]. PDEs are known to modulate the biological availability of cAMP by hydrolyzing the 3′-5′ phosphodiester bond [69]. PRUNE1 enriched in ram spermatozoa after capacitation was discovered, indicating its likely role in the regulation of cAMP during sperm capacitation. It is generally known that vacuolar-type H+ ATPase (V-ATPase) is a highly conserved enzyme among all the eukaryotic cells, where it couples the energy of ATP hydrolysis to proton transport across vesicular and plasma membranes, and mediates acidification in organelles [70]: for example, the accumulation of plasma membrane V-ATPase in narrow and clear cells of epididymis and vas deferens, which participates in active proton transport and pH adjustment of intracellular compartments [71]. Subunits of V-ATPase existed in ram spermatozoa, including ATP6V1H (ATPase H+ Transporting V1 Subunit H), ATP6V1F (ATPase H+ Transporting V1 Subunit F) and ATP6V1B2 (ATPase H+ Transporting V1 Subunit B2), all of which were upregulated following capacitation. They belong to the V1 domain, and are mainly involved in ATP hydrolysis [72]. ATP and its hydrolysis product adenosine are essential components for the formation of G-protein-coupled proteins (AdoR). Activating the stimulatory region therein (A2a, A2b) increases the second-messenger levels, thereby regulating cAMP levels and activating PKA activity in the spermatozoa [66]. Likewise, GALT (Galactose-1-Phosphate Uridylyltransferase) and ACLY (ATP Citrate Lyase) are related to energy production and conversion, and they are upregulated in sperm after capacitation. GALT catalyzes the second step of the Leloir pathway of galactose metabolism, and is an important component for sperm binding to ZP [73]. Thus, the abundance of GALT after capacitation initiates subsequent AR and sperm–zona binding [74]. ACLY is also an enzyme responsible for the formation of acetyl-CoA and oxaloacetate from CoA and citrate, with the concomitant hydrolysis of ATP to ADP and phosphate. Acetyl-CoA serves fatty acid and cholesterol synthesis. Fatty acid oxidation activity increases when sperm capacitation starts, and can produce ATP, providing additional metabolic fuel for triggering the capacitation process [75].
Transport and metabolism during sperm capacitation are also of great significance. Proteins such as GNPDA1 (Glucosamine-6-Phosphate Deaminase 1) and GNPDA2 (Glucosamine-6-Phosphate Deaminase 2), which are involved in carbohydrate transport and metabolism, were enriched in ram spermatozoa after capacitation. GNPDA (GNPDA1 and 2) convert GlcN6P back to Fru6P to synthesize UDP-GlcNAc, a nucleotide sugar that serves as a substrate for the synthesis of glycoconjugates like hyaluronan [76]. We have also identified the fact that PPP4R1 was involved in signal transduction mechanisms. PPP4R1 usually forms the PP4c/PP4R1 complex that is implicated in the regulation of histone acetylation and DNA-damage checkpoint signaling [77]. This uniquely copurifies with HDAC3, and displays protein phosphatase activity [78].

5. Conclusions

In this paper, changes in protein components in ram spermatozoa under non-capacitating and capacitating conditions in vitro were investigated by a TMT-based proteomics approach. The functional enrichment showed that these identified differentially abundant proteins were annotated to some essential pathways such as ubiquitination (PSM family like PSMA1, PSMA5, PSMB2, PSMB4, and PSMB5), energy production and conversion (PRUNE1, GALT, ACLY, ATP6V1H, ATP6V1F, ATP5PD, and ATP5IF1), and diverse transport and metabolism (PGP, GNPDA1, GNPDA2 and PPP4R1) during sperm capacitation. Whilst these protein alterations offer potential novel biomarkers, the specific molecular mechanism regulating sperm capacitation deserves further study.

Supplementary Materials

The following supporting information can be downloaded at: https://www.mdpi.com/article/10.3390/ani14162363/s1, Figure S1: Experimental design and workflow for DAP identification in spermatozoa under non-capacitating and capacitating conditions in vitro; Figure S2: Electrophoresis profile of ram proteins extracted from spermatozoa; Figure S3: A typical fluorescent image of ram sperm stained with FITC-PSA (40×); Figure S4: Assessment of Tyr-P in induced rams sperm using Western blot analysis; Figure S5: Mass spectrometry analysis of data results; Figure S6: Functional categories of 284 screened DAPs in all DAPs; Table S1: The ImageJ scanning values of Tyr-P and α-tubulin in Western blot analysis; Table S2: Data set of all identified proteins in two group samples (CAP vs. NC); Table S3: Category details of 348 DAPs screened from two sets of samples by bioinformatics analysis; Table S4: COG category details of the 284 screened proteins from 348 DAPs; Table S5: The peptide information used for PRM quantification; Table S6: Validation data of selected DAPs by PRM; Table S7: Annotation information of GO terms of the DAPs; Table S8: Enrichment information of mapped KEGG of the DAPs; Table S9: Category details of 81 DAPs (high confidence) for PPI network.

Author Contributions

Conceptualization, Q.-J.W. and Z.-J.Z.; methodology, Y.-L.C., C.-Y.L., X.Z. and P.-H.W.; software, C.-Y.L., R.W. and J.-H.C.; validation, J.-H.C., X.C. and Z.-J.Z.; formal analysis, Y.-L.C., Z.-P.S. and X.Z.; investigation, P.-H.W.; resources, C.-H.R.; data curation, Q.-J.W., C.-Y.L. and X.C.; writing—original draft preparation, Y.-L.C., X.Z. and S.-J.W.; writing—review and editing, Q.-J.W.; visualization, Y.-L.C.; supervision, Y.Z., C.-H.R. and Z.-J.Z.; project administration, Q.-J.W.; funding acquisition, Z.-J.Z. All authors have read and agreed to the published version of the manuscript.

Funding

This research was funded by the National Key Research and Development Program of China (2022YFD1300202), the China Agriculture Research System of MOF and MARA (CARS-38), and Anhui Agricultural University Introduction and Stabilization of Talents Research Funding (rc392211).

Institutional Review Board Statement

The animal study protocol was approved by the Animal Care Committee, Anhui Agricultural University (No. AHAU2020023, 4 January 2020).

Informed Consent Statement

Not applicable.

Data Availability Statement

The data generated by this project are included as Supplementary Information. Requests for raw data of TMT labeling strategy could search via the iProX partner repository with the dataset identifier PXD023101, and raw data of PRM have also been submitted to the PRIDE repository (https://www.ebi.ac.uk/pride/ (accessed on 20 August 2022)) with the dataset identifier PXD034330. All requests for data could be made to the corresponding authors.

Acknowledgments

We thank Ren-Zheng Zhang, who provided the technical assistance for the determination of Tyr-P.

Conflicts of Interest

The authors declare no conflicts of interest.

References

  1. Cohen-Dayag, A.; Eisenbach, M. Potential assays for sperm capacitation in mammals. Am. J. Physiol. 1994, 267 Pt 1, C1167–C1176. [Google Scholar] [CrossRef]
  2. Mitra, K.; Rangaraj, N.; Shivaji, S. Novelty of the pyruvate metabolic enzyme dihydrolipoamide dehydrogenase in spermatozoa: Correlation of its localization, tyrosine phosphorylation, and activity during sperm capacitation. J. Biol. Chem. 2005, 280, 25743–25753. [Google Scholar] [CrossRef]
  3. Luo, Z.; Liu, Y.; Chen, L.; Ellis, M.; Li, M.; Wang, J.; Zhang, Y.; Fu, P.; Wang, K.; Li, X.; et al. microRNA profiling in three main stages during porcine spermatogenesis. J. Assist. Reprod. Genet. 2015, 32, 451–460. [Google Scholar] [CrossRef]
  4. Ross, P.; Kan, F.W.; Antaki, P.; Vigneault, N.; Chapdelaine, A.; Roberts, K.D. Protein synthesis and secretion in the human epididymis and immunoreactivity with sperm antibodies. Mol. Reprod. Dev. 1990, 26, 12–23. [Google Scholar] [CrossRef]
  5. Gur, Y.; Breitbart, H. Protein synthesis in sperm: Dialog between mitochondria and cytoplasm. Mol. Cell. Endocrinol. 2008, 282, 45–55. [Google Scholar] [CrossRef] [PubMed]
  6. Jagan Mohanarao, G.; Atreja, S.K. Identification of NO induced and capacitation associated tyrosine phosphoproteins in buffalo (Bubalus bubalis) spermatozoa. Res. Vet. Sci. 2012, 93, 618–623. [Google Scholar] [CrossRef] [PubMed]
  7. Urner, F.; Leppens-Luisier, G.; Sakkas, D. Protein tyrosine phosphorylation in sperm during gamete interaction in the mouse: The influence of glucose. Biol. Reprod. 2001, 64, 1350–1357. [Google Scholar] [CrossRef]
  8. Hou, Z.; Fu, Q.; Huang, Y.; Zhang, P.; Chen, F.; Li, M.; Xu, Z.; Yao, S.; Chen, D.; Zhang, M. Comparative proteomic identification buffalo spermatozoa during in vitro capacitation. Theriogenology 2019, 126, 303–309. [Google Scholar] [CrossRef] [PubMed]
  9. Ficarro, S.; Chertihin, O.; Westbrook, V.A.; White, F.; Jayes, F.; Kalab, P.; Marto, J.A.; Shabanowitz, J.; Herr, J.C.; Hunt, D.F.; et al. Phosphoproteome analysis of capacitated human sperm. Evidence of tyrosine phosphorylation of a kinase-anchoring protein 3 and valosin-containing protein/p97 during capacitation. J. Biol. Chem. 2003, 278, 11579–11589. [Google Scholar] [CrossRef]
  10. Secciani, F.; Bianchi, L.; Ermini, L.; Cianti, R.; Armini, A.; La Sala, G.B.; Focarelli, R.; Bini, L.; Rosati, F. Protein profile of capacitated versus ejaculated human sperm. J. Proteome Res. 2009, 8, 3377–3389. [Google Scholar] [CrossRef]
  11. Arcelay, E.; Salicioni, A.M.; Wertheimer, E.; Visconti, P.E. Identification of proteins undergoing tyrosine phosphorylation during mouse sperm capacitation. Int. J. Dev. Biol. 2008, 52, 463–472. [Google Scholar] [CrossRef]
  12. Baker, M.A.; Reeves, G.; Hetherington, L.; Aitken, R.J. Analysis of proteomic changes associated with sperm capacitation through the combined use of IPG-strip pre-fractionation followed by RP chromatography LC-MS/MS analysis. Proteomics 2010, 10, 482–495. [Google Scholar] [CrossRef]
  13. Bailey, J.L.; Tardif, S.; Dubé, C.; Beaulieu, M.; Reyes-Moreno, C.; Lefièvre, L.; Leclerc, P. Use of phosphoproteomics to study tyrosine kinase activity in capacitating boar sperm. Kinase activity and capacitation. Theriogenology 2005, 63, 599–614. [Google Scholar] [CrossRef]
  14. Wright, P.C.; Noirel, J.; Ow, S.Y.; Fazeli, A. A review of current proteomics technologies with a survey on their widespread use in reproductive biology investigations. Theriogenology 2012, 77, 738–765.e52. [Google Scholar]
  15. Samanta, L.; Parida, R.; Dias, T.R.; Agarwal, A. The enigmatic seminal plasma: A proteomics insight from ejaculation to fertilization. Reprod. Biol. Endocrin. 2018, 16, 41. [Google Scholar] [CrossRef]
  16. Darszon, A.; Acevedo, J.J.; Galindo, B.E.; Hernandez-Gonzalez, E.O.; Nishigaki, T.; Trevino, C.L.; Wood, C.; Beltran, C. Sperm channel diversity and functional multiplicity. Reproduction 2006, 131, 977–988. [Google Scholar] [CrossRef]
  17. Mitchell, L.A.; Nixon, B.; Aitken, R.J. Analysis of chaperone proteins associated with human spermatozoa during capacitation. Mol. Hum. Reprod. 2007, 13, 605–613. [Google Scholar] [CrossRef]
  18. Dey, S.; Brothag, C.; Vijayaraghavan, S. Signaling Enzymes Required for Sperm Maturation and Fertilization in Mammals. Front. Cell. Dev. Biol. 2019, 7, 341. [Google Scholar] [CrossRef]
  19. Baker, M.A.; Smith, N.D.; Hetherington, L.; Taubman, K.; Graham, M.E.; Robinson, P.J.; Aitken, R.J. Label-free quantitation of phosphopeptide changes during rat sperm capacitation. J. Proteome Res. 2010, 9, 718–729. [Google Scholar] [CrossRef]
  20. Kwon, W.S.; Rahman, M.S.; Lee, J.S.; Kim, J.; Yoon, S.J.; Park, Y.J.; You, Y.A.; Hwang, S.; Pang, M.G. A comprehensive proteomic approach to identifying capacitation related proteins in boar spermatozoa. BMC Genom. 2014, 15, 897. [Google Scholar] [CrossRef]
  21. Miguel-Jimenez, S.; Pina-Beltran, B.; Gimeno-Martos, S.; Carvajal-Serna, M.; Casao, A.; Perez-Pe, R. NADPH Oxidase 5 and Melatonin: Involvement in Ram Sperm Capacitation. Front. Cell. Dev. Biol. 2021, 9, 655794. [Google Scholar] [CrossRef]
  22. O’Flaherty, C.; de Lamirande, E.; Gagnon, C. Positive role of reactive oxygen species in mammalian sperm capacitation: Triggering and modulation of phosphorylation events. Free. Radic. Biol. Med. 2006, 41, 528–540. [Google Scholar] [CrossRef]
  23. Scarlata, E.; O’Flaherty, C. Antioxidant Enzymes and Male Fertility: Lessons from Knockout Models. Antioxid. Redox. Signal. 2020, 32, 569–580. [Google Scholar] [CrossRef]
  24. Efrat, M.; Stein, A.; Pinkas, H.; Breitbart, H.; Unger, R.; Birk, R. Paraoxonase 1 (PON1) attenuates sperm hyperactivity and spontaneous acrosome reaction. Andrology 2019, 7, 24–30. [Google Scholar] [CrossRef]
  25. O’Flaherty, C.; Matsushita-Fournier, D. Reactive oxygen species and protein modifications in spermatozoa. Biol. Reprod. 2017, 97, 577–585. [Google Scholar] [CrossRef]
  26. Peris-Frau, P.; Martín-Maestro, A.; Iniesta-Cuerda, M.; Sánchez-Ajofrín, I.; Mateos-Hernández, L.; Garde, J.J.; Villar, M.; Soler, A.J. Freezing-Thawing Procedures Remodel the Proteome of Ram Sperm before and after In Vitro Capacitation. Int. J. Mol. Sci. 2019, 20, 4596. [Google Scholar] [CrossRef]
  27. Mejia-Flores, I.; Chiquete-Felix, N.; Palma-Lara, I.; Uribe-Carvajal, S.; de Lourdes Juarez-Mosqueda, M. During capacitation in bull spermatozoa, actin and PLC-zeta undergo dynamic interactions. Zygote 2017, 25, 558–566. [Google Scholar] [CrossRef]
  28. Ramirez-Ramirez, D.; Salgado-Lucio, M.L.; Roa-Espitia, A.L.; Fierro, R.; Gonzalez-Marquez, H.; Cordero-Martinez, J.; Hernandez-Gonzalez, E.O. Rac1 is necessary for capacitation and acrosome reaction in guinea pig spermatozoa. J. Cell. Biochem. 2020, 121, 2864–2876. [Google Scholar] [CrossRef]
  29. Majhi, R.K.; Kumar, A.; Yadav, M.; Swain, N.; Kumari, S.; Saha, A.; Pradhan, A.; Goswami, L.; Saha, S.; Samanta, L.; et al. Thermosensitive ion channel TRPV1 is endogenously expressed in the sperm of a fresh water teleost fish (Labeo rohita) and regulates sperm motility. Channels 2013, 7, 483–492. [Google Scholar] [CrossRef]
  30. Kumar, A.; Majhi, R.K.; Swain, N.; Giri, S.C.; Kar, S.; Samanta, L.; Goswami, C. TRPV4 is endogenously expressed in vertebrate spermatozoa and regulates intracellular calcium in human sperm. Biochem. Biophys. Res. Commun. 2016, 473, 781–788. [Google Scholar] [CrossRef]
  31. Cordero-Martinez, J.; Reyes-Miguel, T.; Rodriguez-Paez, L.; Garduno-Siciliano, L.; Maldonado-Garcia, D.; Roa-Espitia, A.L.; Hernandez-Gonzalez, E.O. TMEM16A inhibition impedes capacitation and acquisition of hyperactivated motility in guinea pig sperm. J. Cell. Biochem. 2018, 119, 5944–5959. [Google Scholar] [CrossRef]
  32. Mandal, A.; Naaby-Hansen, S.; Wolkowicz, M.J.; Klotz, K.; Shetty, J.; Retief, J.D.; Coonrod, S.A.; Kinter, M.; Sherman, N.; Cesar, F.; et al. FSP95, a testis-specific 95-kilodalton fibrous sheath antigen that undergoes tyrosine phosphorylation in capacitated human spermatozoa. Biol. Reprod. 1999, 61, 1184–1197. [Google Scholar] [CrossRef]
  33. Hernández-Silva, G.; Fabián López-Araiza, J.E.; López-Torres, A.S.; Larrea, F.; Torres-Flores, V.; Chirinos, M. Proteomic characterization of human sperm plasma membrane-associated proteins and their role in capacitation. Andrology 2020, 8, 171–180. [Google Scholar] [CrossRef]
  34. Dube, C.; Leclerc, P.; Baba, T.; Reyes-Moreno, C.; Bailey, J.L. The proacrosin binding protein, sp32, is tyrosine phosphorylated during capacitation of pig sperm. J. Androl. 2005, 26, 519–528. [Google Scholar] [CrossRef]
  35. Naaby-Hansen, S.; Mandal, A.; Wolkowicz, M.J.; Sen, B.; Westbrook, V.A.; Shetty, J.; Coonrod, S.A.; Klotz, K.L.; Kim, Y.H.; Bush, L.A.; et al. CABYR, a novel calcium-binding tyrosine phosphorylation-regulated fibrous sheath protein involved in capacitation. Dev. Biol. 2002, 242, 236–254. [Google Scholar] [CrossRef] [PubMed]
  36. Lu, C.H.; Lee, R.K.K.; Hwu, Y.M.; Chu, S.L.; Chen, Y.J.; Chang, W.C.; Lin, S.P.; Li, S.H. SERPINE2, a Serine Protease Inhibitor Extensively Expressed in Adult Male Mouse Reproductive Tissues, May Serve as a Murine Sperm Decapacitation Factor. Biol. Reprod. 2011, 84, 514–525. [Google Scholar] [CrossRef] [PubMed]
  37. Liu, T.; Han, Y.; Zhou, T.; Zhang, R.; Chen, H.; Chen, S.; Zhao, H. Mechanisms of ROS-induced mitochondria-dependent apoptosis underlying liquid storage of goat spermatozoa. Aging 2019, 11, 7880–7898. [Google Scholar] [CrossRef]
  38. Bubenickova, F.; Postlerova, P.; Simonik, O.; Sirohi, J.; Sichtar, J. Effect of Seminal Plasma Protein Fractions on Stallion Sperm Cryopreservation. Int. J. Mol. Sci. 2020, 21, 6415. [Google Scholar] [CrossRef] [PubMed]
  39. Saez-Espinosa, P.; Huerta-Retamal, N.; Robles-Gomez, L.; Aviles, M.; Aizpurua, J.; Velasco, I.; Romero, A.; Gomez-Torres, M.J. Influence of in vitro capacitation time on structural and functional human sperm parameters. Asian. J. Androl. 2020, 22, 447–453. [Google Scholar] [PubMed]
  40. Zhang, R.; Chu, M.; Chen, Y.; Yan, P. Heparin-induced and caffeine or ouabain supplemented capacitation of frozen-thawed yak (Bos grunniens) spermatozoa. Reprod. Domest. Anim. 2022, 57, 587–597. [Google Scholar] [CrossRef] [PubMed]
  41. Roy, S.C.; Atreja, S.K. Capacitation-associated protein tyrosine phosphorylation starts early in buffalo (Bubalus bubalis) spermatozoa as compared to cattle. Anim. Reprod. Sci. 2009, 110, 319–325. [Google Scholar] [CrossRef]
  42. Wang, C.Y.; Yang, X.N.; Zhang, X.; Liu, B.J.; Liu, W.; Shen, Y.; Gao, Z.B.; Yin, Q.; Wang, C.L.; Zhou, J. TMT-based quantitative proteome profiles reveal the memory function of a whole heart decellularized matrix for neural stem cell trans-differentiation into the cardiac lineage. Biomater. Sci. 2021, 9, 3692–3704. [Google Scholar] [CrossRef] [PubMed]
  43. Ren, C.; Chen, Y.; Tang, J.; Wang, P.; Zhang, Y.; Li, C.; Zhang, Z.; Cheng, X. TMT-Based Comparative Proteomic Analysis of the Spermatozoa of Buck (Capra hircus) and Ram (Ovis aries). Genes 2023, 14, 973. [Google Scholar] [CrossRef] [PubMed]
  44. Du, Y.; Wang, Y.; Xu, Q.; Zhu, J.; Lin, Y. TMT-based quantitative proteomics analysis reveals the key proteins related with the differentiation process of goat intramuscular adipocytes. BMC Genom. 2021, 22, 417. [Google Scholar] [CrossRef]
  45. Guan, K.F.; Li, H.; Chen, H.R.; Qi, X.F.; Wang, R.C.; Ma, Y. TMT-based quantitative proteomics analysis reveals the effect of bovine derived MFG-E8 against oxidative stress on rat L6 cells. Food. Funct. 2021, 12, 7310–7320. [Google Scholar] [CrossRef] [PubMed]
  46. Li, Y.X.; Luo, Z.P.; Wu, X.L.; Zhu, J.; Yu, K.; Jin, Y.; Zhang, Z.W.; Zhao, S.H.; Zhou, L. Proteomic Analyses of Cysteine Redox in High-Fat-Fed and Fasted Mouse Livers: Implications for Liver Metabolic Homeostasis. J. Phys. Chem. Lett. 2018, 17, 129–140. [Google Scholar] [CrossRef]
  47. Hermo, L.; Pelletier, R.M.; Cyr, D.G.; Smith, C.E. Surfing the wave, cycle, life history, and genes/proteins expressed by testicular germ cells. Part 2: Changes in spermatid organelles associated with development of spermatozoa. Microsc. Res. Tech. 2010, 73, 279–319. [Google Scholar] [CrossRef]
  48. Chauvin, T.; Xie, F.; Liu, T.; Nicora, C.D.; Yang, F.; Camp, D.G., 2nd; Smith, R.D.; Roberts, K.P. A systematic analysis of a deep mouse epididymal sperm proteome. Biol. Reprod. 2012, 87, 141. [Google Scholar] [CrossRef]
  49. Buffone, M.G.; Calamera, J.C.; Verstraeten, S.V.; Doncel, G.F. Capacitation-associated protein tyrosine phosphorylation and membrane fluidity changes are impaired in the spermatozoa of asthenozoospermic patients. Reproduction 2005, 129, 697–705. [Google Scholar] [CrossRef]
  50. Mostek, A.; Janta, A.; Majewska, A.; Ciereszko, A. Bull Sperm Capacitation Is Accompanied by Redox Modifications of Proteins. Int. J. Mol. Sci. 2021, 22, 7903. [Google Scholar] [CrossRef] [PubMed]
  51. Flesch, F.M.; Colenbrander, B.; van Golde, L.M.; Gadella, B.M. Capacitation induces tyrosine phosphorylation of proteins in the boar sperm plasma membrane. Biochem. Biophys. Res. Commun. 1999, 262, 787–792. [Google Scholar] [CrossRef] [PubMed]
  52. Ren, C.; Sun, Z.; Chen, Y.; Chen, J.; Wang, S.; Liu, Q.; Wang, P.; Cheng, X.; Zhang, Z.; Wang, Q. Identification of Biomarkers Affecting Cryopreservation Recovery Ratio in Ram Spermatozoa Using Tandem Mass Tags (TMT)-Based Quantitative Proteomics Approach. Animals 2023, 13, 2368. [Google Scholar] [CrossRef] [PubMed]
  53. Ashrafzadeh, A.; Karsani, S.A.; Nathan, S. Mammalian sperm fertility related proteins. Int. J. Med. Sci. 2013, 10, 1649–1657. [Google Scholar] [CrossRef] [PubMed]
  54. Kota, V.; Dhople, V.M.; Shivaji, S. Tyrosine phosphoproteome of hamster spermatozoa: Role of glycerol-3-phosphate dehydrogenase 2 in sperm capacitation. Proteomics 2009, 9, 1809–1826. [Google Scholar] [CrossRef] [PubMed]
  55. Shi, X.Q.; Zhu, Z.H.; Yue, S.J.; Tang, Y.P.; Chen, Y.Y.; Pu, Z.J.; Tao, H.J.; Zhou, G.S.; Yang, Y.; Guo, M.J.; et al. Integration of organ metabolomics and proteomics in exploring the blood enriching mechanism of Danggui Buxue Decoction in hemorrhagic anemia rats. J. Ethnopharmacol. 2020, 261, 113000. [Google Scholar] [CrossRef]
  56. Jofre, I.; Cuevas, M.; de Castro, L.S.; de Agostini Losano, J.D.; Torres, M.A.; Alvear, M.; Scheuermann, E.; Andrade, A.F.C.; Nichi, M.; Assumpcao, M.E.O.; et al. Antioxidant Effect of a Polyphenol-Rich Murtilla (Ugni molinae Turcz.) Extract and Its Effect on the Regulation of Metabolism in Refrigerated Boar Sperm. Oxid. Med. Cell. Longev. 2019, 2019, 2917513. [Google Scholar] [CrossRef] [PubMed]
  57. Kerns, K.; Morales, P.; Sutovsky, P. Regulation of Sperm Capacitation by the 26S Proteasome: An Emerging New Paradigm in Spermatology. Biol. Reprod. 2016, 94, 117. [Google Scholar] [CrossRef] [PubMed]
  58. Kong, M.; Diaz, E.S.; Morales, P. Participation of the human sperm proteasome in the capacitation process and its regulation by protein kinase A and tyrosine kinase. Biol. Reprod. 2009, 80, 1026–1035. [Google Scholar] [CrossRef]
  59. Zigo, M.; Kerns, K.; Sutovsky, M.; Sutovsky, P. Modifications of the 26S proteasome during boar sperm capacitation. Cell. Tissue Res. 2018, 372, 591–601. [Google Scholar] [CrossRef]
  60. Li, S.H.; Izumi, T.; Hu, J.; Jin, H.H.; Siddiqui, A.A.A.; Jacobson, S.G.; Bok, D.; Jin, M.H. Rescue of Enzymatic Function for Disease-associated RPE65 Proteins Containing Various Missense Mutations in Non-active Sites. J. Biol. Chem. 2014, 289, 18943–18956. [Google Scholar] [CrossRef]
  61. George, G.; Singh, S.; Lokappa, S.B.; Varkey, J. Gene co-expression network analysis for identifying genetic markers in Parkinson’s disease—A three-way comparative approach. Genomics 2019, 111, 819–830. [Google Scholar] [CrossRef]
  62. Zhang, N.; Liang, J.B.; Tian, Y.Q.; Yuan, L.G.; Wu, L.; Miao, S.Y.; Zong, S.D.; Wang, L.F. A Novel Testis-specific GTPase Serves as a Link to Proteasome Biogenesis: Functional Characterization of RhoS/RSA-14-44 in Spermatogenesis. Mol. Biol. Cell. 2010, 21, 4312–4324. [Google Scholar] [CrossRef]
  63. Delgado-Buenrostro, N.L.; Mujica, A.; Chiquete-Felix, N.; Deciga-Alcaraz, A.; Medina-Reyes, E.I.; Uribe-Carvajal, S.; Chirino, Y.I. Role of Wasp and the small GTPases RhoA, RhoB, and Cdc42 during capacitation and acrosome reaction in spermatozoa of English guinea pigs. Mol. Reprod. Dev. 2016, 83, 927–937. [Google Scholar] [CrossRef]
  64. Song, K.H.; Kim, J.H.; Lee, Y.H.; Bae, H.C.; Lee, H.J.; Woo, S.R.; Oh, S.J.; Lee, K.M.; Yee, C.; Kim, B.W.; et al. Mitochondrial reprogramming via ATP5H loss promotes multimodal cancer therapy resistance. J. Clin. Investig. 2018, 128, 4098–4114. [Google Scholar] [CrossRef] [PubMed]
  65. Martin-Jimenez, R.; Faccenda, D.; Allen, E.; Reichel, H.B.; Arcos, L.; Ferraina, C.; Strobbe, D.; Russell, C.; Campanella, M. Reduction of the ATPase inhibitory factor 1 (IF1) leads to visual impairment in vertebrates. Cell. Death. Dis. 2018, 9, 669. [Google Scholar] [CrossRef]
  66. Bellezza, I.; Minelli, A. Adenosine in sperm physiology. Mol. Aspects. Med. 2017, 55, 102–109. [Google Scholar] [CrossRef] [PubMed]
  67. Chen, Y.; Cann, M.J.; Litvin, T.N.; Iourgenko, V.; Sinclair, M.L.; Levin, L.R.; Buck, J. Soluble adenylyl cyclase as an evolutionarily conserved bicarbonate sensor. Science 2000, 289, 625–628. [Google Scholar] [CrossRef]
  68. D’Angelo, A.; Garzia, L.; Andre, A.; Carotenuto, P.; Aglio, V.; Guardiola, O.; Arrigoni, G.; Cossu, A.; Palmieri, G.; Aravind, L.; et al. Prune cAMP phosphodiesterase binds nm23-H1 and promotes cancer metastasis. Cancer Cell 2004, 5, 137–149. [Google Scholar] [CrossRef]
  69. Marechal, L.; Guillemette, C.; Goupil, S.; Blondin, P.; Leclerc, P.; Richard, F.J. Cyclic nucleotide phosphodiesterases in human spermatozoa and seminal fluid: Presence of an active PDE10A in human spermatozoa. Biochim. Biophys. Acta Gen. Subj. 2017, 1861, 147–156. [Google Scholar] [CrossRef]
  70. Pamarthy, S.; Kulshrestha, A.; Katara, G.K.; Beaman, K.D. The curious case of vacuolar ATPase: Regulation of signaling pathways. Mol. Cancer 2018, 17, 41. [Google Scholar] [CrossRef] [PubMed]
  71. Pastor-Soler, N.; Beaulieu, V.; Litvin, T.N.; Da Silva, N.; Chen, Y.Q.; Brown, D.; Buck, J.; Levin, L.R.; Breton, S. Bicarbonate-regulated adenylyl cyclase (sAC) is a sensor that regulates pH-dependent V-ATPase recycling. J. Biol. Chem. 2003, 278, 49523–49529. [Google Scholar] [CrossRef]
  72. Vasanthakumar, T.; Rubinstein, J.L. Structure and Roles of V-type ATPases. Trends Biochem. Sci. 2020, 45, 295–307. [Google Scholar] [CrossRef] [PubMed]
  73. Shur, B.D.; Hall, N.G. A role for mouse sperm surface galactosyltransferase in sperm binding to the egg zona pellucida. J. Cell. Biol. 1982, 95 Pt 1, 574–579. [Google Scholar] [CrossRef] [PubMed]
  74. Talbot, P.; Shur, B.D.; Myles, D.G. Cell adhesion and fertilization: Steps in oocyte transport, sperm-zona pellucida interactions, and sperm-egg fusion. Biol. Reprod. 2003, 68, 1–9. [Google Scholar] [CrossRef] [PubMed]
  75. Ando, S.; Aquila, S. Arguments raised by the recent discovery that insulin and leptin are expressed in and secreted by human ejaculated spermatozoa. Mol. Cell. Endocrinol. 2005, 245, 1–6. [Google Scholar] [CrossRef] [PubMed]
  76. Oikari, S.; Makkonen, K.; Deen, A.J.; Tyni, I.; Karna, R.; Tammi, R.H.; Tammi, M.I. Hexosamine biosynthesis in keratinocytes: Roles of GFAT and GNPDA enzymes in the maintenance of UDP-GlcNAc content and hyaluronan synthesis. Glycobiology 2016, 26, 710–722. [Google Scholar] [CrossRef] [PubMed]
  77. Addou-Klouche, L.; Adelaide, J.; Finetti, P.; Cervera, N.; Ferrari, A.; Bekhouche, I.; Sircoulomb, F.; Sotiriou, C.; Viens, P.; Moulessehoul, S.; et al. Loss, mutation and deregulation of L3MBTL4 in breast cancers. Mol. Cancer 2010, 9, 213. [Google Scholar] [CrossRef]
  78. Zhang, X.H.; Ozawa, Y.; Lee, H.; Wen, Y.D.; Tan, T.H.; Wadzinski, B.E.; Seto, E. Histone deacetylase 3 (HDAC3) activity is regulated by interaction with protein serine/threonine phosphatase 4. Gene Dev. 2005, 19, 827–839. [Google Scholar] [CrossRef]
Figure 1. Proteomics analysis of ram spermatozoa before and after capacitation in vitro. Coomassie brilliant blue staining observed on (A) non-capacitating spermatozoa with blue over entire head and (B) capacitating spermatozoa with no staining or a light blue in acrosome region (bar = 50 µm) before sequencing; acrosome regions are indicated by red arrows. (C) Pearson correlation coefficient quantitative results of biological or technical duplicate samples of non-capacitating (NC) and capacitating (CAP) groups. (D) Principal component (PC) analysis of the proteomics for the two groups are shown by symbols of the same color. PC1 and PC2 represent the top two dimensions of detected proteins among spermatozoa.
Animals 14 02363 g001
Figure 2. Screening of the DAPs. (A) Volcano plots of the comparison (CAP vs. NC). The horizontal coordinate represents the fold change of the DAPs (log2). The vertical coordinate represents the p-value (10 is the logarithmic transformation at the bottom). Red points indicate significantly upregulated DAPs; blue points indicate significantly downregulated DAPs, and gray points indicate proteins that did not show differential abundance. (B) Subcellular localization of 348 DAPs that were identified in the comparable group (CAP vs. NC).
Animals 14 02363 g002
Figure 3. Expression patterns of selected DAPs using TMT analysis and PRM validation. From top to bottom, two dotted lines represent 1.5-fold (upregulation) and 0.67-fold (downregulation), respectively.
Animals 14 02363 g003
Figure 4. Functional enrichment analysis of DAPs. (A) GO analysis for DAPs. Three functional domains are displayed, including biological process, cellular component and molecular function with the top 13 terms, 7 terms and 5 terms, respectively. (B) Analysis of KEGG pathways in the comparable groups (CAP vs. NC).
Animals 14 02363 g004
Figure 5. Protein network analysis of 81 DAPs with the closest interaction relationship, with a confidence score > 0.7 (high confidence) in two groups.
Animals 14 02363 g005
Table 1. Kinematic parameters of spermatozoa between NC and CAP groups from rams.
Sperm KinematicsGroup NCGroup CAP
MOT (%)79.3 ± 6.483.5 ± 4.3 *
VCL (μm/s)113.2 ± 11.2123.5 ± 4.0 *
VSL (μm/s)38.4 ± 8.168.2 ± 4.9 *
VAP (μm/s)66.6 ± 10.296.7 ± 4.4 *
ALH (μm)4.3 ± 0.53.2 ± 0.2 *
Note: * indicates significant difference (p < 0.05) of sperm between NC and CAP groups.
Table 2. The top 15 proteins that were more abundant in NC compared to CAP.
AccessionGene NameMW [kDa]ScoreCoverage [%]Peptidesp-ValueFold Change
P02075HBB16.07142.2474.5116.03 × 10−72.53
W5Q3H2DNAL412.9727.6633.943.46 × 10−62.66
W5NSD8TEPP30.6387.9829.6103.72 × 10−51.57
W5NZ60GNPAT77.6832.778.250.0003241.57
W5P9X2CHCHD326.76125.8740.990.0005791.52
W5PTU5SPACA132.33323.3146.9110.0006441.87
W5NQT7NDUFAB117.5933.542140.0011371.53
B2MVX2SLC25A1134.2127.0712.130.0025821.634
W5P657WDR87331.9235.97260.0032842.07
W5P066CYB5B16.9850.3513.720.0046021.61
W5Q3Y4ATP2A2106.6135.555.860.0047412.09
W5Q4Y3STPG261.2925.995.320.0050751.57
W5PP37ATP5PD18.7245.9739.170.0052451.63
W5QHI0IMMT89.27323.3135.5280.0081581.52
W5PW99ADCK563.7920.705.530.0176992.15
Table 3. The top 15 proteins that were more abundant in CAP compared to NC.
AccessionGene NameMW [kDa]ScoreCoverage [%]Peptidesp-ValueFold Change
P14639ALB69.19323.3153.7310.0010217.89
W5P7X5WFDC210.47171.6976112.3 × 10−57.05
W5QB42CES5A64.21119.121110.0043655.13
W5P1C2NUCB252.4765.7922.482.15 × 10−64.34
W5Q0Z2CTSB36.7351.6017.362.21 × 10−54.27
W5Q9A2AZGP135.4261.4323.352.47 × 10−53.86
W5PR14FAM3D25.3920.8614.330.0002243.68
W5Q1M0GLB172.8482.4915.183.46 × 10−63.61
W5NQ55DEFB11611.7169.4930.134.02 × 10−53.54
P56283NPPC13.3238.6334.144.42 × 10−53.36
W5QHU9PPIB23.7350.5132.463.95 × 10−53.31
H9TN93GPx525.04133.354.3131.74 × 10−53.02
W5PD71CRP25.27251.433.573.57 × 10−52.83
W5QIT0SORD38.27168.9240.2150.0017242.56
W5PTV7ACE138.23229.6717218.97 × 10−72.55
Table 4. Major differential proteins related to ram sperm capacitation in vitro.
AccessionGene NamePeptidesMW [kDa]ScoreCoverage [%]CAP/NCp-Value
W5QHM6PSMD122105.95234.40028.51.5117.48 × 10−3
A7UHZ2PSMD4840.7887.40930.51.5151.42 × 10−3
W5QHD8PSMD218107.61158.90022.11.6632.62 × 10−4
W5QD30PSMA5826.41124.85046.51.5451.98 × 10−4
W5QE19PSMB2622.9743.46727.21.5752.57 × 10−4
W5QIL2PSMB4428.9754.89125.01.6672.39 × 10−4
W5QDM2PSMB5628.7147.96124.31.6204.30 × 10−3
W5PFU1PSMD131542.75122.60038.31.6242.01 × 10−5
W5PVU5PSMB7329.9225.4208.32.0305.68 × 10−3
W5P9U4PSMA11229.59101.29041.11.6957.68 × 10−5
W5PNT5PSMD61345.51130.61032.91.5703.19 × 10−4
W5QIC3PRUNE1748.8557.09620.11.5801.00 × 10−3
W5PHB8GALT743.3448.86216.91.5673.94 × 10−3
Q2TCH3ACLY29120.93236.51030.31.9442.80 × 10−6
W5PWF2ATP6V1H1055.80123.99029.41.6141.50 × 10−5
W5NZZ3ATP6V1F613.4036.52442.01.6223.16 × 10−3
W5PP37ATP5PD718.7245.97339.10.6125.25 × 10−3
W5NYG6ATP5IF1411.3744.21419.80.6312.41 × 10−2
W5PLZ0ATP6V1B21956.93193.89043.71.7922.11 × 10−5
W5Q8X9PGP925.01129.77041.81.5421.98 × 10−4
W5NUG3GNPDA1832.5640.06133.21.5135.18 × 10−4
W5Q0A8GNPDA21031.16109.88043.51.7701.34 × 10−3
W5QFN9UGP21556.90158.29033.92.0158.29 × 10−5
W5NSS1PPP4R112105.74111.11017.51.8051.86 × 10−5
W5NZ60GNPAT577.6832.7658.20.6373.24 × 10−4
Disclaimer/Publisher’s Note: The statements, opinions and data contained in all publications are solely those of the individual author(s) and contributor(s) and not of MDPI and/or the editor(s). MDPI and/or the editor(s) disclaim responsibility for any injury to people or property resulting from any ideas, methods, instructions or products referred to in the content.

