Simple Summary
Calving interval data by the National Association of Hungarian Holstein Friesian Breeders in Hungary were processed. According to our results the relatively low proportion of genetic variances indicates that the selection of Holstein-Friesian cattle for reproductive traits (such as calving interval) may render low magnitudes and long-term responses. Nevertheless, the economic importance of these traits should not be overlooked. Our results on genetic trends, according to which the average calving interval decreased a little during the examined period, suggest that, despite the relatively low genetic determination, it is possible to achieve some improvement in reproductive traits.
Abstract
Calving interval (CI) data (N = 37,263) from 17,319 cows born 2008–2018 in six herds were assessed. The data were made available by the National Association of Hungarian Holstein Friesian Breeders in Hungary. The effects of some genetic and environmental factors, population genetic parameters, breeding value (BV) of sires, and phenotypic and genetic trends of the CI were estimated. The GLM method was used for studying different effects on the CI. BLUP animal model was used for heritability (h2) and BV estimation. Linear regression analyses were applied for the trend calculation. The mean of the CI was 412.2 ± 2.0 days. The h2 of the CI proved to be low (0.07 ± 0.01 and 0.08 ± 0.01). There were relatively high differences among the sires in the estimated BV. Based on the phenotypic trend calculation, the CI of cows showed decreasing direction by an average of 1.80 days per year (R2 = 0.94; p < 0.01). In the case of genetic trend calculation, the average BV of sires in the CI has decreased −4.94 and −0.31 days per year (R2 = 0.91 and 0.41; p < 0.01).
1. Introduction
In dairy herds, the fertilization period starts approximately 60 days after calving. In terms of milk production, this is the peak period; that is, cows should be inseminated when their daily milk production is at its highest level. In addition to satisfying the maintenance and milk production feed requirement, it would be advisable to pay attention to improving the condition, since the improved nutritional status (“flushing”) is clearly beneficial in terms of fertility. Unfortunately, in practice, optimal nutrition cannot be achieved in many cases, the nutrient requirements of high milk production cannot be met, which can lead to deterioration of the condition or disturbances in the flow of substances. As a result of high-quality milk production, the health of the udder may deteriorate, which may cause an increase in the number of somatic cells, or even mastitis. As a result of all this, the reproductive biological status of the cows is not satisfactory; consequently, it is more difficult for the cows to become pregnant, and the interval between the two calvings becomes longer.
Theoretically, the calving interval (CI) can be shorter than one year. The gestation length is a standard value (285 days overall, 275 days as an average in Holstein-Friesian cows [1]) in cattle and the cows need at least 21, but in practice, a minimum of 42 days, as days open, to be pregnant after calving. Thus, the minimum period between two calvings can be approximately 300–320 days.
There is quite a lot of information about the CI of different cattle breeds in the literature (Table 1).

Table 1.
The mean and the range of the CI trait in the literature.
Among the relevant sources, there are very few where the average value of the CI is less than 365 days [9]. The CI of dairy cattle is usually longer than one year, but many sources report values of over 400 days [8,16]. Some literature sources report an even longer time (430–440 days) between two calvings in dairy herds [17]. In the case of the CI of beef breeds, Yagüe et al. [14] reported 409 days for Rubia Gallega, Silveira et al. [18] reported 465 days for Nellore, and Brzáková et al. [4] reported 370–392 days for Aberdeen Angus and Charolais.
Based on data from most literature sources, the heritability (h2) and the repeatability (R) of the CI trait is very low [19,20]. In the case of the Holstein-Friesian breed, the heritability of the CI trait was 0.03–0.09 [5,13,21]. The relevant literature sources also reported very low h2 values for beef breeds: 0.13 for Asturiana de los Valles [7], 0.03 for Nellore [22], 0.11–0.18 for mixed genotype [23], 0.06 for Cuban Charolais [24], 0.03 for Hanwoo [9], and 0.08 for Angus and Charolais [4]. The repeatability of the CI trait is 0.01–0.13 [14,25].
Due to the low h2, environmental factors play a major role in the development of the CI. According to MacGregor and Chasey [26], the calendar date of calving (i.e., month of calving) had a significant effect on the CI. In the studies of Bourdon and Brinks [27], the age at first calving had a significant effect on the CI. Early breeding adversely affected later reproductive characteristics, including the period between calvings [19]. Dunn and Kaltenbach [28] determined that the CI in heifers bred early was almost always longer than the desirable 365 days. The age of the cow [8,14], the fertilization or calving year [18], and the herd [29] have significant effects on the CI.
There is quite a lot of data on the relationship between the CI and the other traits in the literature. The genetic correlation between the age at first calving and the CI was weak [30]. Gutiérrez et al. [31] and Brzáková et al. [4] found strong genetic correlation between the calving difficulty and the CI. In the study of Gutiérrez et al. [7], the genetic correlation between the conformation scoring results and the CI was weak and negative in beef cattle. Nguyen et al. [32] reported a positive relationship between the CI and the somatic cell count.
Some of the existing literature sources report a decrease in the phenotypic and genetic trend of the CI [2,23,33], while others report an increase [8,20,21]. De Rezende et al. [34] found decreasing phenotypic but increasing genetic trends in the Italian Limousin herds.
There is quite a lot of quite diverse and often contradictory information available in the literature on the examination of the CI trait. In addition, the CI is not included in the selection index of the Hungarian Holstein-Friesian; however, it is a very important trait, reflecting the reproduction of dairy cows. Even so, there is very little population genetic information about it. Therefore, the aim of the present study was to determine the h2 value, the breeding value (BV) of sires, and the phenotypic and genetic trend in the CI trait of Holstein-Friesian cows in Hungary.
2. Materials and Methods
From a methodological point of view, our present paper was based on our previous published papers for Holstein-Friesian [35] and for Limousin [36] breeds.
In this manuscript, the methods used to evaluate the data on the CI of the Limousin cows [36] were adapted and further developed for the evaluation of the database of the Holstein-Friesian breed. Therefore, the present manuscript and the previous paper are very similar from a methodological point of view.
In our previous paper [35], we evaluated the CI of the Holstein-Friesian cows, but population genetic parameters, heritability, BV, and trends were not estimated due to the small amount of available data.
All in all, in this manuscript, we applied a method previously used for the CI of beef cattle to a database of dairy cattle. Compared to the results of our previous papers in dairy cattle, the new aspects of this manuscript are the heritability values, BVs, and the phenotypic and genetic trends using large amounts of data.
2.1. The Database
The source of the data for the study was the database of the National Association of Hungarian Holstein Friesian Breeders in Hungary. The data of the six biggest large-scale Holstein-Friesian herds were used.
A total of 17,319 cows born between 2008 and 2018 were included in the evaluation. The studied cows were offspring of 842 sires and 13,236 dams (Table 2).
Table 2.
The structure of the evaluated database for the Holstein-Friesian population.
Calvings took place between 2010 and 2022. During this period, a total of 54,582 calving and 37,263 CI data was processed.
The number of female progenies per sire ranged from 5 to 232, with an average of 20.57 offspring per sire. The average CI data per sire was 44.26.
The Kolgomorov–Smirnov test was used to check the normal distribution in the database. The Levene test was used to check the homogeneity of variances.
2.2. The Calving Interval Trait
CI was calculated as the difference between calving dates from succeeding parities. In the literature, a great variety of data on the extreme values of the CI trait was found (Table 1). In order to get rid of extreme data, filtering was used, and only CI data of 300–650 days were processed in this study. Lower and higher values were set as missing values.
The year of calving and season of calving was considered to be the start date of the CI.
2.3. Examining the Effects of Different Factors
The effect of the different genetic and environmental factors influencing the CI trait was evaluated by GLM (General Linear Model) method (Table 3). Sire was considered as a random effect, while the other examined factors—herd, year of calving, season of calving, and parity of the cow—were considered as fixed effects. The used estimation model was described as follows:
(where ŷhijklm = CI of cow; born from sire “h”, in herd “i”, in calving year “j”, in calving season “k”, and from parity “l”; μ = mean of all observations; Sh = random effect of sire; Fi = fixed effect of herd; Yj = fixed effect of year of calving; Mk = fixed effect of season of calving; Pl = fixed effect of parity of cow; and ehijklm = random error.)
Table 3.
The applied models for the estimations.
The evaluation of the database was performed with the statistical software package SPSS 27.0 [37].
2.4. Estimation of Population Genetic Parameters
To estimate the population genetic parameters, two models—the GLM model [38] and the repeatability BLUP (Best Linear Unbiased Prediction) animal model [39]—were used (Table 3).
The GLM model is presented in Section 2.3. With the GLM method, some population genetic parameters were determined for the CI trait (additive genetic variance, environmental variance, and phenotypic variance). The heritability (h2) was calculated using the following formula:
(where h2 = heritability; σ2a = additive genetic variance; σ2e = residual–environmental variance; and σ2p = phenotypic variance.)
Using the BLUP models, two matrices were created. One of these was the database matrix and the other was the pedigree matrix. In the BLUP animal model, the same fixed effects were taken into account as in the case of the GLM method. The random effect was the individual (cow). The pedigree matrix of relatives included pedigree data for full sibs, half sibs, sires, dams, and grandparents.
Because a cow can have more CI data, the permanent environmental effect of the cow (PE, as random effect) was also included in the model [40]. Similar to the study of Nagy et al. [41], the used basic repeatability model was as follows:
(where “y” is the vector of observations; “b” is the vector of fixed effects; “a” is the vector of random animal effects; “pe” is the random vector of permanent environmental effects; “e” is the vector of random residual effects; and X, Z, and W are the incidence matrices relating records to fixed, animal, and random permanent environmental effects, respectively).
The repeatability value (R) was calculated with the formula as follows [42]:
(where σ2a = additive genetic variance; σ2pe = permanent environmental effect; and σ2e = residual variance.)
For the BLUP animal model, MTDFREML [43] software (https://zzlab.net/MTDFREML/index.html#) was used.
2.5. Estimation of Breeding Values
The BV of the sires was also estimated with the GLM method and the BLUP animal model based on the CI trait.
Using the GLM method, the first step was the progeny difference (EPD) calculation, as the difference between the average performance of the sire’s progeny group and the average performance of the entire population for the CI trait. In the second step, the BV was calculated as twice the EPD. The EPD was calculated as follows:
(where xpg = the mean value of the progeny group of the sire and Xall = the mean value of the contemporary offspring population.)
In the case of the BLUP animal model, the model estimated the BV directly. The reliability value (b) of the estimated BV was calculated using the following formula:
(where b = reliability value of BV; n = number of progenies of sire; h2 = heritability of CI trait; and R = degree of kinship.)
Due to size reasons, BVs are only shown for the 20 sires with the most offspring number.
Based on the estimated BV of the sires in the two different models, two different rankings were established. Similar to some literature sources [44], the effect of the model on the rank of sires was determined by rank correlation calculation [45].
2.6. Calculating Phenotypic Trends
During the calculation of the phenotypic trend for the CI, data of cows born in the same year were averaged, and then the mean values were plotted against the year of birth. For fitting function to the resulting set of points, weighted linear regression analysis was used. The dependent variable, (Y) was the mean of the CI and the independent (X) variable was the birth year of the cow. The values of the constant (a), the slope (b), and the fit (R2) and their statistical reliability were also determined.
2.7. Estimation of Genetic Trends
The genetic trend of the CI trait—likewise Ostler et al. [46]—was determined from the average BV of animals born in the same year. These were determined in three ways (from the GLM BV of sires, from the BLUP BV of sires, and from the BLUP BV of the entire population born in the same year).
The genetic trend of the CI was evaluated using a linear regression method. The BV of sires as well as the BV of the entire population was averaged annually. The annual mean values were the dependent values, and the appropriate year was the independent value in the used regression method.
Similarly to the phenotypic trend calculation, the value of the constant (a), the slope (b), and the fit (R2), as well as their statistical reliability, was determined.
The genetic trends have been estimated for the period between 1997 and 2015 for sires, and between 1997 and 2018 for the entire population.
3. Results and Discussion
3.1. The Effect of the Environmental Factors
The basic statistical parameters of the CI trait are presented in Table 4. The arithmetic mean of the CI of Holstein-Friesian cows was 409.2 days (SD = 73.1 days, CV = 17.9%). This result was similar to most of the data reported in the literature for dairy cattle [6,8,11]. In contrast, in the case of Holstein-Friesian cows, a longer CI was reported in Ansari-Lari et al. [2] and a shorter CI in Atashi et al. [3]. In the case of beef cattle, we found shorter CI data in the literature [7,12,14] than our results. In the report of Lopez et al. [9] and Brzáková et al. [4], the CI of beef cows was shorter than the CI of dairy cows in the present study.
Table 4.
Descriptive statistics of CI trait of Holstein-Friesian cows.
Subtracting the average gestation length (275 days [1]) of Holstein-Friesian cows from the CI revealed that the average days open of cows in this work was quite long, 134 days. Taking into account the length of the cattle’s estrous cycle (21 days), cows—in an average sense—became pregnant at the fifth estrous cycle. The length of days open in our study was 37 days shorter than what Espionosa et al. [24] reported.
The effect of all environmental factors (herd, year of calving, season of calving, and parity of cow) proved to be significant (p < 0.01) on the CI trait (Table 5). The most determining environmental factor was the effect of the season of calving (74.86%). The residual variance was quite small, 0.42%.
Table 5.
The effect of different factors on the CI trait of Holstein-Friesian cows.
The effect of the environmental factors on the CI has been summarized in Table 6. The estimated adjusted overall mean value of the CI by the GLM method proved to be 412.2 ± 2.0 days.
Table 6.
The effect of the environmental factors on the CI trait of Holstein-Friesian cows.
The CI was the shortest in dairy herd number 4 (394.9 ± 2.3 days), which experienced approximately 15 days shorter than that of in the other five herds (413.1–419.5 days). Evaluating the effect of the calving year, the shortest CI (405.2 ± 4.8 days) was observed in 2010 and the longest (421.1 ± 2.2 days) in 2017. The difference between these extremes was 16 days. The effect of herd and calving year was similar to the data found in most literature sources [18,29].
The CI of autumn-calved cows (400.7 ± 2.0 days) was on average 27 days shorter than that of spring-calved counterparts (427.8 ± 2.2 days). During the examination of the effect of the calving season, Kanuya and Greve [17] experienced something similar.
The effect of the parity of dam was smaller than expected and in the opposite direction. The longest time (414–416 days) between two calvings was calculated for cows of prime age (parity of dam 3–7). The shortest CI was observed after the first calving (406.4 ± 0.9 days). This result differed from the data of Nieuwhof et al. [10], Hare et al. [8], and Yagüe et al. [14], who observed an increase in the CI with increasing maternal age.
3.2. Population Genetic Parameters
The h2 value (0.07 ± 0.01 and 0.08 ± 0.01 with two models) of the CI trait proved to be very small (Table 7). The heritability of the CI trait of Holstein-Friesian cows was similar to the data from the relevant literature sources [5,13,21]. In contrast, some literature sources [4,23,24] published slightly higher h2 values for the CI trait.
Table 7.
Population genetic parameters of the CI trait of Holstein-Friesian cows.
There was no difference between the population genetic parameters estimated using the two different models. Similarly to our previous results [36,38], it seems that in special cases (one breed, only cows, etc.) reliable results can also be obtained with simpler models.
Using the BLUP animal model, the value of a permanent environmental effect (σ2pe = 26.33) and the ratio of the permanent environmental variance to the phenotypic variance (c2 = 0.01 ± 0.01) was very low. Therefore, the repeatability value of the CI trait was also estimated to be very small (R = 0.09 ± 0.01). The relevant literature sources [9,25] also reported very low repeatability value for the CI trait.
3.3. The Effect of Sire and the Breeding Values
Using the GLM method, considerable differences were found between the mean values of the CI of the progeny groups of different sires (Table 8). The difference between the shortest (393.6 ± 6.3 days; sire code number 18) and the longest (441.6 ± 4.9 days; sire code number 1) female progeny groups was 48.0 days as an average CI. Since the difference between the progeny groups was quite large, large differences between the BV of the CI of the sires were also found. Accordingly, the difference between the smallest (−37.2 ± 6.3 days) and the largest (+58.7 ± 5.1 days) estimated BV was 95.9 days.
Table 8.
The effect of sire and breeding values on the CI trait of Holstein-Friesian cows.
Using the BLUP animal model, the difference between the two extremes of BV (−22.7 days and +21.8 days) was 44.5 days. Generally, the breeding values estimated with the BLUP animal model were smaller than those estimated with the GLM method. In the case of the BLUP animal model, the difference between the extreme values was smaller than in the case of the GLM method.
In the relevant literature sources, numerically displayed BVs for the CI cannot be found.
Between the ranking of sires (with the GLM method and the BLUP animal model) medium, positive rank correlation (rrank = +0.60; p < 0.01) value was estimated. In the study of Núnez-Dominguez et al. [44], the rank correlation value was higher between the ranks of sires. During our previous studies [36,38], a closer correlation between the ranking of sires—based on the BV estimated with different models—was found.
3.4. Phenotypic and Genetic Trends
The computed phenotypic and genetic trends are presented in Table 9 and Figure 1. The phenotypic trend was based on the birth year of the cows. The genetic trends were based on the birth year of the sires, or the birth year of the entire population.
Table 9.
Phenotypic and genetic trends in the CI trait of Holstein-Friesian cows.
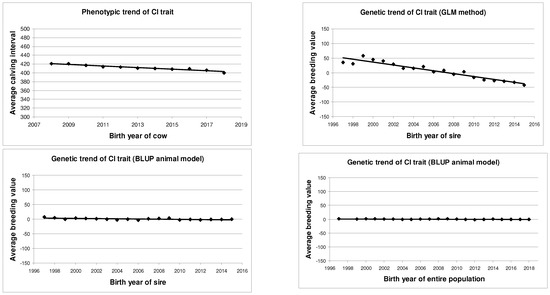
Figure 1.
Phenotypic and genetic trends of CI trait of Holstein-Friesian cows.
Based on the phenotypic trend calculation, the CI of Holstein-Friesian cows decreased by an average of 1.80 days per year (b = −1.80 ± 0.15 days; p < 0.01). The fit of the phenotypic trend (R2 = 0.94; p < 0.01) was very high and significant. This indicates a remarkable decrease in the CI in the studied Holstein-Friesian population.
Based on the birth year of the sires, the genetic trend by the GLM method showed −4.94 days decrease per year (b = −4.94 ± 0.37 days; p < 0.01). The fitting value was high (R2 = 0.91; p < 0.01). By the BLUP animal model, the slope (b = −0.31 ± 0.09 days; p < 0.01) and the fitting (R2 = 0.41; p < 0.01) value were very similar in direction, but smaller than the GLM method.
Based on the estimated BV of the entire population, the genetic trend of the CI was slightly decreasing (b = −0.09 ± 0.03 days; p < 0.01), but it was statistically proven (R2 = 0.33; p < 0.01).
Similarly to some literature data [2,23,33], a small decrease in the genetic trend of the CI was observed. Older sources [8,21] typically reported an increase in the phenotypic and genetic trend of the CI trait.
4. Conclusions
The CI is a very important trait in the breeding of dairy cattle as it is a very good indicator for characterizing the reproductive state of the cow herd. If the CI is extended, it can usually lead to deterioration in the results of reproduction, rearing, and milk production. For this reason, the goal of breeders is to reduce the CI, which they try to achieve with reproductive biological methods as well as breeding methods. The latter can be successful, if information is available on the population genetic parameters of the CI trait, as well as the estimated BV of the bulls in the CI trait.
According to our results, the relatively low proportion of genetic variances indicates that the selection of Holstein-Friesian cattle for reproductive traits (such as CI) may render low magnitudes and long-term responses. Nevertheless, the economic importance of these traits should not be overlooked.
Based on our results, it seems worth considering the possibility of incorporating CI into the selection index.
Our results on genetic trends, according to which the average CI decreased a little during the examined period, suggest that, despite the relatively low genetic determination, it is possible to achieve some improvement in reproductive traits.
Author Contributions
Conceptualization, S.B. and F.S.; methodology, S.B. and J.P.P.; software, S.B.; validation, Z.J.K. and L.B.; formal analysis, S.B.; investigation, S.B.; resources, F.S. and S.B.; data curation, Z.J.K., L.B. and J.P.P.; writing—original draft preparation, S.B. and F.S.; writing—review and editing, S.B. and F.S.; visualization, S.B.; supervision, Z.J.K. and L.B.; project administration, S.B.; funding acquisition, J.P.P. All authors have read and agreed to the published version of the manuscript.
Funding
This research received no external funding.
Institutional Review Board Statement
Not applicable.
Informed Consent Statement
Not applicable.
Data Availability Statement
The data presented in this study are available on request from the National Association of Hungarian Holstein Friesian Breeders.
Acknowledgments
The authors would also like to express their gratitude to the National Association of Hungarian Holstein Friesian Breeders and the association’s staff for making the starting databases available.
Conflicts of Interest
The authors declare no conflicts of interest.
References
- Probo, M.; Guadagnini, M.; Sala, G.; Amodeo, P.; Bolli, A. Calving ease risk factors and subsequent survival, fertility and milk production in Italian Holstein cows. Animals 2022, 12, 671. [Google Scholar] [CrossRef]
- Ansari-Lari, M.; Rezagholi, M.; Reiszadeh, M. Trends in calving ages and calving intervals for Iranian Holsteins in Fars province, southern Iran. Trop. Anim. Health Prod. 2009, 41, 1283–1288. [Google Scholar] [CrossRef] [PubMed]
- Atashi, H.; Salavati, M.; De Koster, J.; Crowe, M.A.; Opsomer, G.; Hostens, M. The GplusE Consortium A genome-wide association study for calving interval in Holstein dairy cows using weighted single-step genomic BLUP approach. Animals 2020, 10, 500. [Google Scholar] [CrossRef]
- Brzáková, M.; Cítek, J.; Svitáková, A.; Veselá, Z.; Vostrý, L. Genetic parameters for age at first calving and first calving interval of beef cattle. Animals 2020, 10, 2122. [Google Scholar] [CrossRef]
- Cesarani, A.; Gaspa, G.; Masuda, Y.; Degano, L.; Vicario, D.; Lourenco, D.A.L.; Macciotta, N.P.P. Variance components using genomic information for 2 functional traits in Italian Simmental cattle: Calving interval and lactation persistency. J. Dairy Sci. 2020, 103, 5227–5233. [Google Scholar] [CrossRef]
- Fiedlerová, M.; Řehák, D.; Vacek, M.; Volek, J.; Fiedler, J.; Šimeček, P.; Mašata, O.; Jílek, F. Analysis of non-genetic factors affecting calving difficulty in the Czech Holstein population. Czech J. Anim. Sci. 2008, 53, 284–291. [Google Scholar] [CrossRef]
- Gutiérrez, J.P.; Alvarez, I.; Fernández, I.; Royo, L.J.; Díaz, J.; Goyache, F. Genetic relationships between calving date, calving interval, age at first calving and type traits in beef cattle. Livest. Prod. Sci. 2002, 78, 215–222. [Google Scholar] [CrossRef]
- Hare, E.; Norman, H.D.; Wright, J.R. Trends in calving ages and calving intervals for dairy cattle breeds in the United States. J. Dairy Sci. 2006, 89, 365–370. [Google Scholar] [CrossRef]
- Lopez, B.I.; Son, J.H.; Seo, K.; Lim, D. Estimation of genetic parameters for reproductive traits in Hanwoo (Korean cattle). Animals 2019, 9, 715. [Google Scholar] [CrossRef]
- Nieuwhof, G.J.; Powell, R.L.; Norman, H.D. Ages at calving and calving interval for dairy cattle in the United States. J. Dairy Sci. 1989, 72, 685–692. [Google Scholar] [CrossRef]
- Schambow, R.A.; Bennett, T.B.; Döpfer, D.; Martins, J.P.N. A retrospective study investigating the association of parity, breed, calving month and year, and previous parity milk yield and calving interval with twin births in US dairy cows. J. Dairy Sci. 2021, 104, 5047–5055. [Google Scholar] [CrossRef]
- Shin, S.G.; Lee, J.J.; Do, C.H. Genetic relationship of age at first calving with conformation traits and calving interval in Hanwoo cows. J. Anim. Sci. Technol. 2021, 63, 740–750. [Google Scholar] [CrossRef]
- Short, T.H.; Blake, R.W.; Quaas, R.L.; Van Vleck, L.D. Heterogeneous within-herd variance. 2. Genetic relationships between milk yield and calving interval in grade Holstein cows. J. Dairy Sci. 1990, 73, 3321–3329. [Google Scholar] [CrossRef]
- Yagüe, G.; Goyache, F.; Becerra, J.; Moreno, C.; Sánchez, L.; Altarriba, J. Bayesian estimates of genetic parameters for pre-conception traits, gestation length and calving interval in beef cattle. Anim. Reprod. Sci. 2009, 114, 72–80. [Google Scholar] [CrossRef]
- Wang, Y.; Ipema, A.; Goselink, R.; Burgers, E.; Gross, J.; Bruckmaier, R.; Kemp, B.; Van Knegsel, A. Effects of calving interval of dairy cows on development, metabolism and milk performance of their offspring. J. Dairy Sci. 2024; in press. [Google Scholar] [CrossRef]
- Slama, H.; Wells, M.E.; Adams, G.D.; Morrison, R.D. Factors affecting calving interval in dairy herds. J. Dairy Sci. 1976, 59, 1334–1339. [Google Scholar] [CrossRef]
- Kanuya, N.; Greve, T. Effect of parity, season and FSH treatment on the calving interval of Ayrshire cows in the tropics. Trop. Anim. Health Prod. 2000, 32, 197–204. [Google Scholar] [CrossRef]
- Silveira, J.C.; McManus, C.; Mascioli, A.; Silva, L.O.C.; da Silveira, A.C.; Garcia, J.A.S.; Louvandini, H. Study of genetic and environmental factors on production and reproduction traits in a Nellore herd in Mato Grosso do Sul State. Bras. J. Anim. Sci. 2004, 33, 1432–1444. (In Portugal) [Google Scholar] [CrossRef][Green Version]
- Meacham, N.S.; Notter, D.R. Heritability estimates for calving date in Simmental cattle. J. Anim. Sci. 1987, 64, 701–705. [Google Scholar] [CrossRef]
- Bernardes, P.A.; Grossi, D.A.; Savegnago, R.P.; Buzanskas, M.E.; Urbinati, I.; Bezerra, L.A.F.; Lôbo, R.B.; Munari, D.P. Estimates of genetic parameters and genetic trends for reproductive traits and weaning weight in Tabapuã cattle. J. Anim. Sci. 2015, 93, 5175–5185. [Google Scholar] [CrossRef] [PubMed]
- Olori, V.E.; Meuwissen, T.H.E.; Veerkamp, R.F. Calving interval and survival breeding values as measure of cow fertility in a pasture-based production system with seasonal calving. J. Dairy Sci. 2002, 85, 689–696. [Google Scholar] [CrossRef]
- Gressler, M.G.M.; Pereira, J.C.C.; Bergmann, J.A.G.; Andrade, V.J.; Paulino, M.F.; Gressler, S.L. Genetic aspects of weaning weight and some reproductive traits in Nellore cattle. Bras. J. Vet. Anim. Sci. 2005, 57, 533–538. (In Portugal) [Google Scholar] [CrossRef]
- Vergara, O.D.; Elzo, M.A.; Cerón-Munoz, M.F. Genetic parameters and genetic trends for age at first calving and calving interval in an Angus-Blanco Orejinegro-Zebu multibreed cattle population in Colombia. Livest. Sci. 2009, 126, 318–322. [Google Scholar] [CrossRef]
- Espinosa, J.L.; González Peña, D.; Palacios Espinoza, A.; Ortega, R.; Guillén, A. Genetic parameters of days open in Charolais cattle of Cuba. Rev. Colomb. Cienc. Pecu. 2016, 29, 16–24. (In Spain) [Google Scholar] [CrossRef]
- Berry, D.P.; Evans, R.D. Genetics of reproductive performance in seasonal calving beef cows and its association with performance traits. J. Anim. Sci. 2014, 92, 1412–1422. [Google Scholar] [CrossRef]
- MacGregor, R.G.; Casey, N.H. Evaluation of calving interval and calving date as measures of reproductive performance in a beef herd. Livest. Prod. Sci. 1999, 57, 181–191. [Google Scholar] [CrossRef]
- Bourdon, R.M.; Brinks, J.S. Calving date versus calving interval as a reproductive measure in beef cattle. J. Anim. Sci. 1983, 57, 1412–1417. [Google Scholar] [CrossRef] [PubMed]
- Dunn, T.G.; Kaltenbach, C.C. Nutrition and the postpartum interval of the ewe, sow and cow. J. Anim. Sci. 1980, 51 (Suppl. 2), 29–39. [Google Scholar] [CrossRef]
- Grossi, D.D.A.; Berton, M.P.; Buzanskas, M.E.; Chud, T.C.S.; Grupioni, N.V.; Pero de Paz, C.C.; Lobo, R.B.; Munari, D.P. Genetic analysis on accumulated productivity and calving intervals in Nelore cattle. Trop. Anim. Health Prod. 2016, 48, 207–210. [Google Scholar] [CrossRef] [PubMed]
- López-Paredes, J.; Pérez-Cabal, M.A.; Jiménez-Montero, J.A.; Alenda, R. Influence of age at first calving in a continuous calving season on productive, functional, and economic performance in a Blonde d’Aquitaine beef population. J. Anim. Sci. 2008, 96, 4015–4027. [Google Scholar] [CrossRef]
- Gutiérrez, J.P.; Goyache, F.; Fernández, I.; Alvarez, I.; Royo, L.J. Genetic relationships among calving ease, calving interval, birth weight, and weaning weight in the Asturiana de los Valles beef cattle breed. J. Anim. Sci. 2007, 85, 69–75. [Google Scholar] [CrossRef]
- Nguyen, T.C.; Nakao, T.; Gautam, G.; Su, L.T.; Ranasinghe, R.M.S.B.K.; Yusuf, M. Relationship between milk somatic cell count and postpartum ovarian cyclicity and fertility in dairy cows. Acta Vet. Hung. 2011, 59, 349–362. [Google Scholar] [CrossRef]
- Magnabosco, C.U.; Lopes, F.B.; Rosa, G.J.M.; Sainz, R.D. Bayesian estimates of genetic parameters for reproductive traits in Nellore cows raised on pasture in tropical regions. Rev. Colomb. Cienc. Pecu. 2016, 29, 119–129. [Google Scholar] [CrossRef]
- De Rezende, M.P.G.; Malhado, C.H.M.; Biffani, S.; Souza Carneiro, P.L.; Bozzi, R. Genetic diversity derived from pedigree information and estimation of genetic parameters for reproductive traits of Limousine and Charolais cattle raised in Italy. Ital. J. Anim. Sci. 2020, 19, 762–771. [Google Scholar] [CrossRef]
- Bene, S.; Polgár, J.P.; Szabó, F. Effect of milk production and somatic cell count of milk on calving interval of Holstein-Friesian cows. Hung. Vet. J. 2013, 135, 725–736. (In Hungarian) [Google Scholar]
- Bene, S.; Polgár, J.P.; Szűcs, M.; Márton, J.; Szabó, E.; Szabó, F. Population genetic features of calving interval of the Limousin beef cattle breed in Hungary. Acta Vet. Hung. 2022, 70, 113–120. [Google Scholar] [CrossRef]
- IBM SPSS Statistics for Windows, Version 27.0; IBM Corporation: Armonk, NY, USA, 2020. Available online: https://www.ibm.com/support/pages/how-cite-ibm-spss-statistics-or-earlier-versions-spss (accessed on 1 July 2024).
- Bene, S.; Szabó, F.; Polgár, J.P.; Juhász, J.; Nagy, P. Genetic parameters of birth weight trait in dromedary camels (Camelus dromedarius). Trop. Anim. Health Prod. 2020, 52, 2333–2340. [Google Scholar] [CrossRef]
- Henderson, C.R. Best linear unbiased estimation and prediction under a selection model. Biometrics 1975, 31, 423–447. [Google Scholar] [CrossRef]
- Rudiné Mezei, A.; Posta, J.; Mihók, S. Comparison of different measurement variables based on Hungarian show jumping results. Ann. Anim. Sci. 2015, 15, 177–183. [Google Scholar] [CrossRef]
- Nagy, I.; Radnai, I.; Nagyné Kiszlinger, H.; Farkas, J.; Szendrő, Z. Genetic parameters and genetic trends of reproduction traits in synthetic Pannon rabbits using repeatability and multi-trait animal models. Arch. Anim. Breed. 2011, 54, 297–307. [Google Scholar] [CrossRef][Green Version]
- Rastogi, R.K.; Lukefahr, S.D.; Lauckner, F.B. Maternal heritability and repeatability for litter traits in rabbits in a humid tropical environment. Livest. Prod. Sci. 2000, 67, 123–128. [Google Scholar] [CrossRef]
- Boldman, K.G.; Kriese, L.A.; Van Vleck, L.D.; Kachman, S.D. A manual for use of MTDFREML. In A Set of Programs to Obtain Estimates of Variances and Covariances; USDA-ARS: Clay Center, NE, USA, 1993. [Google Scholar]
- Núnez-Dominguez, R.; Van Vleck, L.D.; Cundiff, L.V. Prediction of genetic values of sires for growth traits of crossbred cattle using a multivariate animal model with heterogeneous variances. J. Anim. Sci. 1995, 73, 2940–2950. [Google Scholar] [CrossRef] [PubMed]
- Spearman, C. The proof of measurement of association between two things. Am. J. Psycho. 1904, 15, 72–101. [Google Scholar] [CrossRef]
- Ostler, S.; Fries, R.; Emmerling, R.; Götz, K.U.; Aumann, J.; Thaller, G. Investigation of determinants for the genetic progress in the Bavarian Fleckvieh. Züchtungskunde 2005, 77, 341–357. (In German) [Google Scholar]
Disclaimer/Publisher’s Note: The statements, opinions and data contained in all publications are solely those of the individual author(s) and contributor(s) and not of MDPI and/or the editor(s). MDPI and/or the editor(s) disclaim responsibility for any injury to people or property resulting from any ideas, methods, instructions or products referred to in the content. |
© 2024 by the authors. Licensee MDPI, Basel, Switzerland. This article is an open access article distributed under the terms and conditions of the Creative Commons Attribution (CC BY) license (https://creativecommons.org/licenses/by/4.0/).