Simple Summary
The giant freshwater prawn (GFP; Macrobrachium rosenbergii) is a tropical aquatic animal with high economic value. However, we found that GFP in the same environment will vary in individuals, growth differences will affect the development of the industry. There are three types of body size in male GFP, namely, large, medium and small, which lead to differences in their phenotypes. Since the gut is responsible for nutrient digestion and the hemolymph is responsible for immunity, we believe that there is a close relationship between the gut, hemolymph, and phenotype. Therefore, we used different research methods to understand the causes of their body size differences. This study can provide a certain reference value for the GFP aquaculture industry and help to improve the development of GFP aquaculture industry.
Abstract
The giant freshwater prawn (GFP; Macrobrachium rosenbergii), a tropical species cultured worldwide, has high market demand and economic value. Male GFP growth varies considerably; however, the mechanisms underlying these growth differences remain unclear. In this study, we collected gut and hemolymphatic samples of large (ML), medium (MM), and small (MS) male GFPs and used the 16S rRNA sequencing and liquid chromatography–mass spectrometry-based metabolomic methods to explore gut microbiota and metabolites associated with GFP growth. The dominant bacteria were Firmicutes and Proteobacteria; higher growth rates correlated with a higher Firmicutes/Bacteroides ratio. Serum metabolite levels significantly differed between the ML and MS groups. We also combined transcriptomics with integrative multiomic techniques to further elucidate systematic molecular mechanisms in the GFPs. The results revealed that Faecalibacterium and Roseburia may improve gut health in GFP through butyrate release, affecting physiological homeostasis and leading to metabolic variations related to GFP growth differences. Notably, our results provide novel, fundamental insights into the molecular networks connecting various genes, metabolites, microbes, and phenotypes in GFPs, facilitating the elucidation of differential growth mechanisms in GFPs.
1. Introduction
The giant freshwater prawn (GFP; Macrobrachium rosenbergii) is of great economic value due to several characteristics, such as tender meat, a rapid reproduction cycle, and fast growth [1,2,3]. Currently, GFPs are widely farmed worldwide, including in China, India, Thailand, and Vietnam [4]. GFPs demonstrate significant sexual size dimorphism, with males growing faster and larger than females under identical conditions. This study addresses the gap in understanding the underlying biological mechanisms of this differential growth, which is crucial for optimizing GFP farming practices. In particular, under identical breeding conditions, the average body mass of male GFPs is approximately twice that of female GFPs [5]. Furthermore, male GFP populations demonstrate large individual differences in body size, and body size plays a crucial role in the growth competition process [6]. The larger an individual, the more opportunities they have to obtain food resources. Moreover, older individuals considerably inhibit the growth of subordinate individuals. At present, differential growth patterns in male GFPs, termed “heterogeneous individual growth”, is a major bottleneck reducing the profitability of GFP farming; however, research on biological mechanisms underlying these patterns has been insufficient.
Many recent studies have demonstrated the significance of gut microbiota in the growth, development, and reproduction of animals; it regulates the digestion and absorption of intestinal nutrients and improves intestinal physiological functions [7]. In aquatic animals, gut bacterial composition is closely associated with their growth rate. Faster-growing individuals may have higher levels of intestinal probiotics [8,9,10,11]. Aquatic animals’ gut microbiota typically comprises aerobic bacteria, facultative anaerobic bacteria, and obligate anaerobic bacteria. These gut bacteria are present within the walls, mucosa, and contents of the intestines; moreover, the composition and structure of gut microflora largely depend on the host genetics, feeding habits, food sources, and living environment of aquatic animals [12,13,14]. Several studies have confirmed that during shrimp development, the symbiotic dynamic balance of intestinal microbiota depends on the development characteristics of the host such that the gut bacterial composition and the host facilitate each other’s growth [15,16,17]. In fast-growing Penaeus monodon, gut microflora exhibits high abundance of Gram-positive bacteria (mostly Firmicutes); in contrast, the intestinal bacterial structure of slow-growing P. monodon tends to be more complex and competitive [18]. In P. vannamei, gut microbial structure is significantly correlated with the growth and development; furthermore, gut microflora demonstrates structural changes during the breeding of high-yield P. vannamei [19]. As such, assessing interactions between GFP and its gut microflora structure is essential for promoting health and improving production performance in GFPs.
Metabolomics enables the comprehensive assessment of endogenous metabolites, along with systematic identification and quantification of metabolites [20,21]. Metabolomics has been widely used to study the complex metabolic mechanisms underlying endogenous or exogenous factors in aquatic animals [22,23,24]. As an energy storage substance similar to hemoglobin, hemolymph regulates osmotic pressure in shrimp [25]. Therefore, the hemolymphatic metabolism index is a crucial indicator of the metabolic level, nutritional status, and disease resistance of male GFPs; as such, it can be used as an indicator of GFPs’ health status [26,27,28]. Evaluating plasma metabolite levels in male GFPs with different specifications may deepen the current understanding of a shrimp’s individual heterogeneous growth.
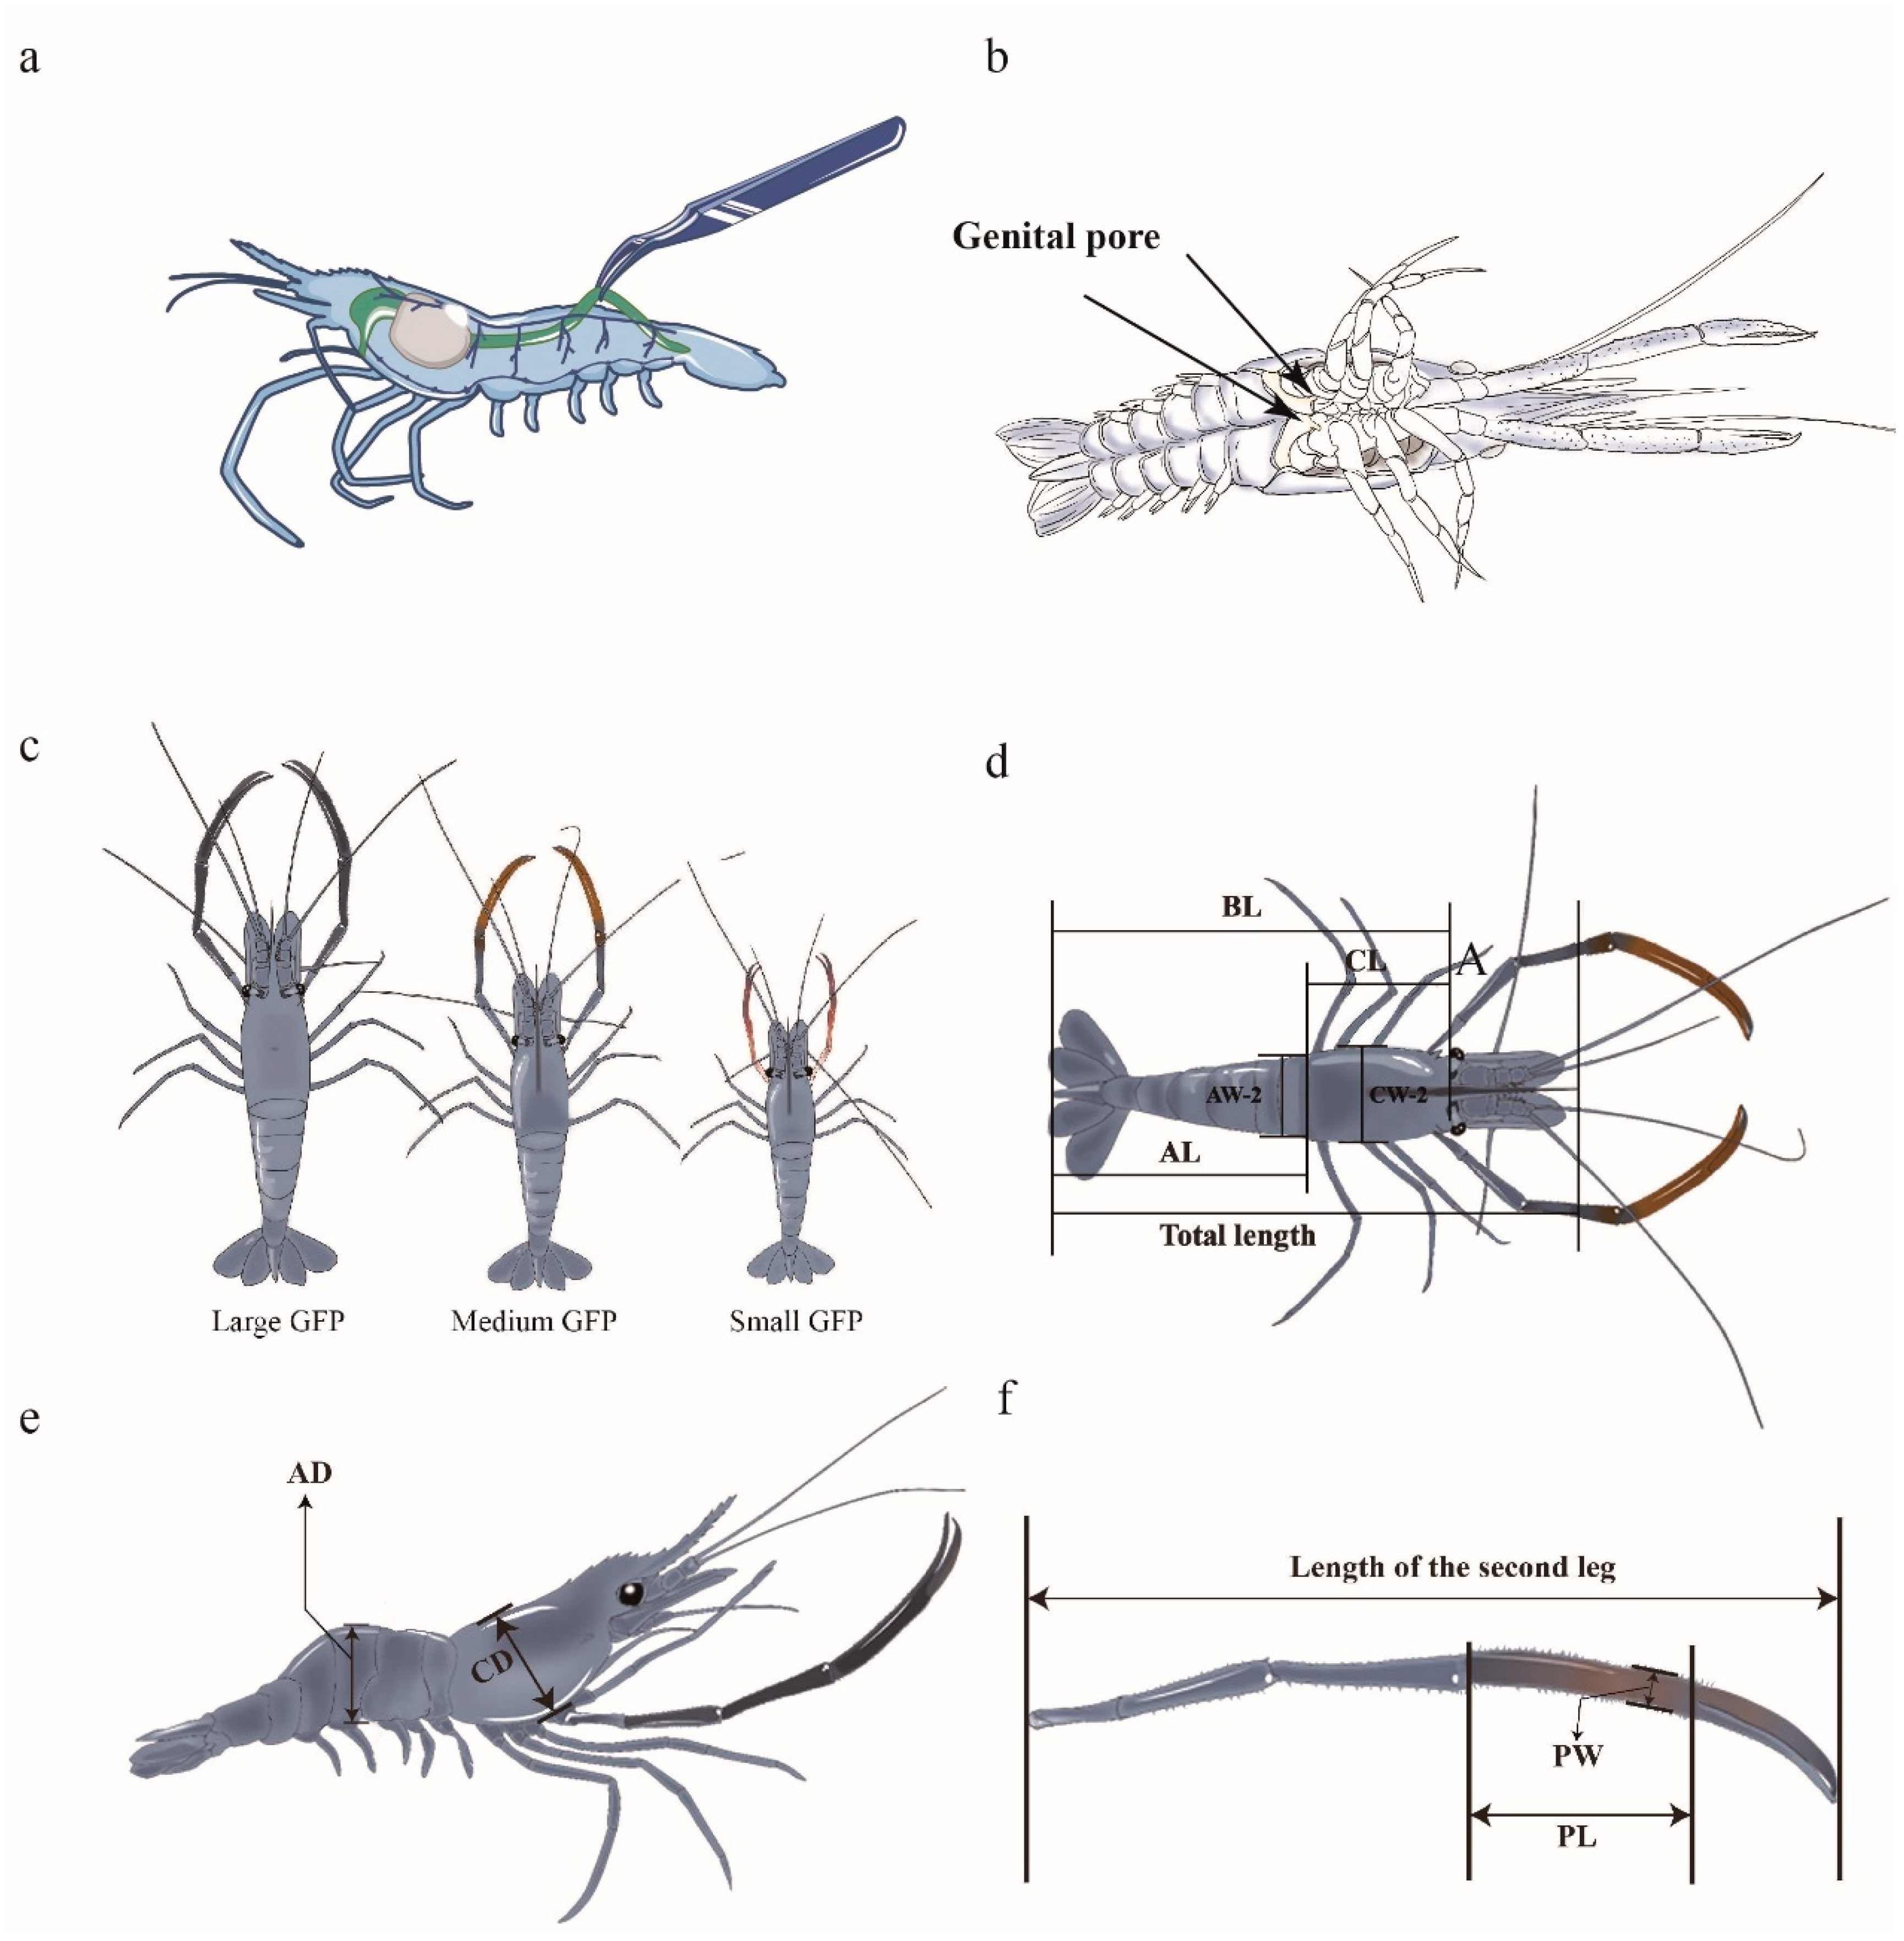
GFPs have long, thin, and simple intestines (Figure 1a), and their intestinal metabolism is extremely active and fast. Gut microbiota is essential for GFP growth and development [29]. However, the mechanisms underlying the roles of the gut microbiome on individual growth differences in male GFPs have not been fully characterized. Therefore, to clarify the relationship between gut microflora and individual heterogeneity among male GFPs of different sizes, we used 16S rRNA gene sequencing and metabolomic techniques to analyze gut microbial compositions and functions and further characterize their metabolomic profiles. Finally, we combined prestored transcriptomic analysis data to construct the interaction network modes among host genes, phenotypic traits, metabolites, and gut bacteria, improving the current understanding of the mechanisms underlying growth differences in GFPs.
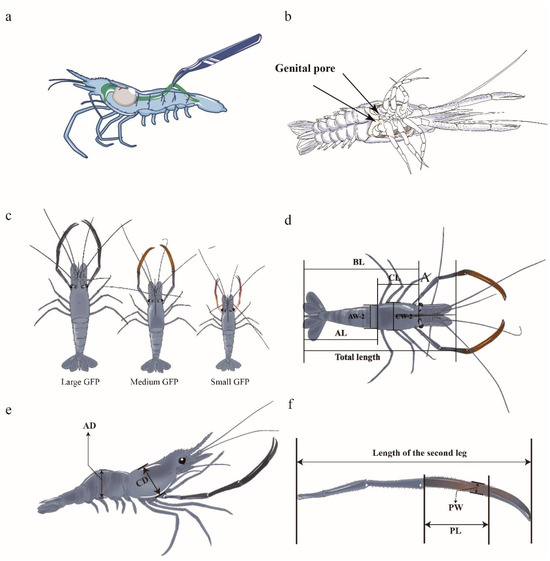
Figure 1.
Phenotypic traits of GFPs used in this study. (a) Location of GFP gut. (b) Male genital pore (two arrows). (c) Male GFPs of different sizes. (d) Dorsal view of a GFP (BL: body length, CL: carapace length, AL: abdominal length, AW-2: abdominal width, CW-2: carapace width). (e) Lateral view of a GFP (AD: abdominal depth, CD: carapace depth). (f) Second leg of a GFP (PL: palm length; PW: palm width).
2. Materials and Methods
2.1. Sample Collection
GFP individuals with identical genetic backgrounds were obtained from Jiangsu Shufeng Prawn Breeding (Gaoyou City, China). The GFP selected in this study were full-sib offspring, from the same male parent and female parent. All of the individuals were cultured under the same conditions and fed the same diet. Male individuals were selected to measure their BWs; here, the males were identified based on the presence of a genital pore (Figure 1b). On the basis of significant individual growth variations, male GFPs with the largest, medium, and smallest six weights were classified into ML, MM, and MS groups, respectively (Figure 1c). In the ML, MM, and MS groups, the average BWs were 64.2 ± 1.48, 40.8 ± 0.90, and 20.3 ± 0.70 g, respectively. The guts were excised, frozen in liquid nitrogen, and transferred to a −80 °C refrigerator before 16S rRNA sequencing. Hemolymph was collected and centrifuged at 6000× g at 4 °C for 15 min. The upper plasma layer was collected and frozen at −80 °C for metabolomic analysis. The gonad tissue was collected and stored at −80 °C for transcriptomic analysis.
All GFP males were cultured under identical conditions, and one individual each from the LM, MM, and MS groups was selected for the measurement of the following 13 phenotypic traits (Figure 1d–f): TW, BL, CL, CW1, CW2, CD, PL, PW, AL, AW1, AW2, abdominal depth, and second leg weight.
2.2. Bacterial Genomic DNA Extraction and Sequencing
Six male GFPs of different sizes were selected randomly, and their total gut bacterial DNA was extracted using an E.Z.N.A. Soil DNA kit. DNA quality was detected through 10 g/L agarose gel electrophoresis, and DNA concentration and purity were determined on a NanoDrop 2000. The V3–V4 variable region of 16S rRNA was amplified using the primers 341F (5′-CCTACGGGNGGCWGCAG-3′) and 805R (5′-GACTACHVGGGTATCTAATCC-3′) through the polymerase chain reaction with an upstream primer (5′-ACTCCTACGGGAGGCAGCA-3′) and downstream primer (5′-GGACTACHVGGGTWTCTAAT-3′). The amplified products were subjected to paired-end sequencing (250 bp) on the Illumina NovaSeq 6000 platform at Shanghai Paisenuo Biotechnology (Shanghai, China).
2.3. Metabolite Extraction
All plasma samples were thawed at 4 °C and swirled for 1 min for even mixing. Next, an appropriate amount of plasma was transferred into a 2 mL centrifuge tube, followed by the addition of 400 μL of methanol (stored at −20 °C) and vortex mixing for 1 min. This mixture was then centrifuged at 12,000× g at 4 °C for 10 min, and the supernatant was transferred to a 2 mL tube. A 4 ppm 2-chloro-L-phenylalanine solution prepared with 80% methanol and water (stored at 4 °C) was added. The supernatant was then filtered using a 0.22 μm filter. Finally, the filtrate was collected for liquid chromatography–tandem mass spectrometry (LC-MS/MS)-based detection.
2.4. LC-MS/MS Analysis
LC-MS/MS analysis was performed on the ultrahigh-performance liquid phase system Thermo Vanquish (Thermo Fisher Scientific, Waltham, MA, USA), equipped with an ACQUITY UPLC HSST3 column (2.1 × 150 mm, 1.8 μm; Waters, Milford, MA, USA), Thermo Orbitrap Exploris 120 mass spectrometry detector (Thermo Fisher Scientific, USA), electrospray ion source (ESI), as well as positive and negative ion modes. The Proteowizard (version 3.0. 8789) package tool MSConvert was used to convert the original mass spectrometry file into the mzXML format. The software package XCMS (V3.12.0) was used for peak detection, peak filtering, and peak alignment, and a quantitative list of substances was obtained. The substances were identified using the Human Metabolome Database, Metlin, MassBank, Lipid Maps, mzCloud, and KEGG databases, as well as a self-built database; the parameters were set at a ppm of <30. We used the lose signal correction method based on quality control samples to perform data correction and eliminate systematic errors. Materials with a relative standard deviation of >30% in quality control samples were filtered out.
We performed principal component analysis, PLS-DA, and orthogonal PLS-DA (OPLS-DA) to reduce the dimensions of the sample data using the R software (V4.0.3) package. The values of variable importance in the projection were obtained using OPLS-DA. A heatmap was plotted using the R package pheatmap, and the metabolites were clustered bidirectionally. Next, pathway analysis was performed using MetaboAnalyst, a web-based tool for the visualization of metabolomic data. All enriched pathways were scanned for differential metabolites and pathway maps using the visualization tool KEGG Mapper.
2.5. Correlation Analysis
We assessed Pearson correlations among phenotypic traits, gut microflora, and plasma metabolites and transcripts. The data were visualized using a thermograph in the R package gplot. p < 0.05 was considered to indicate statistical significance. Finally, in network analysis, we used the estimateNetwork function to fit the network model.
3. Results
3.1. Gut Microbial Community Composition
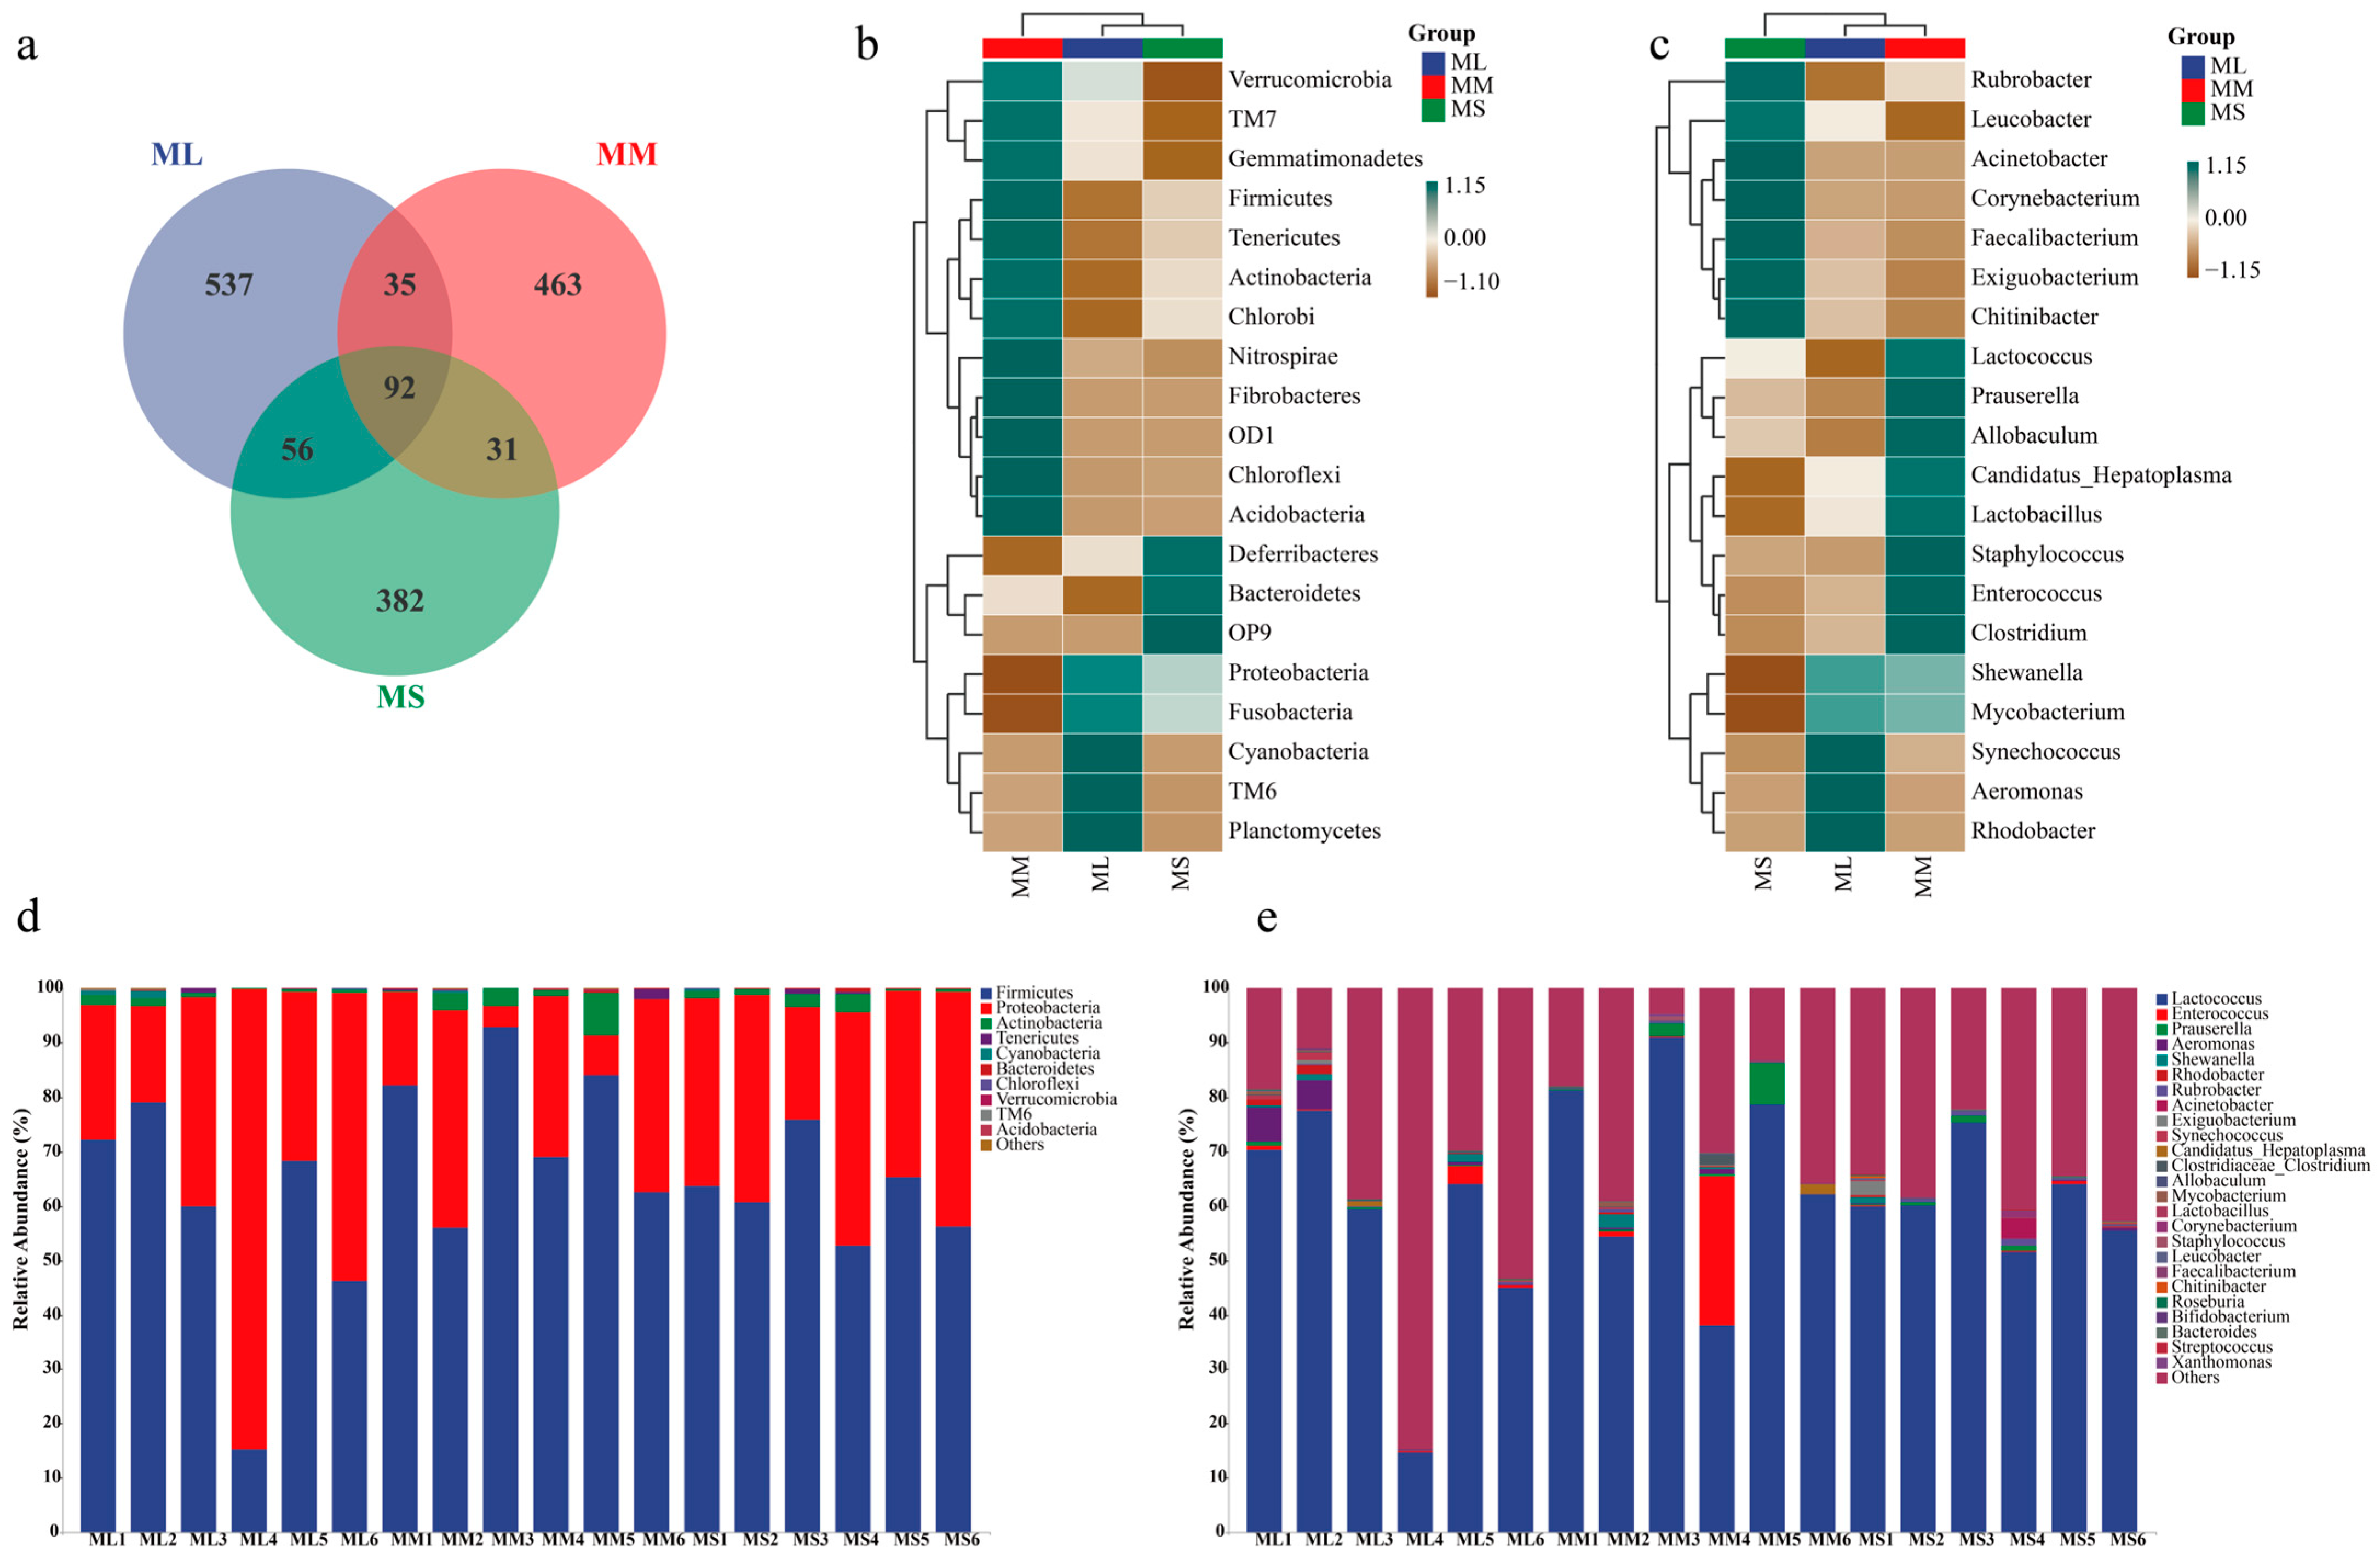
A Venn diagram for the ML, MM, and MS groups (at the OTU level) is illustrated in Figure 2a. There were 720, 621, and 533 OTUs present in the ML, MM, and MS group, respectively. A total of 92 OTUs (41%) were shared by all groups. To compare gut microflora compositions among groups, we selected the top 20 most abundant phylum and genus to plot a heatmap (Figure 2b). At the phylum level, the abundance of Proteobacteria, Fusobacteria, and TM6 was the highest in the ML group; that of TM7, Gemmatimonadetes, Firmicutes, Tenericutes, Actinobacteria, Chlorobi, Nitrospirae, Fibrobacteres, OD1, and Chloroflexi was the highest in the MM group; and that of Deferribacteres, Bacteroidetes, and OP9 was the highest in the MS group. At the genus level, Synechococcus, Aeromonas, and Rhodobacter abundance was the highest in the ML group; as such, these gut bacteria may play a major role in GFP growth (Figure 2c).
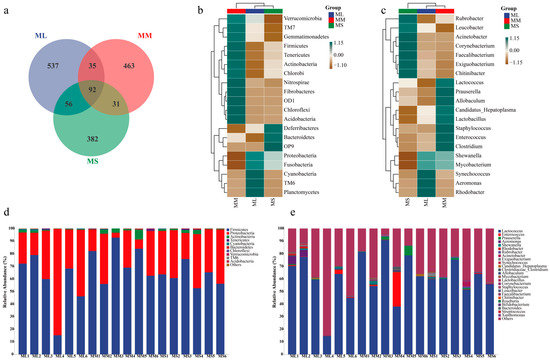
Figure 2.
Relative abundance of gut microflora in male GFPs with different growth rates. (a) Venn diagram. (b) Abundance of gut microflora at phylum. (c) Abundance of gut microflora at genus levels. (d) Heatmap of the most abundant bacteria at phylum level. (e) Heatmap of the most abundant bacteria genera.
In the large (ML), medium (MM), and small (MS) male GFP groups, the dominant bacterial phyla were Firmicutes (average abundance = 56.82%, 74.46%, and 62.42%, respectively) and Proteobacteria (average abundance = 41.52%, 22.14%, and 35.52%, respectively). The MM group demonstrated the highest and lowest abundance of Sclerenchyma and Proteobacteria, respectively. Actinobacteria abundance was higher in the MM group (2.58%) than in the ML (0.83%) and MS (1.50%) groups (Figure 2e). At the genus level, Lactococcus demonstrated the highest average abundance (Figure 2e), accounting for 55.16%, 67.58%, and 61.09% of all microorganisms in the ML, MM, and MS groups, respectively. In the MM group, the average abundance of Lactococcus (67.58%), Enterococcus (4.75%), and Prauserella (1.79%) was significantly higher than that in the other two groups. The Firmicutes/Bacteroides ratios in ML, MM, and MS groups were 0.56816/0.00058, 0.74463/0.0011, and 0.62424/0.00188 respectively, showing that ML (979.59) > MM (676.94) > MS (332.04). In general, the differences in intestinal microbiota structure were significant between male GFPs with different growth rates.
3.2. Identification and Analysis of Plasma Metabolites in Male GFP with Different Growth Rates
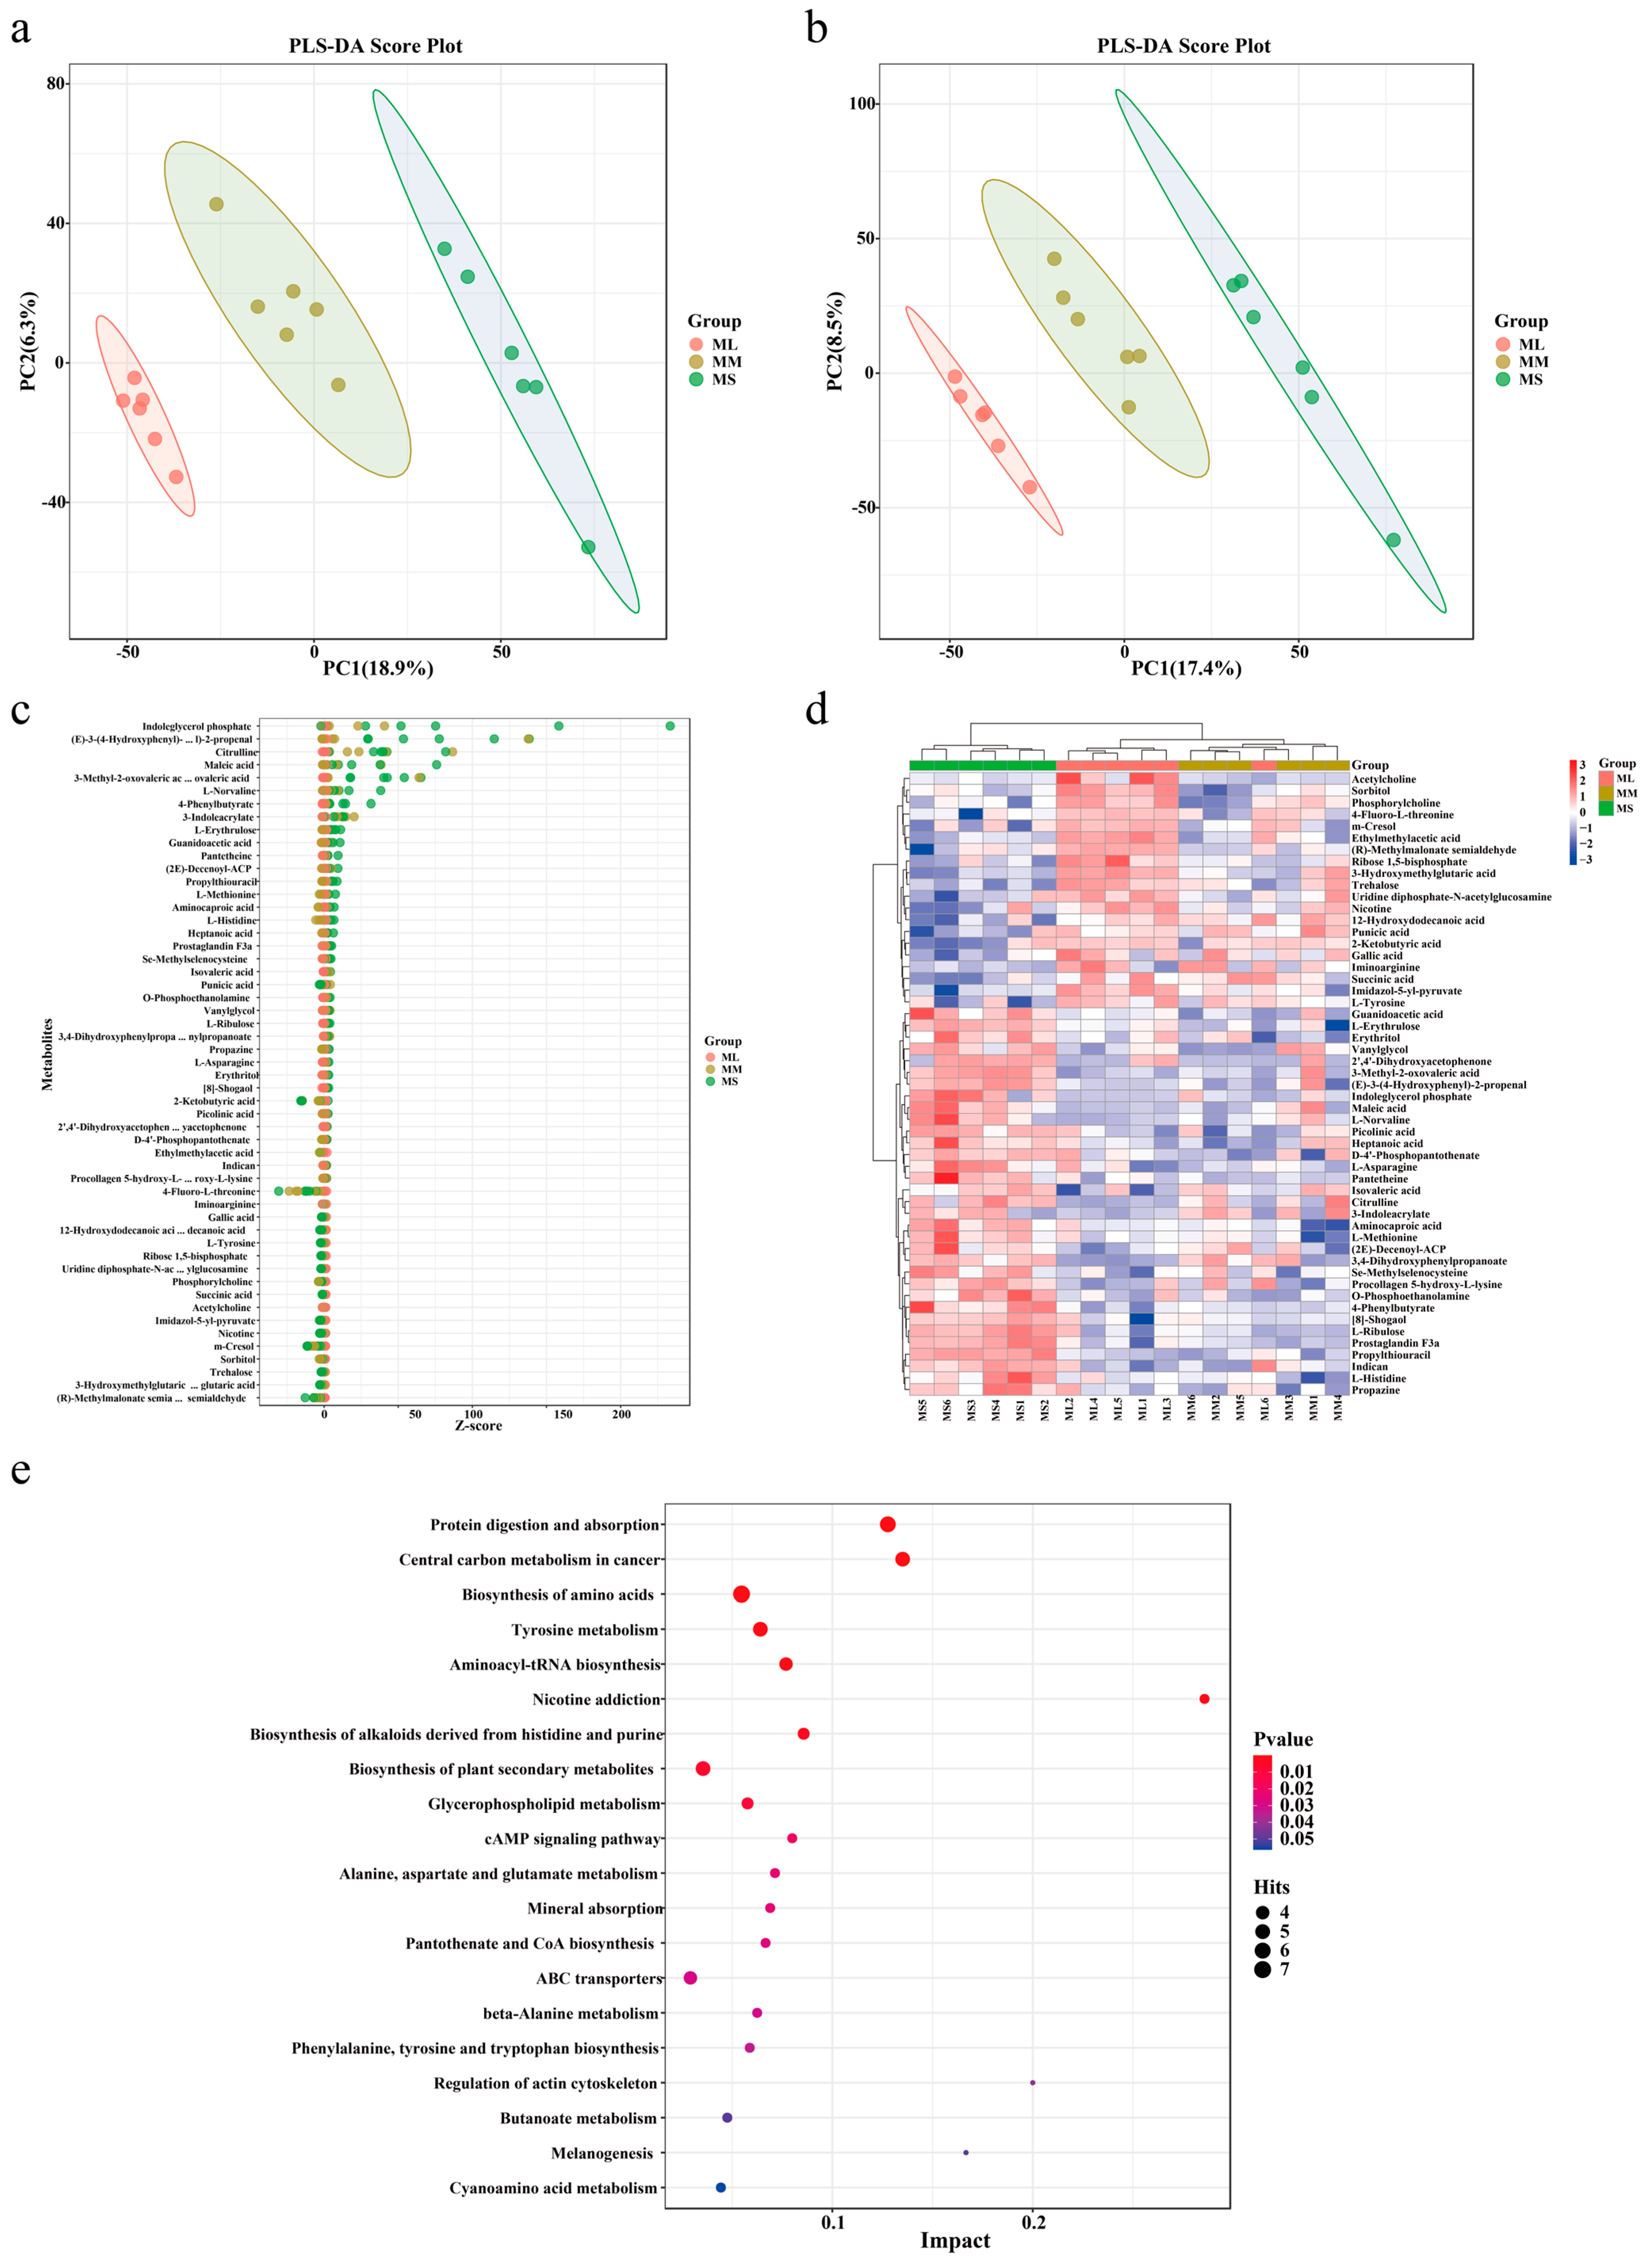
Partial least squares (PLS) regression was used to establish a relationship model between metabolite and sample categories for modeling prediction of sample category. To assess the model’s quality, we performed 200 response permutation tests on the PLS discriminant analysis (DA) model. As shown in Figure 3a,b, all three groups were clearly divided into three parts, confirming that the prediction model was reliable, and the repeatability for each sample in the same group differed significantly among the three groups.
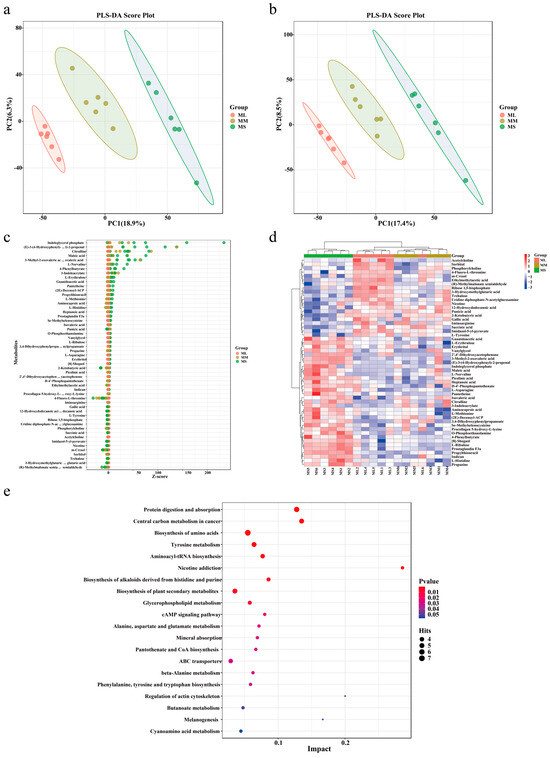
Figure 3.
Identification and analysis of different metabolites and pathway enrichment of male GFPs with different growth rates. Score plots of our PLS-DA model for plasma metabolites in the (a) positive and (b) negative ion modes. Identification of different metabolites based on a Bubble map (c) and a Heatmap (d). (e) Pathway enrichment analysis of differential metabolites.
To screen the key metabolites possibly mediating GFP growth performance, we used the top 20 abundant metabolites in each group to classify the functions of the metabolites. As presented in Table 1, L-tyrosine, phosphorylcholine, succinic acid, 2-ketobutyric acid, and acetylcholine demonstrated the highest abundance in the ML group; moreover, the abundance of plasma metabolites in the MM group was consistent with that in the ML group. Picolinic acid, maleic acid, O-phosphoethanolamine, L-norvaline, indican, and L-methionine demonstrated the highest abundance in the MS group.

Table 1.
Abundance of key plasma metabolites in GFPs.
The relative contents of the metabolites were measured based on the Z-score (Figure 3c). The results demonstrated that the relative contents of indoleglycerol phosphate, 4-phenylbutyrate, maleic acid, and citrulline were the highest in the MS group, whereas the relative contents of other metabolites were relatively consistent among all groups. We further performed hierarchical cluster analysis with the relative values of metabolites as metabolic levels to analyze different metabolites in GFPs with different growth rates. As illustrated in Figure 3d, the metabolites among the three groups demonstrated varied metabolic patterns and metabolite levels. Notably, the levels of most metabolites in the ML and MS groups demonstrated contrasting trends. The levels of L-ribulose, indican, aminocaproic acid, L-methionine, procollagen 5-hydroxy-L-lysine, and other metabolites were the lowest in the ML group; an opposite trend was noted in the MS group.
To explore the function of differential metabolites in GFP, we performed the Kyoto Encyclopedia of Genes and Genomes (KEGG) functional enrichment analysis and screened the top 20 pathway entries with significant enrichment for mapping. As shown in Figure 3e, protein digestion and absorption, biosynthesis of amino acids, tyrosine metabolism, aminoacyl-tRNA biosynthesis, biosynthesis of alkaloids derived from histidine and purine, glycerophospholipid metabolism, cAMP pathway, and regulation of actin cytoskeleton were enriched pathways associated with GFP growth performance. In our enrichment analysis, pathways related to amino acid metabolism and biosynthesis were detected widely. In addition, metabolites enriched in the metabolic pathways of protein digestion and absorption, amino acid biosynthesis, and mineral absorption demonstrated high levels in ML GFPs. Therefore, the metabolites associated with amino acid metabolism and biosynthesis may play a key role in male GFP growth performance.
3.3. Correlation between Gut Bacteria, Transcripts, Phenotypes, and Metabolism in Male GFPs
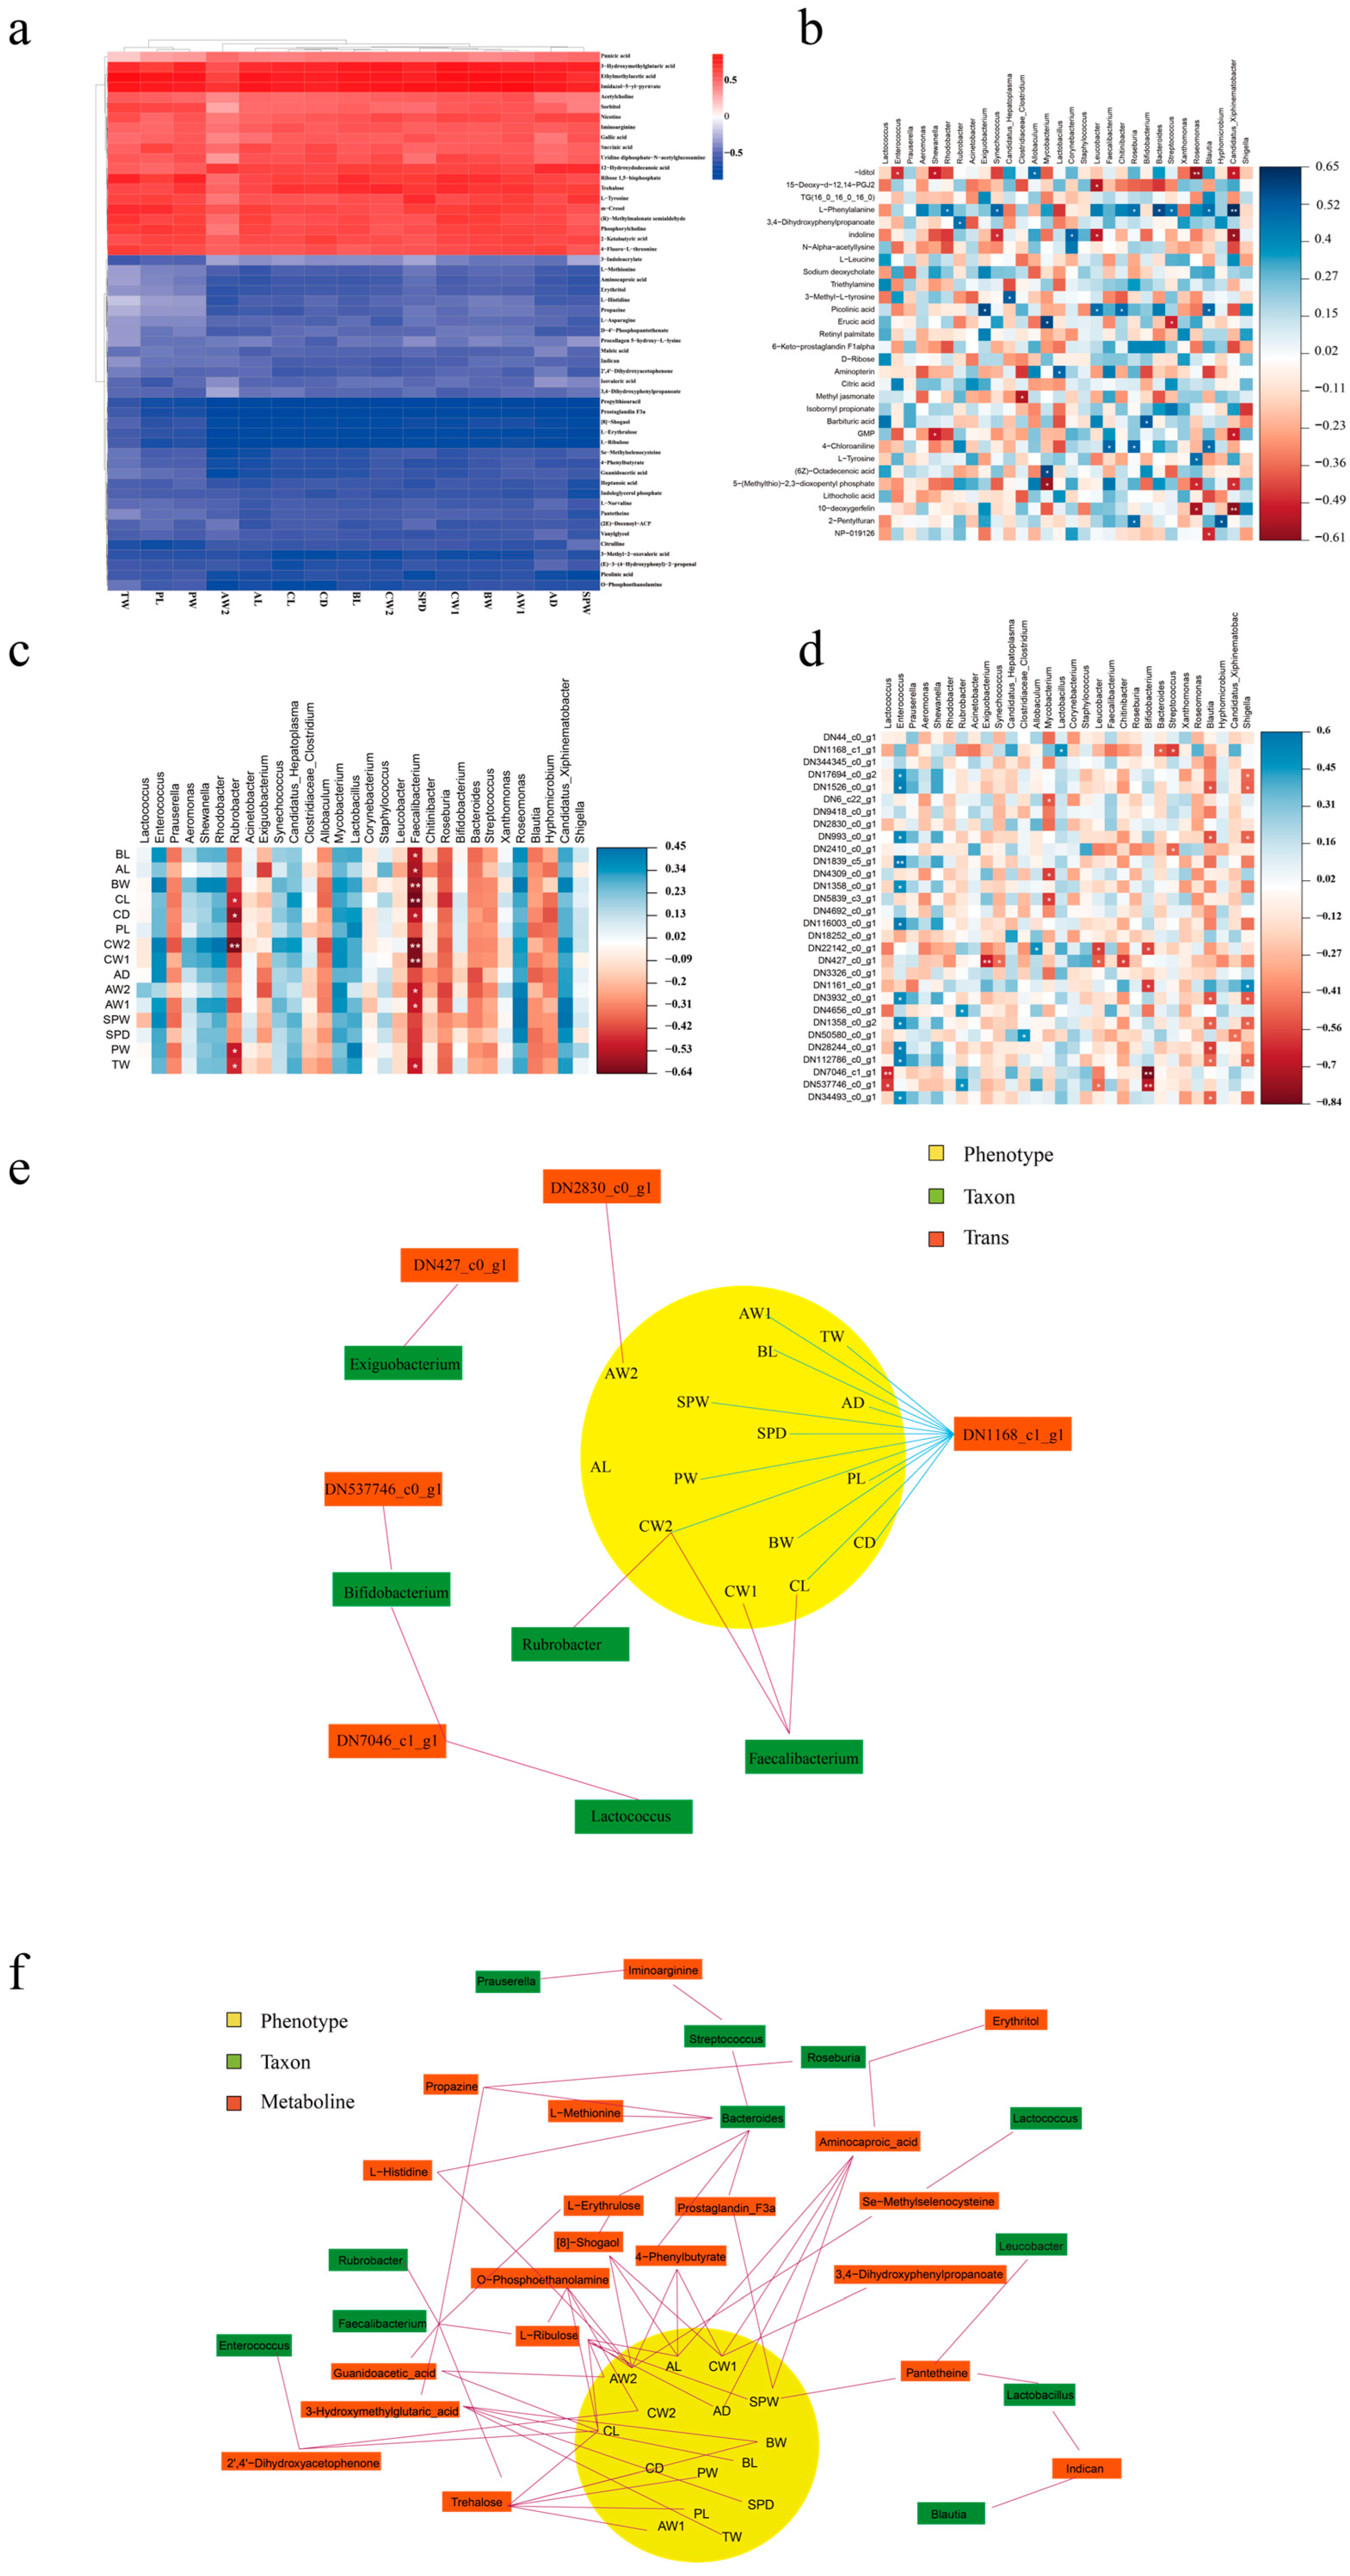
The correlations between phenotypes and metabolism were visualized using correlation heatmaps (Figure 4a). The results demonstrated that 20 of the top 53 abundant metabolites were positively correlated with GFP phenotypes. The metabolites 3-hydroxymethylglutaric acid, ethylmethylacetic acid, and imidazol-5-yl-pyruvate were highly and positively associated with the most phenotypes. Propylthiouracil, prostaglandin F3a, 8-shogaol, L-erythrulose, and L-ribulose were highly and negatively associated with phenotypes such as total weight (TW), palm length (PL), and palm width (PW). In terms of the correlation between gut bacteria and metabolism (Figure 4b), Candidatus Xiphinematobacter was found to be correlated highly and significantly positively with L-phenylalanine but correlated highly and negatively with 10-deoxygerfelin. Roseomonas demonstrated a high and negative correlation with -iditol, 5-(methylthio)-2,3-dioxopentyl phosphate, and 10-deoxygerfelin.
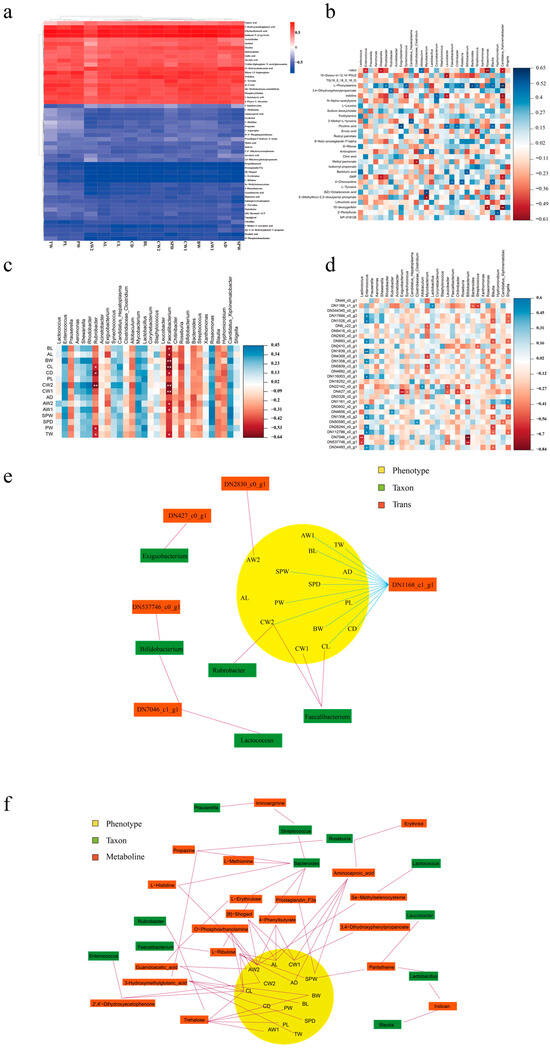
Figure 4.
Integrative multiomic analysis. Heatmap correlation analysis between (a) phenotypes and metabolites, (b) microbiome and metabolites, (c) microbiome and phenotypes, and (d) microbiome and transcripts (* p < 0.05, ** p < 0.01). (e) Network associations among DEGs, phenotypes, and microbiome. (f) Network associations among metabolites, phenotypes, and microbiome.
As illustrated in Figure 4c, we a performed correlation analysis between the top 30 microorganisms at the genus level and the phenotypes in male GFPs. Faecalibacterium was significantly and positively correlated with body length (BL), abdominal length (AL), body weight (BW), carapace length (CL), carapace depth (CD), carapace weight (CW1), carapace width (CW2), abdominal weight (AW1), abdominal width (AW2), and TW. Moreover, Rubrobacter was significantly and positively correlated with CL, CD, CW2, PW, and TW. These results indicated that Faecalibacterium and Rubrobacter may be crucial for phenotypic differentiation in GFPs. Regarding the correlation between gut bacteria and the 30 top differentially expressed genes (DEGs; Figure 4d), Enterococcus and Blautia were positively and negatively correlated with most DEGs, respectively. As such, these bacteria may affect growth by regulating gene expression.
3.4. Integrative Multiomic Analysis of Transcripts, Microbiome, Phenotypes, and Metabolites in Male GFPs
In the integrative multiomic analysis on the DEGs, the analytical results of phenotypes and plasma metabolomics provided two correlation models: DN1168_c1_g1–CW2–Rubrobacter and DN1168_c1_g1–CL–Faecalibacterium. Both models contributed to the apparent visualization of different omics (Figure 4e). The obtained association network demonstrated that the gene DN1168_c1_g1 is involved in most associations with phenotypes. To explain the differences in gut microbiota and plasma metabolites between GFPs with different growth rates, we integrated the correlative 16S rRNA gene sequencing results, metabolomic data, and phenotypes of male GFPs (Figure 4f). The results demonstrated that 20 metabolites and 11 microorganisms were involved in this correlation network, which also revealed 13 models of correlation between metabolites, microbiome, and phenotypes in male GFPs.
4. Discussion
Crustaceans typically demonstrate a large number of microbial communities in their guts. Gut microbiota has formed an interactive relationship with the host over the long course of evolution. As such, these microorganisms have become an indispensable part of their hosts. Gut microbiota structure is closely related to host health and growth performance, and intestinal microbiota structure is affected by many factors, such as nutritional substances, at different developmental stages and host genetics [30,31,32,33]. In the current study, we examined the differences in gut microbiota of male GFPs with different growth rates. Our 16S rRNA sequencing results demonstrated that gut microbiota in all groups was mainly of the phyla Proteobacteria and Firmicutes—consistent with previous results [34,35,36,37]. Gut Proteobacteria abundance is also associated with the performance of shrimp grown in an outdoor pond [38]. Many Firmicutes members can secrete active enzymes that facilitate the hydrolysis and utilization of carbohydrates and promote the absorption of energy by improving lipid metabolism [39,40]. Firmicutes and Bacteroides can affect fatty acid uptake and lipid metabolism in fish [41], and the Firmicutes/Bacteroides ratio is closely related to host energy metabolism, fat deposition, and growth. The higher the Firmicutes/Bacteroides ratio, the more efficient the host’s metabolism and growth [42]. The current results demonstrated that the Firmicutes/Bacteroides ratio was the highest in the ML group, followed by the MM group, and finally the MS group. As such, male GFPs with a higher growth rate may demonstrate better intestinal bacterial structure and higher nutritional metabolic efficiency.
At the genus level, Lactococcus accounted for the highest proportion of the gut bacterial structure in all GFP groups—similar to our previous results [43]. Lactococcus activates the innate immune system to produce cytokines and regulate the immune response [44,45,46]. Moreover, Lactococcus can regulate carbohydrate metabolism and absorption in livestock and poultry, as well as in mammals [47]. Therefore, in male GFPs, Lactococcus may affect growth and development by regulating carbohydrate metabolism, whereas the specific probiotic function of Lactococcus on growth warrants further exploration.
Metabolomics, the study of metabolic mechanisms, involves the measurement of metabolites in a whole biological sample and the elucidation of their potential metabolic pathways. Metabolites can directly fulfill the needs of individual growth and development through various metabolic reactions to synthesize energy and biological macromolecules; different metabolites and metabolic pathways affect the development of the related tissues and organs within a body [48,49,50]. In the current study, plasma metabolites in male GFPs of different sizes were investigated through LC-MS/MS. The results demonstrated that the abundance of plasma metabolites differed among GFPs of different sizes. In our hierarchical cluster analysis, we found that metabolite levels in large and small GFPs demonstrate opposite trends, indicating that metabolic patterns differ among GFPs with different growth rates.
Histidine contains an isopyrazole ring, the main component amino acid of functional proteins such as histone hemoglobin [24]. Small peptides composed of histidine and histamine have special physiological functions, and histidine plays a major role in metabolism and growth [51]. The levels of amino acid metabolites such as histidine and methionine were high in the ML group, and these metabolites were enriched in several metabolic pathways, such as protein digestion and absorption, amino acid biosynthesis, and mineral absorption. As such, histidine may be involved in various biochemical reactions within the body and thus be essential for GFP growth and development.
Our results further demonstrated that metabolites with significant differences were mainly involved in pathways such as alanine aspartate and glutamate metabolism, mineral absorption, protein digestion and absorption, and amino acid biosynthesis. Amino acid metabolism plays an important role in muscle cell growth promotion, improving the flavor of meats [52]. Moreover, we observed higher levels of many amino acids in fast-growing male GFPs. Therefore, we speculate that metabolites related to amino acid biosynthesis, alanine aspartate and glutamate metabolism, and protein absorption may play a major role in the growth performance of GFPs.
Gut microbiota and host phenotypes demonstrate a strong symbiotic relationship [53]. Gut microbiota interacts with various physiological functions in the host through its metabolites, which are essential for host growth and development [54]. In our integrated analysis of the microbiome and metabolome, Candidatus Xiphinematobacter was significantly correlated with six of the top thirty metabolites, which might be involved in metabolism regulation and, in turn, affect growth in GFPs. However, we also noted that Faecalibacterium and Rubrobacter were most significantly associated with GFP phenotypes. Faecalibacterium and Roseburia are major producers of butyrate in the intestines [55]. Gut microbiota such as Faecalibacterium and Roseburia may have enhanced growth by producing butyrate, which regulates host metabolism and immune responses. This modulation of metabolic pathways, particularly those involving amino acid biosynthesis and protein absorption, is crucial for the growth differences observed in GFPs.
A main strength of our study is that we considered all interactions between multiple biological levels and their associations. In the integrated analysis of the microbiome, metabolome, and transcriptome, we constructed two association networks. The results demonstrated that the gene DN1168_c1_g1 was involved in the most associations with phenotypes. Moreover, Faecalibacterium and Roseburia were strongly correlated with the aforementioned gene, as well as CW2 and CW1. As such, two correlation models, DN1168_c1_g1–CW2–Rubrobacter and DN1168_c1_g1–CL–Faecalibacterium, were constructed. In addition to Faecalibacterium and Roseburia, Bacteroides were associated with a wide variety of metabolites, and these metabolites were significantly correlated with various phenotypes. In aquatic animals, Bacteroides is a prominent bacterial group in gut microbiota, with roles related to symbiosis and pathogenicity [56]. Taken together, these results indicate that symbiotic bacteria affect male GFP growth and development by regulating host metabolism and gene expression.
5. Conclusions
In this study, we identified gut microbial taxa and metabolites associated with GFP phenotypes and used integrative multiomic analysis, combining the aforementioned results with transcriptomic data, to further explore the differential growth mechanisms among male GFPs. Our results indicate that the intestinal symbiotic bacteria can influence GFP growth by modulating metabolism and gene expression, as well as their correlations. This provides a novel paradigm to explore potential mechanisms underlying differential growth in GFPs. Moreover, we constructed an interaction network to gain insight into the crosstalk between genes, metabolites, and gut bacteria during GFP growth. The current results, at the integrated omics level, provide an understanding of the mechanisms underlying GFP growth.
Author Contributions
Conceptualization, Q.G. and S.Y.; methodology, G.H. and Q.T.; software, X.Z. and H.H.; validation, M.C., H.H. and R.W.; writing—original draft preparation, P.L.; writing—review and editing, Q.G.; supervision, Z.X.; project administration, Q.G.; funding acquisition, Q.G. All authors have read and agreed to the published version of the manuscript.
Funding
This work was supported by grants from the National Natural Science Foundation of China [grant number 32273121, funder Quanxin Gao]; the Natural Science Foundation of Zhejiang Province [grant number LGN22C190019]; the Huzhou Natural Science Foundation [grant numbers 2021YZ08, funder Quanxin Ga]; and the earmarked fund for the China Agriculture Research System of MOF and MARA [grant number CARS-48, funder Shaokui Yi]. The sponsor(s) had no role in the study design; in the collection, analysis, and interpretation of the data; in the writing of the report; and in the decision to submit the article for publication.
Institutional Review Board Statement
This study was performed according to the Guidelines for the Care and Use of Laboratory Animals developed by the Ministry of Science and Technology (Beijing, China). All experiments were approved by Huzhou University (the ethical approval code: 20190625).
Informed Consent Statement
Informed consent was obtained from all subjects involved in the study.
Data Availability Statement
The data that support the findings of this study are available from the corresponding author upon reasonable request.
Acknowledgments
We thank Guoliang Yang for his support and comments for this study.
Conflicts of Interest
Authors Quanxin Gao, Zhenglong Xia, Miuying Cai, Guoliang Yang and Shaokui Yi were employed by the company Jiangsu Shufeng Prawn Breeding Co., Ltd. The remaining authors declare that the research was conducted in the absence of any commercial or financial relationships that could be construed as a potential conflict of interest. The authors declare that they have no known competing financial interests or personal relationships that could have appeared to influence the work reported in this paper.
References
- Peng, X.; Zhong, Z.; Zhong, H.; Gong, J.; Du, T.; Ding, L.; Lan, X.; Tu, H.; Tang, Q.; Xia, Z.; et al. Histopathological observation and comparative transcriptome analysis reveal immune response mechanisms to Aeromonas dhakensis infection in Macrobrachium rosenbergii. Fish Shellfish Immunol. 2023, 142, 109151. [Google Scholar] [CrossRef] [PubMed]
- Sahoo, S.; Badhe, M.R.; Paul, A.; Sahoo, P.K.; Suryawanshi, A.R.; Panda, D.; Pillai, B.R.; Baliarsingh, S.; Patnaik, B.B.; Mohanty, J.; et al. Isolation and characterization of a lectin-like chitinase from the hepatopancreas of freshwater prawn, Macrobrachium rosenbergii. Biochimie 2024, 221, 125–136. [Google Scholar] [CrossRef] [PubMed]
- Sun, S.; Bian, C.; Zhou, N.; Shen, Z.; Yu, M. Dietary Astragalus polysaccharides improve the growth and innate immune response of giant freshwater prawn Macrobrachium rosenbergii: Insights from the brain-gut axis. Int. J. Biol. Macromol. 2023, 243, 125158. [Google Scholar] [CrossRef] [PubMed]
- New, M.B.; Nair, C.M. Global scale of freshwater prawn farming. Aquac. Res. 2012, 43, 960–969. [Google Scholar] [CrossRef]
- Xia, J.; Liu, D.; Zhou, W.; Yi, S.; Wang, X.; Li, B.; Jawad, M.; Xu, H.; Gui, L.; Li, M. Comparative transcriptome analysis of brain and gonad reveals reproduction-related miRNAs in the giant prawn, Macrobrachium rosenbergii. Front. Genet. 2022, 13, 990677. [Google Scholar] [CrossRef]
- Hsuan Lammers, J.; Warburton, K.; Cribb, B.W. Individual Competition and the Emergence of Density-Dependent Exposure to Predation: How Behaviors Influence Population Processes. Adapt. Behav. 2010, 18, 171–183. [Google Scholar] [CrossRef]
- Wang, A.R.; Ran, C.; Ringø, E.; Zhou, Z.G. Progress in fish gastrointestinal microbiota research. Rev. Aquac. 2017, 10, 626–640. [Google Scholar] [CrossRef]
- Lin, M.; Zeng, C.X.; Jia, X.Q.; Zhai, S.W.; Li, Z.Q.; Ma, Y. The composition and structure of the intestinal microflora of Anguilla marmorata at different growth rates: A deep sequencing study. J. Appl. Microbiol. 2019, 126, 1340–1352. [Google Scholar] [CrossRef]
- Hsu, H.-Y.; Chang, F.-C.; Wang, Y.-B.; Chen, S.-H.; Lin, Y.-P.; Lin, C.-Y.; Han, Y.-S. Revealing the compositions of the intestinal microbiota of three Anguillid eel species using 16S rDNA sequencing. Aquac. Res. 2018, 49, 2404–2415. [Google Scholar] [CrossRef]
- Sun, Y.; Yang, H.; Ling, Z.; Chang, J.; Ye, J. Gut microbiota of fast and slow growing grouper Epinephelus coioides. Afr. J. Microbiol. Res. 2009, 3, 713–720. [Google Scholar]
- Shi, Y.; Ma, D.-Y.; Shao-Wei Zhai, S.-W. Revealing the difference of intestinal microbiota composition of cultured European eels (Anguilla anguilla) with different growth rates. Isr. J. Aquac.-Bamidgeh 2020, 72, 1–12. [Google Scholar] [CrossRef]
- Ringø, E.; Sperstad, S.; Kraugerud, O.F.; Krogdahl, Å. Use of 16S rRNA gene sequencing analysis to characterize culturable intestinal bacteria in Atlantic salmon (Salmo salar) fed diets with cellulose or non-starch polysaccharides from soy. Aquac. Res. 2008, 39, 1087–1100. [Google Scholar] [CrossRef]
- Sun, P.; Zhang, H.; Jiang, Y.; Gao, Q.; Tang, B.; Ling, J.; Yuan, X. Relationships between the Gut Microbiota of Juvenile Black Sea Bream (Acanthopagrus schlegelii) and Associated Environment Compartments in Different Habitats. Microorganisms 2021, 9, 2557. [Google Scholar] [CrossRef]
- Li, T.; Long, M.; Li, H.; Gatesoupe, F.-J.; Zhang, X.; Zhang, Q.; Feng, D.; Li, A. Multi-Omics Analysis Reveals a Correlation between the Host Phylogeny, Gut Microbiota and Metabolite Profiles in Cyprinid Fishes. Front. Microbiol. 2017, 8, 454. [Google Scholar] [CrossRef] [PubMed]
- Xiong, J.; Zhu, J.; Dai, W.; Dong, C.; Qiu, Q.; Li, C. Integrating gut microbiota immaturity and disease-discriminatory taxa to diagnose the initiation and severity of shrimp disease. Environ. Microbiol. 2017, 19, 1490–1501. [Google Scholar] [CrossRef] [PubMed]
- Wang, H.; Huang, J.; Wang, P.; Li, T. Insights into the microbiota of larval and postlarval Pacific white shrimp (Penaeus vannamei) along early developmental stages: A case in pond level. Mol. Genet. Genom. 2020, 295, 1517–1528. [Google Scholar] [CrossRef]
- Cicala, F.; Lago-Leston, A.; Gomez-Gil, B.; Gollas-Galvan, T.; Chong-Robles, J.; Cortes-Jacinto, E.; Martínez-Porchas, M. Gut microbiota shifts in the giant tiger shrimp, Penaeus monodon, during the postlarvae, juvenile, and adult stages. Aquac. Int. 2020, 28, 1421–1433. [Google Scholar] [CrossRef]
- Uengwetwanit, T.; Uawisetwathana, U.; Arayamethakorn, S.; Khudet, J.; Chaiyapechara, S.; Karoonuthaisiri, N.; Rungrassamee, W. Multi-omics analysis to examine microbiota, host gene expression and metabolites in the intestine of black tiger shrimp (Penaeus monodon) with different growth performance. PeerJ 2020, 8, e9646. [Google Scholar] [CrossRef]
- Garibay-Valdez, E.; Martínez-Porchas, M.; Calderón, K.; Vargas-Albores, F.; Gollas-Galván, T.; Martínez-Córdova, L. Taxonomic and functional changes in the microbiota of the white shrimp (Litopenaeus vannamei) associated with postlarval ontogenetic development. Aquaculture 2020, 518, 734842. [Google Scholar] [CrossRef]
- Wishart, D.S. Metabolomics for Investigating Physiological and Pathophysiological Processes. Physiol. Rev. 2019, 99, 1819–1875. [Google Scholar] [CrossRef]
- Chandran, J.; Bellad, A.; Ramarajan, M.G.; Rangiah, K. Applications of quantitative metabolomics to revolutionize early diagnosis of inborn errors of metabolism in India. Anal. Sci. Adv. 2021, 2, 546–563. [Google Scholar] [CrossRef]
- Gong, B.; Bao, F.; Wang, Y.; Liu, H.; Xiao, M.; He, J. Metabonomics study on the effect of traditional Chinese medicines feed addition on growth performance and serum metabolic profile of juvenile Chinese softshell turtle (Pelodiscus sinensis Wiegmann). Aquac. Rep. 2021, 20, 100632. [Google Scholar] [CrossRef]
- Li, L.; Liu, Z.; Quan, J.; Lu, J.; Zhao, G.; Sun, J. Metabonomics analysis reveals the protective effect of nano-selenium against heat stress of rainbow trout (Oncorhynchus mykiss). J. Proteom. 2022, 259, 104545. [Google Scholar] [CrossRef] [PubMed]
- Xu, C.; Wang, X.; Han, F.; Qi, C.; Li, E.; Guo, J.; Qin, J.G.; Chen, L. α-lipoic acid regulate growth, antioxidant status and lipid metabolism of Chinese mitten crab Eriocheir sinensis: Optimum supplement level and metabonomics response. Aquaculture 2019, 506, 94–103. [Google Scholar] [CrossRef]
- Cuzon, G.; Lawrence, A.; Gaxiola, G.; Rosas, C.; Guillaume, J. Nutrition of Litopenaeus vannamei reared in tanks or in ponds. Aquaculture 2004, 235, 513–551. [Google Scholar] [CrossRef]
- Maltez, L.C.; Barbas, L.A.L.; Okamoto, M.H.; de Alcantara Lopes, D.L.; Romano, L.A.; Sampaio, L.A.; Garcia, L. Secondary Stress Responses in Juvenile Brazilian Flounder, Paralichthys orbignyanus, throughout and after Exposure to Sublethal Levels of Ammonia and Nitrite. J. World Aquac. Soc. 2018, 50, 346–358. [Google Scholar] [CrossRef]
- Li, T.; Li, E.; Suo, Y.; Xu, Z.; Jia, Y.; Qin, J.G.; Chen, L.; Gu, Z. Energy metabolism and metabolomics response of Pacific white shrimp Litopenaeus vannamei to sulfide toxicity. Aquat. Toxicol. 2017, 183, 28–37. [Google Scholar] [CrossRef] [PubMed]
- Shen, M.; Cui, Y.; Wang, R.; Dong, T.; Ye, H.; Wang, S.; Fu, R.; Li, Y. Acute response of Pacific white shrimp Litopenaeus vannamei to high-salinity reductions in osmosis-, metabolism-, and immune-related enzyme activities. Aquac. Int. 2019, 28, 31–39. [Google Scholar] [CrossRef]
- Xu, H.; Ren, J.; Xu, X.; Lou, B.; Zhang, D. The Composition and Diversity of Intestinal Microbes at Different Growth Stages of Giant Freshwater Prawns (Macrobrachium rosenbergii). Fishes 2023, 8, 473. [Google Scholar] [CrossRef]
- Cao, H.; Chen, D.; Guo, L.; Jv, R.; Xin, Y.; Mo, W.; Wang, C.; Li, P.; Wang, H. Effects of Bacillus subtilis on growth performance and intestinal flora of Penaeus vannamei. Aquac. Rep. 2022, 23, 101070. [Google Scholar] [CrossRef]
- Zhang, X.; Sun, J.; Han, Z.; Chen, F.; Lv, A.; Hu, X.; Sun, X.; Qi, H.; Guo, Y. Vibrio parahaemolyticus alters the community composition and function of intestinal microbiota in Pacific white shrimp, Penaeus vannamei. Aquaculture 2021, 544, 737061. [Google Scholar] [CrossRef]
- Zhang, M.; Pan, L.; Fan, D.; He, J.; Su, C.; Gao, S.; Zhang, M. Study of fermented feed by mixed strains and their effects on the survival, growth, digestive enzyme activity and intestinal flora of Penaeus vannamei. Aquaculture 2021, 530, 735703. [Google Scholar] [CrossRef]
- Li, Y.; Zhou, F.; Tang, Y.; Huang, J.; Yang, L.; Jiang, S.; Yang, Q.; Jiang, S. Variation in bacterial communities among stress-sensitive and stress-tolerant black tiger shrimp (Penaeus monodon) individuals. Aquac. Res. 2021, 52, 2146–2159. [Google Scholar] [CrossRef]
- Liu, B.; Zhou, Q.; Sun, C.; Song, C.; Zhang, H.; Yang, Z.; Shan, F. Patterns of Bacterial Community Composition and Diversity Following the Embryonic Development Stages of Macrobrachium rosenbergii. Aquac. Rep. 2020, 17, 100372. [Google Scholar] [CrossRef]
- Cen, S.; Fang, Q.; Tong, L.; Yang, W.; Zhang, J.; Lou, Q.; Huang, T. Effects of chitosan-sodium alginate-nisin preservatives on the quality and spoilage microbiota of Penaeus vannamei shrimp during cold storage. Int. J. Food Microbiol. 2021, 349, 109227. [Google Scholar] [CrossRef]
- Huerta-Rábago, J.A.; Martínez-Porchas, M.; Miranda-Baeza, A.; Nieves-Soto, M.; Rivas-Vega, M.E.; Martínez-Córdova, L.R. Addition of commercial probiotic in a biofloc shrimp farm of Litopenaeus vannamei during the nursery phase: Effect on bacterial diversity using massive sequencing 16S rRNA. Aquaculture 2019, 502, 391–399. [Google Scholar] [CrossRef]
- Yao, W.; Li, X.; Zhang, C.; Wang, J.; Cai, Y.; Leng, X. Effects of dietary synbiotics supplementation methods on growth, intestinal health, non-specific immunity and disease resistance of Pacific white shrimp, Litopenaeus vannamei. Fish Shellfish Immunol. 2021, 112, 46–55. [Google Scholar] [CrossRef] [PubMed]
- Duan, Y.; Huang, J.; Wang, Y.; Zhang, J. Characterization of bacterial community in intestinal and rearing water of Penaeus monodon differing growth performances in outdoor and indoor ponds. Aquac. Res. 2020, 51, 4279–4289. [Google Scholar] [CrossRef]
- Kaoutari, A.E.; Armougom, F.; Gordon, J.I.; Raoult, D.; Henrissat, B. The abundance and variety of carbohydrate-active enzymes in the human gut microbiota. Nat. Rev. Microbiol. 2013, 11, 497–504. [Google Scholar] [CrossRef]
- Turnbaugh, P.J.; Hamady, M.; Yatsunenko, T.; Cantarel, B.L.; Duncan, A.; Ley, R.E.; Sogin, M.L.; Jones, W.J.; Roe, B.A.; Affourtit, J.P.; et al. A core gut microbiome in obese and lean twins. Nature 2009, 457, 480–484. [Google Scholar] [CrossRef]
- Semova, I.; Carten, J.D.; Stombaugh, J.; Mackey, L.C.; Knight, R.; Farber, S.A.; Rawls, J.F. Microbiota Regulate Intestinal Absorption and Metabolism of Fatty Acids in the Zebrafish. Cell Host Microbe 2012, 12, 277–288. [Google Scholar] [CrossRef]
- Li, M.; Yu, L.; Zhao, J.; Zhang, H.; Chen, W.; Zhai, Q.; Tian, F. Role of dietary edible mushrooms in the modulation of gut microbiota. J. Funct. Foods 2021, 83, 104538. [Google Scholar] [CrossRef]
- Gao, Q.; Luo, J.; Liu, P.; Yi, S.; Tang, Q.; Li, J.; Xia, Z.; Yang, G. Characteristics of intestinal microbiota in male morphotypes of the giant freshwater prawn Macrobrachium rosenbergii. Aquaculture 2022, 555, 738200. [Google Scholar] [CrossRef]
- Kiran, G.S.; Priyadharshini, S.; Sajayyan, A.; Ravindran, A.; Priyadharshini, G.B.; Ramesh, U.; Suarez, L.E.C.; Selvin, J. Dietary administration of gelatinised polyhydroxybutyrate to Penaeus vannamei improved growth performance and enhanced immune response against Vibrio parahaemolyticus. Aquaculture 2020, 517, 734773. [Google Scholar] [CrossRef]
- Tsukano, K.; Lakritz, J.; Suzuki, K. Plasma histidine concentrations as a specific biomarker for intestinal mucosal damage in calves with cryptosporidiosis. Res. Vet. Sci. 2020, 132, 78–80. [Google Scholar] [CrossRef] [PubMed]
- Feng, J.; Chang, X.; Zhang, Y.; Yan, X.; Zhang, J.; Nie, G. Effects of Lactococcus lactis from Cyprinus carpio L. as probiotics on growth performance, innate immune response and disease resistance against Aeromonas hydrophila. Fish Shellfish Immunol. 2019, 93, 73–81. [Google Scholar] [CrossRef] [PubMed]
- Feng, J.; Liu, S.; Zhu, C.; Cai, Z.; Cui, W.; Chang, X.; Yan, X.; Qin, C.; Zhang, J.; Nie, G. The effects of dietary Lactococcus spp. on growth performance, glucose absorption and metabolism of common carp, Cyprinus carpio L. Aquaculture 2022, 546, 737394. [Google Scholar] [CrossRef]
- Fanjul-Moles, M.L. Biochemical and functional aspects of crustacean hyperglycemic hormone in decapod crustaceans: Review and update. Comp. Biochem. Physiol. C Toxicol. Pharmacol. 2006, 142, 390–400. [Google Scholar] [CrossRef]
- Wang, X.; Li, E.; Chen, L. A Review of Carbohydrate Nutrition and Metabolism in Crustaceans. N. Am. J. Aquac. 2016, 78, 178–187. [Google Scholar] [CrossRef]
- Mandiki, S.N.; Babiak, I.; Bopopi, J.M.; Leprieur, F.; Kestemont, P. Effects of sex steroids and their inhibitors on endocrine parameters and gender growth differences in Eurasian perch (Perca fluviatilis) juveniles. Steroids 2005, 70, 85–94. [Google Scholar] [CrossRef]
- Sharf, Y.; Khan, M.A. Dietary histidine requirement for fingerlings of Channa punctatus (Bloch). Aquaculture 2022, 561, 738732. [Google Scholar] [CrossRef]
- Zhou, X.; Zhao, D.; Chen, Y.; Xiao, Y.; Mao, Z.; Cao, S.; Qu, F.; Li, Y.; Jin, J.; Liu, Z.; et al. Molecular Characterization and Nutrition Regulation of the Glutamine Synthetase Gene in Triploid Crucian Carp. Fishes 2022, 7, 196. [Google Scholar] [CrossRef]
- Gao, Q.; Liu, P.; Li, Y.; Song, D.; Long, W.; Wang, Z.; Yi, S.; Jiang, L. Gut microbiota, host genetics and phenotypes in aquatic animals: A review. Aquac. Rep. 2023, 31, 101648. [Google Scholar] [CrossRef]
- Wang, E.; Zhou, Y.; Liang, Y.; Ling, F.; Xue, X.; He, X.; Zhai, X.; Xue, Y.; Zhou, C.; Tang, G.; et al. Rice flowering improves the muscle nutrient, intestinal microbiota diversity, and liver metabolism profiles of tilapia (Oreochromis niloticus) in rice-fish symbiosis. Microbiome 2022, 10, 231. [Google Scholar] [CrossRef] [PubMed]
- Faden, H. The Role of Faecalibacterium, Roseburia, and Butyrate in Inflammatory Bowel Disease. Dig. Dis. 2022, 40, 793–795. [Google Scholar] [CrossRef] [PubMed]
- Rungrassamee, W.; Klanchui, A.; Chaiyapechara, S.; Maibunkaew, S.; Tangphatsornruang, S.; Jiravanichpaisal, P.; Karoonuthaisiri, N. Bacterial Population in Intestines of the Black Tiger Shrimp (Penaeus monodon) under Different Growth Stages. PLoS ONE 2013, 8, e60802. [Google Scholar] [CrossRef]
Disclaimer/Publisher’s Note: The statements, opinions and data contained in all publications are solely those of the individual author(s) and contributor(s) and not of MDPI and/or the editor(s). MDPI and/or the editor(s) disclaim responsibility for any injury to people or property resulting from any ideas, methods, instructions or products referred to in the content. |
© 2024 by the authors. Licensee MDPI, Basel, Switzerland. This article is an open access article distributed under the terms and conditions of the Creative Commons Attribution (CC BY) license (https://creativecommons.org/licenses/by/4.0/).

