
The Promising Role of Synthetic Flavors in Advancing Fish Feeding Strategies: A Focus on Adult Female Zebrafish (Danio rerio) Growth, Welfare, Appetite, and Reproductive Performances
 , , , , , , and
Abstract
:Simple Summary
Abstract
1. Introduction
2. Materials and Methods
2.1. Ethics
2.2. Synthetic Flavors and Production of Experimental Diets
2.3. Experimental Design
2.4. Biometry and Reproductive Parameters
2.5. Feed Intake
2.6. Egg Collection and Hatching Rate
2.7. Histological Analysis
2.8. Immunohistochemistry Analysis
2.9. Molecular Analyses
2.10. Statistical Analyses
3. Results
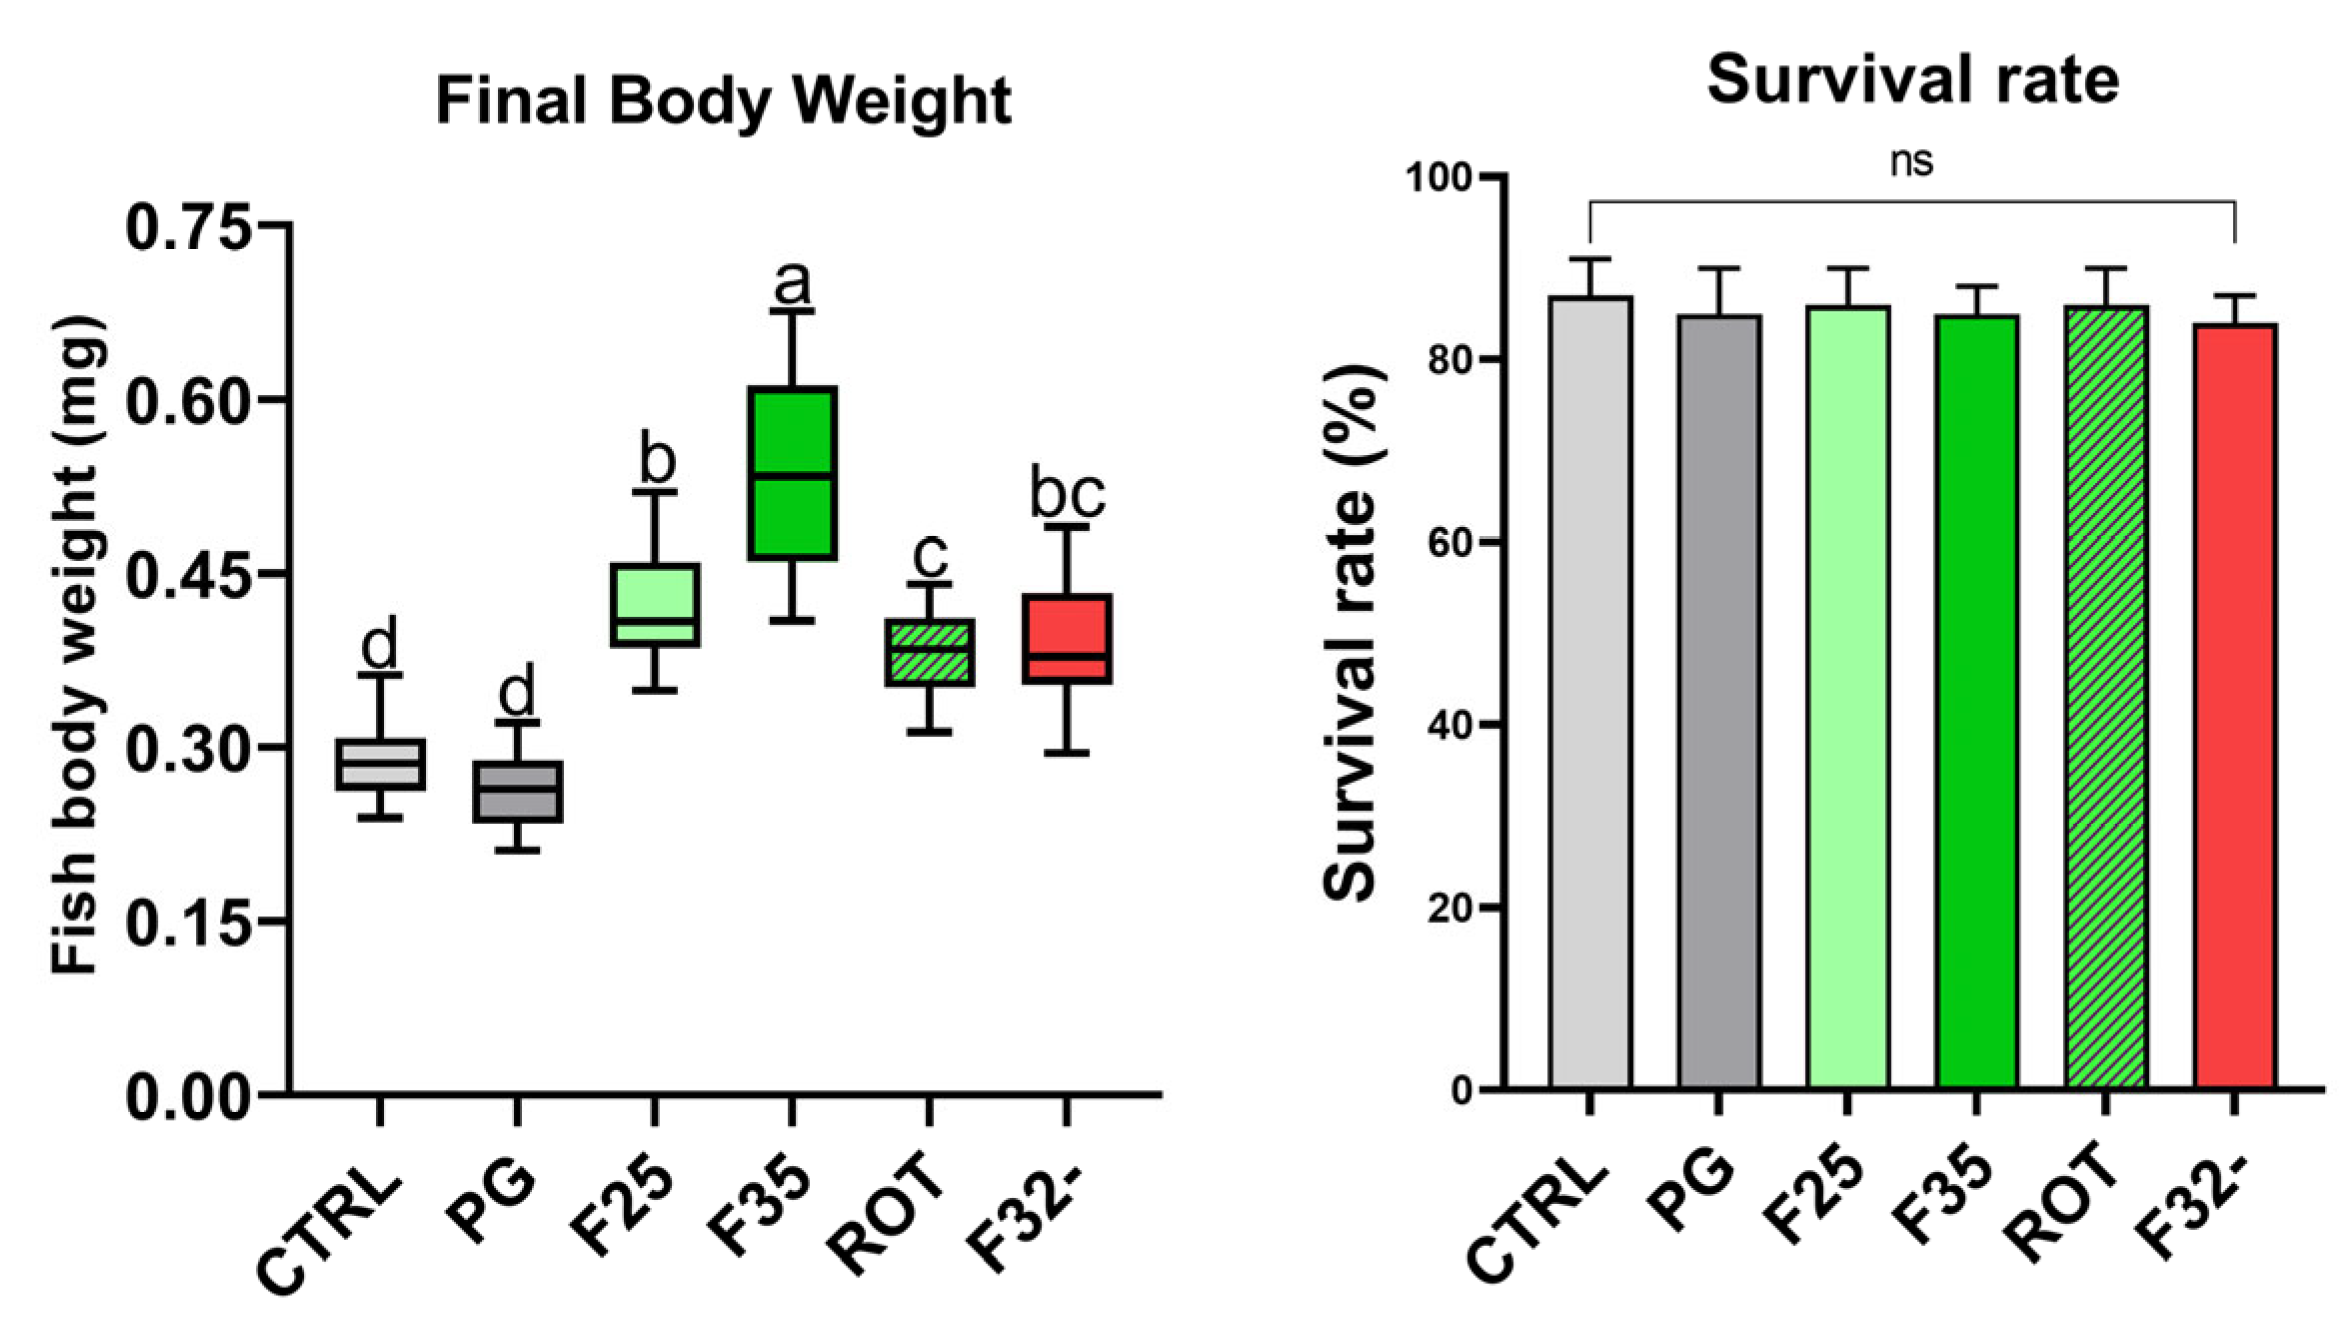
3.1. Biometry
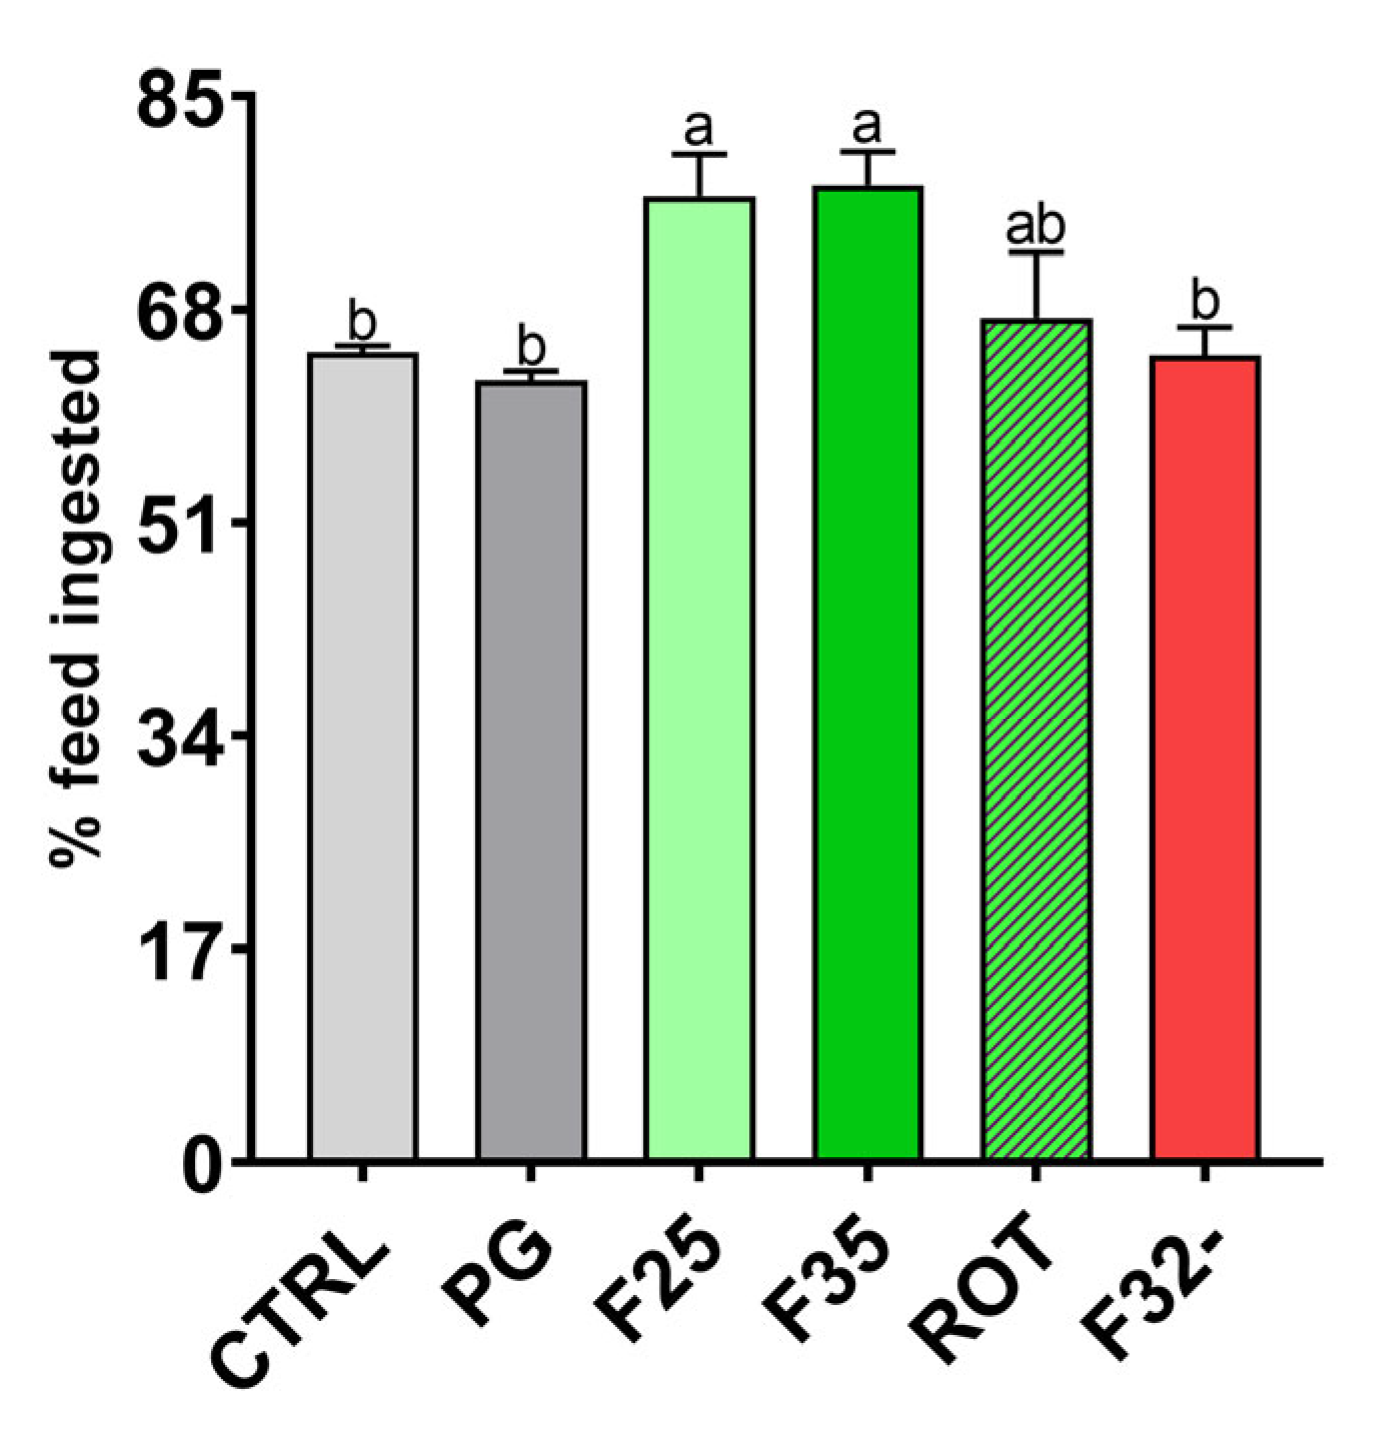
3.2. Feed Intake
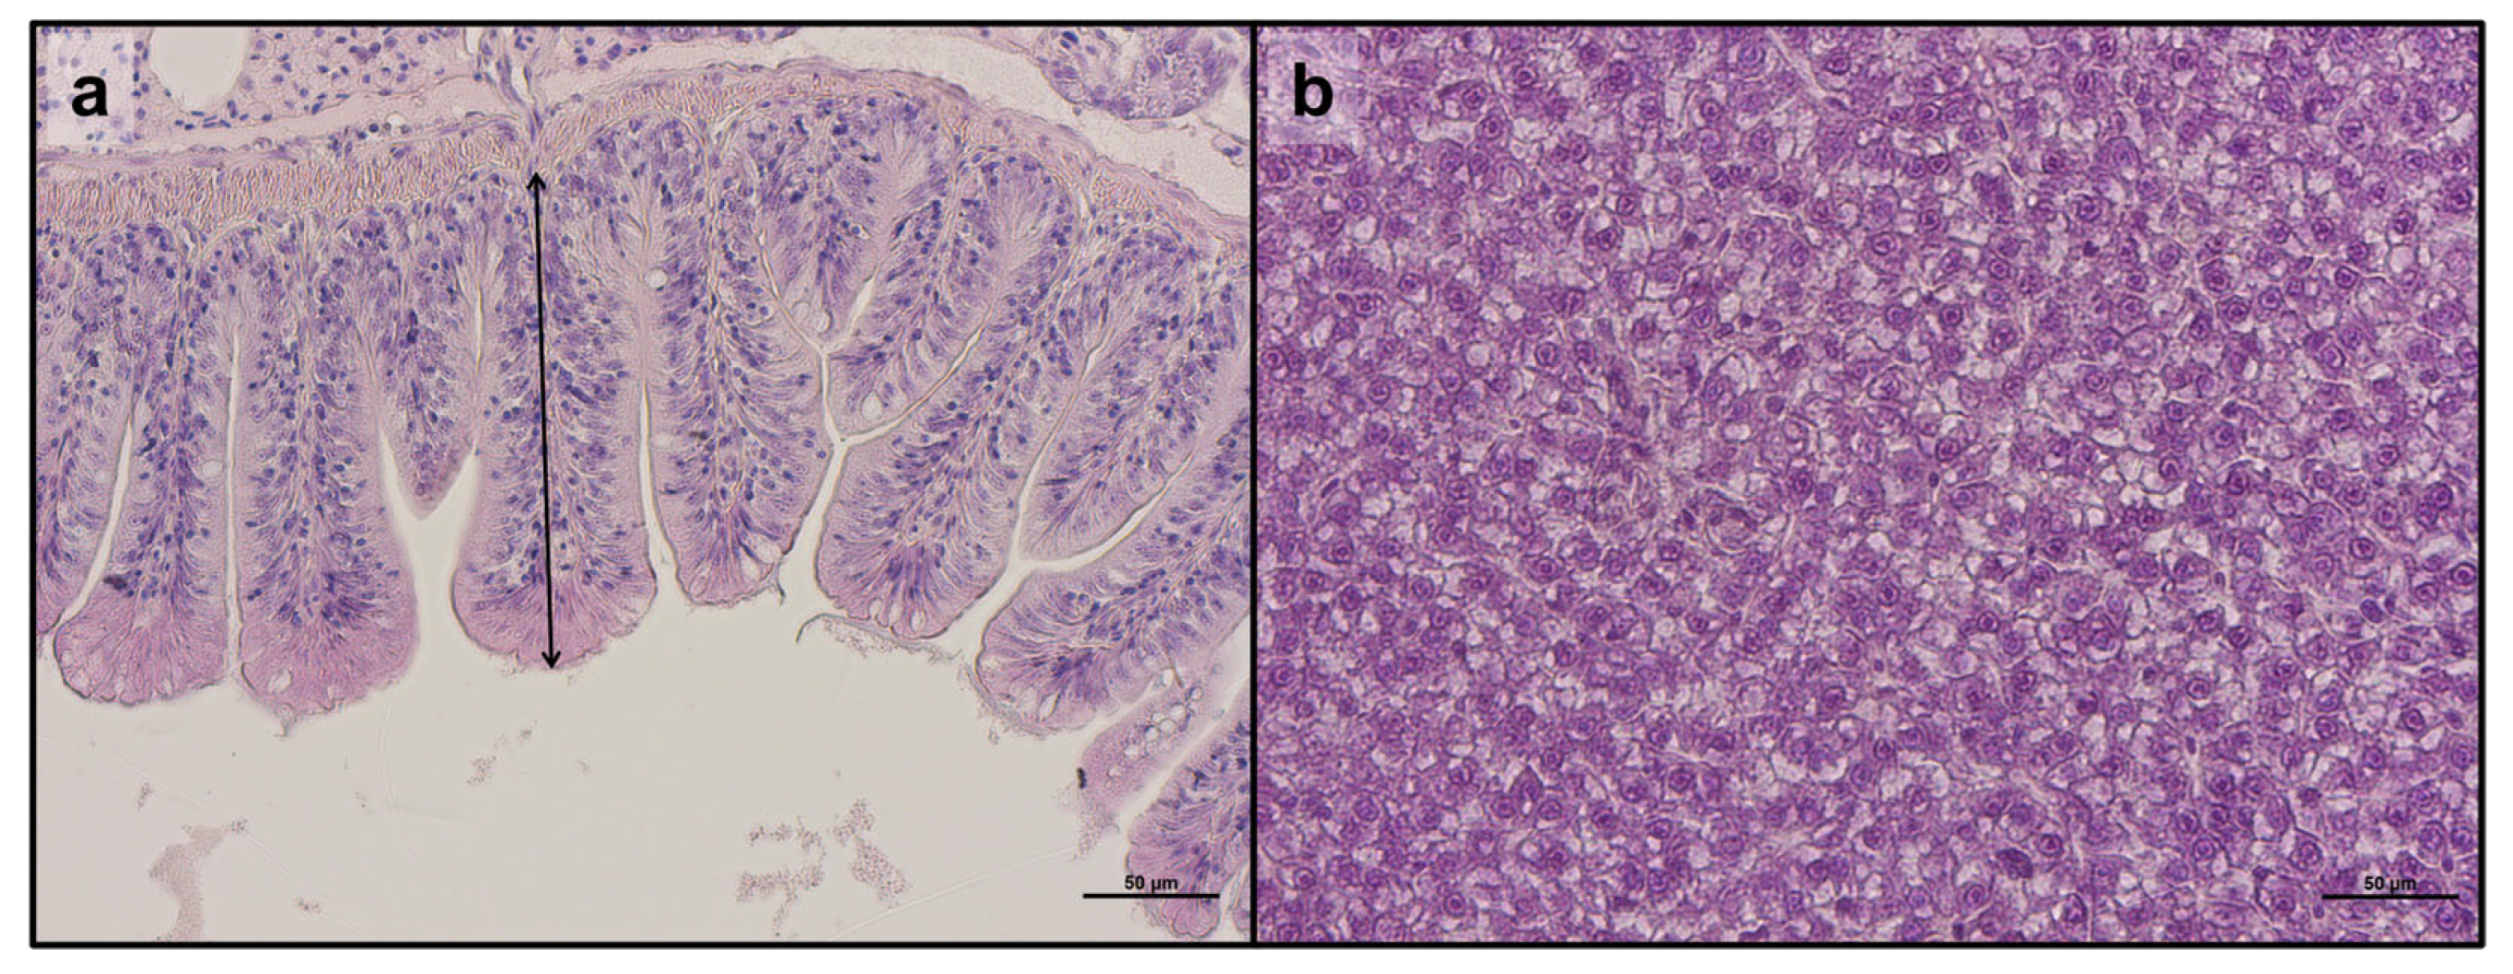
3.3. Liver and Intestine Histomorphology
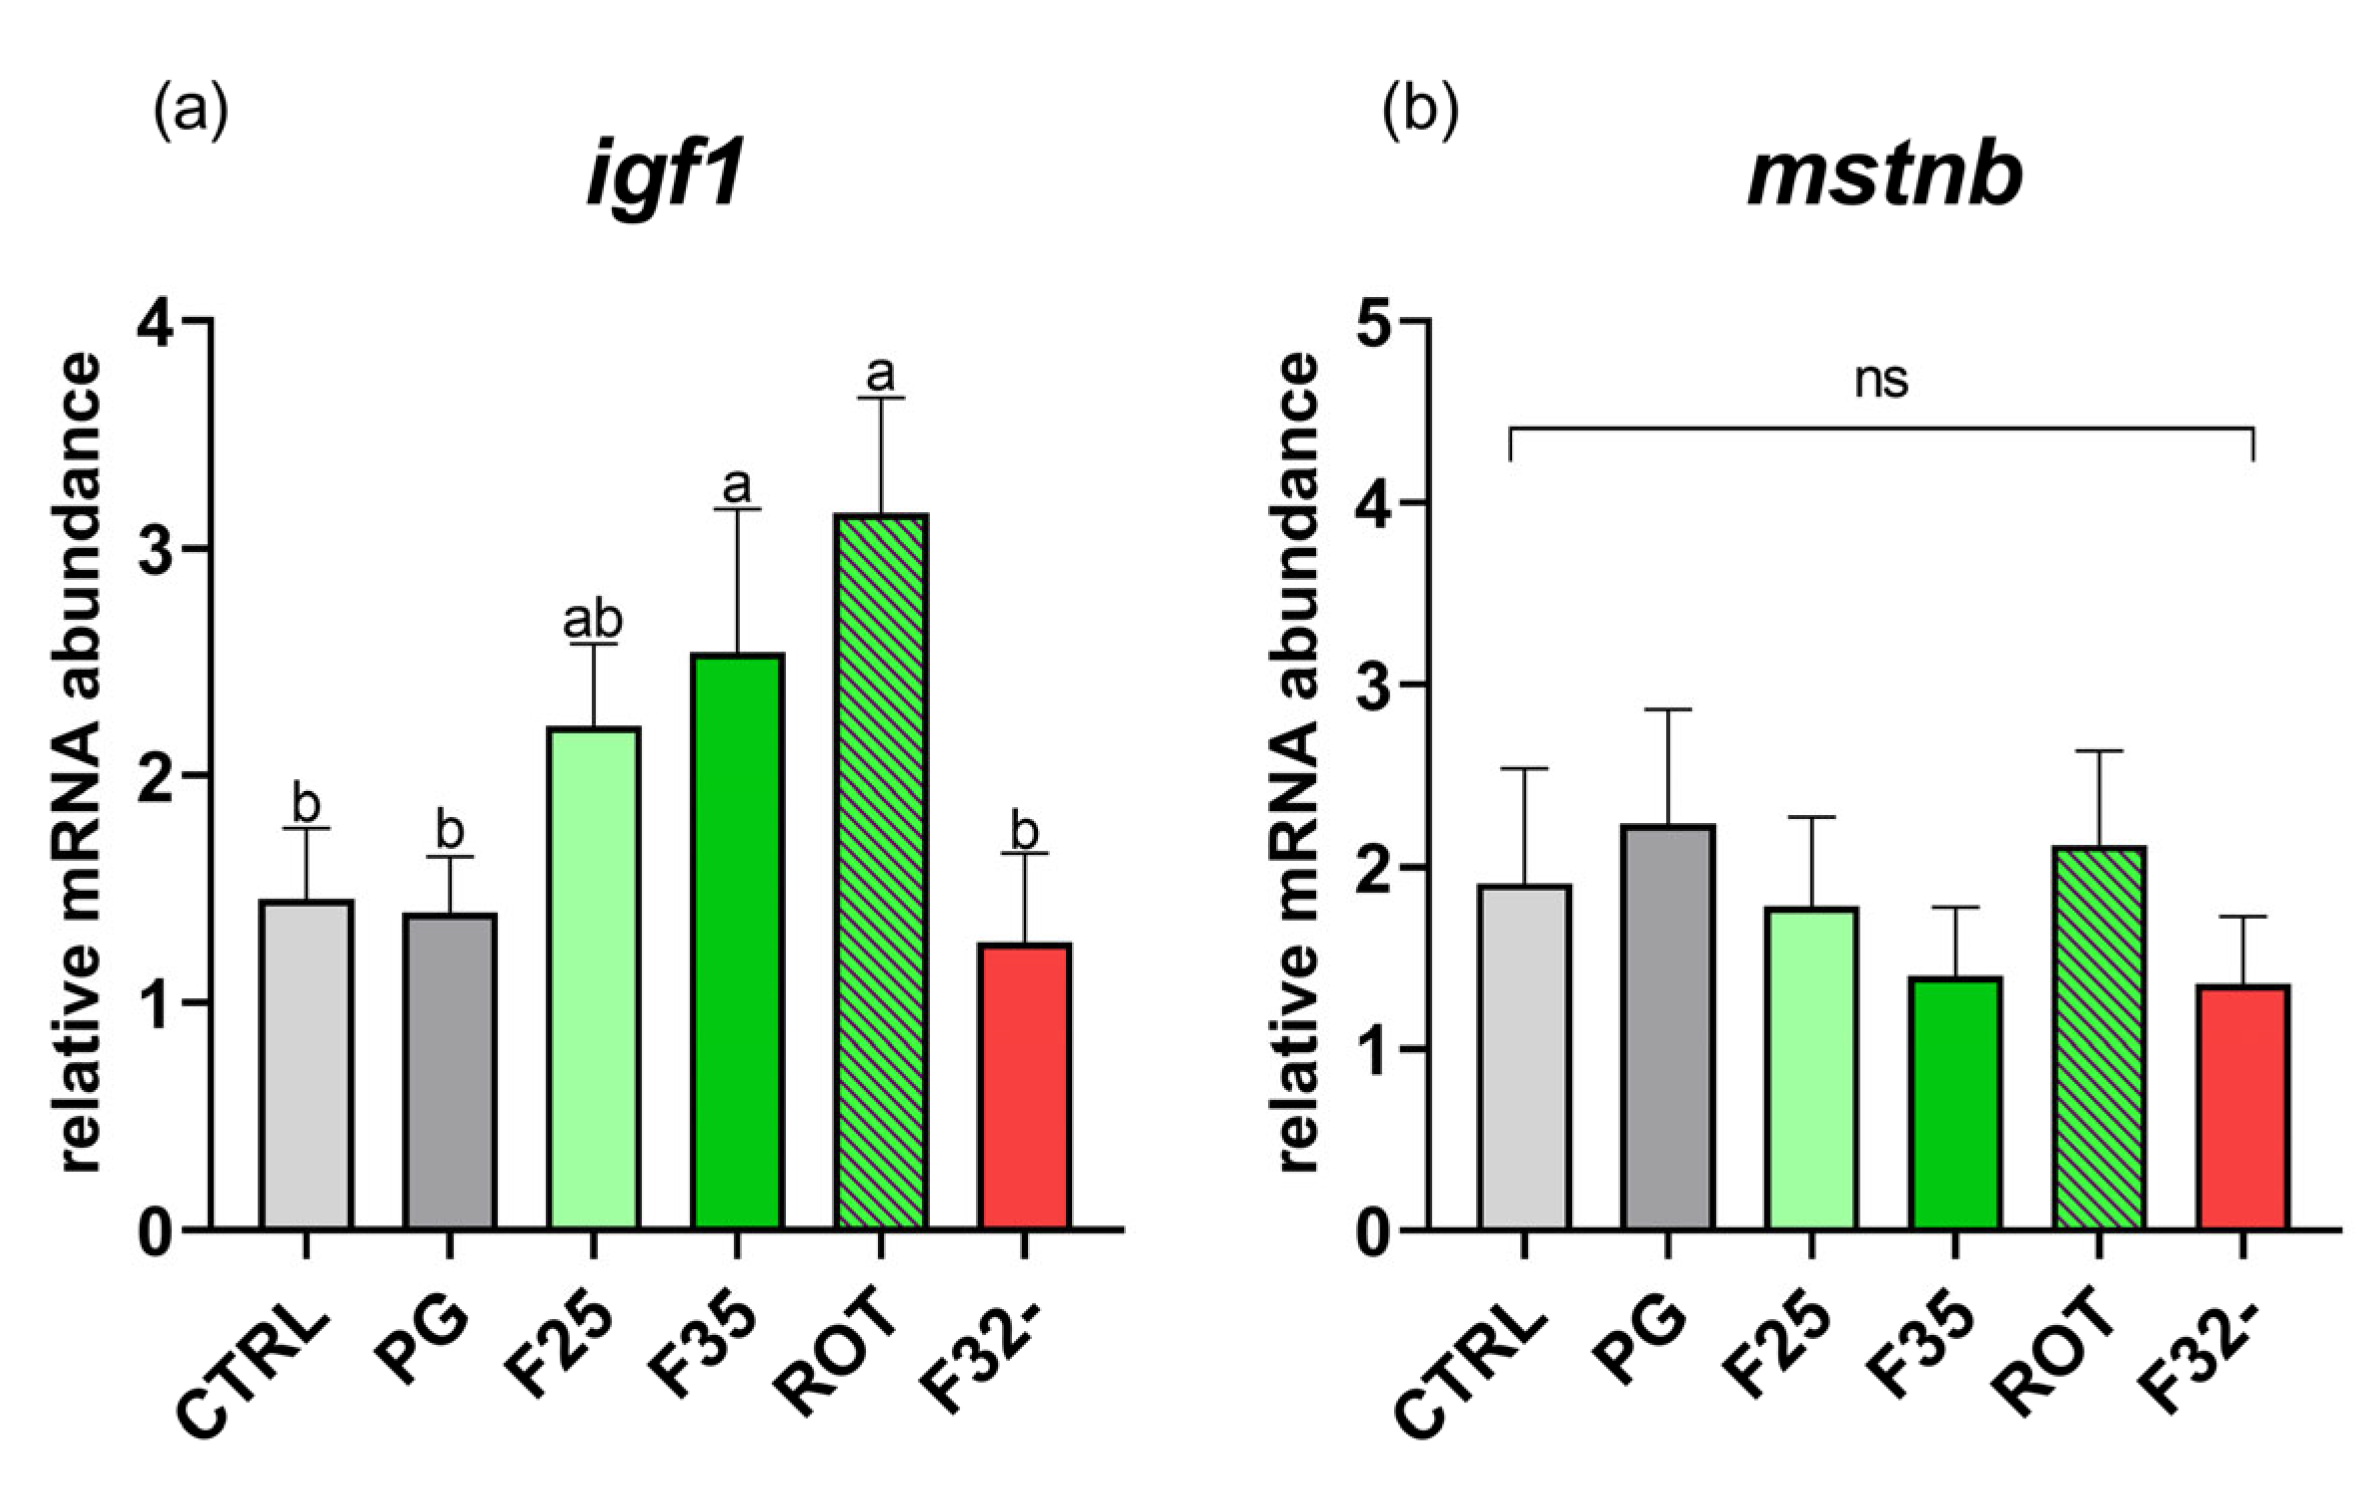
3.4. Real-Time PCR
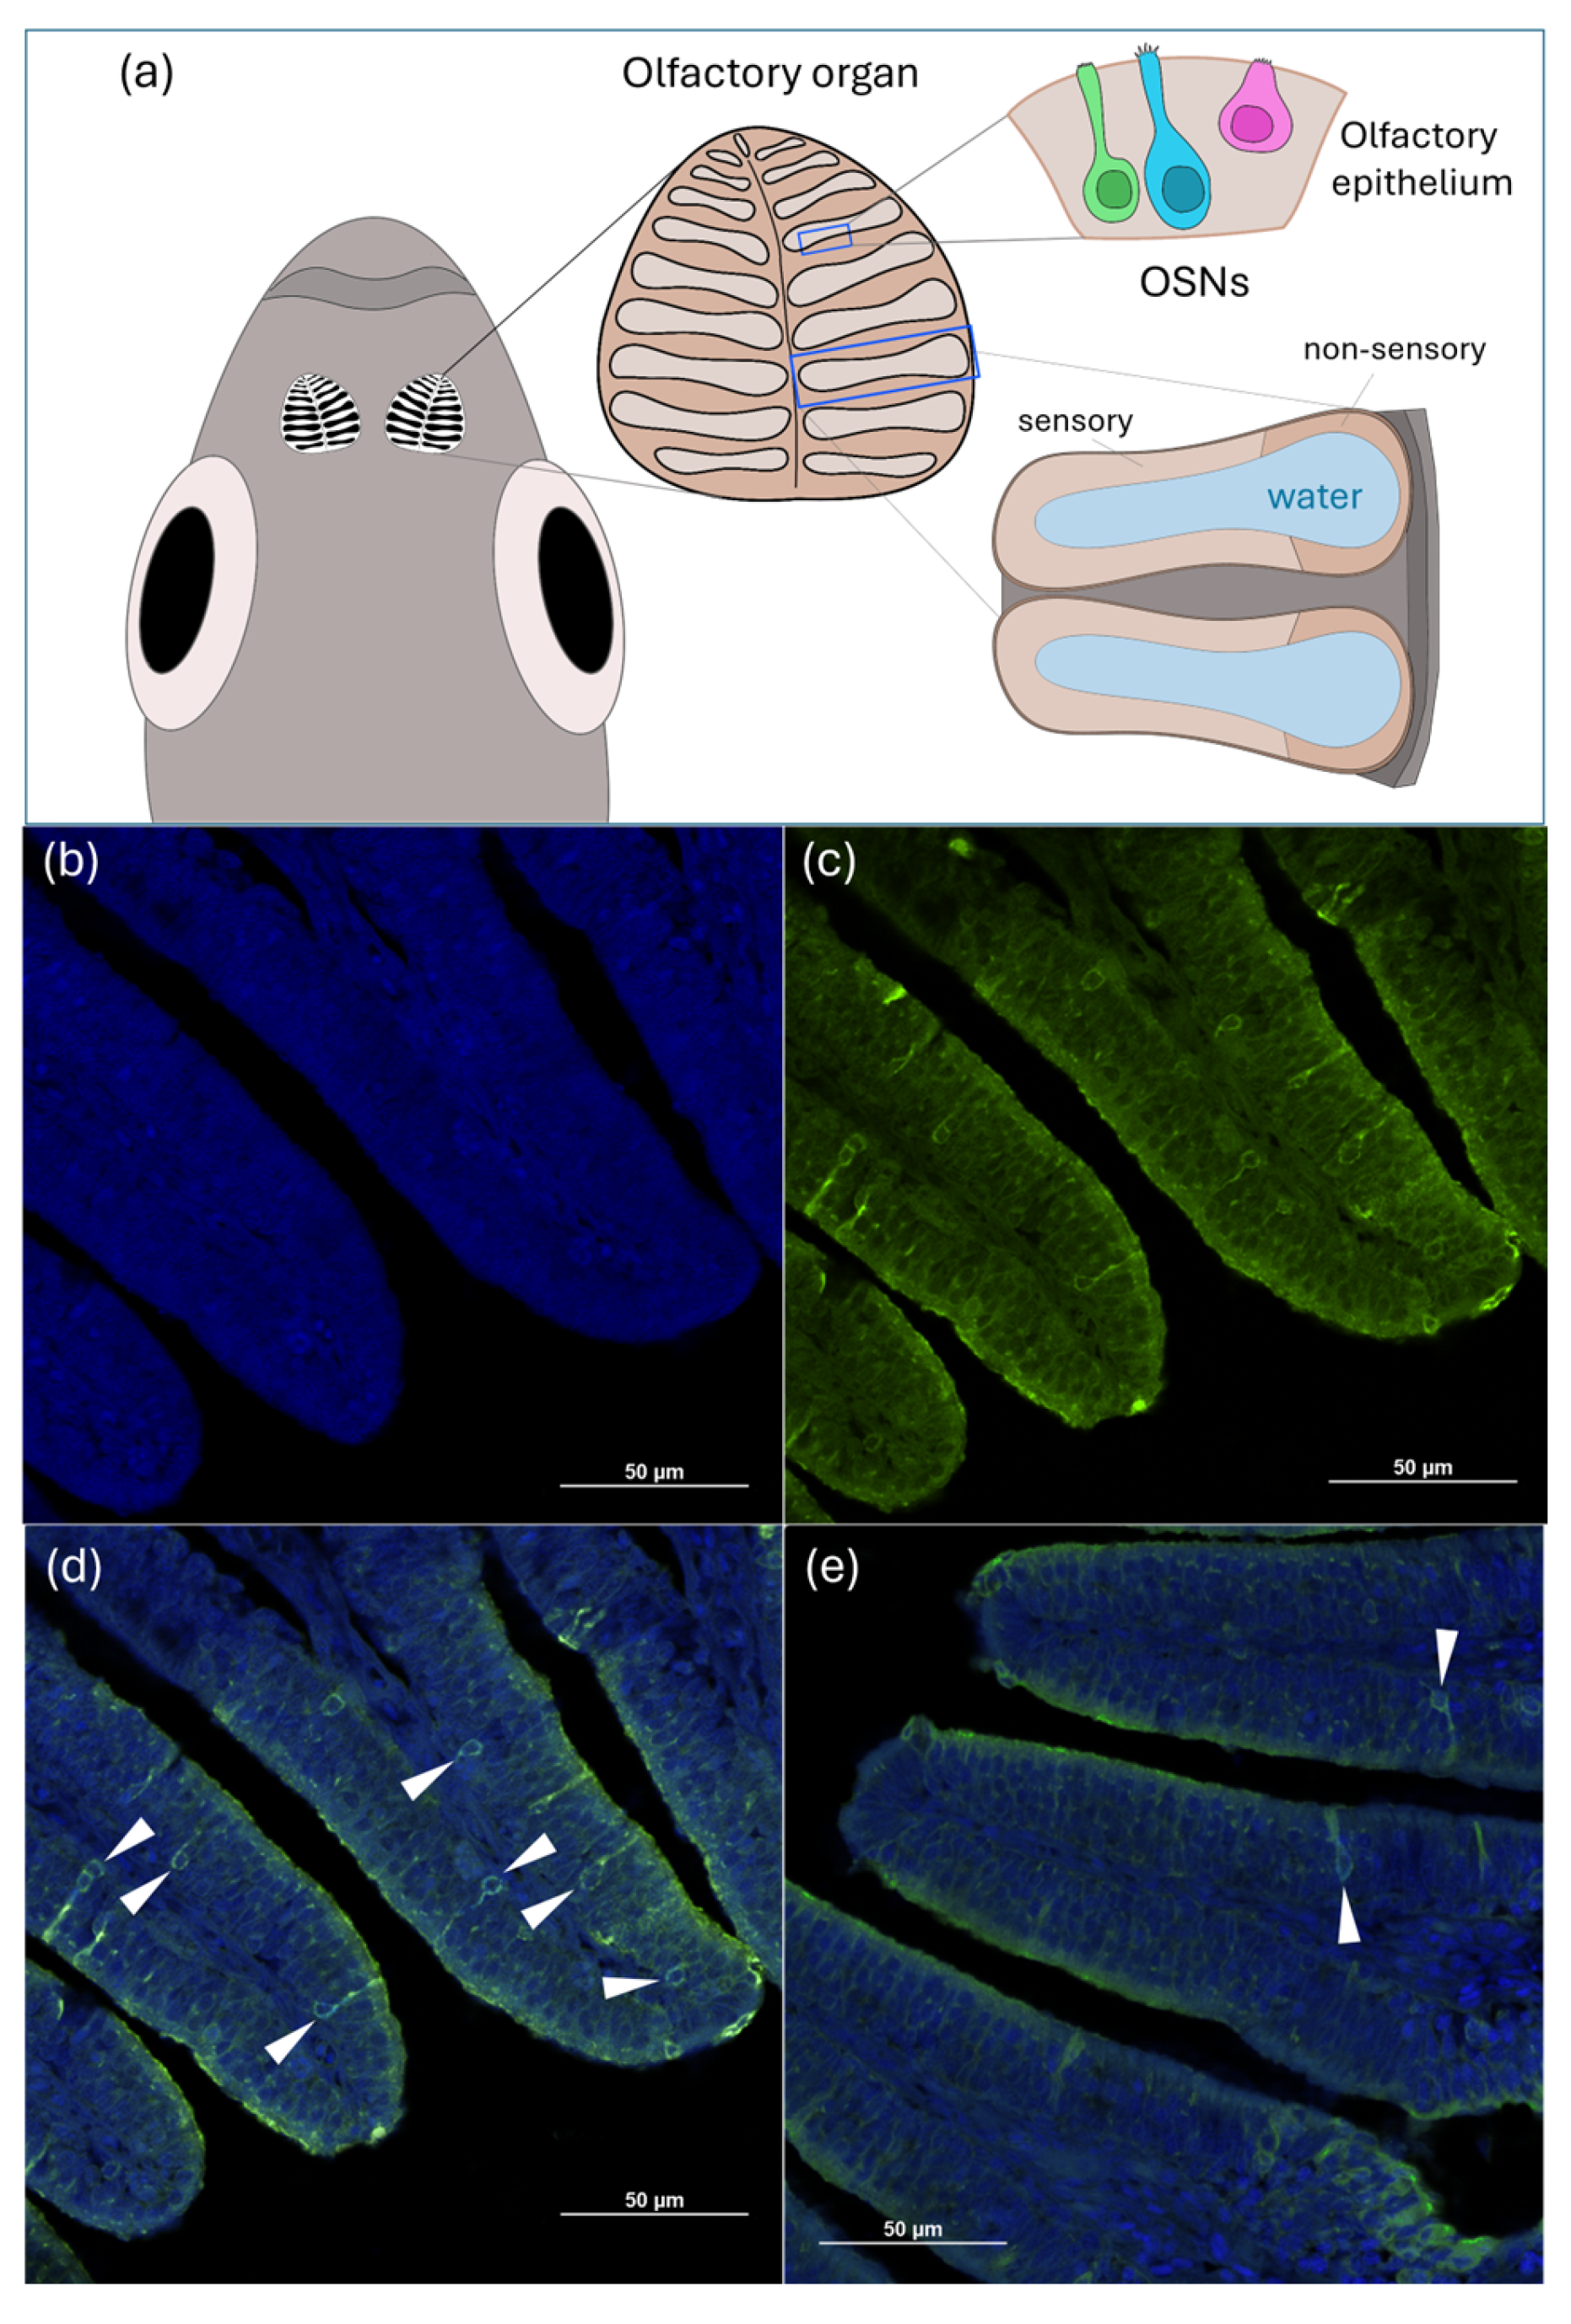
3.5. Immunohistochemistry in the Olfactory Epithelium
3.6. Reproductive Performances
3.6.1. Gonadosomatic Index
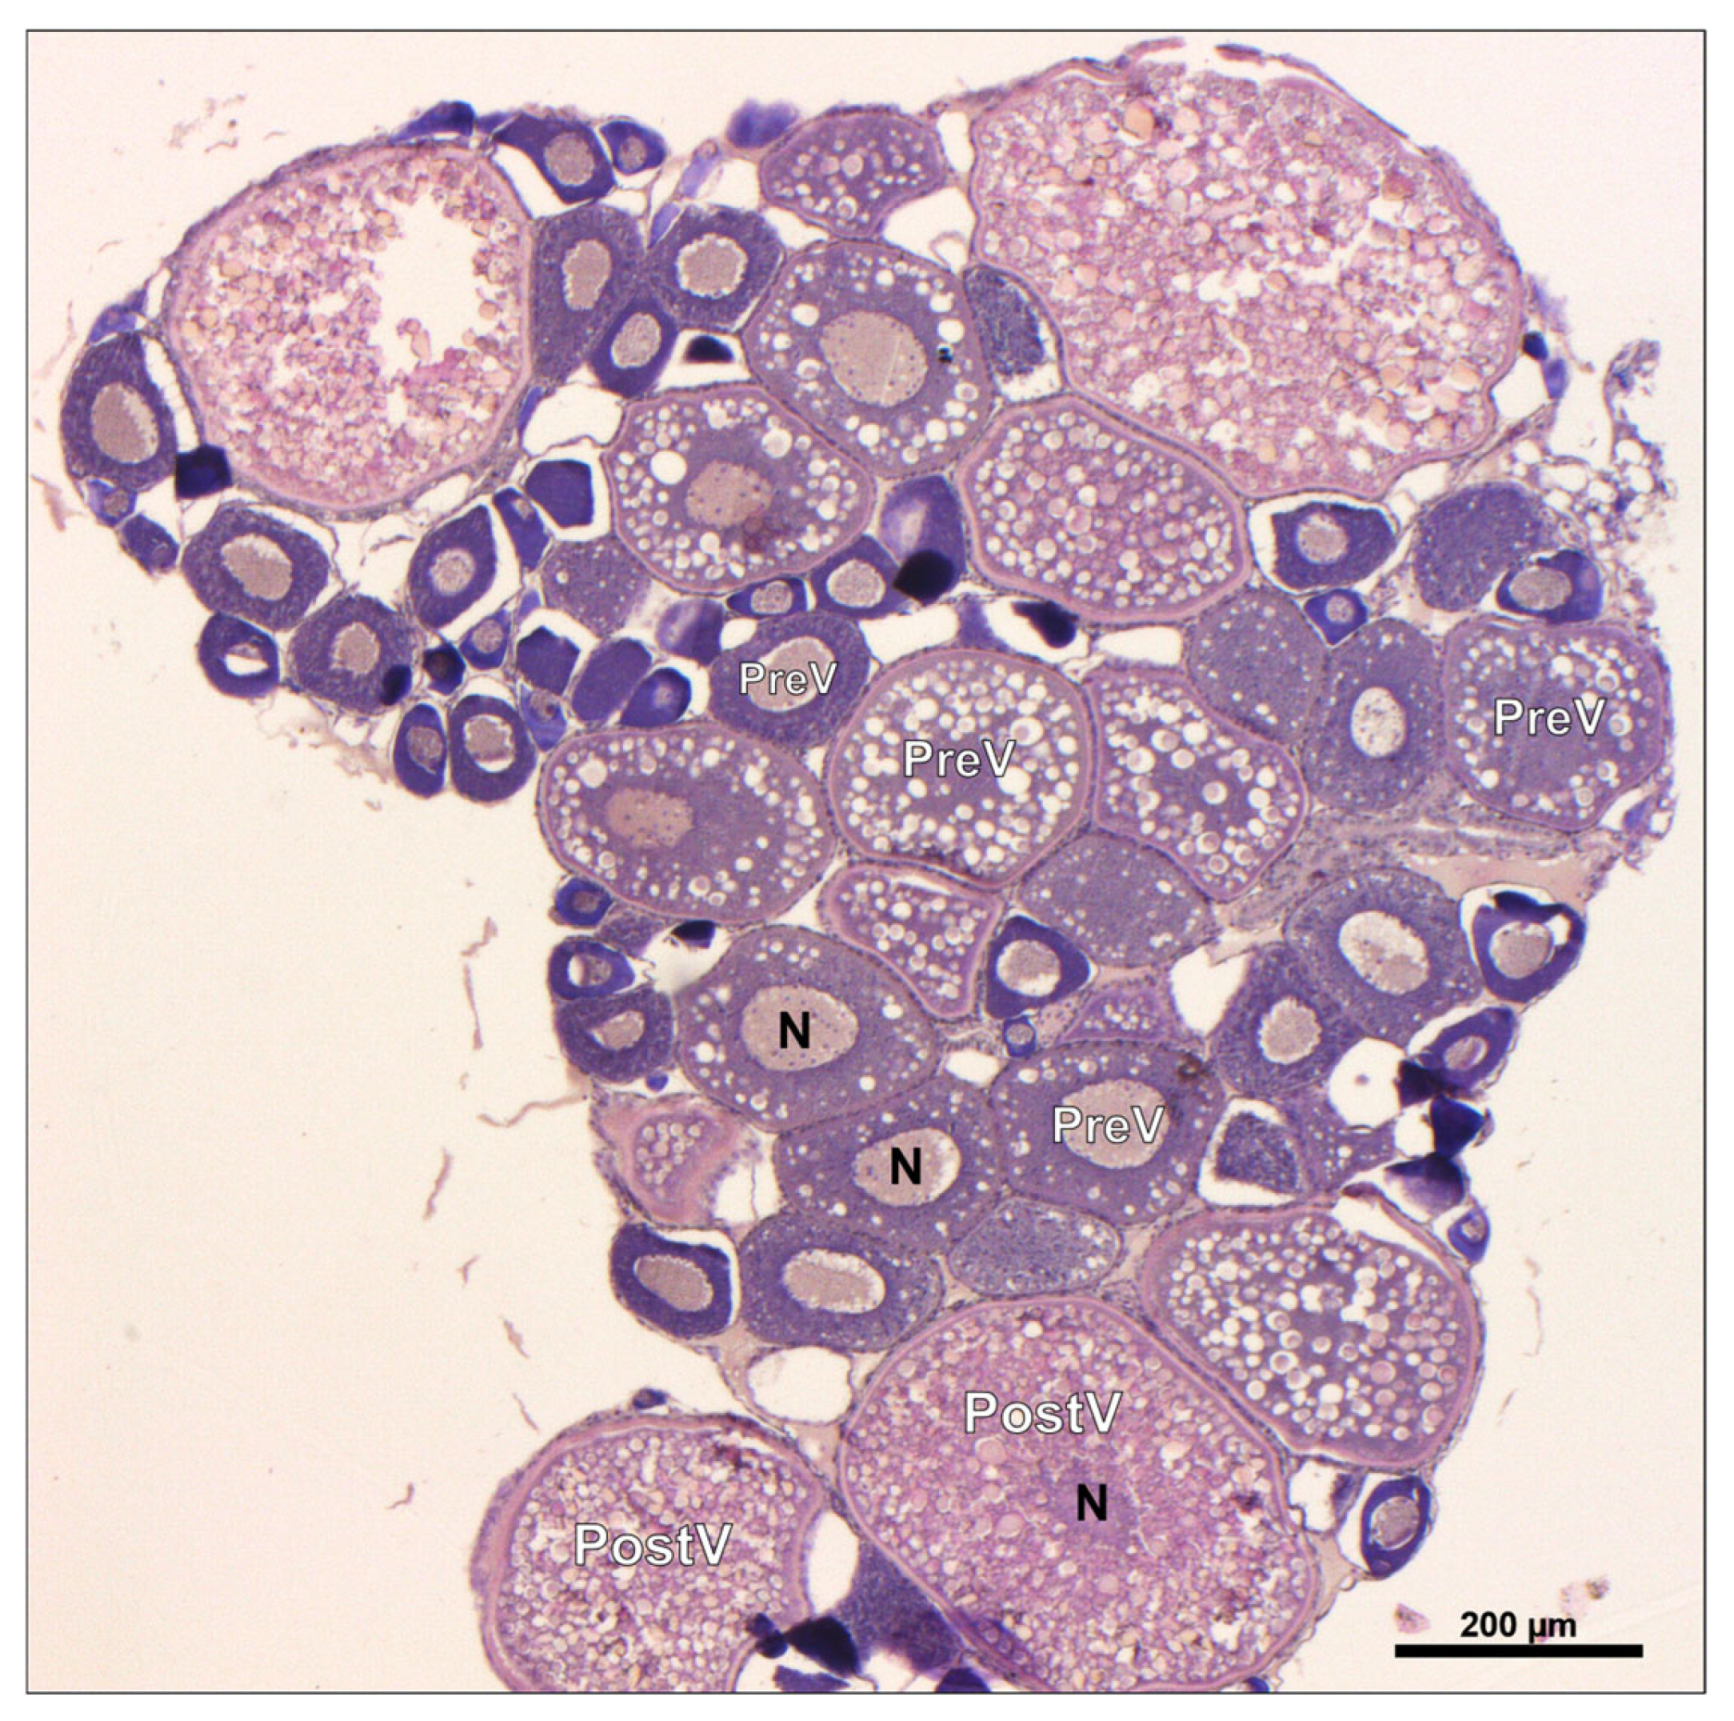
3.6.2. Histological Analysis of Ovaries
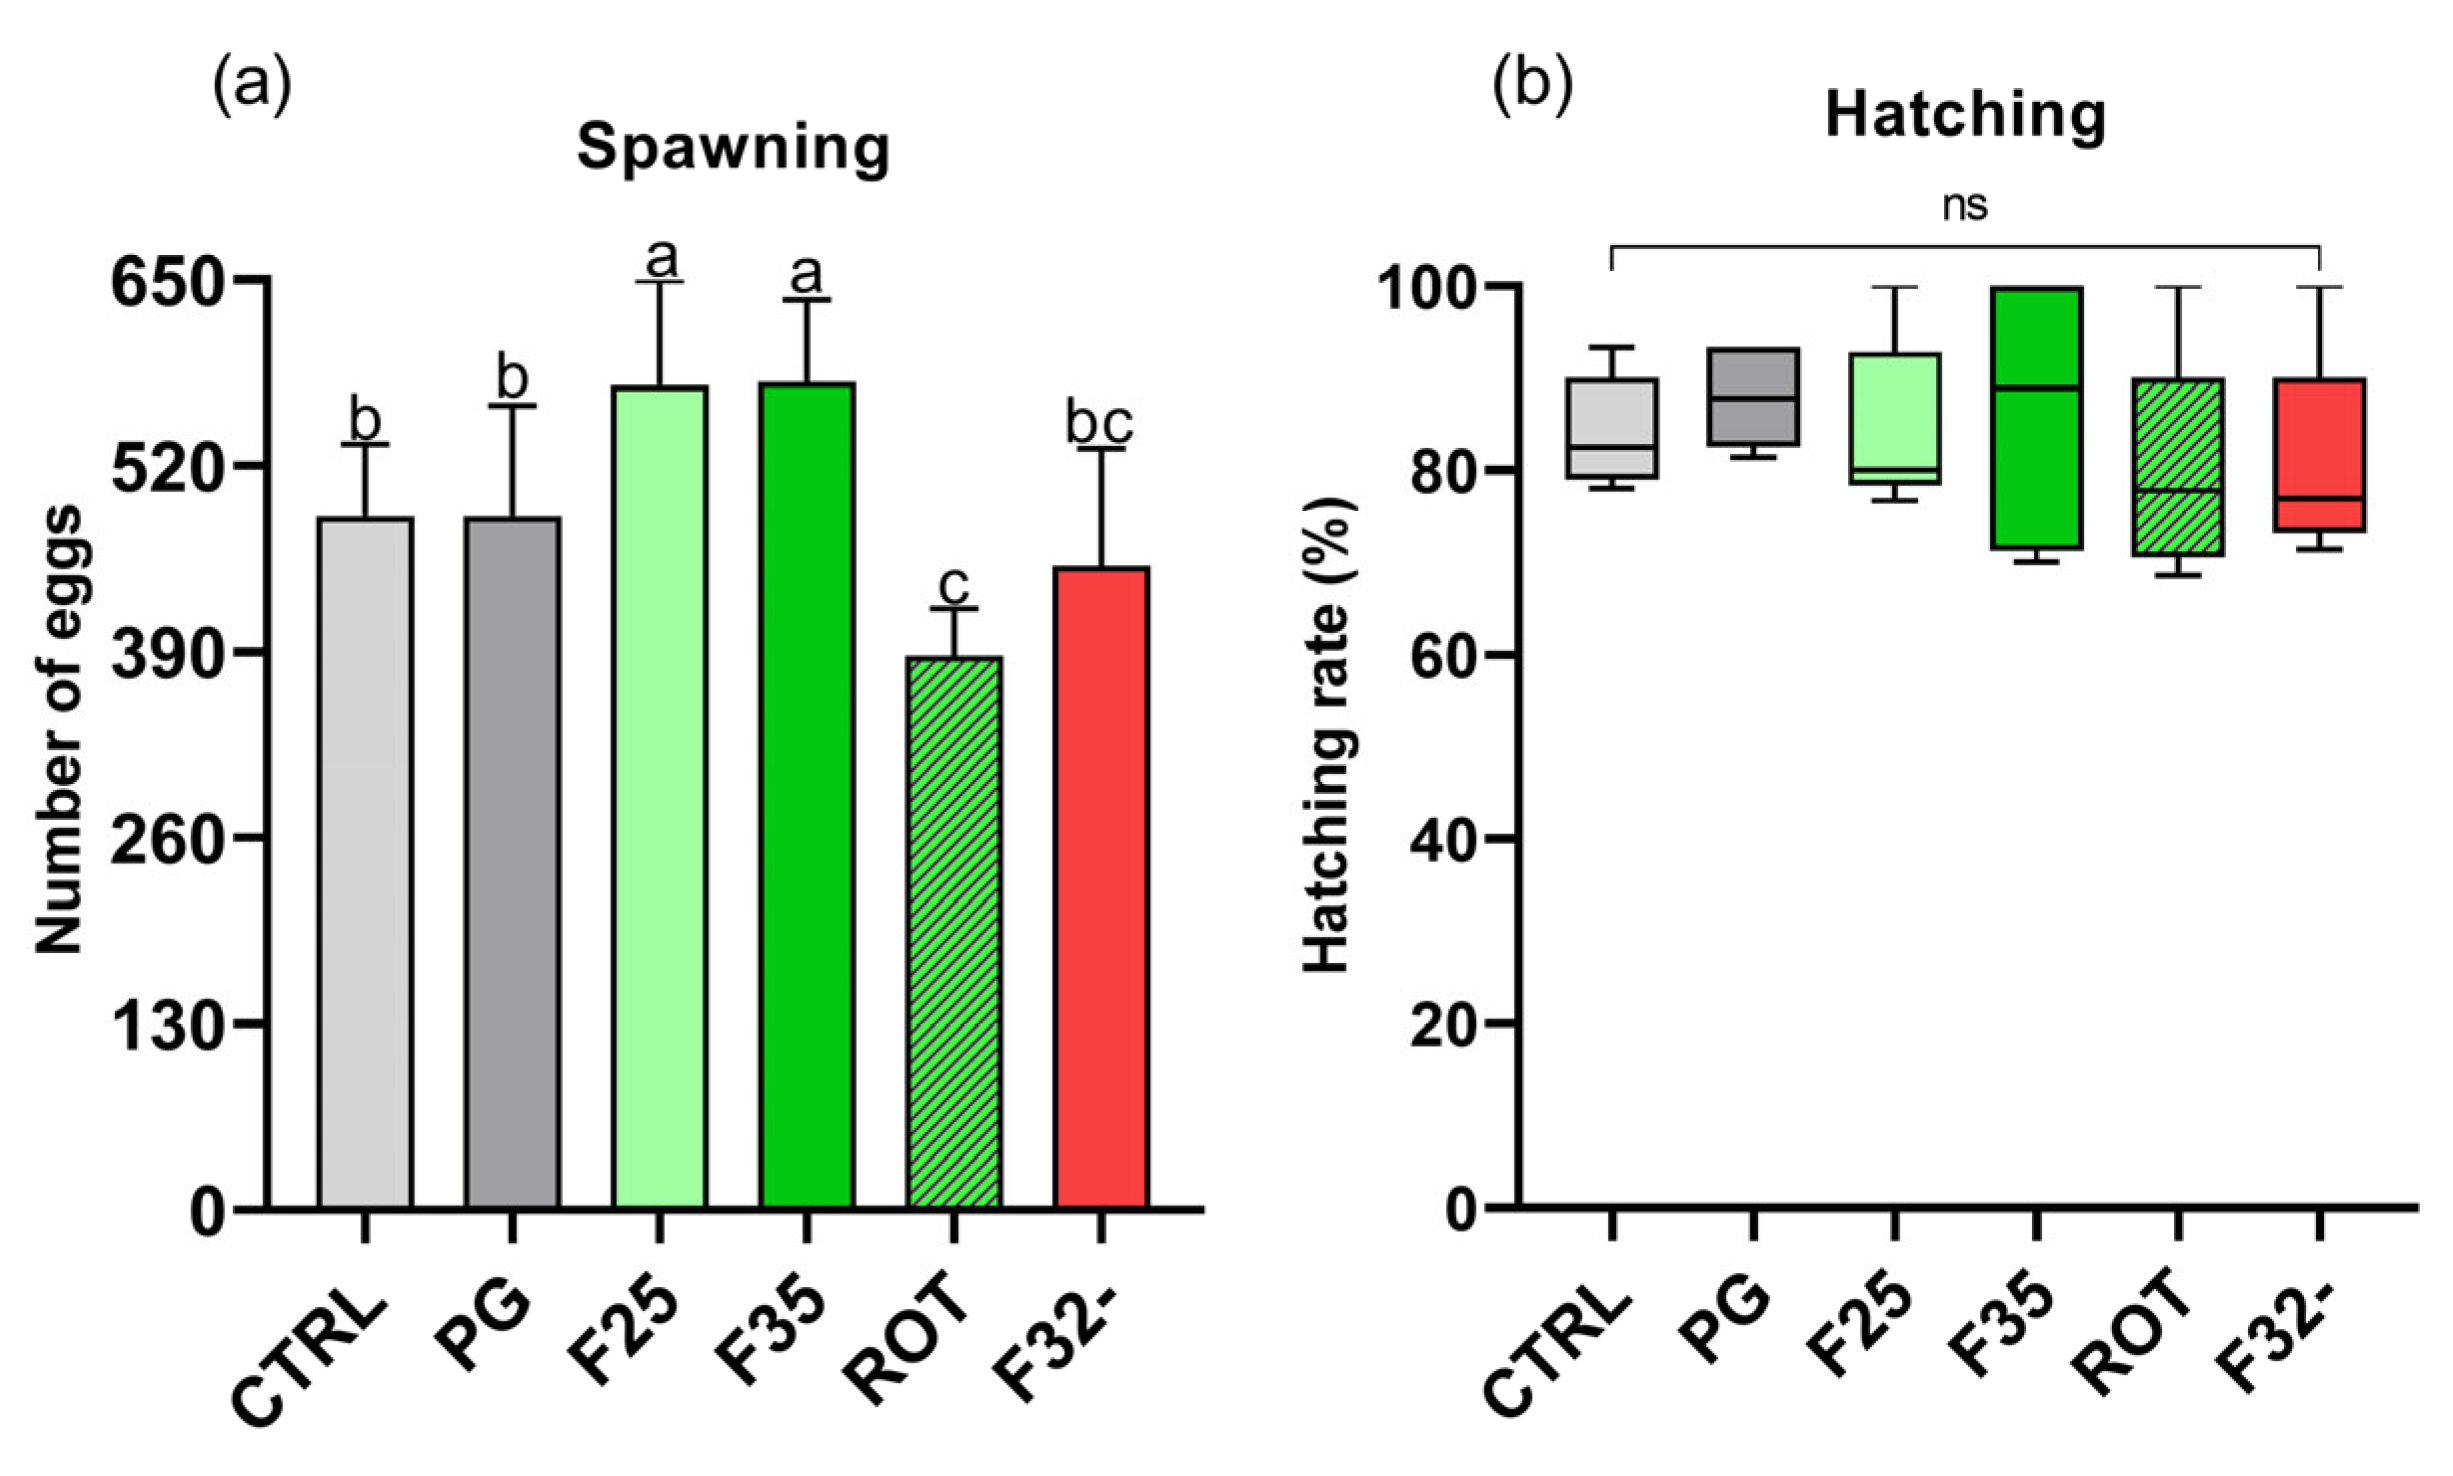
3.6.3. Spawned Eggs and Hatching Rate
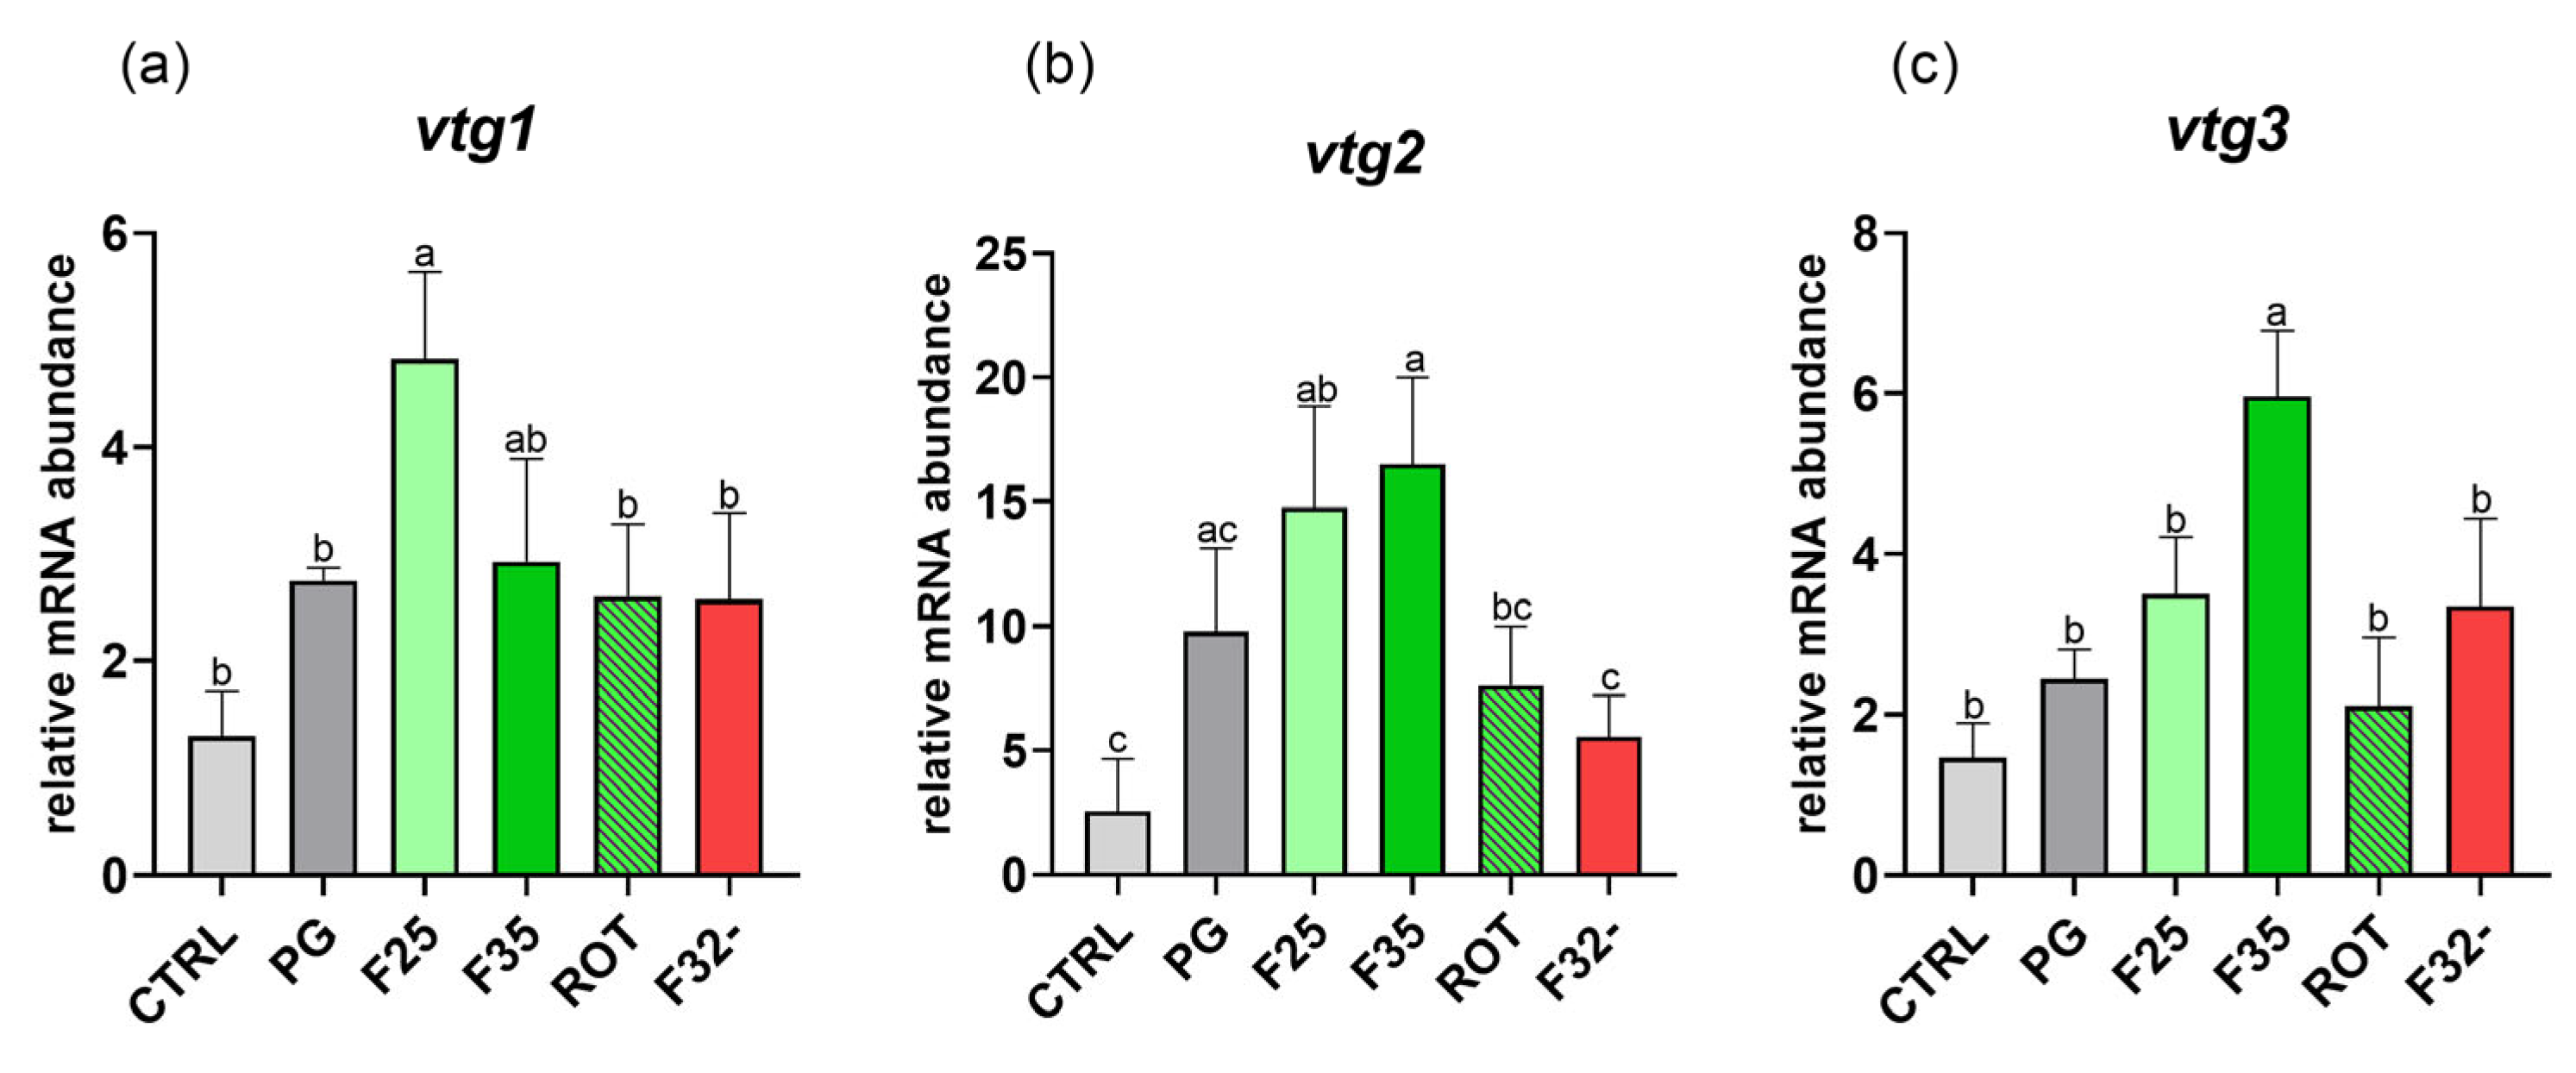
3.6.4. Vitellogenin Gene Expression
4. Discussion
5. Conclusions
Author Contributions
Funding
Institutional Review Board Statement
Informed Consent Statement
Data Availability Statement
Acknowledgments
Conflicts of Interest
References
- Jones, S.W.; Karpol, A.; Friedman, S.; Maru, B.T.; Tracy, B.P. Recent Advances in Single Cell Protein Use as a Feed Ingredient in Aquaculture. Curr. Opin. Biotechnol. 2020, 61, 189–197. [Google Scholar] [CrossRef]
- Chemello, G.; Zarantoniello, M.; Randazzo, B.; Gioacchini, G.; Truzzi, C.; Cardinaletti, G.; Riolo, P.; Olivotto, I. Effects of Black Soldier Fly (Hermetia illucens) Enriched with Schizochytrium Sp. on Zebrafish (Danio rerio) Reproductive Performances. Aquaculture 2022, 550, 737853. [Google Scholar] [CrossRef]
- Moutinho, S.; Peres, H.; Serra, C.; Martínez-Llorens, S.; Tomás-Vidal, A.; Jover-Cerdá, M.; Oliva-Teles, A. Meat and Bone Meal as Partial Replacement of Fishmeal in Diets for Gilthead Sea Bream (Sparus aurata) Juveniles: Diets Digestibility, Digestive Function, and Microbiota Modulation. Aquaculture 2017, 479, 721–731. [Google Scholar] [CrossRef]
- Randazzo, B.; Zarantoniello, M.; Cardinaletti, G.; Cerri, R.; Giorgini, E.; Belloni, A.; Contò, M.; Tibaldi, E.; Olivotto, I. Hermetia illucens and Poultry By-Product Meals as Alternatives to Plant Protein Sources in Gilthead Seabream (Sparus aurata) Diet: A Multidisciplinary Study on Fish Gut Status. Animals 2021, 11, 677. [Google Scholar] [CrossRef]
- Zarantoniello, M.; Pulido Rodriguez, L.F.; Randazzo, B.; Cardinaletti, G.; Giorgini, E.; Belloni, A.; Secci, G.; Faccenda, F.; Pulcini, D.; Parisi, G.; et al. Conventional Feed Additives or Red Claw Crayfish Meal and Dried Microbial Biomass as Feed Supplement in Fish Meal-Free Diets for Rainbow Trout (Oncorhynchus mykiss): Possible Ameliorative Effects on Growth and Gut Health Status. Aquaculture 2022, 554, 738137. [Google Scholar] [CrossRef]
- Hua, K.; Cobcroft, J.M.; Cole, A.; Condon, K.; Jerry, D.R.; Mangott, A.; Praeger, C.; Vucko, M.J.; Zeng, C.; Zenger, K.; et al. The Future of Aquatic Protein: Implications for Protein Sources in Aquaculture Diets. One Earth 2019, 1, 316–329. [Google Scholar] [CrossRef]
- Eroldoğan, O.T.; Glencross, B.; Novoveska, L.; Gaudêncio, S.P.; Rinkevich, B.; Varese, G.C.; de Fátima Carvalho, M.; Tasdemir, D.; Safarik, I.; Nielsen, S.L.; et al. From the Sea to Aquafeed: A Perspective Overview. Rev. Aquac. 2023, 15, 1028–1057. [Google Scholar] [CrossRef]
- Bandara, T. Alternative Feed Ingredients in Aquaculture: Opportunities and Challenges. J. Entomol. Zool. Stud. 2018, 6, 3087–3094. [Google Scholar]
- Calo, J.; Comesaña, S.; Fernández-Maestú, C.; Blanco, A.M.; Morais, S.; Soengas, J.L. Impact of Feeding Diets with Enhanced Vegetable Protein Content and Presence of Umami Taste-Stimulating Additive on Gastrointestinal Amino Acid Sensing and Feed Intake Regulation in Rainbow Trout. Aquaculture 2024, 579, 740251. [Google Scholar] [CrossRef]
- Elvy, J.E.; Symonds, J.E.; Hilton, Z.; Walker, S.P.; Tremblay, L.A.; Casanovas, P.; Herbert, N.A. The Relationship of Feed Intake, Growth, Nutrient Retention, and Oxygen Consumption to Feed Conversion Ratio of Farmed Saltwater Chinook Salmon (Oncorhynchus tshawytscha). Aquaculture 2022, 554, 738184. [Google Scholar] [CrossRef]
- Ballester-Moltó, M.; Sanchez-Jerez, P.; Cerezo-Valverde, J.; Aguado-Giménez, F. Particulate Waste Outflow from Fish-Farming Cages. How Much Is Uneaten Feed? Mar. Pollut. Bull. 2017, 119, 23–30. [Google Scholar] [CrossRef] [PubMed]
- Ferrer Llagostera, P.; Kallas, Z.; Reig, L.; Amores de Gea, D. The Use of Insect Meal as a Sustainable Feeding Alternative in Aquaculture: Current Situation, Spanish Consumers’ Perceptions and Willingness to Pay. J. Clean. Prod. 2019, 229, 10–21. [Google Scholar] [CrossRef]
- Hossain, M.S.; Small, B.C.; Kumar, V.; Hardy, R. Utilization of Functional Feed Additives to Produce Cost-effective, Ecofriendly Aquafeeds High in Plant-based Ingredients. Rev. Aquac. 2024, 16, 121–153. [Google Scholar] [CrossRef]
- Bai, S.C.; Hamidoghli, A.; Bae, J. Feed Additives: An Overview. In Feed and Feeding Practices in Aquaculture; Davis, D.A., Ed.; Woodhead Publishing Series in Food Science, Technology and Nutrition; Elsevier: Oxford, UK, 2022; pp. 195–229. ISBN 978-0-12-821598-2. [Google Scholar]
- Hancz, C. Feed Efficiency, Nutrient Sensing and Feeding Stimulation in Aquaculture: A Review. Acta Agrar. Kaposváriensis 2020, 24, 35–54. [Google Scholar] [CrossRef]
- Kasumyan, A.O. The Taste System in Fishes and the Effects of Environmental Variables. J. Fish Biol. 2019, 95, 155–178. [Google Scholar] [CrossRef] [PubMed]
- Calvo-Ochoa, E.; Byrd-Jacobs, C.A. The Olfactory System of Zebrafish as a Model for the Study of Neurotoxicity and Injury: Implications for Neuroplasticity and Disease. Int. J. Mol. Sci. 2019, 20, 1639. [Google Scholar] [CrossRef]
- Soengas, J.L.; Cerdá-Reverter, J.M.; Delgado, M.J. Central Regulation of Food Intake in Fish: An Evolutionary Perspective. J. Mol. Endocrinol. 2018, 60, R171–R199. [Google Scholar] [CrossRef]
- Volkoff, H. The Neuroendocrine Regulation of Food Intake in Fish: A Review of Current Knowledge. Front. Neurosci. 2016, 10, 540. [Google Scholar] [CrossRef]
- Rønnestad, I.; Gomes, A.S.; Murashita, K.; Angotzi, R.; Jönsson, E.; Volkoff, H. Appetite-Controlling Endocrine Systems in Teleosts. Front. Endocrinol. 2017, 8, 73. [Google Scholar] [CrossRef] [PubMed]
- Gong, N.; Jönsson, E.; Björnsson, B.T. Acute Anorexigenic Action of Leptin in Rainbow Trout Is Mediated by the Hypothalamic Pi3k Pathway. J. Mol. Endocrinol. 2016, 56, 227–238. [Google Scholar] [CrossRef] [PubMed]
- Gorissen, M.H.A.G.; Flik, G.; Huising, M.O. Peptides and Proteins Regulating Food Intake: A Comparative View. Anim. Biol. 2006, 56, 447–473. [Google Scholar] [CrossRef]
- Root, C.M.; Ko, K.I.; Jafari, A.; Wang, J.W. Presynaptic Facilitation by Neuropeptide Signaling Mediates Odor-Driven Food Search. Cell 2011, 145, 133–144. [Google Scholar] [CrossRef] [PubMed]
- Sengupta, P. The Belly Rules the Nose: Feeding State-Dependent Modulation of Peripheral Chemosensory Responses. Curr. Opin. Neurobiol. 2013, 23, 68–75. [Google Scholar] [CrossRef] [PubMed]
- de Pedro, N.; Björnsson, B.T. Regulation of Food Intake by Neuropeptides and Hormones. In Food Intake Fish; Houlihan, D., Boujard, T., Jobling, M., Eds.; Wiley: Hoboken, NJ, USA, 2001; pp. 269–296. [Google Scholar] [CrossRef]
- De Macedo, I.C.; De Freitas, J.S.; Da Silva Torres, I.L. The Influence of Palatable Diets in Reward System Activation: A Mini Review. Adv. Pharmacol. Sci. 2016, 2016, 7238679. [Google Scholar] [CrossRef] [PubMed]
- Suresh, A.V.; Kumaraguru vasagam, K.P.; Nates, S. Attractability and Palatability of Protein Ingredients of Aquatic and Terrestrial Animal Origin, and Their Practical Value for Blue Shrimp, Litopenaeus Stylirostris Fed Diets Formulated with High Levels of Poultry Byproduct Meal. Aquaculture 2011, 319, 132–140. [Google Scholar] [CrossRef]
- Bureau, D.P.; Harris, A.M.; Bevan, D.J.; Simmons, L.A.; Azevedo, P.A.; Cho, C.Y. Feather Meals and Meat and Bone Meals from Different Origins as Protein Sources in Rainbow Trout (Oncorhynchus mykiss) Diets. Aquaculture 2000, 181, 281–291. [Google Scholar] [CrossRef]
- Goda, A.M.; El-Haroun, E.R.; Kabir Chowdhury, M.A. Effect of Totally or Partially Replacing Fish Meal by Alternative Protein Sources on Growth of African Catfish Clarias gariepinus (Burchell, 1822) Reared in Concrete Tanks. Aquac. Res. 2007, 38, 279–287. [Google Scholar] [CrossRef]
- Di Peng; Peng, B.; Li, J.; Zhang, Y.; Luo, H.; Xiao, Q.; Tang, S.; Liang, X.F. Effects of Three Feed Attractants on the Growth, Biochemical Indicators, Lipid Metabolism and Appetite of Chinese Perch (Siniperca chuatsi). Aquac. Reports 2022, 23, 101–116. [Google Scholar] [CrossRef]
- Tusche, K.; Berends, K.; Wuertz, S.; Susenbeth, A.; Schulz, C. Evaluation of Feed Attractants in Potato Protein Concentrate Based Diets for Rainbow Trout (Oncorhynchus mykiss). Aquaculture 2011, 321, 54–60. [Google Scholar] [CrossRef]
- Li, X.; Fang, T.; Wang, J.; Wang, Z.; Guan, D.; Sun, H.; Yun, X.; Zhou, J. The Efficiency of Adding Amino Acid Mixtures to a Diet Free of Fishmeal and Soybean Meal as an Attractant in Yellow River Carp (Cyprinus carpio Var.). Aquac. Reports 2022, 24, 101189. [Google Scholar] [CrossRef]
- Conti, F.; Zarantoniello, M.; Antonucci, M.; Cattaneo, N.; Rattin, M.; De Russi, G.; Secci, G.; Lucon-Xiccato, T.; Lira de Medeiros, A.C.; Olivotto, I. The Application of Synthetic Flavors in Zebrafish (Danio rerio) Rearing with Emphasis on Attractive Ones: Effects on Fish Development, Welfare, and Appetite. Animals 2023, 13, 3368. [Google Scholar] [CrossRef]
- Piferrer, F.; Ribas, L. The Use of the Zebrafish as a Model in Fish Aquaculture Research. Fish Physiol. 2020, 38, 273–313. [Google Scholar] [CrossRef]
- Ribas, L.; Piferrer, F. The Zebrafish (Danio rerio) as a Model Organism, with Emphasis on Applications for Finfish Aquaculture Research. Rev. Aquac. 2014, 6, 209–240. [Google Scholar] [CrossRef]
- Williams, M.B.; Lawrence, A.L.; Chehade, S.B.; Yuan, Y.; Fowler, A.L.; Barry, R.J.; Powell, M.L.; Watts, S.A. Zebrafish Danio rerio Exhibit Positive Growth Profiles When Fed Dietary Yeast and Bacterial-based Single-cell Protein as a Replacement for Fish Protein Hydrolysate. N. Am. J. Aquac. 2023, 85, 252–261. [Google Scholar] [CrossRef]
- Tampou, A.; Andreopoulou, S.; Vasilaki, A.; Nengas, I.; Berillis, P.; Gisbert, E.; Karapanagiotidis, I.T.; Antonopoulou, E.; Mente, E. Growth Performance of Gilthead Sea Bream (Sparus aurata) Fed a Mixture of Single Cell Ingredients for Organic Diets. Aquac. Reports 2024, 36, 102105. [Google Scholar] [CrossRef]
- Vizcaíno, A.J.; Sáez, M.I.; Galafat, A.; Galindo-Melero, R.; Perera, E.; Casal-Porras, I.; Zubía, E.; Vega, J.; Figueroa, F.L.; Martínez, T.F.; et al. Effects of Feeding European Seabass (Dicentrarchus labrax) Juveniles with Crude, Hydrolysed and Fermented Biomass of the Invasive Macroalga Rugulopteryx Okamurae (Ochrophyta). Aquac. Reports 2024, 34, 101877. [Google Scholar] [CrossRef]
- Osimani, A.; Milanović, V.; Roncolini, A.; Riolo, P.; Ruschioni, S.; Isidoro, N.; Loreto, N.; Franciosi, E.; Tuohy, K.; Olivotto, I.; et al. Hermetia illucens in Diets for Zebrafish (Danio rerio): A Study of Bacterial Diversity by Using PCR-DGGE and Metagenomic Sequencing. PLoS ONE 2019, 14, e0225956. [Google Scholar] [CrossRef]
- Clelland, E.; Peng, C. Endocrine/Paracrine Control of Zebrafish Ovarian Development. Mol. Cell. Endocrinol. 2009, 312, 42–52. [Google Scholar] [CrossRef]
- Lubzens, E.; Bobe, J.; Young, G.; Sullivan, C.V. Maternal Investment in Fish Oocytes and Eggs: The Molecular Cargo and Its Contributions to Fertility and Early Development. Aquaculture 2017, 472, 107–143. [Google Scholar] [CrossRef]
- Weltzien, F.-A.; Andersson, E.; Andersen, Ø.; Shalchian-Tabrizi, K.; Norberg, B. The Brain–Pituitary–Gonad Axis in Male Teleosts, with Special Emphasis on Flatfish (Pleuronectiformes). Comp. Biochem. Physiol. Part A Mol. Integr. Physiol. 2004, 137, 447–477. [Google Scholar] [CrossRef]
- McBride, R.S.; Somarakis, S.; Fitzhugh, G.R.; Albert, A.; Yaragina, N.A.; Wuenschel, M.J.; Alonso-Fernández, A.; Basilone, G. Energy Acquisition and Allocation to Egg Production in Relation to Fish Reproductive Strategies. Fish Fish. 2015, 16, 23–57. [Google Scholar] [CrossRef]
- Brooks, S.; Tyler, C.R.; Sumpter, J.P. Egg Quality in Fish: What Makes a Good Egg? Rev. Fish Biol. Fish. 1997, 7, 387–416. [Google Scholar] [CrossRef]
- Yilmaz, O.; Patinote, A.; Nguyen, T.; Bobe, J. Multiple Vitellogenins in Zebrafish (Danio rerio): Quantitative Inventory of Genes, Transcripts and Proteins, and Relation to Egg Quality. Fish Physiol. Biochem. 2018, 44, 1509–1525. [Google Scholar] [CrossRef] [PubMed]
- Izquierdo, M.; Fernández-Palacios, H.; Tacon, A.G. Effect of Broodstock Nutrition on Reproductive Performance of Fish. Aquaculture 2001, 197, 25–42. [Google Scholar] [CrossRef]
- Volkoff, H.; London, S. Nutrition and Reproduction in Fish. In Encyclopedia of Reproduction; Skinner, M.K., Ed.; Elsevier: Amsterdam, The Netherlands, 2018; pp. 743–748. ISBN 9780128151457. [Google Scholar]
- Rainuzzo, J.R.; Reitan, K.I.; Olsen, Y. The Significance of Lipids at Early Stages of Marine Fish: A Review. Aquaculture 1997, 155, 103–115. [Google Scholar] [CrossRef]
- Zufall, F.; Leinders-Zufall, T. The Cellular and Molecular Basis of Odor Adaptation. Chem. Senses 2000, 25, 473–481. [Google Scholar] [CrossRef]
- Olivotto, I.; Yasumasu, S.; Gioacchini, G.; Maradonna, F.; Cionna, C.; Carnevali, O. Cloning and Expression of High Choriolytic Enzyme, a Component of the Hatching Enzyme System, during Embryonic Development of the Marine Ornamental Fish Chrysiptera parasema. Mar. Biol. 2004, 145, 1235–1241. [Google Scholar] [CrossRef]
- Rashidian, G.; Moosazadeh Moghaddam, M.; Mirnejad, R.; Mohammadi Azad, Z. Supplementation of Zebrafish (Danio rerio) Diet Using a Short Antimicrobial Peptide: Evaluation of Growth Performance, Immunomodulatory Function, Antioxidant Activity, and Disease Resistance. Fish Shellfish Immunol. 2021, 119, 42–50. [Google Scholar] [CrossRef]
- Zarantoniello, M.; Randazzo, B.; Cardinaletti, G.; Truzzi, C.; Chemello, G.; Riolo, P.; Olivotto, I. Possible Dietary Effects of Insect-Based Diets across Zebrafish (Danio rerio) Generations: A Multidisciplinary Study on the Larval Phase. Animals 2021, 11, 751. [Google Scholar] [CrossRef]
- Alves, D.R.S.; de Oliveira, S.R.; Luczinski, T.G.; Paulo, I.G.P.; Boscolo, W.R.; Bittencourt, F.; Signor, A. Palatability of Protein Hydrolysates from Industrial Byproducts for Nile Tilapia Juveniles. Animals 2019, 9, 311. [Google Scholar] [CrossRef]
- Randazzo, B.; Zarantoniello, M.; Gioacchini, G.; Giorgini, E.; Truzzi, C.; Notarstefano, V.; Cardinaletti, G.; Huyen, K.T.; Carnevali, O.; Olivotto, I. Can Insect-Based Diets Affect Zebrafish (Danio rerio) Reproduction? A Multidisciplinary Study. Zebrafish 2020, 17, 287–304. [Google Scholar] [CrossRef]
- Randazzo, B.; Rolla, L.; Ofelio, C.; Planas, M.; Gioacchini, G.; Vargas, A.; Giorgini, E.; Olivotto, I. The Influence of Diet on the Early Development of Two Seahorse Species (H. guttulatus and H. reidi): Traditional and Innovative Approaches. Aquaculture 2018, 490, 75–90. [Google Scholar] [CrossRef]
- Villamayor, P.R.; Arana, Á.J.; Coppel, C.; Ortiz-Leal, I.; Torres, M.V.; Sanchez-Quinteiro, P.; Sánchez, L. A Comprehensive Structural, Lectin and Immunohistochemical Characterization of the Zebrafish Olfactory System. Sci. Rep. 2021, 11, 8865. [Google Scholar] [CrossRef]
- Byrd, C.A.; Brunjes, P.C. Organization of the Olfactory System in the Adult Zebrafish: Histological, Immunohistochemical, and Quantitative Analysis. J. Comp. Neurol. 1995, 358, 247–259. [Google Scholar] [CrossRef] [PubMed]
- Hansen, A.; Zeiske, E. The Peripheral Olfactory Organ of the Zebrafish, Danio Rerio: An Ultrastructural Study. Chem. Senses 1998, 23, 39–48. [Google Scholar] [CrossRef] [PubMed]
- Hansen, A.; Zielinski, B.S. Diversity in the Olfactory Epithelium of Bony Fishes: Development, Lamellar Arrangement, Sensory Neuron Cell Types and Transduction Components. J. Neurocytol. 2005, 34, 183–208. [Google Scholar] [CrossRef] [PubMed]
- Lombó, M.; Giommi, C.; Paolucci, M.; Notarstefano, V.; Montik, N.; Delli Carpini, G.; Ciavattini, A.; Ragusa, A.; Maradonna, F.; Giorgini, E.; et al. Preeclampsia Correlates with an Increase in Cannabinoid Receptor 1 Levels Leading to Macromolecular Alterations in Chorionic Villi of Term Placenta. Int. J. Mol. Sci. 2022, 23, 12931. [Google Scholar] [CrossRef]
- Kaniganti, T.; Deogade, A.; Maduskar, A.; Mukherjee, A.; Guru, A.; Subhedar, N.; Ghose, A. Sensitivity of Olfactory Sensory Neurons to Food Cues Is Tuned to Nutritional States by Neuropeptide Y Signaling. J. Neurochem. 2021, 159, 1028–1044. [Google Scholar] [CrossRef]
- Olivotto, I.; Tokle, N.E.; Nozzi, V.; Cossignani, L.; Carnevali, O. Preserved Copepods as a New Technology for the Marine Ornamental Fish Aquaculture: A Feeding Study. Aquaculture 2010, 308, 124–131. [Google Scholar] [CrossRef]
- Cattaneo, N.; Zarantoniello, M.; Conti, F.; Frontini, A.; Chemello, G.; Dimichino, B.; Marongiu, F.; Cardinaletti, G.; Gioacchini, G.; Olivotto, I. Dietary Microplastic Administration during Zebrafish (Danio rerio) Development: A Comprehensive and Comparative Study between Larval and Juvenile Stages. Animals 2023, 13, 2256. [Google Scholar] [CrossRef]
- Shang, S.; Long, L.; Lin, S.; Cong, F. Automatic Zebrafish Egg Phenotype Recognition from Bright-Field Microscopic Images Using Deep Convolutional Neural Network. Appl. Sci. 2019, 9, 3362. [Google Scholar] [CrossRef]
- Kermen, F.; Franco, L.M.; Wyatt, C.; Yaksi, E. Neural Circuits Mediating Olfactory-Driven Behavior in Fish. Front. Neural Circuits 2013, 7, 62. [Google Scholar] [CrossRef]
- Janssen, S.; Laermans, J.; Verhulst, P.J.; Thijs, T.; Tack, J.; Depoortere, I. Bitter Taste Receptors and α-Gustducin Regulate the Secretion of Ghrelin with Functional Effects on Food Intake and Gastric Emptying. Proc. Natl. Acad. Sci. USA 2011, 108, 2094–2099. [Google Scholar] [CrossRef]
- Latorre, R.; Mazzoni, M.; De Giorgio, R.; Vallorani, C.; Bonaldo, A.; Gatta, P.P.; Corinaldesi, R.; Ruggeri, E.; Bernardini, C.; Chiocchetti, R.; et al. Enteroendocrine Profile of α-Transducin Immunoreactive Cells in the Gastrointestinal Tract of the European Sea Bass (Dicentrarchus labrax). Fish Physiol. Biochem. 2013, 39, 1555–1565. [Google Scholar] [CrossRef]
- Morais, S. The Physiology of Taste in Fish: Potential Implications for Feeding Stimulation and Gut Chemical Sensing. Rev. Fish. Sci. Aquac. 2017, 25, 133–149. [Google Scholar] [CrossRef]
- Alsiö, J.; Olszewski, P.K.; Norbäck, A.H.; Gunnarsson, Z.E.A.; Levine, A.S.; Pickering, C.; Schiöth, H.B. Dopamine D1 Receptor Gene Expression Decreases in the Nucleus Accumbens upon Long-Term Exposure to Palatable Food and Differs Depending on Diet-Induced Obesity Phenotype in Rats. Neuroscience 2010, 171, 779–787. [Google Scholar] [CrossRef]
- Le Crom, S.; Kapsimali, M.; Barôme, P.O.; Vernier, P. Dopamine Receptors for Every Species: Gene Duplications and Functional Diversification in Craniates. J. Struct. Funct. Genomics 2003, 3, 161–176. [Google Scholar] [CrossRef] [PubMed]
- Paiva, I.M.; Sartori, B.M.; Castro, T.F.D.; Lunkes, L.C.; Virote, B.D.C.R.; Murgas, L.D.S.; de Souza, R.P.; Brunialti-Godard, A.L. Behavioral Plasticity and Gene Regulation in the Brain during an Intermittent Ethanol Exposure in Adult Zebrafish Population. Pharmacol. Biochem. Behav. 2020, 192, 172909. [Google Scholar] [CrossRef]
- Riddle, M.R.; Hu, C.-K. Fish Models for Investigating Nutritional Regulation of Embryonic Development. Dev. Biol. 2021, 476, 101–111. [Google Scholar] [CrossRef]
- Uusi-Heikkilä, S.; Wolter, C.; Meinelt, T.; Arlinghaus, R. Size-dependent Reproductive Success of Wild Zebrafish Danio rerio in the Laboratory. J. Fish Biol. 2010, 77, 552–569. [Google Scholar] [CrossRef]


| Gene | Forward Primer (5′-3′) | Reverse Primer (5′-3′) | AT (°C) | ID |
|---|---|---|---|---|
| igf1 | GGCAAATCTCCACGATCTCTAC | CGGTTTCTCTTGTCTCTCTCAG | 53 | ZDB-GENE-010607-2 |
| mstnb | GGACTGGACTGCGATGAG | GATGGGTGTGGGGATACTTC | 58 | ZDB-GENE-990415-165 |
| ghrl | CAGCATGTTTCTGCTCCTGTG | TCTTCTGCCCACTCTTGGTG | 58 | ZDB-GENE-070622-2 |
| npy | GTCTGCTTGGGGACTCTCAC | CGGGACTCTGTTTCACCAAT | 60 | ZDB-GENE-980526-438 |
| lepa | CTCCAGTGACGAAGGCAACTT | GGGAAGGAGCCGGAAATGT | 60 | ZDB-GENE-081001-1 |
| drd2a | TGGTACTCCGGAAAAGACG | ATCGGGATGGGTGCATTTC | 58 | ZDB-GENE-021119-2 |
| vtg1 | GCCAAAAAGCTGGGTAAACA | AGTTCCGTCTGGATTGATGG | 59 | ZDB-GENE-001201-1 |
| vtg2 | TGCCGCATGAAACTTGAATCT | GTTCTTACTGGTGCACAGCC | 58 | ZDB-GENE-001201-2 |
| vtg3 | GGGAAAGGATTCAAGATGTTCAGA | ATTTGCTGATTTCAACTGGGAGAC | 58 | ZDB-GENE-991019-2 |
| nr3c1 | AGACCTTGGTCCCCTTCACT | CGCCTTTAATCATGGGAGAA | 58 | ZDB-GENE-050522-503 |
| rpl13 (hk) | TCTGGAGGACTGTAAGAGGTATGC | AGACGCACAATCTTGAGAGCAG | 59 | ZDB-GENE-031007-1 |
| arpc1a (hk) | CTGAACATCTCGCCCTTCTC | TAGCCGATCTGCAGACACAC | 60 | ZDB-GENE-040116-1 |
| CTRL | PG | F25 | F35 | ROT | F32- | |
|---|---|---|---|---|---|---|
| Mucosal folds height | 197.9 ± 8.6 | 213.3 ± 41.4 | 222.8 ± 54.3 | 180.2 ± 11.1 | 177.4 ± 16.1 | 183.5 ± 20.6 |
| Inflammatory influx | + | + | + | + | + | + |
| Mucosal folds fusion | + | + | + | + | + | + |
| CTRL | PG | F25 | F35 | ROT | F32- | |
|---|---|---|---|---|---|---|
| NPY-expressing cell distribution | +++ | +++ | + | + | +++ | +++ |
| CTRL | PG | F25 | F35 | ROT | F32- | |
|---|---|---|---|---|---|---|
| GSI | 8.69 ± 2.42 | 7.86 ± 0.67 | 7.16 ± 0.88 | 8.38 ± 1.38 | 10.16 ± 3.35 | 12.36 ± 5.02 |
| CTRL | PG | F25 | F35 | ROT | F32- | |
|---|---|---|---|---|---|---|
| PreV | 87.73 ± 3.02 a | 85.92 ± 3.66 a | 72.19 ± 2.90 b | 75.37 ± 2.69 b | 86.5 ± 1.50 a | 87.09 ± 3.95 a |
| PostV | 12.27 ± 3.02 b | 14.09 ± 3.66 b | 27.08 ± 2.89 a | 24.63 ± 2.69 a | 12.59 ± 1.13 b | 12.31 ± 3.36 b |
Disclaimer/Publisher’s Note: The statements, opinions and data contained in all publications are solely those of the individual author(s) and contributor(s) and not of MDPI and/or the editor(s). MDPI and/or the editor(s) disclaim responsibility for any injury to people or property resulting from any ideas, methods, instructions or products referred to in the content. |
© 2024 by the authors. Licensee MDPI, Basel, Switzerland. This article is an open access article distributed under the terms and conditions of the Creative Commons Attribution (CC BY) license (https://creativecommons.org/licenses/by/4.0/).
Share and Cite
Conti, F.; Olivotto, I.; Cattaneo, N.; Pavanello, M.; Şener, İ.; Antonucci, M.; Chemello, G.; Gioacchini, G.; Zarantoniello, M. The Promising Role of Synthetic Flavors in Advancing Fish Feeding Strategies: A Focus on Adult Female Zebrafish (Danio rerio) Growth, Welfare, Appetite, and Reproductive Performances. Animals 2024, 14, 2588. https://doi.org/10.3390/ani14172588
Conti F, Olivotto I, Cattaneo N, Pavanello M, Şener İ, Antonucci M, Chemello G, Gioacchini G, Zarantoniello M. The Promising Role of Synthetic Flavors in Advancing Fish Feeding Strategies: A Focus on Adult Female Zebrafish (Danio rerio) Growth, Welfare, Appetite, and Reproductive Performances. Animals. 2024; 14(17):2588. https://doi.org/10.3390/ani14172588
Chicago/Turabian StyleConti, Federico, Ike Olivotto, Nico Cattaneo, Massimiliano Pavanello, İdris Şener, Matteo Antonucci, Giulia Chemello, Giorgia Gioacchini, and Matteo Zarantoniello. 2024. "The Promising Role of Synthetic Flavors in Advancing Fish Feeding Strategies: A Focus on Adult Female Zebrafish (Danio rerio) Growth, Welfare, Appetite, and Reproductive Performances" Animals 14, no. 17: 2588. https://doi.org/10.3390/ani14172588