Simple Summary
Nutritional cues during embryonic development significantly impact growth, although the mechanism behind this influence remains unclear. Amino acids such as leucine can affect the nutrient-sensing pathway that regulates growth. We injected 2.5 mg of leucine or saline into Japanese quail eggs on the tenth day of incubation. Treatment groups showed no significant difference in hatching success, body mass, gastrointestinal length, and morphological traits (wing, tarsal, and head lengths). However, from day 3 to day 7 post-hatch, chicks hatching from leucine-treated eggs showed increased wing length, body mass, tarsal length, and head and intestinal lengths, which lasted up to 21 days. Similarly, the growth-related genes in the liver were upregulated in leucine-treated quail chicks. However, protein degradation genes remained unchanged. These results suggest that the slight increase in embryonic leucine can promote growth, highlighting the potential for improvement in poultry growth performance.
Abstract
Nutritional cues during embryonic development can alter developmental trajectories and affect postnatal growth. However, the specific mechanisms by which nutrients influence avian growth remain largely unknown. Amino acids can directly interact with the nutrient-sensing pathways, such as the insulin-like growth factor 1 (IGF-1)/mechanistic target of rapamycin (mTOR) pathways, which are known to regulate growth. We examined the effects of embryonic leucine on gene expression and phenotypic growth in Japanese quails by injecting 2.5 mg leucine or saline (control) into Japanese quail eggs on the tenth day of incubation and incubating them under standard conditions. The treatment groups had similar hatching success and size at hatching. However, between 3 and 7 days post-hatching, quails treated with embryonic leucine showed increased growth in body mass and wing, tarsus, head, and intestinal lengths, lasting up to 21 days. The hepatic expression of IGF1, IGF1R, mTOR, and RPS6K1 was upregulated in leucine-treated quails, while the expression of FOXO1 remained unaffected. In conclusion, a subtle increase in embryonic leucine may induce developmental programming effects in Japanese quail by interacting with the IGF-1/mTOR nutrient-sensing pathway to promote growth. This study highlights the role of embryonic amino acids as crucial nutrients for enhancing growth. It provides valuable insight into nutrient intervention strategies during embryonic development to potentially improve poultry growth performance.
1. Introduction
Nutritional programming during early life profoundly affects phenotype. Early nutritional supplementation may boost postnatal growth and development, which can have long-lasting effects [1,2,3]. Conversely, early poor nutrition has enduring adverse effects [4]. Recent studies have shown the importance of prenatal nutrients over traditional postnatal focus, highlighting their potential and impacts [5,6]. Understanding the mechanisms through which specific nutrients influence phenotypic expression in birds, mainly through embryonic programming, is crucial and still emerging [5,7]. While several nutrients may influence development, maternally and externally derived amino acids have been recognised to have the potential to alter the developmental trajectory and thus have phenotypic programming effects [8,9].
Amino acids exert their developmental effects through two connected nutrient-sensing pathways: the insulin/insulin-like factor 1 signalling (IIS) and the mechanistic target of rapamycin (mTOR) [10,11]. Insulin-like growth factor 1 (IGF-1), primarily secreted from the liver, is a crucial regulator of energy metabolism, protein synthesis, and cellular proliferation, affecting growth, reproduction, and lifespan in response to energy and nutrient status [12]. Changes in nutritional status stimulate the growth hormone GH/IGF-1 axis, leading to the alteration of IGF-1 levels [13,14]. The effects of IGF-1 are facilitated through the IGF-1 receptor (IGF-1R), which interacts with the mTOR complex network of intracellular nutrient pathways in influencing growth [15,16]. Growth is enhanced when the protein synthesis rate surpasses the protein degradation rate regulated by pathways involved with the protein kinase B or Akt, which acts as a critical regulator, playing a significant role in both protein synthesis and degradation in the nutrient-sensing pathways [17,18]. This kinase increases the activity of mTOR but negatively regulates the forkhead box protein O1 (FOXO1) transcription factor, thereby reducing protein degradation [18,19].
Recently, we have shown that an experimental increase in embryonic methionine, an essential amino acid, increased the growth and development of Japanese quail chicks, which resulted in higher body mass from 5 days to 21 days post-hatch [8]. The increase in postnatal growth in quail chicks was associated with the activation of the nutrient-sensing pathways, triggering the upregulation of hepatic IGF1 and mTOR genes one day postnatal, while the expression of mTOR’s downstream effector, ribosomal protein serine 6 kinase 1 (RPS6K1), and circulating IGF-1 followed 21 days post-hatching [8]. These results provided further room for investigating how other specific amino acids influence growth via the modulation of the IGF-1/mTOR system as different amino acids operate through distinct mechanisms [20,21]. Building our understanding on methionine, we now explore the role of leucine, another essential amino acid.
Leucine, a branched-chain essential amino acid (BCAA), has a critical role in development through its effects on protein synthesis and metabolism. Insufficient dietary leucine impairs growth [22], while excessive dietary leucine supplementation above the recommended level does not improve weight gain and growth in broiler chicken [18,23]. Increased dietary leucine in rats and early-life broiler chicks improves protein synthesis and muscle maintenance through mTOR activation and also affects RPS6K1 expression in the muscles [24,25]. However, not all studies show that leucine boosts growth, indicating that its effects may depend on specific conditions [18].
Therefore, we hypothesised that embryonic leucine could influence the hormonal and gene expression patterns in the nutrient-sensing pathways that influence postnatal growth and development in Japanese quails (Coturnix japonica), a model species frequently used for exploring the influence of early-life conditions or embryonic development [26]. Thus, we determined the hepatic expression of growth-related genes (IGF1, IGF1R, mTOR, RPS6K1) and the transcription factor for autophagic genes FOXO1 to study the influence of in ovo application of leucine on early growth and development.
2. Materials and Methods
2.1. Experimental Animals and Analysis of Amino Acid Concentration in Eggs
Experiments were approved by the Institutional Committee of Animal Welfare permit number 5/2021/DEMAB. We carried out the trial at the experimental farm of the University of Debrecen, Farm and Regional Research Institute, Kismacs, Hungary. We collected 336 eggs from 70 laying Japanese quails (Coturnix japonica), 33 weeks old, over five days and kept them between 16 °C and 18 °C. We weighed the eggs using a digital scale (0.01 g accuracy). We selected eggs with similar mass (11.0 ± 0.5 g, 100 eggs) to reduce the effects of egg mass differences [8].
To determine the natural range of amino acids in freshly laid eggs, we quantified amino acid concentrations from a pool of 12 eggs at the accredited Central Laboratory of the Agriculture and Food Products, Faculty of Agricultural and Food Sciences and Environmental Management University of Debrecen, Hungary. The protein content of the samples was determined using the Kjeldahl method [27]. First, the nitrogen content of the sample was converted into ammonium salt by boiling it in concentrated sulphuric acid. A total of 14 mL of concentrated sulphuric acid and two catalyst tablets were added containing selenium. The sample was destructed at 420 °C when placed on a destructive block (VELP DKL Kjeldahl, VELP Scientifica Srl, Usmate, Italy). After cooling the sample, it was distilled on a VELP UDK-149 (VELP Scientifica Srl, Usmate, Italy) distiller. An automatic titrator (VELP TITROLINE 5000, VELP Scientifica Srl, Usmate, Italy) was applied, and the nitrogen content was calculated. The protein content of the samples was calculated from the nitrogen content using a conversion factor (6.25). Measurements were repeated four times with CV% < 10%.
For protein hydrolysis, the same amount of protein was measured into a hydrolysis tube with Teflon top with 6N HCl and was reacted at 110 °C for 23 h in an oven (Memmert UN55, Buechenbach, Germany). The samples were applied to the amino acid analysis after cooling and filtering through a regenerated cellulose filter (0.2 µm, Whatman 10463040 Spartan syringe filter, Cytiva, Marlborough, MA, USA). For total amino acid analysis, an AAA500 amino acid analyser (INGOS Ltd., Prague, Czech Republic) with low-pressure ion-exchange chromatography with post-column derivatisation with ninhydrin (INGOS Ltd., Prague, Czech Republic) and photometric detection at 210 and 254 nm was used. An amino acid standard mixture (INGOS Ltd., Prague, Czech Republic) was applied as a reference. The recovery was higher than 95%. Results are reported in Table 1.

Table 1.
Amino acid (m/m%) content of Japanese quail eggs. Concentrations were calculated from a pool of 12 freshly laid eggs.
2.2. Incubation and in Ovo Injection of Leucine
We incubated 100 eggs in an automatic turning incubator (WQ-63-WQ-98 Model 2021 Version 2, AGROFORTEL, SRO, Budapest, Hungary). On day 10 of the embryonic development, we candled the eggs and removed those containing dead embryos and unfertilised eggs from the incubator. We set the incubation temperature at 37.8 ± 0.5 °C and relative humidity at 50–60%.
We prepared the leucine solution (50 mg leucine/mL saline solution) by dissolving crystalline L-leucine (reagent grade, purity > 98%; Sigma Aldrich, Merck Life Science Ltd., Budapest, Hungary) in a 0.9% physiological saline solution (B. Braun Melsungen AG, Melsungen, Germany). Saline solution serves a neutral baseline for comparison to the effects of the active or real treatment group. After disinfecting the eggshell with 70% ethanol, we incised it using a sterile 26G needle through the broad end site of the eggs. We injected 39 randomly selected eggs (50 μL into each egg) with 2.5 mg/egg of the leucine solution into the amniotic fluid using a Hamilton syringe on embryonic day ten (ED10). Then, the second group of 36 eggs received 50 μL of the physiological saline solution (B. Braun Melsungen AG, Melsungen, Germany) only, each serving as a control group. We used a completely randomised experimental design where eggs with similar masses were allocated randomly to the two treatments. After the injection, we sealed the hole with candle wax and transferred the egg to the incubator to resume incubation. Based on the average leucine content of eggs (Table 1) and the average mass of the eggs (11.0 g), the injection represents an average 2.0% increase in leucine content.
2.3. Rearing Experimental Hatchlings and Sample Collection
On day 14 of the incubation, we transferred the eggs from the incubator tray to the partitioned hatching tray. The hatching tray was portioned based on the treatment groups to separate the eggs and avoid mixing of chicks during hatching. We reduced the incubation temperature to 35.5 °C, and relative humidity increased to 65–70%. Hatching of the chicks was inspected twice daily. A total of 24 chicks hatched from leucine-treated eggs and 18 chicks from the control group. Hatchlings from each experimental group were tagged with numbered rings and immediately transferred to cages (40 cm long × 50 cm wide × 40 cm height) and reared for an average of three weeks (21 days) in groups of their treatments. We gave the hatchlings free access to water and feed (Table 2). We kept chicks under uniform standard conditions throughout the experimental period. The rearing temperature was 37 °C at the beginning up to four days provided by infrared lamps, then reduced by 3 °C every four days until reaching 22 °C by the end of the third week. The cage’s relative humidity was between 60–65%, while light was provided 24 h up to the age of 21 days. We recorded post-hatch body mass using an electronic scale with a precision of 0.01 g, VWR software version 6.02 (Avantor, Radnor, PA, USA). We also measured wing, tarsus, and head lengths using a vernier calliper (to the nearest 0.01 mm) on days 1, 3, 5, 7, 14, and 21 post-hatching. Although we did not perform a subjective analysis, body mass and morphological measurements were taken by the same person without knowing the treatment, and we used sample codes during the laboratory analyses. After recording body mass, we randomly selected eight (8) chicks from each experimental group for sample collection on day-old and 21-day-old birds. At the end of the experimental period, we sacrificed birds by cervical dislocation. We measured the whole gastrointestinal tract (GIT) length post-mortem on day-old and 21-day-old chicks using a ruler (nearest 0.1 mm). Changes in the size of the gastrointestinal tract reflect how nutrient supplements affect the physical growth of the digestive system, which is vital for efficient nutrient absorption and the overall development of chicks. Then, liver samples were collected, snap-frozen in dry ice, and stored at −80 °C for further gene expression assay.
Table 2.
Dietary composition and calculated nutrient content of quail grower diet.
2.4. RNA Isolation and Real-Time qPCR
We excised about 25 mg of the frozen liver tissue, homogenised it in 700 μL TRK lysis buffer, and isolated the total RNA using peqGold Total RNA kit following the manufacturer’s protocol (VWR International LLC., Radnor, PA, USA). The peqGOLD DNase digestion kit was used for RNA isolation. We measured the total RNA concentration spectrophotometrically at a 260 nm wavelength using an HTX Synergy Multi-Mode Microplate Reader (Agilent BioTek, BioTek Instrument Inc., Winooski, VT, USA). The ratio of the absorbance at 260/280 and 260/230 for protein purity and organic solvent purity of the samples ranged from 1.8 to 2.0 and was considered appropriate. We assessed the RNA integrity using QubitTM IQ Assay with values ranging from 8.4–9.2 scores using the manufacturer’s protocol (Life Technologies Corporation, ThermoFisher Scientific, Bleiswijk, The Netherlands).
We used 200 ng for the reverse transcription based on the total RNA concentration. We synthesised cDNA using the LunaScript® RT SuperMix Kits kit following the manufacturer’s instructions (New England Biolabs Inc., Ipswich, MA, USA) in a PCRmax Alpha Thermal Cycler (Cole-Parmer Ltd., Vernon Hills, IL, USA). The LunaScript® SuperMix reaction mix contained a random hexamer and oligo-dT primers, dNTPs, Murine RNase Inhibitor, and Luna® Reverse Transcriptase. The total reaction mix volume was 20 µL with the reaction mixture of nuclease-free water, 4 µL LunaScript® SuperMix, and RNA template. The conditions cycles for cDNA synthesis were 2 min at 25 °C for primer annealing, 10 min at 55 °C for cDNA synthesis, 5 min at 95° C for heat activation, and holding at 4 °C. cDNA samples were diluted 10-fold and stored at −20 °C.
We designed quail-specific, intron-spanning primers from Integrated DNA Technologies (BVBA-Leuven, Belgium) using the Oligo 7 software (Table 3). We verified the primer target specificity using Primer-Blast web based tool (https://www.ncbi.nlm.nih.gov/tools/primer-blast/, accessed on 20 September 2021) based on the mRNA nucleotide sequence of the goal gene from the National Center for Biotechnology Information (NCBI, http://www.ncbi.nlm.nih.gov, accessed on 20 September 2021).
Table 3.
Primer sequence of the target genes (IGF1, IGFR, mTOR, RPS6K1, FOXO1) and reference gene (RPL19).
We performed a quantitative polymerase chain reaction (qPCR) for cDNA amplification using EvaGreen qPCR Mix according to the manufacturer’s protocol (Solis BioDyne, Teaduspargi, Estonia). The total reaction volume was 10 µL, with the reaction mixture of nuclease-free water, 200 nM of each primer, 5 × H.O.T. FIREPol® EvaGreen® qPCR Mix Plus (ROX) (Solis BioDyne, Tartu, Estonia) supermix, and 2 ng cDNA template. The qPCR reaction conditions were performed for 12 min at 95 °C, with initial activation of the polymerase followed by 40 cycles of denaturation for 15 s at 95 °C, annealing for 20 s minutes at 60 °C, and elongation for 20 s at 75 °C. The amplification and melting curve analysis was performed using Agilent AriaMx Real-Time PCR System instrument software version 1.8 (Agilent Technologies, Santa Clara, CA, USA). The PCR reaction mixture was performed with duplicate measurements of each sample, and the average value of the duplicate was used for further analyses. The PCR reactions generated the data in each gene’s threshold cycle (Ct) value. We normalised the Ct values for each target gene using RPL19 as a housekeeping gene based on its stability in all treatments [28,29]. We quantified the target gene transcript’s relative gene expression as fold change compared with the reference gene (RPL19) using the 2−ΔΔCt method [30]. We selected the reference gene based on NormFinder, BestKeeper, and delta Ct algorithms [28].
2.5. Statistical Analysis
We expected missing data from the gene expression to result from data processing and normalisation before analyses. Gene expression with low signal intensity below the threshold may fall below the detection limit in certain samples, which are considered unreliable [31]. Genes with high variability in expression were filtered out and considered missing data. Only 3.5% of the gene expression data points were excluded from the analyses. During data analyses, linear models were used, which could handle the imbalanced data design and correct for the missing values.
We performed all statistical analyses using RStudio version 4.3.3 [32]. Graphs (images) were generated using the ‘ggplot’ function provided by the ‘ggplot2’ package version 3.4.3 [33]. To determine hatchability, a chi-squared test (χ2) was used to test whether there is a statistically significant difference between observed and expected hatching percentages between the treatment groups. Before fitting the model, we used Akaike’s information criterion corrected for small sample sizes (AICc) to choose the best model [34]. We used linear mixed models (LMMs) to analyse the effects of treatment on body mass and morphological traits (wing, tarsal, and head lengths) across time up to three weeks of age. We considered treatment in two levels (saline and leucine) and at seven time points (days 1, 3, 5, 7, 10, 14, and 21) and their interaction as fixed factors. Since chick body mass and morphological traits were measured multiple times for three weeks, to control for the individual variation across time and the effects of repeated measurements, we included the individual bird identity as a random factor in the model [35]. We used the function ‘lmer’ from the ‘lme4’ package to define the fixed and random effect and estimate the model parameters [36]. To compute the p-values, we used ‘lmerTest’ package version 3.1.3 in ANOVA [37]. To compare the means in body mass and morphological variables between the treatment groups within each day (at different time points), we used estimated marginal means by the ‘emmeans’ package and compared the means using the Tukey test at a p < 0.05 significance level [37,38]. To analyse the effects of treatment on hepatic gene expression of IGF1R, IGF1, mTOR, RPS6K1, and FOXO1 and intestinal length, we used linear models, with treatment and time (days) as independent factors. One-way ANOVA was used to assess the statistical significance between the treatment groups, with p < 0.05 considered significant.
3. Results
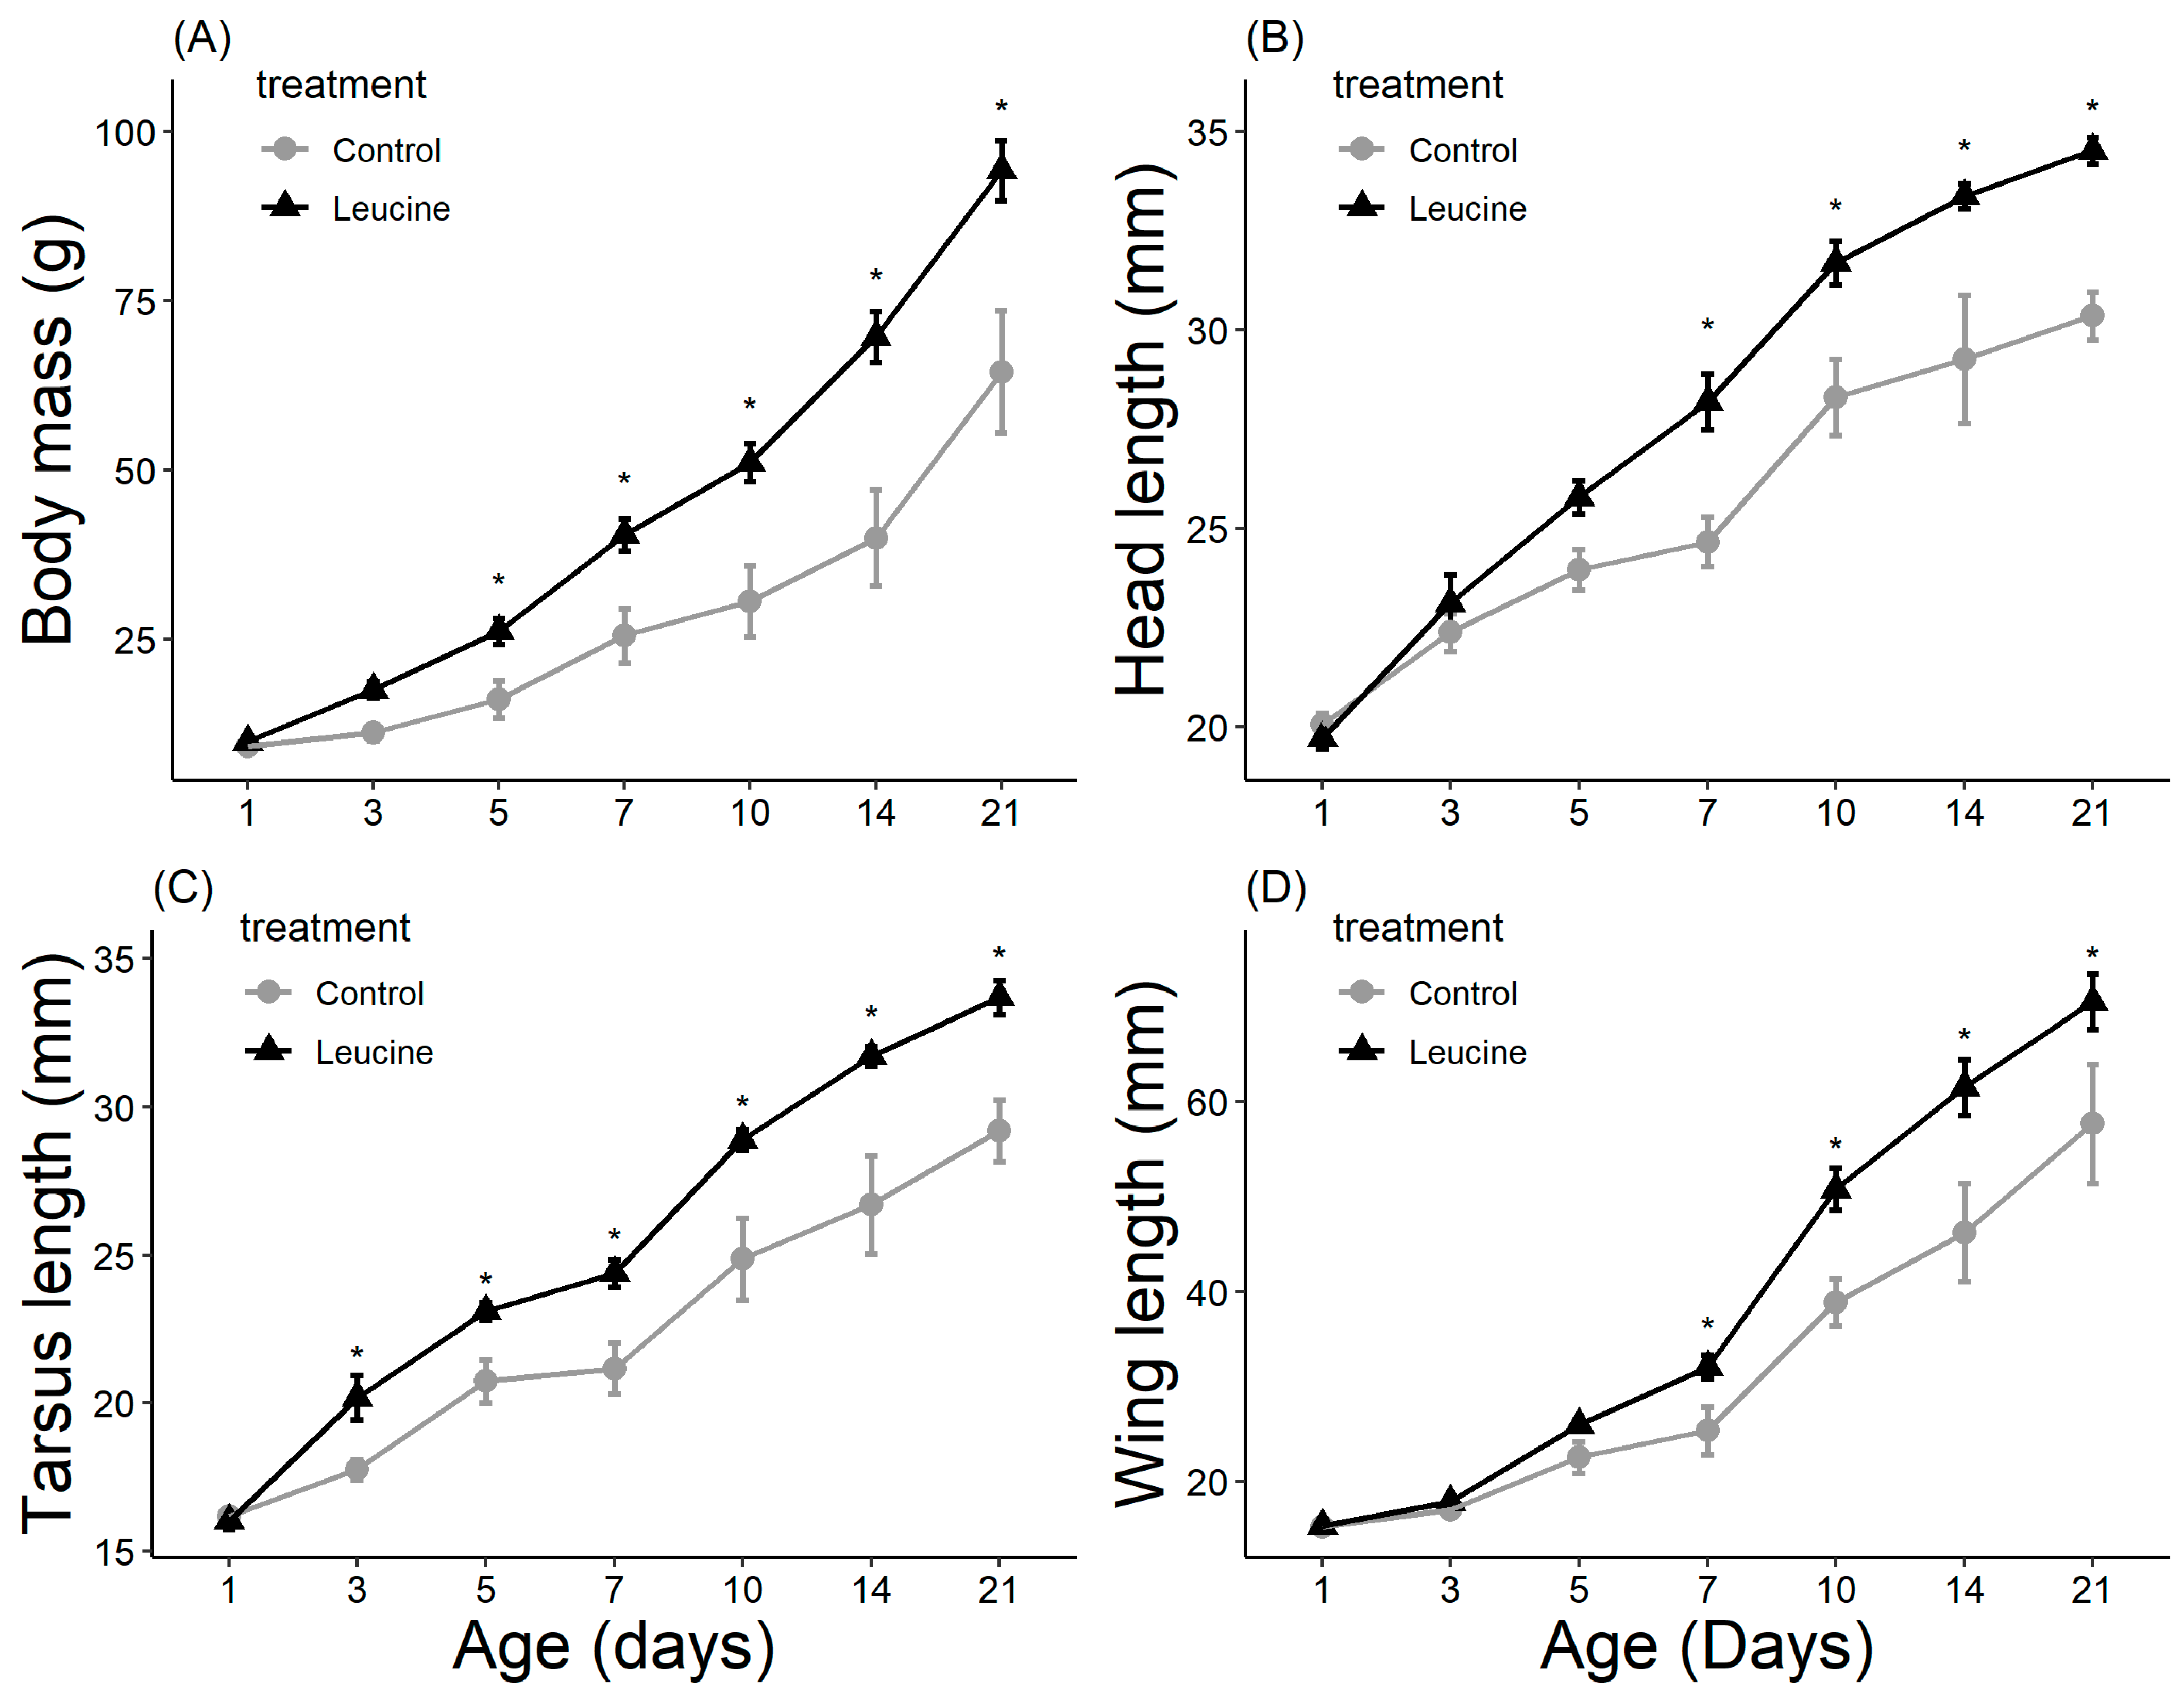
The study did not detect a statistically significant difference in hatching success between the leucine-injected (61.5%) and control (50.0%) groups (ꭓ2 = 0.59, df = 1, p = 0.440), which may be due to the sample size or the effect size being smaller than anticipated. Body mass, head length, tarsal length, and wing length were affected by both treatment, age (day), and their interactions (p < 0.05, for all). The treatment did not affect the chicks’ body weight at hatching (Table 4). However, starting from day 3 after hatching, chicks in the leucine injection group outgrew the controls, a difference lasting all days until day 21 (Table 4, Figure 1). At the age of 3 days, the leucine-injected group already had higher tarsus length, followed by a higher body mass at day 5, and marginally larger head length, which reached statistical significance at day 7 along with wing length, showing overall improved growth performance after embryonic leucine treatment. On day 21, birds in the leucine-treated group also had longer intestinal length than the controls (Figure 2).
Table 4.
Estimates and p-values of the statistical models for body mass, head length, tarsus length, and wing length following embryonic leucine treatment. The estimates and the statistical values show pairwise comparisons of estimated marginal means (emmeans) in the leucine-treated and control groups at different ages of postnatal development.
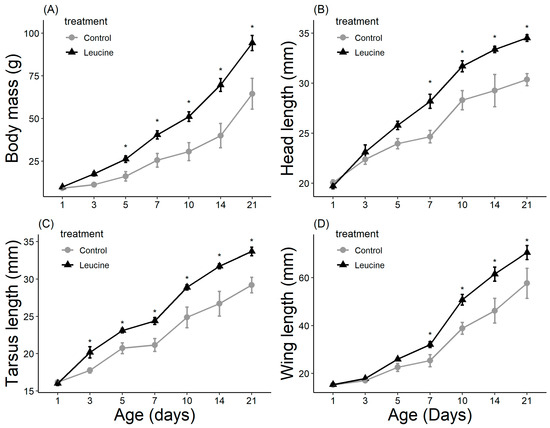
Figure 1.
Leucine injection into Japanese quail eggs increased body mass (A) and head (B), tarsus (C) and wing (D) lengths in chicks post-hatch (see Table S1. Supplementary Materials for detailed sample size). Asterisks indicate a significant difference between the treatment groups (p < 0.05), and error bars indicate mean ± SE.
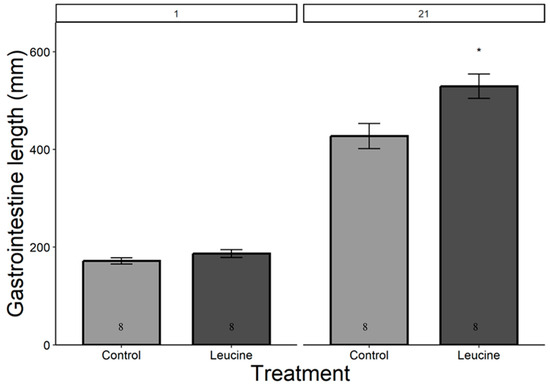
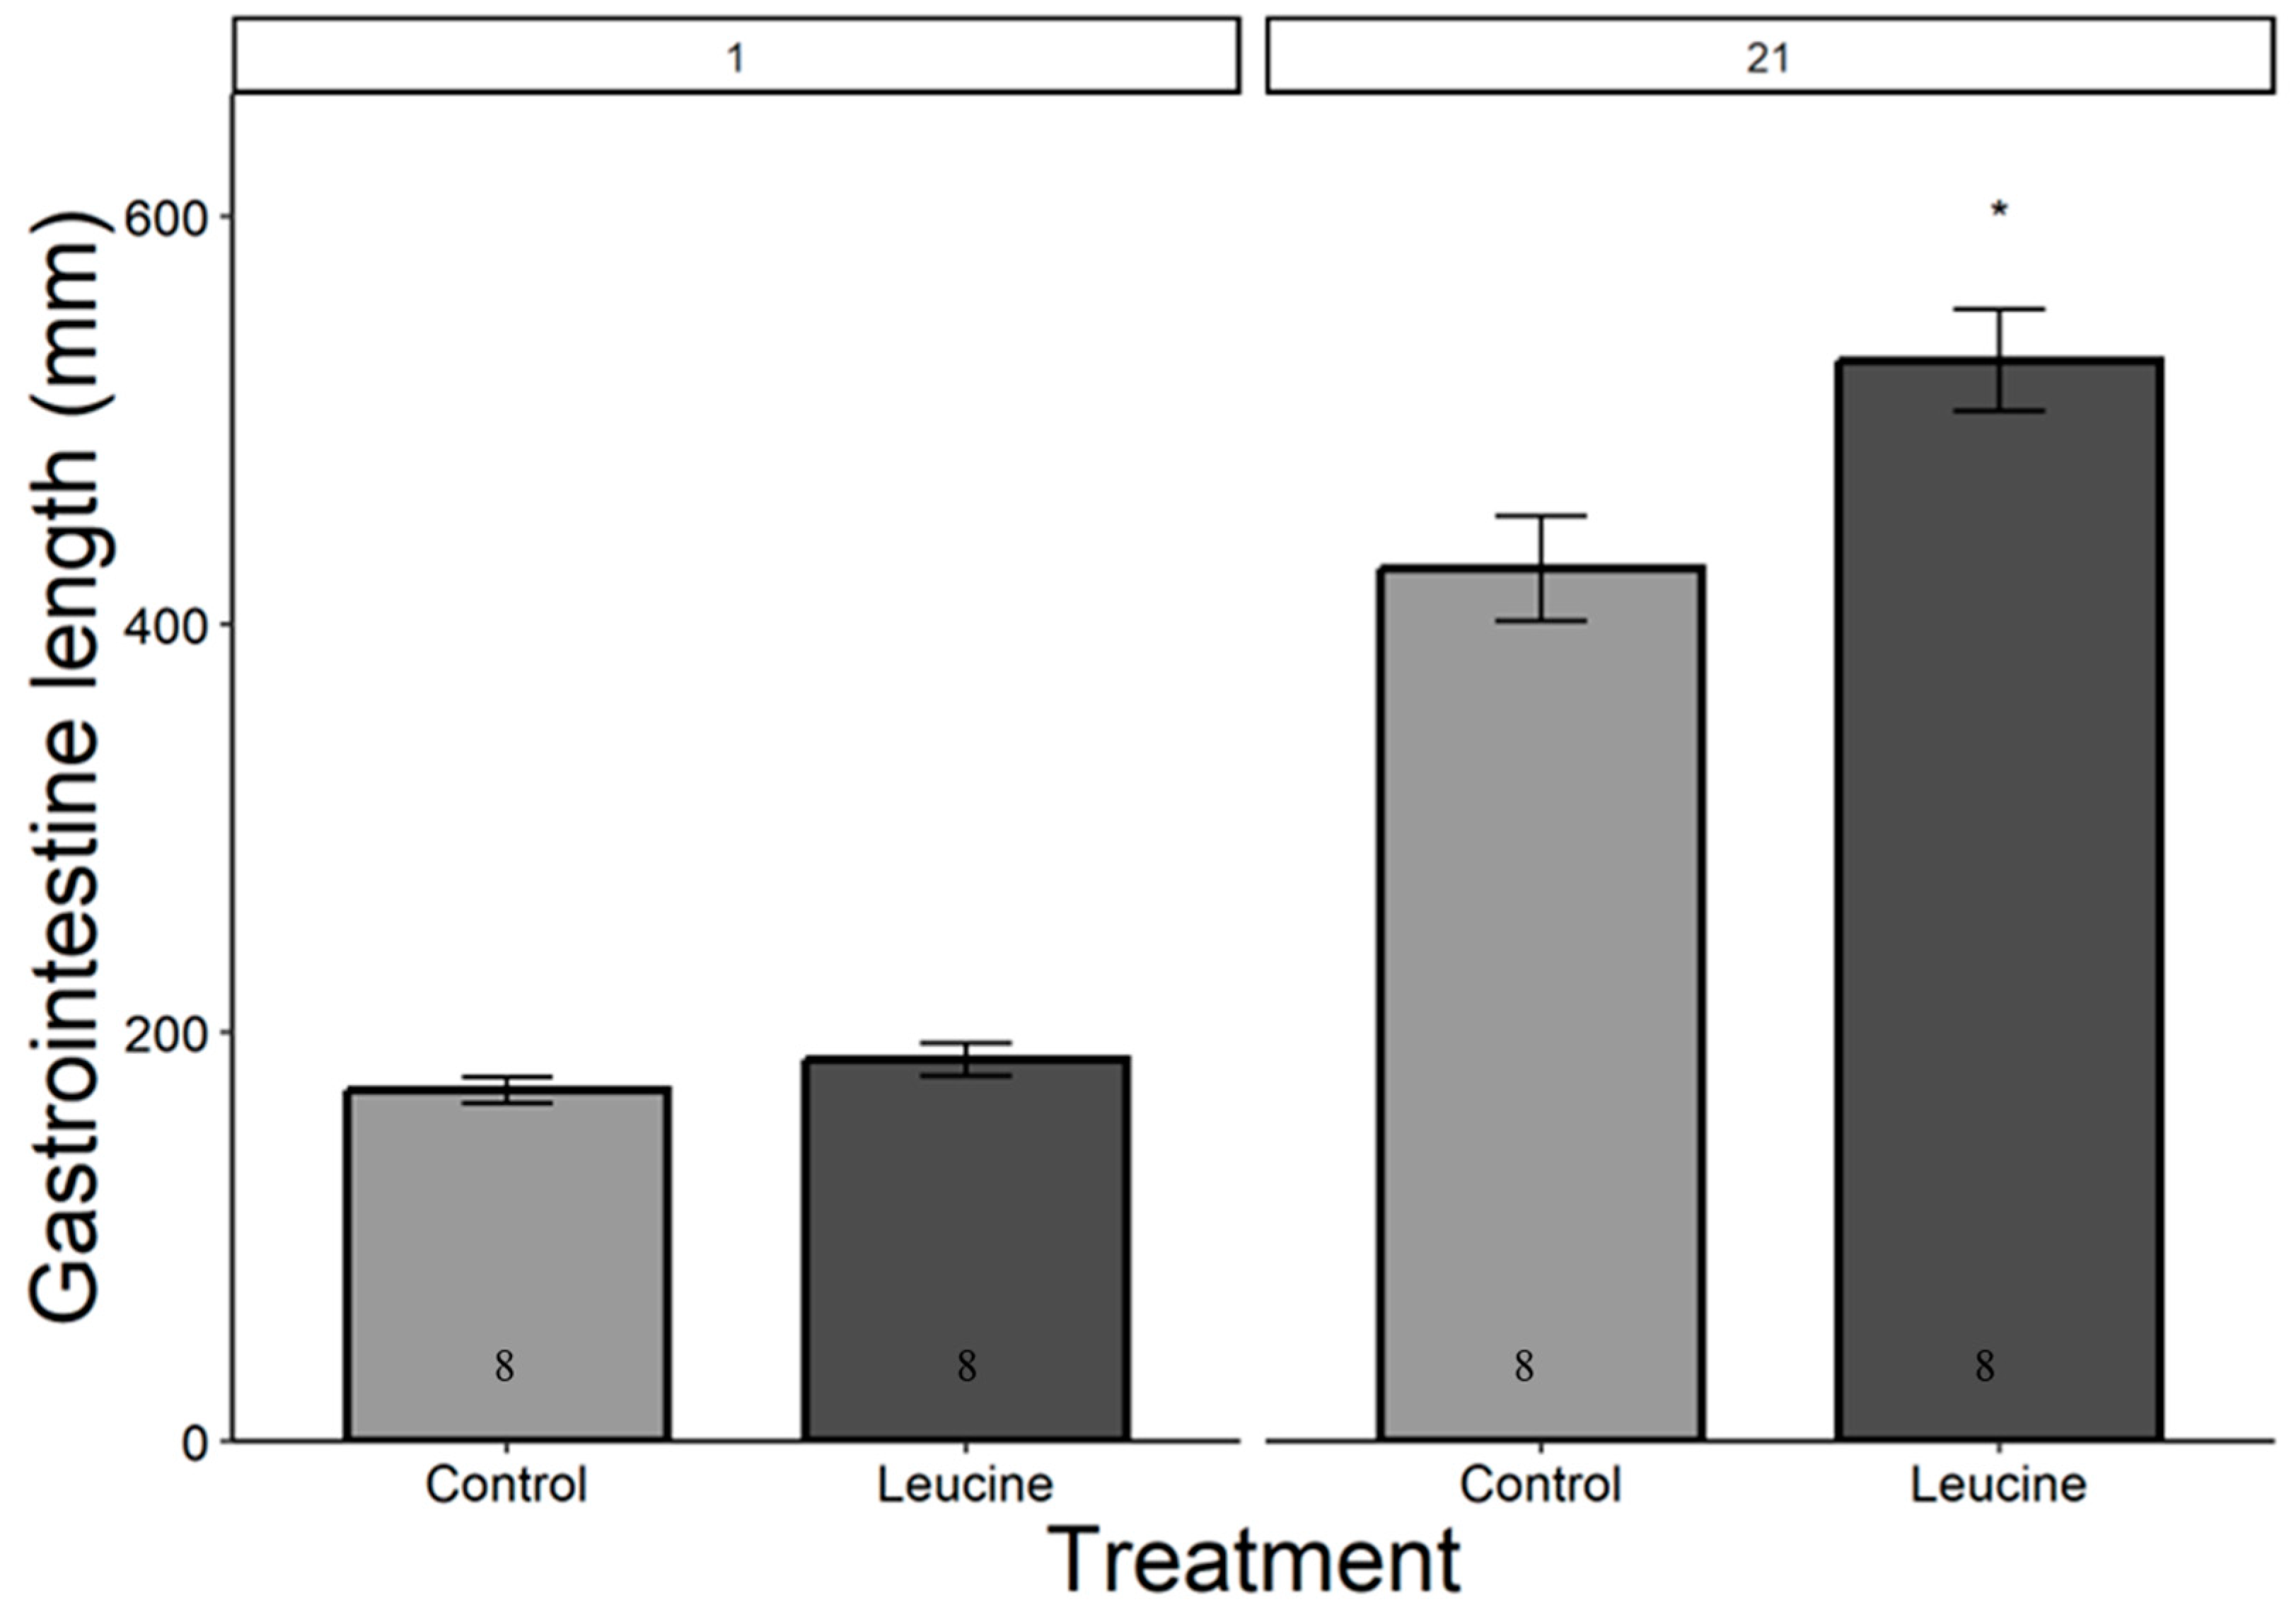
Figure 2.
Leucine injection into Japanese quail eggs increased postnatal intestinal length in 21-day-old chicks. Numbers in the bars indicate sample size (n). The asterisk indicates a significant difference between the treatment groups at p < 0.05, and error bars indicate mean ± SE. Numbers 1 and 21 above the bars indicate the age of chicks in days post-hatch.
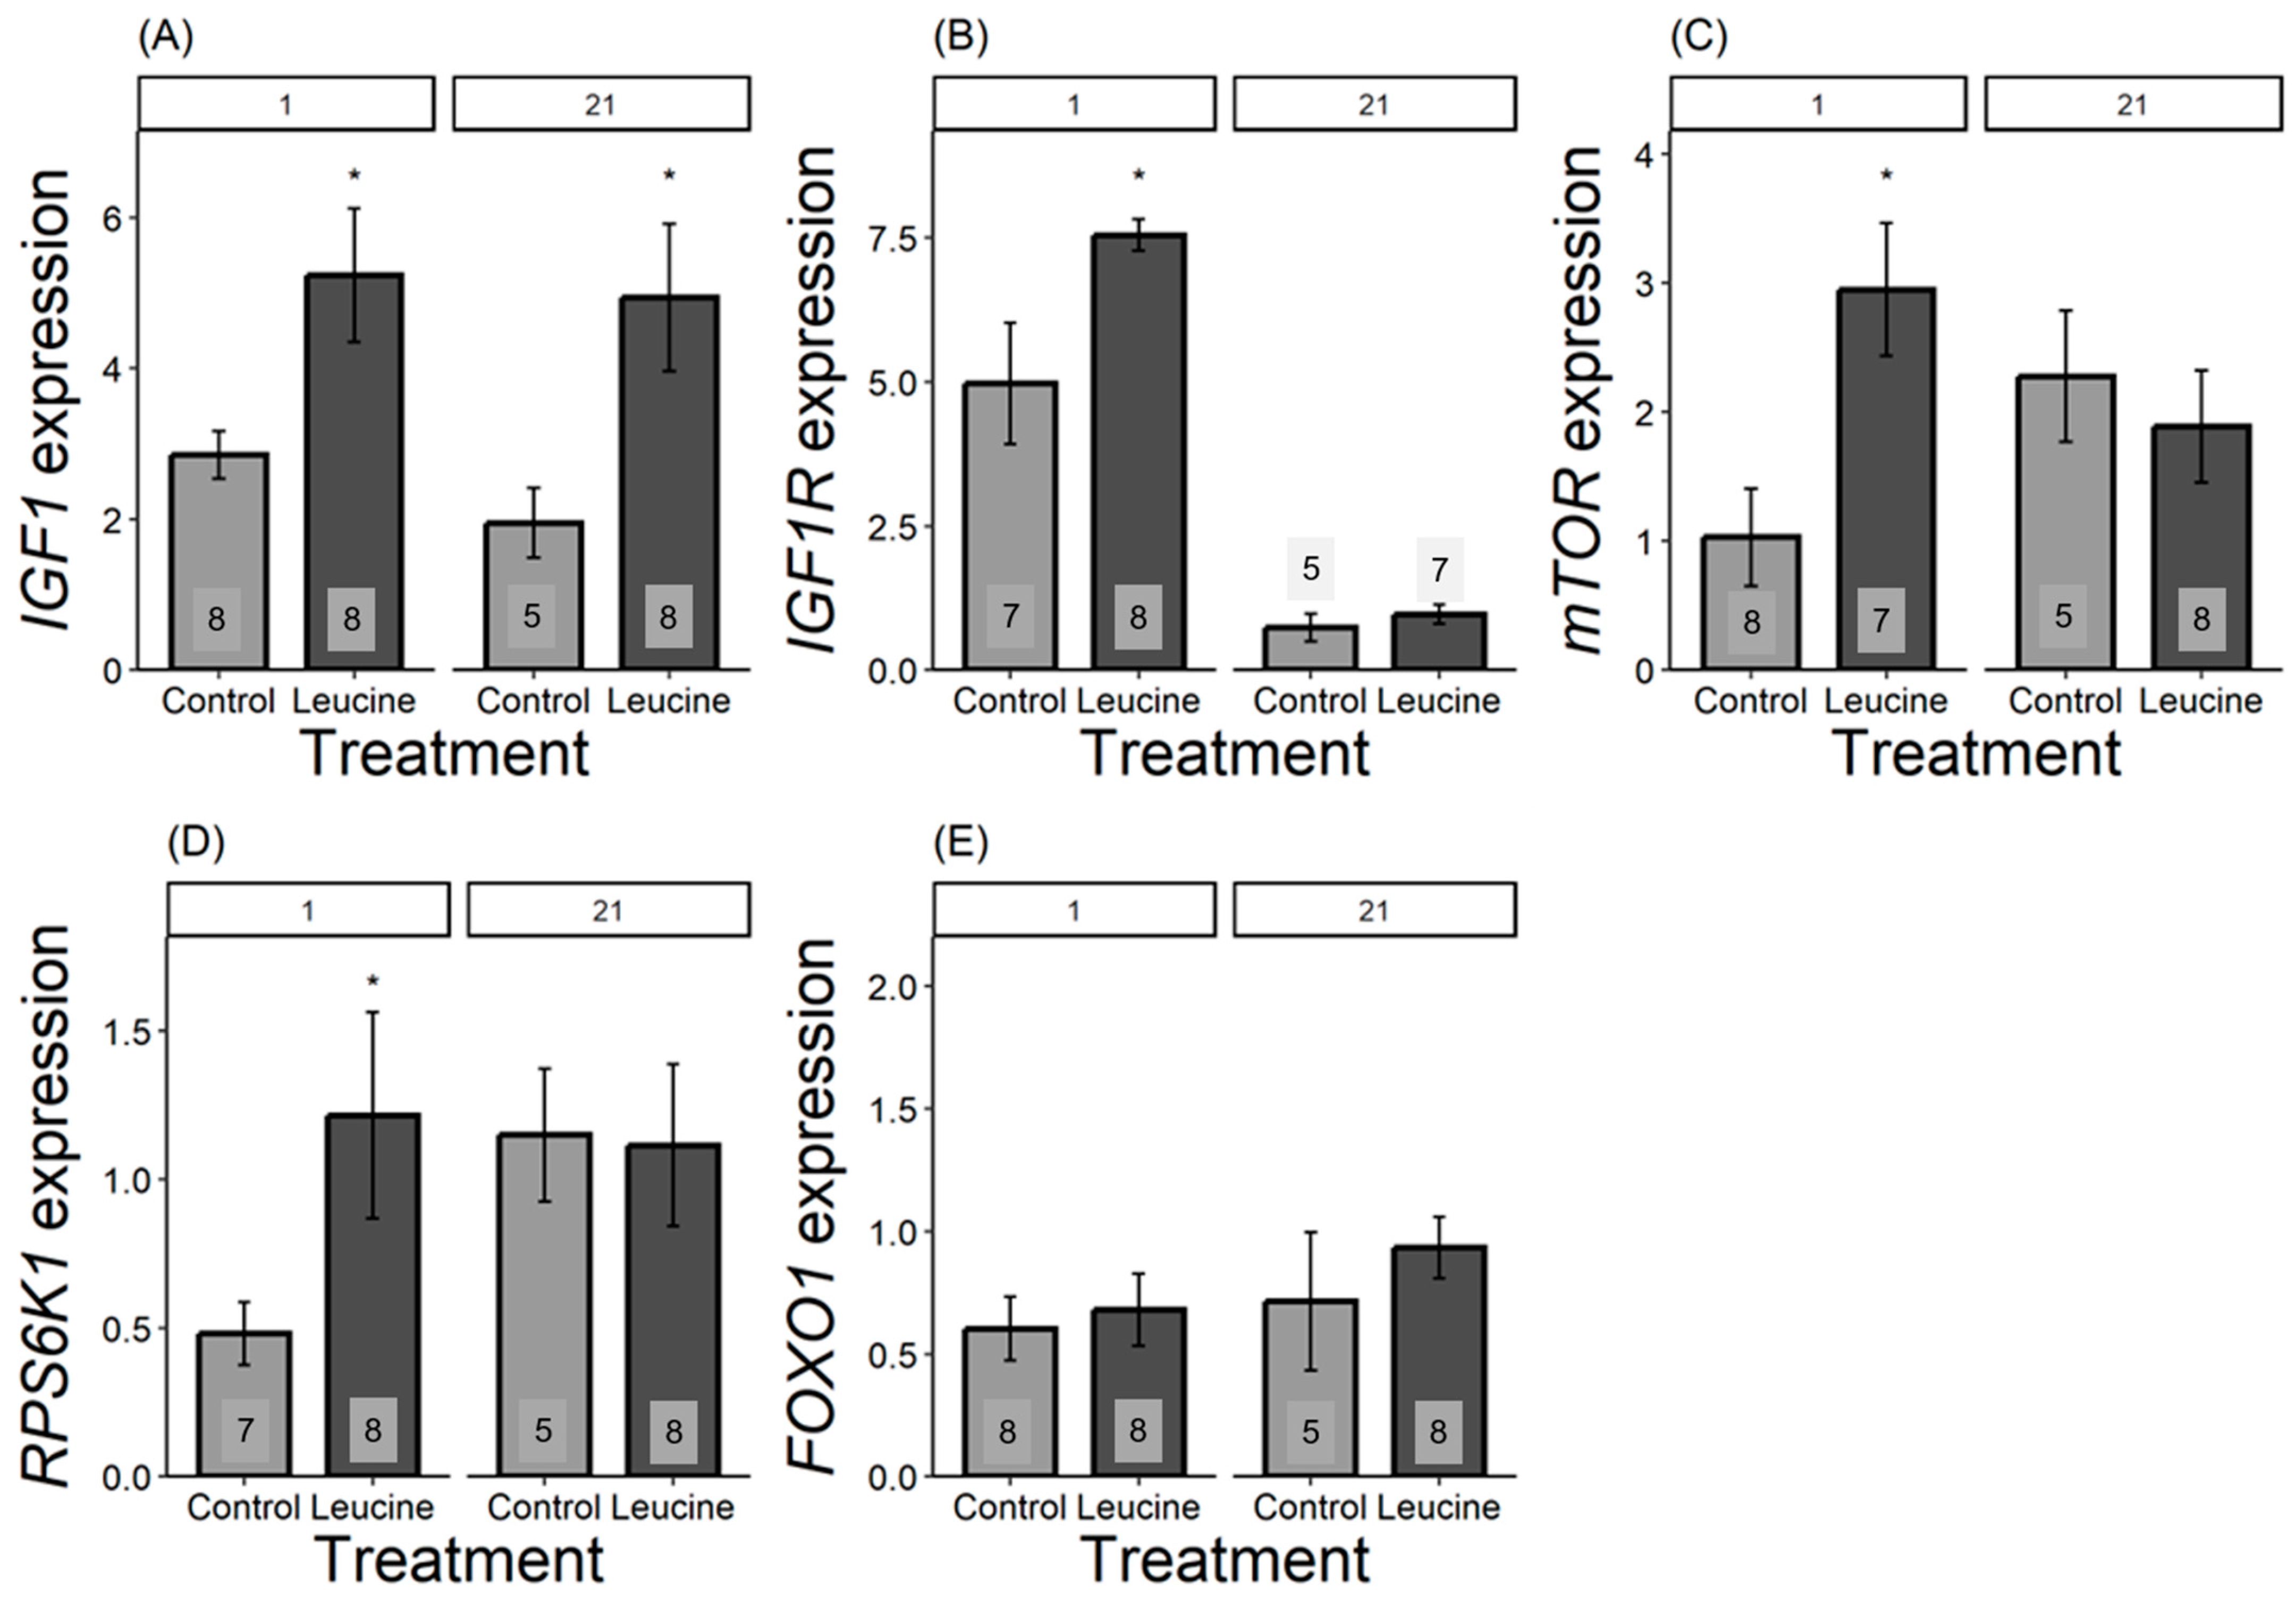
We found that the relative expression of all genes, except for FOXO1, differed in one-day-old chicks and was more expressed in the leucine-treated group than in the control. For IGF1, the leucine-treated group had 2.5 fold higher leucine than the control, F1,14 = 6.42, p = 0.023; IGF1R was 1.5 fold higher following leucine treatment compared to the control, F1,13 = 6.31, p = 0.026; mTOR was 2 fold higher in leucine compared to the control, F1,14 = 9.04, p = 0.009; while RPS6K1 was 0.75 fold higher in the leucine-treated group than the control, F1,14 = 6.53, p = 0.022; with no significant difference in FOXO1: F1,13 = 0.15, p = 0.703, Figure 3. In contrast, at day 21, only IGF1 remained significantly more expressed in the leucine group, being 2.5 fold higher compared to the control (F1,11 = 5.23, p = 0.042; while no difference observed in IGF1R: F1,9 = 0.66, p = 0.435, mTOR: F1,11 = 0.32, p = 0.579; RPS6K1: F1,11 = 0.00, p = 0.98; FOXO1: F1,11 = 0.66, p = 0.432; Figure 3).
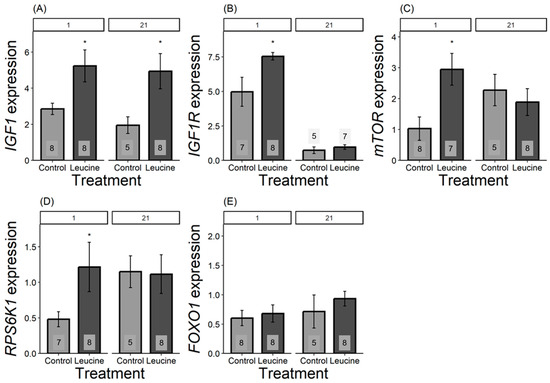
Figure 3.
Bar plots present mRNA expression relative to the reference gene. (A) IGF1, (B) IGF1R, (C) mTOR, (D) RPS6K1, (E) FOXO1 expression, light grey bars refers to control group, dark grey bars refers to leucine treatment. Numbers in the bars indicate sample size (n). The numbers at the top denote the age of the Japanese quail chicks at which the samples were collected: (1) day-old chicks and (21) 21-day-old chicks. Asterisks indicate significant differences between the treatment groups (p < 0.05), and error bars indicate mean ± SE.
4. Discussion
Hatching success was similar between the treatment and the control group, indicating that leucine treatment had no impact. These findings are consistent with previous studies where the injection of amino acids in broiler chicken eggs did not alter hatchability [39]. However, an injection of 0.2% BCAA mixture in turkey eggs had a negative impact on hatchability [5]. This contrast in hatchability suggests that factors such as species type and concentration of the amino acids can influence hatchability.
We observed that one day after hatching, body mass and gastrointestinal, wing, tarsal, and head lengths were similar between treatment groups. Although feed intake during the postnatal period could play a prominent role in growth, it was not measured. However, chicks showed faster growth in the leucine-injected group; by day 7, they were heavier and bigger than the controls (Figure 1, Table 4). Some morphological traits already showed an advantage in the leucine-treated group by day 3 (tarsus) or day 5 (body mass), while head length and wing length only reached statistical significance by day 7. While our study used a 2.0% increase in leucine, evidence shows that embryonic feeding of a 0.1% BCAA blend including leucine before the onset of incubation increased only the embryonic growth with no difference in weight of the newly hatched chicks [40]. In contrast, an embryonic feeding of a 0.2% BCAA blend at day 22 of incubation decreased the embryo weight [5]. Still, a 0.2% BCAA blend increased the weight of freshly hatched poults in turkey by improving skeletal muscle development [5]. These contradictory results may be related to the number of amino acids injected and the species. In any case, our results, consistently with [8] showed that embryonic supplementation of amino acids can achieve long-lasting enhancement of growth performance in Japanese quails.
Gastrointestinal growth is necessary to ensure nutrient absorption to meet the demand of chicks. The maximal growth in intestinal length usually occurs between 4 and 8 days post-hatch, with body mass increasing more than six times in chickens [41]. In our study, leucine treatment increased gastrointestinal length by the time of measurement at day 21. Embryonic leucine activates the brush borders enzymes such as leucine amino peptidase that facilitate nutrient digestion and absorption [42,43]. Additionally, the increased gastrointestinal length supports physiological adaptation and maintenance of intestinal homeostasis, ensuring nutrient absorption for survival and growth in poultry [26,44,45].
We investigated the impact of in ovo leucine supplementation on postnatal growth and development in Japanese quail in relation to the activity of the nutrient-sensing IGF-1/mTOR pathway. We found that a subtle increase in embryonic leucine had a long-lasting programming effect on postnatal growth, which was mediated through the IGF-1/mTOR pathway.
Our study focused on messenger RNA (mRNA) changes that provide an early indication of the cellular responses to stimuli such as nutrients and growth factors [46]. These stimuli initiate the expression of specific genes [47], which may affect the mRNA levels without the corresponding change in the respective protein levels [48]. Similarly, due to temporal dynamics of gene expression changes in response to nutrients, early changes in mRNA can be a predictive measure of the subsequent changes in the protein levels accompanied by the activation of the IGF-1/mTOR pathway downstream molecules [49]. mRNA is an important early marker that reprograms a cell to respond to the specific signal and predicts a desired new phenotypic trait before becoming apparent at the protein level. Additional mRNA regulatory mechanisms, such as post-transcriptional regulation, translational efficiency, and protein degradation, link mRNA and the phenotype [46,50,51].
In response to the leucine treatment, we found altered hepatic gene expression patterns in the nutrient-sensing IGF-1/mTOR pathway already at hatching. This is intriguing because phenotypic differences in growth manifested only at day 3, 5, or 7 (for tarsus length, body mass, and head and wing length, respectively); thus, the genetic upregulation preceded enhanced growth by several days. These results corroborate the findings of our recent study [8], where we showed that a 2% increase in embryonic methionine also had a programmatic effect on the developmental trajectories of Japanese quails. The effects of leucine seem to be even stronger than those of methionine, as the phenotypic differences manifested earlier and affected more skeletal variables. Moreover, the upregulation of IGF1 lasted until day 21, whereas for methionine treatment, at day 21, the relative expression of IGF1 was already similar between the treatment and the control group [8]. Apart from the differences in amino acids used in the two studies, the current study also employed supplementation at a later stage (day 10 vs. day 0 for methionine). Further studies are needed to disentangle whether a more advanced stage of embryonic development is responsible for the stronger growth-promoting effects in the current study, or if leucine is a more potent activator of the IGF-1/mTOR pathway and, thus, phenotypic growth.
Similar to IGF1 and IGF1R, the expression of mTOR and one of its key downstream effectors, ribosomal protein S6 kinase 1 (RPS6K1), was also increased at hatching in response to leucine treatment. mTOR plays a crucial role in regulating protein synthesis and cell differentiation, proliferation, and growth in response to nutrients such as leucine and growth factors [52,53]. In the presence of nutrients such as leucine, it activates mTOR complex 1 (mTORC1), which then phosphorylates the downstream effectors such as S6K1 proteins [54,55]. However, unlike IGF1, the relative expression of IGF1R, mTOR, and RPS6K1 returned to the level of controls by day 21. This pattern partly resembles the effects found for methionine (8), where initially upregulated mTOR expression disappeared by the end of the experiment. However, the current study shows the opposite pattern for RPS6K1, which was upregulated only on day 21 following a methionine treatment [8], whereas here, it was only affected at hatching. S6K1 is the downstream effector of the mTOR pathway, and its activation requires mTOR-mediated phosphorylation for protein synthesis, cell size, and cell growth [56,57,58]. The difference in the RPS6K1 gene expression pattern between leucine and methionine indicated that specific amino acids may have distinct roles in influencing postnatal growth and development in Japanese quail. Consistent with our results, dietary leucine supplementation post-hatch in broiler chickens [25] and Zebrafish (Danio rerio) [59] increased activation of mTOR and RPS6K1 genes in the breast muscles with increased age. However, dietary supplementation of leucine in broilers at the ages of 1 to 10, 11 to 21, and 22 to 35 days neither influenced the relative expression of mTOR and RPS6K1 nor improved growth performance [18]. These results indicate that embryonic treatment may provide significant and lasting growth compared to postnatal supplementation.
Maintaining the balance between protein synthesis and degradation is crucial for growth and development. Protein synthesis is interlinked with the protein kinase B/Akt pathway, with the Akt/mTOR pathway stimulating protein synthesis, and the Akt/FOXO1 pathway responsible for protein degradation [18,19]. FOXO1, a transcriptional factor downstream of the protein kinase B/Akt pathway, regulates cell survival, growth, and development [60,61]. Under nutrient scarcity, FOXO1 triggers autophagic and proteasomal gene transcription, breaking down skeletal muscle protein for gluconeogenesis [62,63,64]. However, excessive autophagy and protein degradation can have negative impacts, such as cell death and growth reduction [61,65]. Our results showed that FOXO1 gene expression did not show a difference between the leucine and controls in both day-old and 21-day-old chicks. The increase in the expression of the FOXO1 gene reduces the accumulation of toxic protein in mammals [61], which suggests a positive influence on protein metabolism and improves the growth of poultry. For example, thermal manipulation elevated FOXO1 gene expression during embryogenesis, accelerating broiler growth [66]. Dietary leucine supplementation in broiler chicks at ages 1 to 10, 11 to 21, and 22 to 35 did not show a difference in FOXO1 gene expression [18]. However, the transcriptional analysis of FOXO genes showed increased transcriptomes of broilers compared to layers, suggesting that the FOXO genes, including the FOXO1 gene, are also essential in regulating growth and metabolism in poultry [67]. Despite the contradictory evidence, this shows that the FOXO1 gene is responsible for controlling growth in poultry.
5. Conclusions
Taken together, our study revealed that embryonic supplementation of a subtle dose of leucine triggers several key elements of the IIS/mTOR pathway and promotes enhanced postnatal growth in Japanese quail. Conducting comparative studies across various avian species and developmental stages will provide a broader perspective on how specific nutrients influence growth and development. Conducting a longitudinal study that examines multiple supplementation time points would clarify the optimal timing for maximising growth effects. Longitudinal studies tracking quail from hatching to adulthood would help assess whether early growth advantages translate into long-term benefits, such as improved reproductive performance, survivability, or overall health. Exploring the molecular mechanisms at different stages could shed light on why certain time points are more effective. Moreover, investigating the combined effects of leucine and other essential amino acids could potentially uncover synergistic influences on growth and development. These results highlight the potential biological importance of nutritional cues as a form of early maternal investment to adjust offspring phenotypes [68,69] while opening an avenue for enhancing poultry productivity.
Supplementary Materials
The following supporting information can be downloaded at: https://www.mdpi.com/article/10.3390/ani14172596/s1, Table S1: Mean, standard deviation (SD) and standard error of the mean (SE) of body mass, head length, wing length and tarsal length of each day in each treatment.
Author Contributions
S.F.N.: conceptualisation, data curation, formal analysis, investigation, visualisation, methodology, validation, writing—original draft preparation, writing—review and editing; G.K.R.: conceptualisation, methodology, writing and editing; B.C.: methodology, writing and editing; R.K.: methodology, writing and editing; C.S.: methodology, resources, writing—review and editing; J.K.L.: methodology, writing—review and editing; Á.Z.L.: conceptualisation, supervision, funding acquisition, project administration, resources, validation, data curation, formal analysis, writing—review and editing; L.C.: conceptualisation, supervision, funding acquisition, project administration, resources, validation, writing—review and acquisition. All authors have read and agreed to the published version of the manuscript.
Funding
The study was funded by the National Development Research and Innovation Office (OTKA K139021) to Ádám Z. Lendvai and Levente Czeglédi. Sawadi F. Ndunguru, Gebrehaweria K. Reda and James K. Lugata received a Stipendium Hungaricum Scholarship from the Tempus Public Foundation for Ph.D. studies. We appreciate the support from the University of Debrecen Program for Scientific Publication.
Institutional Review Board Statement
Experiments were approved by the Institutional Committee of Animal Welfare permit number 5/2021/DEMAB. We carried out the trial at the experimental farm of the University of Debrecen, Farm and Regional Research Institute, Kismacs, Hungary.
Informed Consent Statement
Not applicable.
Data Availability Statement
Raw data and supporting analyses are submitted as Supplementary Materials.
Acknowledgments
We are grateful to Budai Fürjészet for providing the Japanese quail chicks that were raised as layers. We thank farm managers and workers at Farm and Regional Research Institute, Kismacs, University of Debrecen, Hungary, for their logistic support.
Conflicts of Interest
The authors declare no conflicts of interest.
References
- Jha, R.; Singh, A.K.; Yadav, S.; Berrocoso, J.F.D.; Mishra, B. Early Nutrition Programming (in ovo and Post-hatch Feeding) as a Strategy to Modulate Gut Health of Poultry. Front. Veter. Sci. 2019, 6, 82. [Google Scholar] [CrossRef] [PubMed]
- Abdel-Moneim, A.-M.E.; Shehata, A.M.; Paswan, V.K. Editorial: Early life programming in poultry: Recent insights and interventional approaches. Front. Veter. Sci. 2023, 9, 1105653. [Google Scholar] [CrossRef] [PubMed]
- Koletzko, B.; Beyer, J.; Brands, B.; Demmelmair, H.; Grote, V.; Haile, G.; Gruszfeld, D.; Rzehak, P.; Socha, P.; Weber, M. Early influences of nutrition on postnatal growth. In Recent Advances in Growth Research: Nutritional, Molecular and Endocrine Perspectives; Nestle Nutrition Institute Workshop Series; Karger Publishers: Basel, Switzerland, 2013; pp. 11–27. [Google Scholar] [CrossRef]
- Searcy, W.A.; Peters, S.; Nowicki, S. Effects of early nutrition on growth rate and adult size in song sparrows Melospiza melodia. J. Avian Biol. 2004, 35, 269–279. [Google Scholar] [CrossRef]
- Kop-Bozbay, C.; Ocak, N. In ovo injection of branched-chain amino acids: Embryonic development, hatchability and hatching quality of turkey poults. J. Anim. Physiol. Anim. Nutr. 2019, 103, 1135–1142. [Google Scholar] [CrossRef]
- Lugata, J.K.; Ndunguru, S.F.; Reda, G.K.; Gulyás, G.; Knop, R.; Oláh, J.; Czeglédi, L.; Szabó, C. In ovo feeding of methionine affects antioxidant status and growth-related gene expression of TETRA SL and Hungarian indigenous chicks. Sci. Rep. 2024, 14, 4387. [Google Scholar] [CrossRef]
- Chen, M.; Xie, W.; Pan, N.; Wang, X.; Yan, H.; Gao, C. Methionine improves feather follicle development in chick embryos by activating Wnt/β-catenin signaling. Poult. Sci. 2020, 99, 4479–4487. [Google Scholar] [CrossRef]
- Ndunguru, S.F.; Reda, G.K.; Csernus, B.; Knop, R.; Gulyás, G.; Szabó, C.; Czeglédi, L.; Lendvai, Z. Embryonic methionine triggers post-natal developmental programming in Japanese quail. J. Comp. Physiol. B 2024, 194, 179–189. [Google Scholar] [CrossRef]
- Liu, R.; Tan, X.; Zhao, G.; Chen, Y.; Zhao, D.; Li, W.; Zheng, M.; Wen, J. Maternal dietary methionine supplementation influences egg production and the growth performance and meat quality of the offspring. Poult. Sci. 2020, 99, 3550–3556. [Google Scholar] [CrossRef] [PubMed]
- Regan, J.C.; Froy, H.; Walling, C.A.; Moatt, J.P.; Nussey, D.H. Dietary restriction and insulin-like signalling pathways as adaptive plasticity: A synthesis and re-evaluation. Funct. Ecol. 2019, 34, 107–128. [Google Scholar] [CrossRef]
- Oldham, S.; Hafen, E. Insulin/IGF and target of rapamycin signaling: A TOR de force in growth control. Trends Cell Biol. 2003, 13, 79–85. [Google Scholar] [CrossRef]
- Lodjak, J.; Verhulst, S. Insulin-like growth factor 1 of wild vertebrates in a life-history context. Mol. Cell. Endocrinol. 2020, 518, 110978. [Google Scholar] [CrossRef] [PubMed]
- Pedrosa, R.G.; Donato, J.; Pires, I.S.; Tirapegui, J. Leucine supplementation increases serum insulin-like growth factor 1 concentration and liver protein/RNA ratio in rats after a period of nutritional recovery. Appl. Physiol. Nutr. Metab. 2013, 38, 694–697. [Google Scholar] [CrossRef] [PubMed]
- Tóth, Z.; Mahr, K.; Ölveczki, G.; Őri, L.; Lendvai, Z. Food Restriction Reveals Individual Differences in Insulin-Like Growth Factor-1 Reaction Norms. Front. Ecol. Evol. 2022, 10, 826968. [Google Scholar] [CrossRef]
- Yakar, S.; Adamo, M.L. Insulin-Like Growth Factor 1 Physiology. Endocrinol. Metab. Clin. N. Am. 2012, 41, 231–247. [Google Scholar] [CrossRef] [PubMed]
- Saltiel, A.R.; Kahn, C.R. Insulin signalling and the regulation of glucose and lipid metabolism. Nature 2001, 414, 799–806. [Google Scholar] [CrossRef]
- Anthony, T.G. Mechanisms of protein balance in skeletal muscle. Domest. Anim. Endocrinol. 2016, 56, S23–S32. [Google Scholar] [CrossRef]
- Zeitz, J.O.; Käding, S.-C.; Niewalda, I.R.; Most, E.; Dorigam, J.C.d.P.; Eder, K. The influence of dietary leucine above recommendations and fixed ratios to isoleucine and valine on muscle protein synthesis and degradation pathways in broilers. Poult. Sci. 2019, 98, 6772–6786. [Google Scholar] [CrossRef]
- Glass, D.J. Signaling pathways perturbing muscle mass. Curr. Opin. Clin. Nutr. Metab. Care 2010, 13, 225–229. [Google Scholar] [CrossRef]
- Averous, J.; Lambert-Langlais, S.; Carraro, V.; Gourbeyre, O.; Parry, L.; B’Chir, W.; Muranishi, Y.; Jousse, C.; Bruhat, A.; Maurin, A.-C.; et al. Requirement for lysosomal localization of mTOR for its activation differs between leucine and other amino acids. Cell. Signal. 2014, 26, 1918–1927. [Google Scholar] [CrossRef]
- Ouyang, Y.; Wu, Q.; Li, J.; Sun, S.; Sun, S. S-adenosylmethionine: A metabolite critical to the regulation of autophagy. Cell Prolif. 2020, 53, e12891. [Google Scholar] [CrossRef]
- Kim, W.K.; Singh, A.K.; Wang, J.; Applegate, T. Functional role of branched chain amino acids in poultry: A review. Poult. Sci. 2022, 101, 101715. [Google Scholar] [CrossRef]
- Mullenix, G.; Maynard, C.; Lee, J.; Rao, S.; Butler, L.; Hiltz, J.; Orlowski, S.; Kidd, M. Failure of excess leucine to impact live performance and carcass traits in male and female Cobb MV × 500 broilers during a 15- to 32-day grower period. J. Appl. Poult. Res. 2022, 31, 100242. [Google Scholar] [CrossRef]
- Deng, H.; Zheng, A.; Liu, G.; Chang, W.; Zhang, S.; Cai, H. Activation of mammalian target of rapamycin signaling in skeletal muscle of neonatal chicks: Effects of dietary leucine and age. Poult. Sci. 2014, 93, 114–121. [Google Scholar] [CrossRef] [PubMed]
- Chang, Y.; Cai, H.; Liu, G.; Chang, W.; Zheng, A.; Zhang, S.; Liao, R.; Liu, W.; Li, Y.; Tian, J. Effects of dietary leucine supplementation on the gene expression of mammalian target of rapamycin signaling pathway and intestinal development of broilers. Anim. Nutr. 2015, 1, 313–319. [Google Scholar] [CrossRef] [PubMed]
- Huss, D.; Poynter, G.; Lansford, R. Japanese quail (Coturnix japonica) as a laboratory animal model. Lab Anim. 2008, 37, 513–519. [Google Scholar] [CrossRef] [PubMed]
- Lynch, J.M.; Barbano, D.M. Kjeldahl Nitrogen Analysis as a Reference Method for Protein Determination in Dairy Products. J. AOAC Int. 1999, 82, 1389–1398. [Google Scholar] [CrossRef] [PubMed]
- Simon, Á.; Jávor, A.; Bai, P.; Oláh, J.; Czeglédi, L. Reference gene selection for reverse transcription quantitative polymerase chain reaction in chicken hypothalamus under different feeding status. J. Anim. Physiol. Anim. Nutr. 2017, 102, 286–296. [Google Scholar] [CrossRef]
- Joshi, C.J.; Ke, W.; Drangowska-Way, A.; O’rourke, E.J.; Lewis, N.E. What are housekeeping genes? PLoS Comput. Biol. 2022, 18, e1010295. [Google Scholar] [CrossRef]
- Schmittgen, T.D.; Livak, K.J. Analyzing real-time PCR data by the comparative CT method. Nat. Protoc. 2008, 3, 1101–1108. [Google Scholar] [CrossRef]
- Greller, L.D.; Tobin, F.L. Detecting Selective Expression of Genes and Proteins. Genome Res. 1999, 9, 282–296. [Google Scholar] [CrossRef]
- R Core Team. A Language and Environment for Statistical Computing; R Foundation for Statistical Computing: Vienna, Austria, 2024; Available online: https://www.R-project.org/ (accessed on 11 August 2022).
- Vaida, F.; Blanchard, S. Conditional Akaike information for mixed-effects models. Biometrika 2005, 92, 351–370. [Google Scholar] [CrossRef]
- Guthery, F.S.; Burnham, K.P.; Anderson, D.R. Model selection and multimodel inference: A practical information-theoretic approach. J. Wild. Manag. 2003, 67, 655. [Google Scholar] [CrossRef]
- Harrison, X.A.; Donaldson, L.; Correa-Cano, M.E.; Evans, J.; Fisher, D.N.; Goodwin, C.E.D.; Robinson, B.S.; Hodgson, D.J.; Inger, R. A brief introduction to mixed effects modelling and multi-model inference in ecology. PeerJ 2018, 6, e4794. [Google Scholar] [CrossRef] [PubMed]
- Bates, D.; Mächler, M.; Bolker, B.; Walker, S. Fitting Linear Mixed-Effects Models Using lme4. J. Stat. Softw. 2015, 67, 48. [Google Scholar] [CrossRef]
- Kuznetsova, A.; Brockhoff, P.B.; Christensen, R.H.B. lmerTest Package: Tests in linear mixed effects models. J. Stat. Softw. 2017, 82, 1–26. [Google Scholar] [CrossRef]
- Searle, S.R.; Speed, F.M.; Milliken, G.A. Population Marginal Means in the Linear Model: An Alternative to Least Squares Means. Am. Stat. 1980, 34, 216–221. [Google Scholar] [CrossRef]
- Nabi, F.; Arain, M.A.; Bhutto, Z.A.; Shah, Q.A.; Bangulzai, N.; Ujjan, N.A.; Fazlani, S.A. Effect of early feeding of L-arginine and L-threonine on hatchability and post-hatch performance of broiler chicken. Trop. Anim. Health Prod. 2022, 54, 380. [Google Scholar] [CrossRef] [PubMed]
- Kita, K.; Ito, K.R.; Sugahara, M.; Kobayashi, M.; Makino, R.; Takahashi, N.; Nakahara, H.; Takahashi, K.; Nishimukai, M. Effect of In Ovo Administration of Branched-Chain Amino Acids on Embryo Growth and Hatching Time of Chickens. J. Poult. Sci. 2015, 52, 34–36. [Google Scholar] [CrossRef]
- Ravindran, V.; Abdollahi, M.R. Nutrition and Digestive Physiology of the Broiler Chick: State of the Art and Outlook. Animals 2021, 11, 2795. [Google Scholar] [CrossRef]
- Foye, O.; Ferket, P.; Uni, Z. The Effects of In Ovo Feeding Arginine, β-Hydroxy-β-Methyl-Butyrate, and Protein on Jejunal Digestive and Absorptive Activity in Embryonic and Neonatal Turkey Poults. Poult. Sci. 2007, 86, 2343–2349. [Google Scholar] [CrossRef]
- Han, G.; Ren, Y.; Shen, D.; Li, S.; Chowdhury, V.S.; Li, Y.; Furuse, M.; Li, C. L-Leucine In Ovo Administration Causes Growth Retardation and Modifies Specific Amino Acid Metabolism in Broiler Embryos. J. Poult. Sci. 2021, 58, 163–170. [Google Scholar] [CrossRef] [PubMed]
- Lugata, J.K.; Ndunguru, S.F.; Reda, G.K.; Ozsváth, X.E.; Angyal, E.; Czeglédi, L.; Gulyás, G.; Knop, R.; Oláh, J.; Mészár, Z.; et al. Methionine sources and genotype affect embryonic intestinal development, antioxidants, tight junctions, and growth-related gene expression in chickens. Anim. Nutr. 2024, 16, 218–230. [Google Scholar] [CrossRef] [PubMed]
- de Verdal, H.; Mignon-Grasteau, S.; Jeulin, C.; Le Bihan-Duval, E.; Leconte, M.; Mallet, S.; Martin, C.; Narcy, A. Digestive tract measurements and histological adaptation in broiler lines divergently selected for digestive efficiency. Poult. Sci. 2010, 89, 1955–1961. [Google Scholar] [CrossRef]
- Ma, X.M.; Yoon, S.-O.; Richardson, C.J.; Jülich, K.; Blenis, J. SKAR Links Pre-mRNA Splicing to mTOR/S6K1-Mediated Enhanced Translation Efficiency of Spliced mRNAs. Cell 2008, 133, 303–313. [Google Scholar] [CrossRef] [PubMed]
- Laplante, M.; Sabatini, D.M. Regulation of mTORC1 and its impact on gene expression at a glance. J. Cell Sci. 2013, 126, 1713–1719. [Google Scholar] [CrossRef] [PubMed]
- Roux, P.P.; Topisirovic, I. Regulation of mRNA Translation by Signaling Pathways. Cold Spring Harb. Perspect. Biol. 2012, 4, a012252. [Google Scholar] [CrossRef]
- Pascual-Ahuir, A.; Fita-Torró, J.; Proft, M. Capturing and Understanding the Dynamics and Heterogeneity of Gene Expression in the Living Cell. Int. J. Mol. Sci. 2020, 21, 8278. [Google Scholar] [CrossRef]
- Yeh, H.-S.; Yong, J. mTOR-coordinated Post-Transcriptional Gene Regulations: From Fundamental to Pathogenic Insights. J. Lipid Atheroscler. 2020, 9, 8–22. [Google Scholar] [CrossRef]
- Arif, W.; Datar, G.; Kalsotra, A. Intersections of post-transcriptional gene regulatory mechanisms with intermediary metabolism. Biochim. Biophys. Acta (BBA) Gene Regul. Mech. 2017, 1860, 349–362. [Google Scholar] [CrossRef]
- Saxton, R.A.; Sabatini, D.M. mTOR Signaling in Growth, Metabolism, and Disease. Cell 2017, 168, 960–976. [Google Scholar] [CrossRef]
- Laplante, M.; Sabatini, D.M. mTOR Signaling in Growth Control and Disease. Cell 2012, 149, 274–293. [Google Scholar] [CrossRef] [PubMed]
- Rehman, S.U.; Ali, R.; Zhang, H.; Zafar, M.H.; Wang, M. Research progress in the role and mechanism of Leucine in regulating animal growth and development. Front. Physiol. 2023, 14, 1252089. [Google Scholar] [CrossRef]
- Cruz, B.; Oliveira, A.; Ventrucci, G.; Gomes-Marcondes, M.C.C. A leucine-rich diet modulates the mTOR cell signalling pathway in the gastrocnemius muscle under different Walker-256 tumour growth conditions. BMC Cancer 2019, 19, 349. [Google Scholar] [CrossRef] [PubMed]
- Magnuson, B.; Ekim, B.; Fingar, D.C. Regulation and function of ribosomal protein S6 kinase (S6K) within mTOR signalling networks. Biochem. J. 2011, 441, 1–21. [Google Scholar] [CrossRef] [PubMed]
- Ma, X.M.; Blenis, J. Molecular mechanisms of mTOR-mediated translational control. Nat. Rev. Mol. Cell Biol. 2009, 10, 307–318. [Google Scholar] [CrossRef]
- Meyuhas, O.; Dreazen, A. Chapter 3 Ribosomal Protein S6 Kinase. In Progress in Molecular Biology and Translational Science; Elsevier: Amsterdam, The Netherlands, 2009; pp. 109–153. [Google Scholar] [CrossRef]
- Zhu, Q.-S.; Wang, J.; He, S.; Liang, X.-F.; Xie, S.; Xiao, Q.-Q. Early leucine programming on protein utilization and mTOR signaling by DNA methylation in zebrafish (Danio rerio). Nutr. Metab. 2020, 17, 67. [Google Scholar] [CrossRef]
- Zhou, J.; Liao, W.; Yang, J.; Ma, K.; Li, X.; Wang, Y.; Wang, D.; Wang, L.; Zhang, Y.; Yin, Y.; et al. FOXO3 induces FOXO1-dependent autophagy by activating the AKT1 signaling pathway. Autophagy 2012, 8, 1712–1723. [Google Scholar] [CrossRef]
- Furtado, G.V.; Yang, J.; Wu, D.; I Papagiannopoulos, C.; Terpstra, H.M.; Kuiper, E.F.E.; Krauss, S.; Zhu, W.-G.; Kampinga, H.H.; Bergink, S. FOXO1 controls protein synthesis and transcript abundance of mutant polyglutamine proteins, preventing protein aggregation. Hum. Mol. Genet. 2021, 30, 996–1005. [Google Scholar] [CrossRef]
- Haeusler, R.A.; Hartil, K.; Vaitheesvaran, B.; Arrieta-Cruz, I.; Knight, C.M.; Cook, J.R.; Kammoun, H.L.; Febbraio, M.A.; Gutierrez-Juarez, R.; Kurland, I.J.; et al. Integrated control of hepatic lipogenesis versus glucose production requires FoxO transcription factors. Nat. Commun. 2014, 5, 5190. [Google Scholar] [CrossRef]
- Haeusler, R.A.; Kaestner, K.H.; Accili, D. FoxOs Function Synergistically to Promote Glucose Production. J. Biol. Chem. 2010, 285, 35245–35248. [Google Scholar] [CrossRef]
- Langlet, F.; Haeusler, R.A.; Lindén, D.; Ericson, E.; Norris, T.; Johansson, A.; Cook, J.R.; Aizawa, K.; Wang, L.; Buettner, C.; et al. Selective Inhibition of FOXO1 Activator/Repressor Balance Modulates Hepatic Glucose Handling. Cell 2017, 171, 824–835.e18. [Google Scholar] [CrossRef] [PubMed]
- Tesseraud, S.; Avril, P.; Bonnet, M.; Bonnieu, A.; Cassar-Malek, I.; Chabi, B.; Dessauge, F.; Gabillard, J.-C.; Perruchot, M.-H.; Seiliez, I. Autophagy in farm animals: Current knowledge and future challenges. Autophagy 2020, 17, 1809–1827. [Google Scholar] [CrossRef] [PubMed]
- Al Amaz, S.; Shahid, A.H.; Chaudhary, A.; Jha, R.; Mishra, B. Embryonic thermal manipulation reduces hatch time, increases hatchability, thermotolerance, and liver metabolism in broiler embryos. Poult. Sci. 2024, 103, 103527. [Google Scholar] [CrossRef]
- Willson, N.-L.; Forder, R.E.A.; Tearle, R.; Williams, J.L.; Hughes, R.J.; Nattrass, G.S.; Hynd, P.I. Transcriptional analysis of liver from chickens with fast (meat bird), moderate (F1 layer x meat bird cross) and low (layer bird) growth potential. BMC Genom. 2018, 19, 309. [Google Scholar] [CrossRef] [PubMed]
- Lindström, J. Early development and fitness in birds and mammals. Trends Ecol. Evol. 1999, 14, 343–348. [Google Scholar] [CrossRef]
- Groothuis, T.G.; Kumar, N.; Hsu, B.-Y. Explaining discrepancies in the study of maternal effects: The role of context and embryo. Curr. Opin. Behav. Sci. 2020, 36, 185–192. [Google Scholar] [CrossRef]
Disclaimer/Publisher’s Note: The statements, opinions and data contained in all publications are solely those of the individual author(s) and contributor(s) and not of MDPI and/or the editor(s). MDPI and/or the editor(s) disclaim responsibility for any injury to people or property resulting from any ideas, methods, instructions or products referred to in the content. |
© 2024 by the authors. Licensee MDPI, Basel, Switzerland. This article is an open access article distributed under the terms and conditions of the Creative Commons Attribution (CC BY) license (https://creativecommons.org/licenses/by/4.0/).