Article

The Ruminal Microbiome Alterations Associated with Diet-Induced Milk Fat Depression and Milk Fat Globule Size Reduction in Dairy Goats

1
Henan International Joint Laboratory of Nutrition Regulation and Ecological Raising of Domestic Animal, College of Animal Science and Technology, Henan Agricultural University, Zhengzhou 450046, China
2
Key Laboratory of Animal Biochemistry and Nutrition, Ministry of Agriculture and Rural Affairs, College of Verterinary Medicine, Henan Agricultural University, Zhengzhou 450046, China
*
Authors to whom correspondence should be addressed.
Animals 2024, 14(17), 2614; https://doi.org/10.3390/ani14172614
Submission received: 29 July 2024 / Revised: 28 August 2024 / Accepted: 4 September 2024 / Published: 9 September 2024
(This article belongs to the Section Small Ruminants)

Abstract

:

Simple Summary

The aim of this study was to evaluate the effect of conjugated linoleic acid on the milk fat globule size and the ruminal microbiome of goats. In the present study, we found that dietary conjugated linoleic acid supplementation significantly and dose-dependently decreased the milk fat content and fat globule size in Saanen dairy goats, accompanied by an increase in the proportion of small-sized fat globules. Moreover, the dairy goats occurred in parallel with significant changes in the relative abundance of some ruminal bacterial populations. The milk fat content and fat globule size were correlated with the relative abundance of some bacteria, including members of Firmicutes and Bacteroidetes. Notably, our study was the first to analyze the correlation between the ruminal microbiota and fat globule size. These results constitute the first evidence for explaining the mechanism underlying diet-induced fat globules from the perspective of the ruminal microbiome in dairy goats.

Abstract

The aim of this study was to evaluate the effect of conjugated linoleic acid (CLA) on milk fat globule (MFG) size and the ruminal microbiome of goats. Twenty-four mid-lactation Saanen dairy goats weighing 49 ± 4.5 kg (168 ± 27 d in milk, 1.2 ± 0.1 kg milk/d, 2–3 years old) were randomly divided into four groups—a control (CON) group, which was fed a basal diet, and three CLA supplementation groups, in which 30 g CLA (low-dose group, L-CLA), 60 g CLA (medium-dose group, M-CLA), or 90 g CLA (high-dose group, H-CLA) was added to the basal diet daily. The experiment lasted for 21 days, during which time goat milk was collected for composition and MFG size analysis. On day 21 of feeding, ruminal fluid was collected from the CON and H-CLA groups for analysis of the changes in microorganismal abundance. The results showed that CLA supplementation did not affect milk production, milk protein, or lactose content in the dairy goats (p > 0.05), but significantly reduced the milk fat content (p < 0.01) compared with the CON group. The CLA supplementation significantly decreased the D[3,2] and D[4,3] of the MFGs in a dose-dependent manner (p < 0.01). Moreover, dietary CLA inclusion increased the proportion of small-sized MFGs and decreased that of large-sized ones. The results of 16S rRNA gene sequencing showed that CLA-induced milk fat depression in dairy goats was accompanied by significant changes in the relative abundance of ruminal bacterial populations, most of which belonged to the Firmicutes and Bacteroidetes phyla. The relative abundance of Rikenellaceae_RC9_gut_group and Prevolellaceae_UCG-003 in Bacteroidetes and UCG-002, Succiniclasticum, and norank_f__norank_o__Clostridia_vadinBB60_group in Firmicutes was significantly higher in the CON group than in the H-CLA group. In contrast, the relative abundance of norank_f__UCG-011, norank_f_Eubacterium_coprostanoligenes_group, unclassified_f__Lachnospiraceae, and UCG-001 in Firmicutes and norank_f__Muribaculaceae in Bacteroidetes was significantly higher in the H-CLA group than in the CON group. Correlation analysis showed that the milk fat content was negatively correlated with the relative abundance of some bacteria, including members of Firmicutes and Bacteroidetes. Similarly, MFG size (D[3,2] and D[4,3]) was negatively correlated with several members of Firmicutes and Bacteroidetes, including Lachnospiraceae, norank_f__UCG-011, UCG-001, norank_f__Eubacterium_coprostanoligenes_group (Firmicutes), and norank_f__Muribaculaceae (Bacteroidetes), while positively correlated with the relative abundance of some members of Firmicutes and Bacteroidetes, including Mycoplasma, Succiniclasticum, norank_f__norank_o__Clostridia_vadinBB60_group, UCG-002 (Firmicutes), and Rikenellaceae_RC9_gut_group (Bacteroidetes). Overall, our data indicated that CLA treatment affected milk fat content and MFG size in dairy goats, and these effects were correlated with the relative abundance of ruminal bacterial populations. These results provide the first evidence to explain the mechanism underlying diet-induced MFG from the perspective of the ruminal microbiome in dairy goats.

1. Introduction

Goat milk is rich in nutrients and has unique medical and health-benefiting properties. Fat is the most variable main component in milk and its level can be affected by the ratio of dietary components [1]. In dairy cattle, it has been found that a high concentrate/low roughage feed or the addition of oil to the diet leads to a reduction in milk fat content and the occurrence of milk fat depression (MFD). Milk fat depression is a common phenomenon in ruminants that has puzzled breeders and scientists for over a century [2].
Fat in milk exists mainly in the form of milk fat globules (MFGs) [3]. The size of fat globules is an important characteristic of milk fat, affecting milk fat content and milk production and processing [4,5]. It has been reported that animal species and varieties, feeding methods, lactation stage, and seasons all affect the size of MFGs [6,7,8]. Conjugated linoleic acid (CLA) is an intermediate product of ruminal microbial metabolism in ruminants. The dietary addition of CLA can reduce the milk fat content of cows and goats, resulting in MFD [9,10,11]. Additionally, we previously found that CLA can reduce both the milk fat content of dairy cows, resulting in MFD, and the size of MFGs [12,13]. However, whether CLA affects the size of MFGs in dairy goats remains unclear.
Milk fat depression is a classic example of the interaction between dietary nutrients, gastrointestinal microbiota, and tissue physiology [14]. Dietary composition affects the structure of the ruminal microbiota [15]. Studies have found that ruminal bacteria are closely related to milk composition [16,17]. In large-scale dairy farming, the feeding of high-concentrate diets leads to a decline in milk fat content due to consequent changes in volatile fatty acid concentrations and ruminal microbiota composition [18]. Ruminal microbiota, as an important component of the digestive system of ruminants, is crucial for their early development, health, and physiology. Nevertheless, little is known about the role of ruminal microbiota in the regulation of MFG size.
Therefore, in this study, we hypothesized that microorganisms play a regulatory role in the MFD process in dairy goats. To prove this possibility, we first induced MFD in dairy goats through dietary CLA addition and subsequently assessed the effects on milk fat contents and MFG size. Additionally, we investigated the relationship between the ruminal microbiome and MFG in dairy goats, aiming to reveal the role of the gut microbiota in the MFD process in these ruminants.

2. Materials and Methods

2.1. Ethics Approval

The study was conducted on a dairy goat farm in central China. All procedures involving animals were performed in accordance with the experimental practices and standards approved by the Animal Welfare and Research Ethics Committee of Henan Agricultural University (HNND2024031807, 18 March 2024).

2.2. Animals, Diets, and Sampling

Twenty-four mid-lactation Saanen dairy goats weighing 49 ± 4.5 kg (1.2 ± 0.1 kg milk/d, 168 ± 27 d in milk, 2–3 years old)) were used in this study and were provided fresh feed twice a day at 06:00 and 16:00 h. Goats were housed in a naturally ventilated barn and fed individually; the diet was formulated to meet the nutritional requirements of dairy goats. The dietary information is listed in Supplementary Table S1. During the experiment, the goats were allowed free access to a total mixed ration and water. Through power analysis, it was calculated that 6 dairy goats per group were justified. The goats were randomly divided into four groups (n = 6/group)—a control (CON) group, which was fed a basal diet, and three CLA supplementation groups (a low-dose [L-CLA] group, a medium-dose [M-CLA] group and a high-dose [H-CLA] group), in which the animals were fed a basal diet containing 30 g CLA, 60 g CLA, and 90 g CLA daily, respectively. The whole experiment included a 5-d adaptation period and a 21-d feeding period. During the adaptation period, the amount of CLA added is gradually increased. Microencapsulated CLA powder was purchased from Qingdao Aohai Biological Co., Ltd., Qingdao, China. The fatty acid composition of the CLA is shown in Table 1. Milk production was recorded once daily. Raw milk samples were collected at 8:00 h every morning for the analysis of MFG size and milk composition. Some of the milk samples were sent to Henan DHI Testing Centre for the analysis of milk composition (including milk fat, protein, and lactose contents) using infrared spectrophotometry (Foss 120 Milko-Scan, Norborg, Denmark); some were sent back to the laboratory of Henan Agricultural University for MFG size measurement using a Mastersizer 3000 laser particle size analyzer (Malvern Instruments Ltd., Malvern, UK). Ruminal fluid was sampled from CON and H-CLA groups at the end of the 21-d feeding period and quickly stored in liquid nitrogen for microbiome analysis. The dairy goat was fixed with a neck clamp, the sampler pressed its tongue and tilted its head upward. Then, the disinfected ruminal fluid sampling tube was inserted into the mouth of the experimental animal, and the tube was sent to the throat along the tongue and through the esophagus. When the other end of the collection tube can obviously smell the odor of ruminal fluid and the experimental animal’s breathing is smooth, it indicates that the tube has reached the abdominal sac of the rumen. Next, the 100 mL syringe was connected to the end of the sampling tube, and the ruminal content could be extracted by pumping the syringe.

2.3. MFG Size Analysis

According to the operating instructions of the Mastersizer 3000, the refractive index was set to 1.560 for milk and 1.330 for pure water. A total of 400 mL of water was added to a beaker and stirred at 1500× g, after which approximately 1 mL of pure milk was added to the beaker. The system automatically obtained three measurements and calculated average particle size parameters. The values obtained for each sample were analyzed with Mastersizer software for the determination of the volume-related equivalent diameter (D[4,3]), surface area-related equivalent diameter (D[3,2]), and specific surface area (SSA) values.

2.4. Ruminal Microbial DNA Extraction and PCR Amplification

Total DNA was extracted from microbial communities using the E.Z.N.A. soil DNA kit (Omega Bio-tek, Norcross, GA, USA) according to the manufacturer’s instructions. The quality of the extracted DNA was assessed on a 1% agarose gel while DNA concentration and purity were determined with a NanoDrop 2000 UV–vis spectrophotometer (Thermo Scientific, Wilmington, DE, USA). The hypervariable V3–V4 region of the bacterial 16S rRNA gene was amplified on an ABI GeneAmp 9700 PCR thermocycler (ABI, Oakland, CA, USA) using the primer pair 338F (5′-ACTCCTACGGGAGGCAGCAG-3′) and 806R (5′-GGACTACHVGGGTWTCTAAT-3′). The PCR amplification conditions were as follows: an initial denaturation at 95 °C for 3 min, followed by 27 cycles of denaturing at 95 °C for 30 s, annealing at 55 °C for 30 s, and extension at 72 °C for 45 s, with a final extension at 72 °C for 10 min. The reaction mixture contained 4 μL of 5× TransStart FastPfu buffer, 2 μL of 2.5 mM dNTPs, 0.8 μL of forward primer (5 μM), 0.8 μL of reverse primer (5 μM), 0.4 μL of TransStart FastPfu DNA Polymerase, 10 ng of template DNA, and ddH2O to 20 μL. The PCR runs were performed in triplicate.

2.5. Illumina MiSeq Sequencing

The PCR products were extracted from 2% agarose gels and purified using the AxyPrep DNA Gel Extraction Kit (Axygen Biosciences, Union City, CA, USA) according to the manufacturer’s instructions and quantified using a Quantus Fluorometer (Promega, Madison, WI, USA). Purified amplicons were pooled in equimolar amounts and paired-end sequenced by Majorbio Bio-Pharm Technology Co. Ltd. (Shanghai, China) on an Illumina MiSeq PE300 platform/NovaSeq PE250 platform (Illumina, San Diego, CA, USA) according to standard protocols.

2.6. Processing of Sequencing Data

The raw 16S rRNA gene sequencing reads were demultiplexed, quality-filtered using fastp (v.0.20.0) [19], and merged using FLASH v.1.2.7 [19] based on the following criteria. (i) The 300-bp reads were truncated at any site receiving an average quality score of <20 over a 50-bp sliding window; truncated reads shorter than 50 bp and reads containing N bases were discarded. (ii) Only overlapping sequences longer than 10 bp were assembled according to their overlapping sequence. The maximum mismatch ratio for the overlapping region was 0.2; reads that could not be assembled were discarded. (iii) Samples were distinguished according to the barcoded primers, the sequence direction was adjusted, and the barcodes were compared for exact sequence matching; two nucleotide mismatches were allowed for primer pairing.
Operational taxonomic units (OTUs) were clustered at a 97% similarity threshold using UPARSE v.7.1 [19] and chimeric sequences were identified and removed. The taxonomy of each OTU representative sequence was analyzed by RDP Classifier version 2.2 [19] against the 16S rRNA database (eg. Silva v.138) using a confidence threshold of 70%.

2.7. Statistical Analysis

Milk yield, composition, and MFG size were analyzed using full factorial repeated measures of the general linear model (GLM) in SPSS 24 (SPSS, IBM Corp., Chicago, IL, USA). The alpha diversity was analyzed using a t-Test. The results are reported as means ± standard error of the mean. Correlations between microorganisms and MFG size were assessed using mstools software (https://mstools.shinyapps.io/shiny/, accessed on 20 June 2024). Statistical significance was set at p < 0.05.

3. Results

3.1. Effect of CLA on the Production Performance of Dairy Goats

As can be seen from Table 2, there were no differences in milk yield among the four groups (p > 0.05). Regarding milk composition, CLA treatment did not affect protein or lactose contents (p > 0.5) but significantly reduced the milk fat content in a dose-dependent manner (p < 0.01). Milk fat content decreased by 52% from 3.63 g/100 mL in the CON group to 1.74 g/100 mL in the H-CLA group.

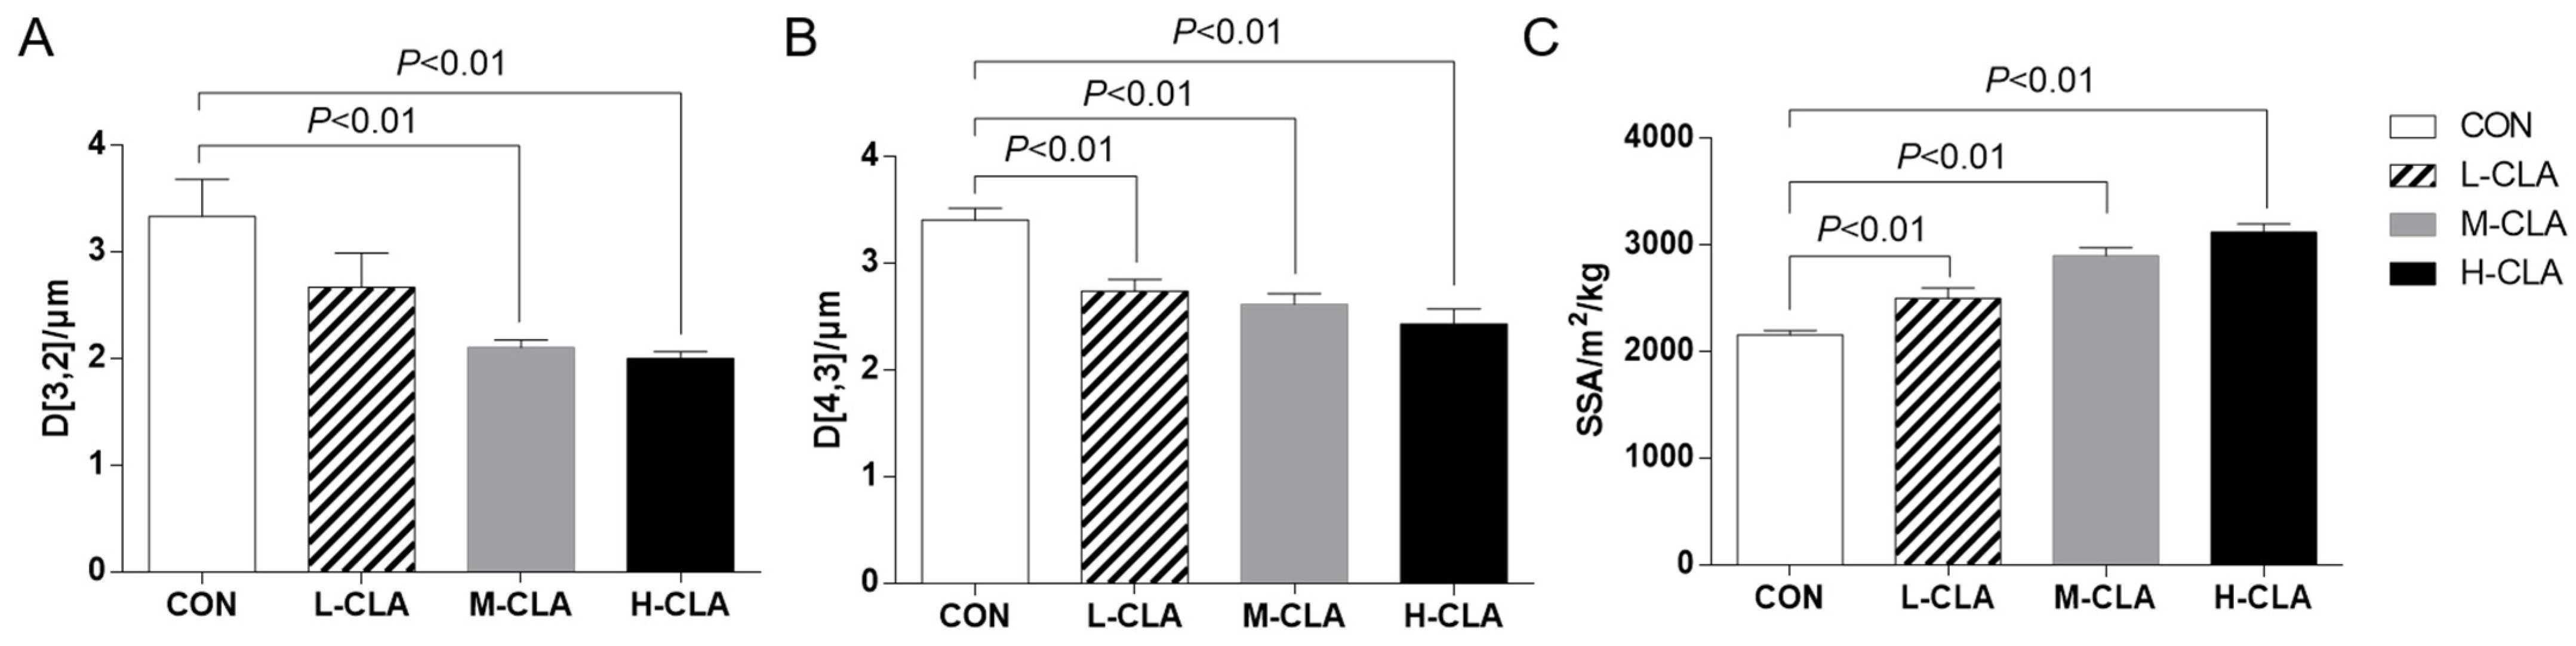
3.2. The Effect of CLA on MFG Size Parameters

As shown in Figure 1, CLA supplementation reduced the size of MFGs in a dose-dependent manner (p < 0.01). Among the parameters, the D[3,2] in the H-CLA and M-CLA groups (2.00 and 2.10 μm, respectively) was significantly lower than that in the CON group (3.33 μm) (p < 0.01). Meanwhile, the H-CLA group had the smallest D[4,3] value (2.43 μm), followed by the M-CLA (2.78 μm) and the L-CLA (2.74 μm) groups, all of which were significantly lower than that of the CON group (3.41 μm). Additionally, CLA supplementation led to a greater MFG SSA (p < 0.01), which showed a trend of H-CLA group > M-CLA group > L-CLA group > CON group. That is to say, the addition of CLA significantly reduced the MFG size.
Further analysis of the proportions of fat globule sizes in goat milk revealed that compared with the CON group, the percentage of small-sized fat globules gradually increased, while that of large-sized fat globules gradually decreased with increasing CLA dosage (Figure 2, p < 0.05). For instance, the percentage of large-sized MFGs (3–5 μm) was approximately 5% in the H-CLA and M-CLA groups, 6% in the L-CLA group, and 8.8% in the CON group, while the percentage of small-sized MFGs (<1 μm) was approximately 11% in the H-CLA and M-CLA groups, 2.7% in the L-CLA group, and 1.5% in the CON group. Moreover, the percentage of very large-sized MFGs (>5 μm) also showed a decreased trend in the CLA group.

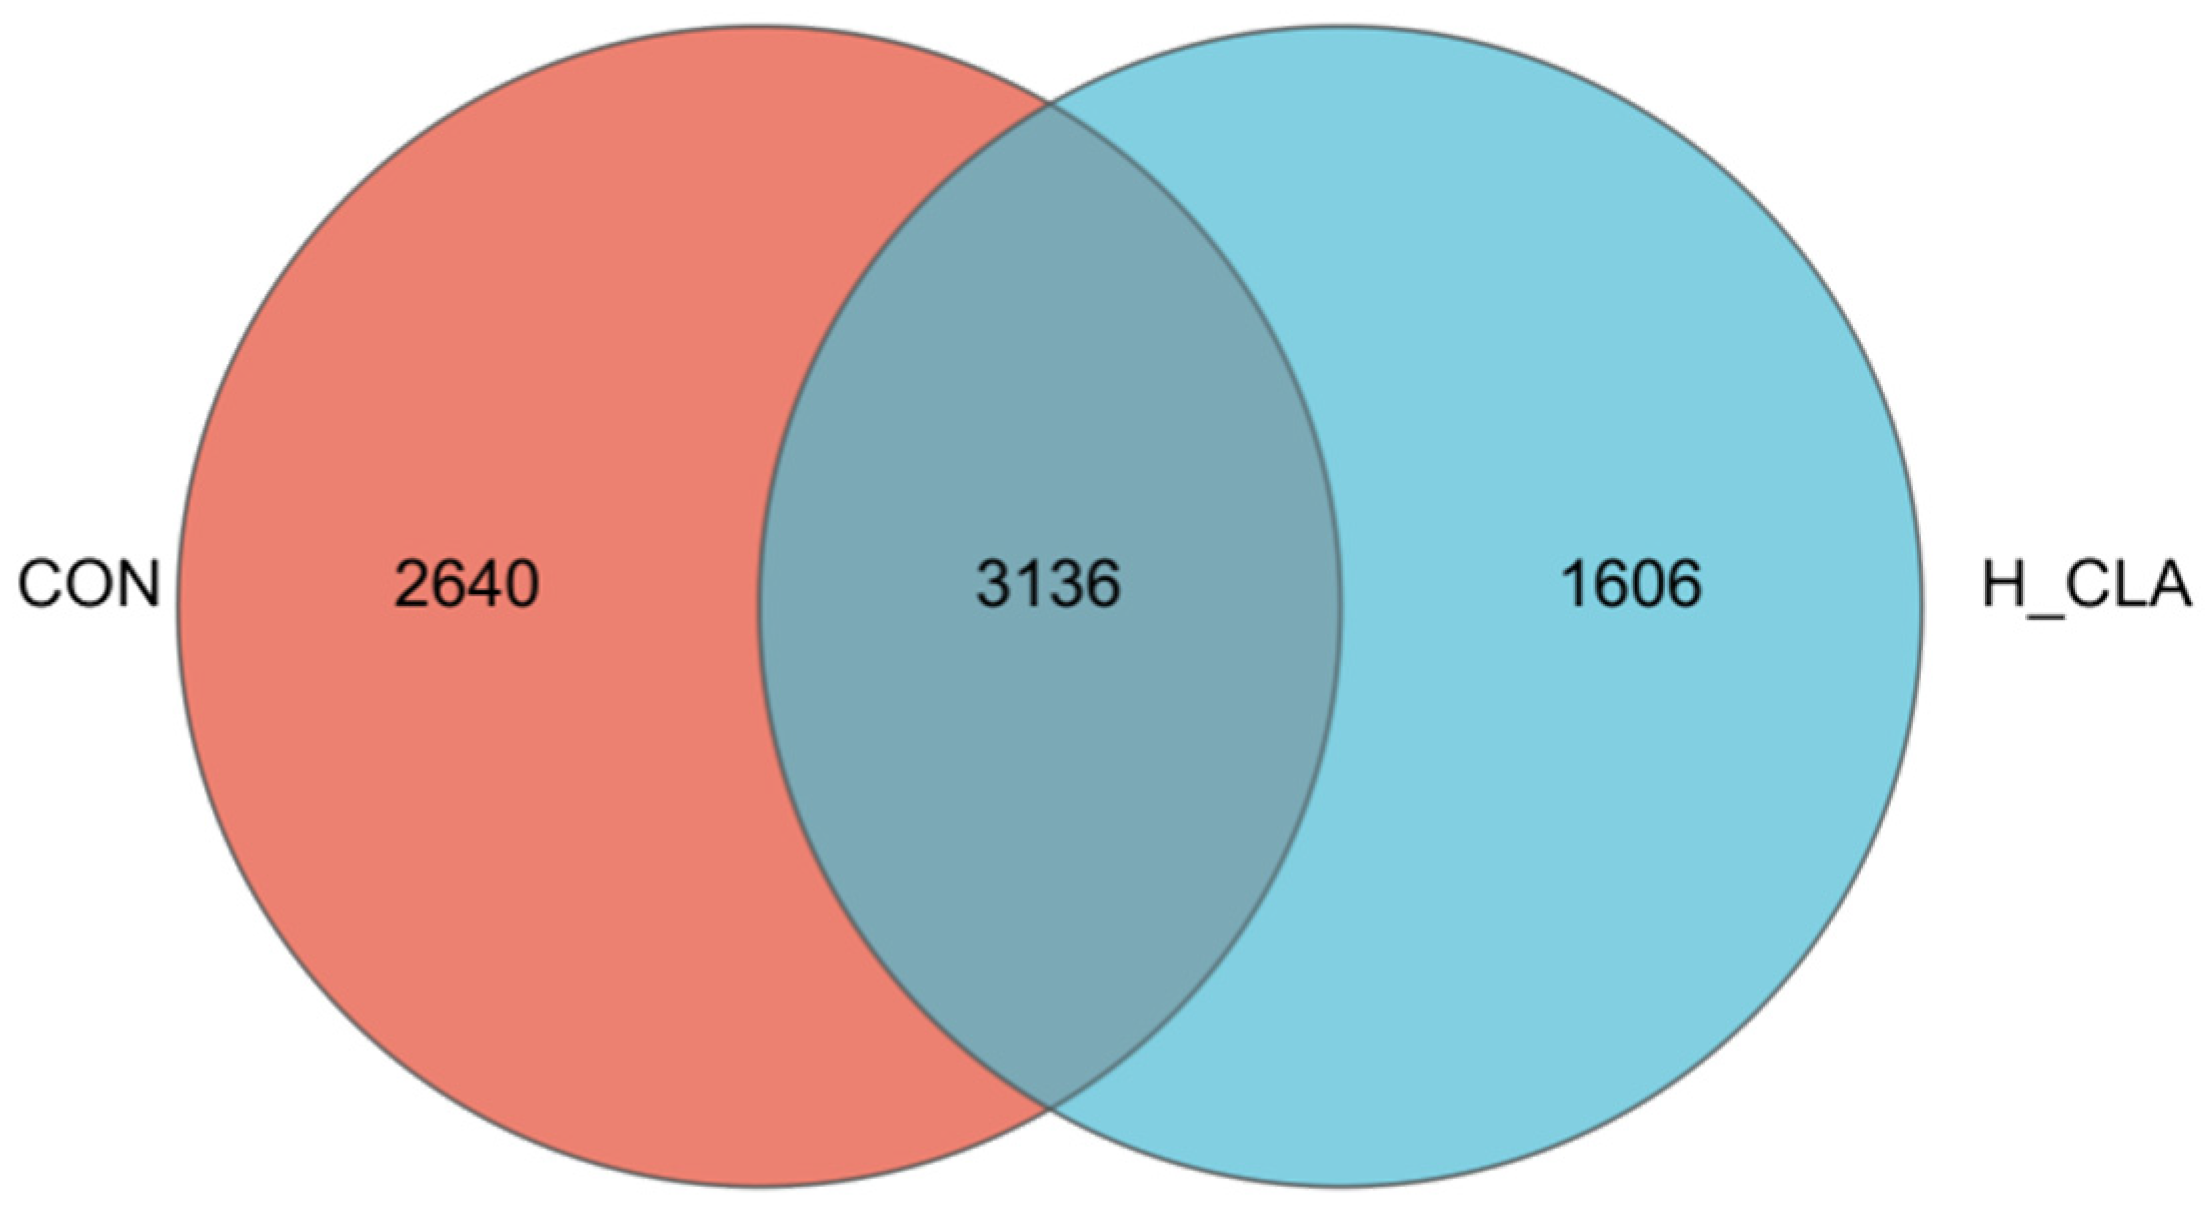
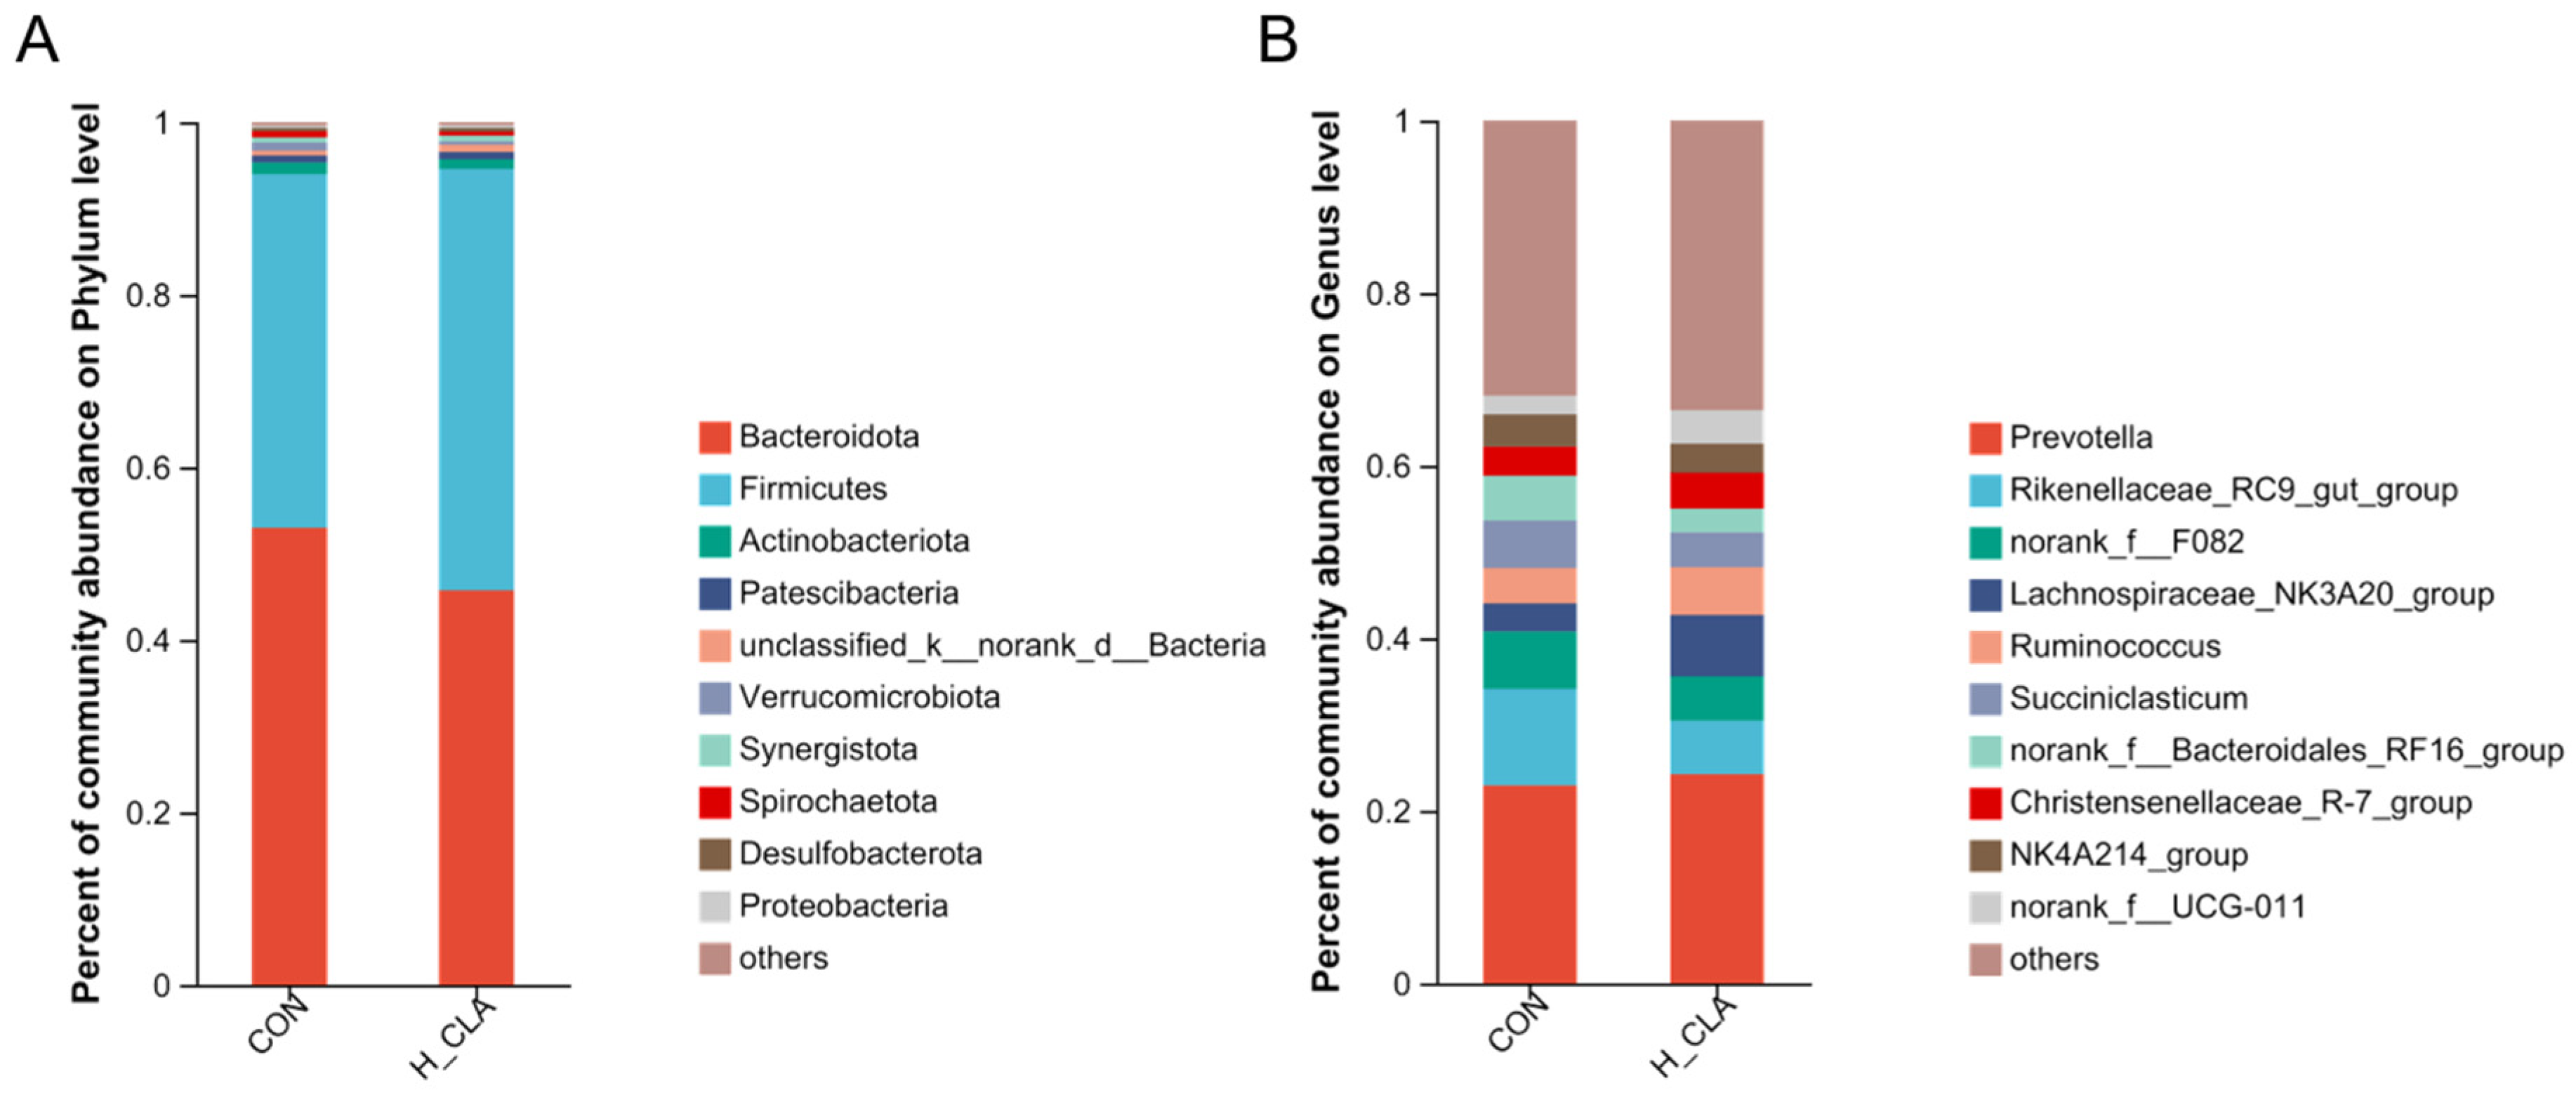
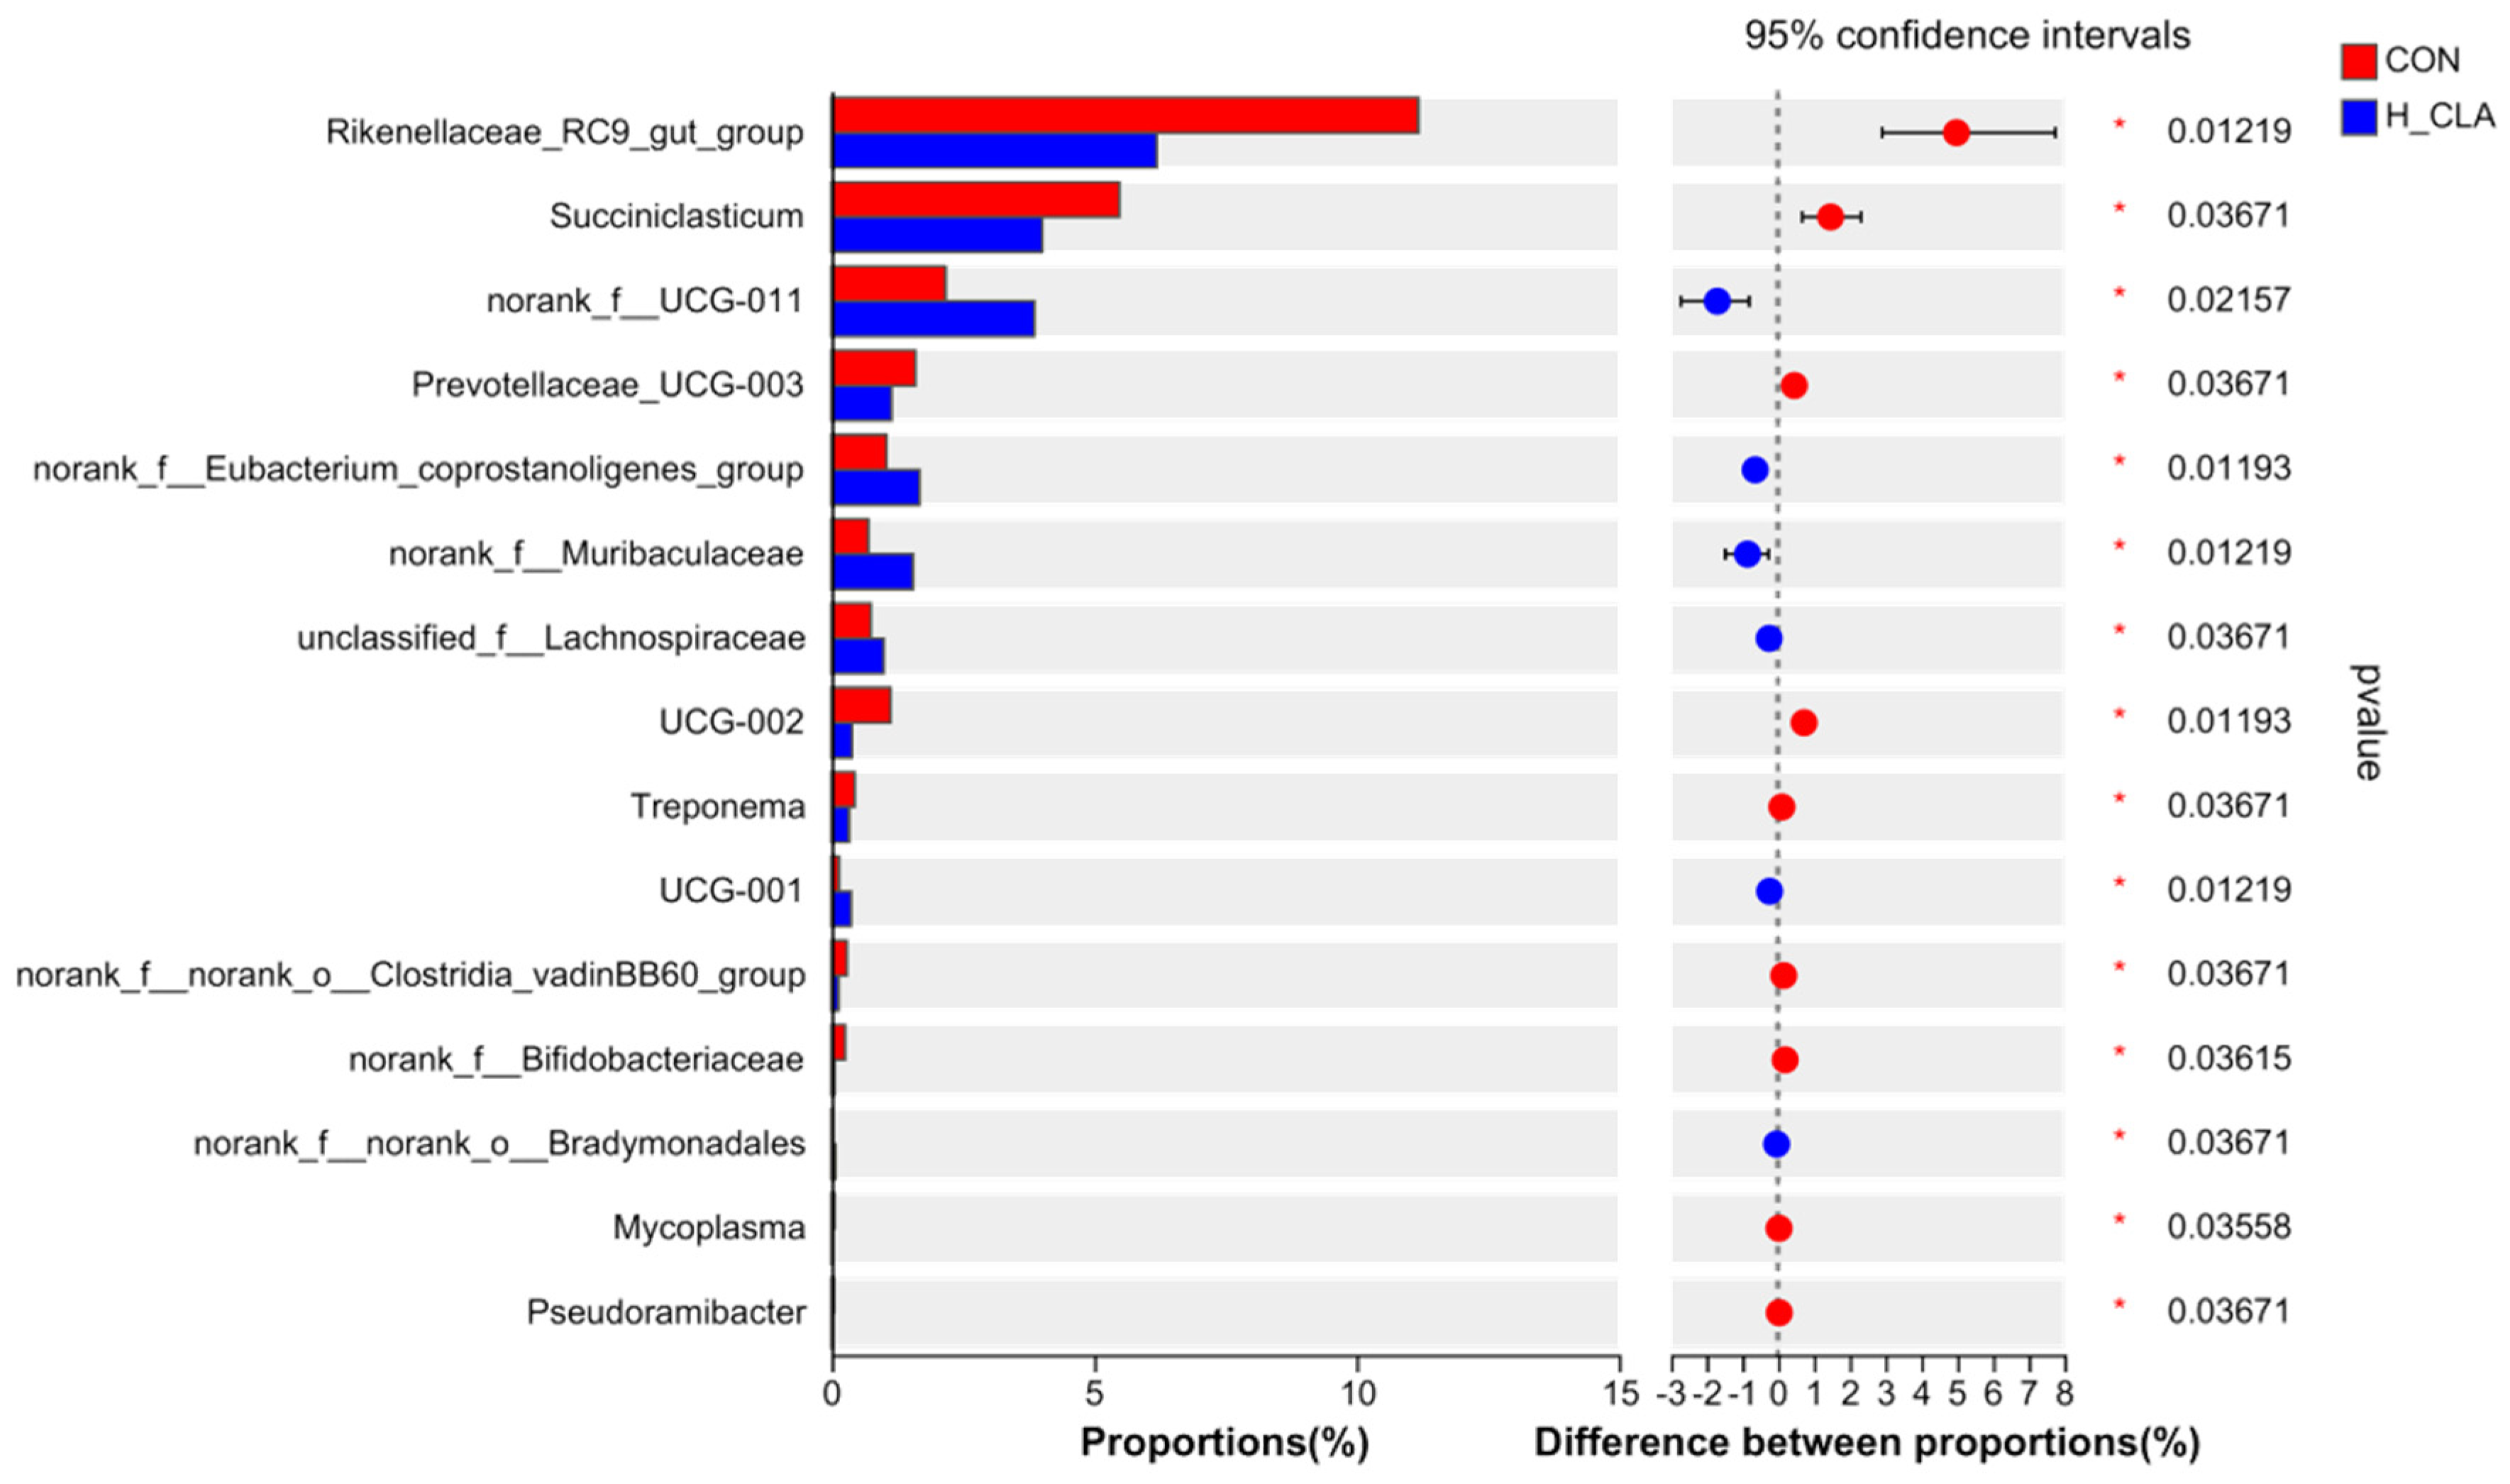
3.3. The Effect of CLA on the Composition of Ruminal Bacteria

16S rRNA gene sequencing analysis showed that a total of 3136 OTUs were shared by the CON and H-CLA groups of dairy goats (Figure 3). Rarefaction curve analysis demonstrated that the samples covered the majority of the ruminal bacteria (Supplementary Figure S1). As can be seen from Figure 4, the bacterial richness index values (Sobs, ACE, and Chao) of the CLA supplementation group were significantly lower than those of the CON group (p < 0.05); however, no significant differences in the Shannon and Simpson indices were recorded between the two groups (Figure 4D,E; p > 0.1). The PCA plot showed a clear differentiation between the bacterial communities of the CON group and the H-CLA group, with PC1 explaining 25.59% and PC2 17.26% of the variation (Supplementary Figure S2).
Taxonomic analysis identified a total of 20 phyla in the ruminal fluid of both groups, with 0.40% and 0.35% of the bacterial phyla remaining unclassified in the CON and H-CLA groups, respectively. At the genus level, meanwhile, a total of 364 genera were identified in the two groups (Figure 5). Bacteroidetes and Firmicutes were the dominant phyla in both groups of dairy goats, accounting for 94.0% and 94.6% of the relative abundance of the CON (Bacteroidetes 41.0%, Firmicutes 53.0%) and H-CLA (Bacteroidetes 48.9%, Firmicutes 45.7%) groups, respectively (Figure 5A). As shown in Figure 5B, Prevotella and Rikenellaceae_RC9_gut_group were the dominant genera in both groups. The relative abundance of Prevotella (Bacteroidetes) in the CON and H-CLA groups was 23.0% and 24.3%, respectively, and that of Rikenellaceae_RC9_gut_group (Bacteroidetes) was 11.25% and 6.2%, respectively. The average relative abundance of norank_f__F082, Lachnospiraceae_NK3A20_group, Ruminococcus, and Suociniclasticum was approximately 5% (5.85%, 5.2%, 4.85%, and 4.75%, respectively).
At the genus level, there were significant differences in the abundance of 21 bacterial genera between the H-CLA group and the CON group (Figure 6 shows the relative abundance of the top 15 genera), most of which belonged to the phyla Bacteroidetes and Firmicutes. As shown in Figure 6, the relative abundance of Rikenellaceae_RC9_gut_group (Bacteroidetes) and UCG-002 (Firmicutes) in the CON group was almost twofold and threefold higher, respectively, than that in the H-CLA group. Meanwhile, the relative abundance of Succiniclasticum and norank_f__norank_o__Clostridia_vadinBB60_group in Firmicutes, Prevolellaceae_UCG-003 in Bacteroidetes, and Treponema in Spirochaetota was significantly higher in the CON group than in the H-CLA group. Moreover, the relative abundance of norank_f__UCG-011, norank_f_Eubacterium_coprostanoligenes_group, unclassified_f__Lachnospiraceae, and UCG-001 in Firmicutes and norank_f__Muribaculaceae in Bacteroidetes in the H-CLA group was significantly higher than that in the CON group.

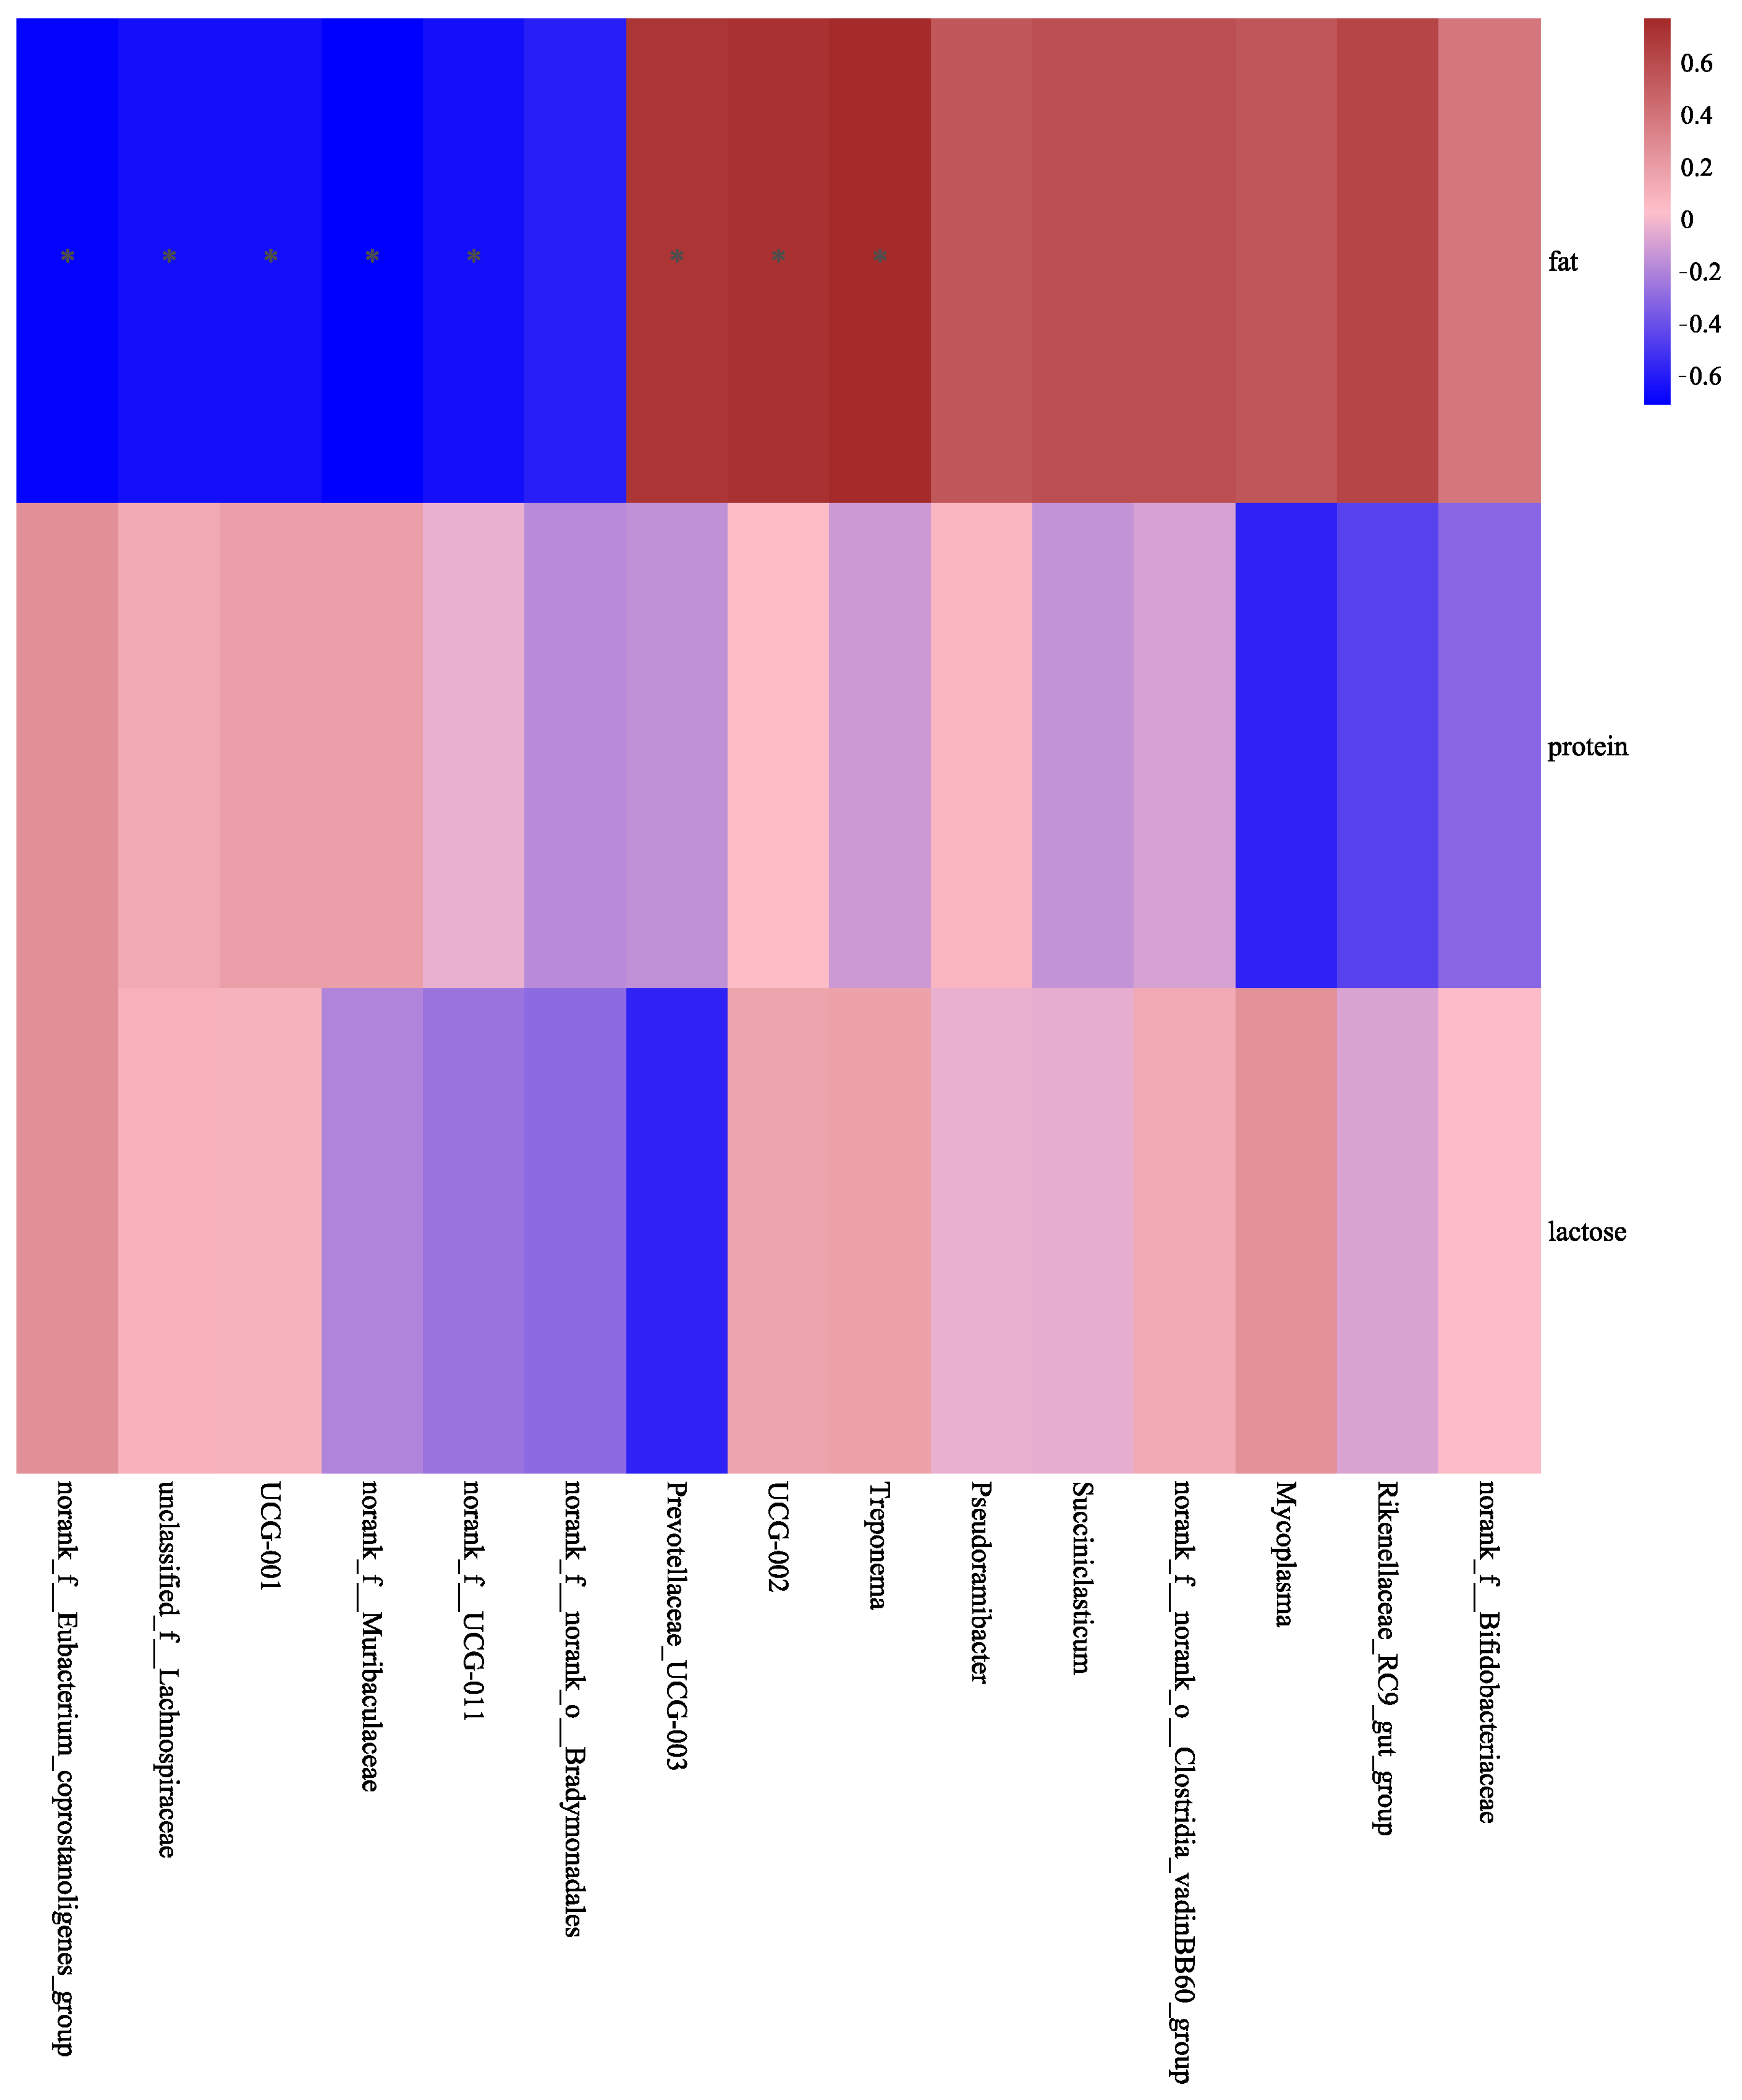
3.4. Correlation of Differential Ruminal Bacteria with Goat Milk Composition and MFG Size

Spearman correlation analysis was used to explore the correlations of the goat milk composition and MFG size parameters with bacterial genera showing differential relative abundance between the CON and H-CLA groups of goats. As shown in Figure 7, milk fat content was negatively correlated with the relative abundance of unclassified_f__Lachnospiraceae, norank_f__UCG-011, and norank_f__Eubacterium_coprostanoligenes_group in Firmicutes; norank_f__Muribaculaceae in Bacteroidetes; and norank_f__norank_o__Bradymonadales in Desulfobacterota and positively correlated with the relative abundance of Prevotellaceae_UCG-003 in Bacteroidetes, UCG-002 in Firmicutes, and Treponema in Spirochaetota.
As depicted in Figure 8, MFG size (D[3,2], D[4,3],) was negatively correlated with the relative abundance of unclassified_f__Lachnospiraceae, norank_f__UCG-011, UCG-001, and norank_f__Eubacterium_coprostanoligenes_group in Firmicutes and norank_f__Muribaculaceae in Bacteroidetes and positively correlated with the relative abundance of Mycoplasma, Succiniclasticum, norank_f__norank_o__Clostridia_vadinBB60_group, and UCG-002 in Firmicutes; Treponema in Spirochaetota; and Rikenellaceae_RC9_gut_group in Bacteroidetes. Meanwhile, the SSA was positively correlated with the relative abundance of norank_f__UCG-011, norank_f__Muribaculaceae, and norank_f__Eubacterium_coprostanoligenes_group, but negatively correlated with that of Succiniclasticum, norank_f__norank_o__Clostridia_vadinBB60_group, UCG-002, Treponema, Rikenellaceae_RC9_gut_group, Pseudoramibacter, and norank_f__Bifidobacteriaceae.

4. Discussion

Numerous studies have reported on the role of CLA in the occurrence of MFD. The CLA, an intermediate product of ruminal feed hydrogenation, engenders a decrease in milk fat content, a key factor leading to MFD in ruminants [20,21,22]. Baumgard et al. conducted a 5-day experiment involving the abomasal infusion of different doses of CLA in cows [23], Viswanadha et al. injected different doses of CLA directly into cows through the jugular vein for 5 days [24], and Zhang et al. added CLA to the feed of dairy cows and goats [25]; all found that CLA reduced the fat content in milk, but did not affect the milk protein, lactose content, or milk yield. Moreover, Zhang’s study has found that the milk fat content of both dairy cows and goats has decreased by about 50%. Our findings are in line with the results of these studies, that is, dietary CLA supplementation led to a dose-dependent reduction in the fat content of goat milk but did not affect milk yield, milk protein levels, or lactose content.
The size of MFG is closely related to lipids and proteins, which will affect its nutritional characteristics [26]. Smaller MFGs have higher milk fat globule membrane (MFGM) content [27]. MFGM indirectly affects the health of infants and adults. Compared to larger MFGs, smaller MFGs have higher concentrations of polar lipids. Sphingomyelin has been proven to have important biological functions in the development of the central nervous system in newborns [28]. Also, MFGM supplementation can improve the intestinal development of newborns [29]. It has been reported that MFG size can be affected by the nutritional composition of diets. Argov-Argaman et al. fed dairy cows a high-concentrate diet and found that the average size of MFG decreased from 3.51 to 3.3 μm [30]. Mesilati-Stahy et al. showed that the provision of a high-concentrate low-forage diet resulted in a smaller mean MFG diameter in cows with MFD [31]. We have previously found that dairy cows with CLA-induced MFD exhibit a significant change in milk fat content characterized by a decrease in the size of MFGs [12,13,32]. In the present study, we also found that dietary CLA inclusion led to a significant and CLA dose-dependent reduction in the size of MFGs in dairy goats, accompanied by an increase in the proportion of small-sized fat globules and a decrease in that of large-sized ones. Combined, the results of studies on cows and goats suggest that changes in fat globule size are the main characteristic of milk fat in ruminants with MFD.
Diet is known to affect the structure of ruminal microbial populations [33,34,35]. For instance, in the process of diet-induced MFD, alterations in ruminal fermentation led to changes in the biohydrogenation pathway, resulting in the inhibition of milk fat synthesis in the gland [36,37]. Diet-induced MFD is caused by highly fermentable diets rich in unsaturated fatty acids [38]. Elevated concentrations of polyunsaturated fatty acids, especially linoleic acid, can exert negative effects on the growth of ruminal bacteria [39,40], the main group of organisms known to carry out the biohydrogenation of unsaturated fatty acids in the rumen [40]. Although MFD is the result of microbial action, not all ruminal microbes involved in the biohydrogenation pathway are known. Pitta et al. detected a significant change in the ruminal bacterial spectrum in cows with diet-induced MFD and the bacterial population abundance and diversity were significantly reduced after 10 days of MFD induction [18]. In the present study, no significant differences in the Shannon and Simpson indices were found between the CON and CLA groups; however, the Sobs, ACE, and Chao index values were significantly lower in the H-CLA group than in the CON group. The higher the Shannon index or the smaller the Simpson index, the higher the diversity of the bacterial community; the higher the ACE and Chao indices, the richer the microbial community. Accordingly, our results indicated that CLA supplementation in the diet did not affect the diversity of ruminal bacteria in the goats but decreased the bacterial richness.
In the present study, Bacteroidetes and Firmicutes were the dominant phyla, which is consistent with the results reported for dairy cows [18,41]. Bacteroidetes, Firmicutes, and Fibrinobacteria decompose dietary carbohydrates, thereby indirectly providing energy for the body. Bacteroidetes are Gram-negative bacteria that mainly degrade non-fibrous substances such as starch, proteins, and polysaccharides [42]. In contrast, Firmicutes are Gram-positive bacteria and are the primary cellulose-degrading bacteria in the gastrointestinal tract [43]. Prevotella is the dominant genus among ruminal bacteria [44] and members of this group can decompose hemicellulose, proteins, and non-fibrous polysaccharides [45,46]. Rikenellaceae_RC9_gut_group is closely related to members of the Alipites family [47], and its function is to decompose plant-derived polysaccharides [48]. In the current study, we found that Prevotella and Rikenellaceae_RC9_gut_group (both belonging to Bacteroidetes) were the dominant genera. Liu et al. reported that Prevotella 1 (Bacteroidetes) and Succiniclasticum (Firmicutes) were the dominant genera in two groups of cows with different total milk solid contents [41]. Huws et al. observed that the inclusion of flaxseed oil in the diet of steers increased the abundance of Butyrivibrio, Howardella, Oribacterium, Pseudobutyrivibrio, and Roseburia, whereas Succinivibrio and Roseburia were the only genera whose abundance was increased with echium oil supplementation [39]. This study explored the relative abundance of rumen bacterial populations with or without CLA supplements, which may enable us to link dietary nutrients, microbiota, and production parameters, thus understanding the role of ruminal bacteria in the MFD phenomenon.
The physiological status and milk composition of ruminants affect the composition of ruminal microorganisms. It was reported that bacterial abundance is lower in cows with high milk protein contents than in those with low milk protein yield [49,50]. Additionally, the abundance of Bacteroides in the rumen was reported to increase when cows entered the lactation stage and began to produce milk [51]. Zou et al. found a significant positive correlation between Acinetobacter and the average milk protein content [17], while Jami et al. showed that the relative abundance of Prevotella in the rumen of dairy cows was correlated with the fat content in milk [52]. Here, we found that the milk fat content was positively correlated with Prevotellaceae_UCG-003, UCG-002, and Treponema, indicating that the increase in CLA concentration in the diet may have a promoting effect on these bacteria. Whereas, it is negatively correlated with unclassified_f__Lachnospiraceae, norank_f__UCG-011, norank_f__Eubacterium_coprostanoligenes_group, norank_f__Muribaculaceae, and norank_f__norank_o__Bradymonadales in dairy goats.
Notably, our study was the first to analyze the correlation between the ruminal microbiota and MFG size. We observed that the D[3,2] and D[4,3] were negatively correlated with the relative abundance of norank_f__UCG-011, UCG-001, norank_f__Eubacterium_coprostanoligenes_group, and norank_f__Muribaculaceae and positively correlated with that of Mycoplasma, Succiniclasticum, norank_f__norank_o__Clostridia_vadinBB60_group, UCG-002, Treponema, Rikenellaceae_RC9_gut_group, and norank_f__Bifidobacteriaceae. This suggested that they play a role in altering the biohydrogenation pathway. The milk fat content and the size of the MFGs were positively correlated with the relative abundance of Treponema, UCG-002, and Prevotellaceae_UCG-003 (Figure 7 and Figure 8) but exhibited a negative correlation with the relative abundance of norank_f__Muribaculaceae, norank_f__UCG-011, norank_f__Eubacterium_coprostanoligenes_group, and UCG-001. The CLA supplementation resulted in a correlation between milk fat content and MFG size [25], so there are bacteria that are consistent with the correlation between milk fat content and MFG size. In the current study, correlation analysis revealed the association between milk composition and MFG size with ruminal bacteria. However, it is unclear what the interactions among CLA, bacterial communities, and other dietary nutrients are. Future studies should investigate the effects of dietary CLA on specific bacterial populations in Bacteroidetes and Firmicutes for dietary recommendations.

5. Conclusions

In summary, in this work, we found that dietary CLA supplementation significantly and dose-dependently decreased the milk fat content and MFG size in Saanen dairy goats, accompanied by an increase in the proportion of small-sized MFGs and a decrease in that of large-sized MFGs. Moreover, dietary-induced MFD in dairy goats occurred in parallel with significant changes in the relative abundance of some ruminal bacterial populations. The milk fat content was negatively correlated with the relative abundance of some bacteria, including members of Firmicutes and Bacteroidetes. Meanwhile, MFG size was found to be positively correlated with more genera in the Bacteroidetes phylum and negatively correlated with more genera in the Firmicutes phylum. These results constitute the first evidence for explaining the mechanism underlying diet-induced MFD from the perspective of the ruminal microbiome in dairy goats.

Supplementary Materials

The following supporting information can be downloaded at: https://www.mdpi.com/article/10.3390/ani14172614/s1, Table S1: Ingredients and chemical composition of the basal diets of dairy goats; Figure S1: Number of tags sampled; Figure S2: Principal coordinate analysis (PCoA). The unweighted UniFrac distance metrics analysis between the rumen bacteria in CON and H-CLA group.

Author Contributions

M.Z. and L.H. conceived and designed the study and wrote the manuscript. M.Z. and C.Z. participated in RNA and DNA extraction. M.Z., Z.L. and K.W. contributed to the feeding experiment and sample collection. T.F. and Y.S. participated in the measurement of milk composition and MFG size. T.G. revised the manuscript. All authors have read and agreed to the published version of the manuscript.

Funding

This work was supported by the Earmarked Fund for Modern Agro-industry Technology Research System (CARS36), the Henan Province Science Fund for Distinguished Young Scholars (No. 242300421029), the Key Research and Development Project of Henan Province, China (No. 231111111400), and projects funded by the central government to guide local scientific and Technological Development (Grant No. XZ202201YD0007C).

Institutional Review Board Statement

All animal experiments were approved by the Animal Welfare and Research Ethics Committee of Henan Agricultural University (Approval Code: HNND2024031807, Approval Date: 18 March 2024).

Informed Consent Statement

Not applicable.

Data Availability Statement

The original contributions presented in the study are included in the article and Supplementary Material, further inquiries can be directed to the corresponding authors.

Conflicts of Interest

The authors declare that the research was conducted in the absence of any commercial or financial relationships that could be construed as potential conflicts of interest.

References

  1. Ashes, J.R.; Gulati, S.K.; Scott, T.W. Potential to alter the content and composition of milk fat through nutrition. J. Dairy Sci. 1997, 80, 2204–2212. [Google Scholar] [CrossRef]
  2. Bauman, D.E.; Harvatine, K.J.; Lock, A.L. Nutrigenomics, Rumen-Derived Bioactive Fatty Acids, and the Regulation of Milk Fat Synthesis. Annu. Rev. Nutr. 2011, 31, 299–319. [Google Scholar] [CrossRef] [PubMed]
  3. Wei, W.; Yang, J.; Yang, D.; Wang, X.Y.; Yang, Z.Y.; Jin, Q.Z.; Wang, M.Y.; Lai, J.Q.; Wang, X.G. Phospholipid Composition and Fat Globule Structure I: Comparison of Human Milk Fat from Different Gestational Ages, Lactation Stages, and Infant Formulas. J. Agric. Food Chem. 2019, 67, 13922–13928. [Google Scholar] [CrossRef]
  4. Michalski, M.C.; Gassi, J.Y.; Famelart, M.H.; Leconte, N.; Camier, B.; Michel, F.; Briard, V. The size of native milk fat globules affects physico-chemical and sensory properties of Camembert cheese. Lait 2003, 83, 131–143. [Google Scholar] [CrossRef]
  5. Michalski, M.C.; Ollivon, M.; Briard, V.; Leconte, N.; Lopez, C. Native fat globules of different sizes selected from raw milk: Thermal and structural behavior. Chem. Phys. Lipids 2004, 132, 247–261. [Google Scholar] [CrossRef]
  6. Bitman, J.; Wood, D.L. Changes in milk fat phospholipids during lactation. J. Dairy Sci. 1990, 73, 1208–1216. [Google Scholar] [CrossRef] [PubMed]
  7. Couvreur, S.; Hurtaud, C.; Marnet, P.G.; Faverdin, P.; Peyraud, J.L. Composition of milk fat from cows selected for milk fat globule size and offered either fresh pasture or a corn silage-based diet. J. Dairy Sci. 2007, 90, 392–403. [Google Scholar] [CrossRef] [PubMed]
  8. Logan, A.; Auldist, M.; Greenwood, J.; Day, L. Natural variation of bovine milk fat globule size within a herd. J. Dairy Sci. 2014, 97, 4072–4082. [Google Scholar] [CrossRef] [PubMed]
  9. Baumgard, L.H.; Corl, B.A.; Dwyer, D.A.; Saebo, A.; Bauman, D.E. Identification of the conjugated linoleic acid isomer that inhibits milk fat synthesis. Am. J. Physiol. Regul. Integr. Comp. Physiol. 2000, 278, R179–R184. [Google Scholar] [CrossRef]
  10. Lock, A.L.; Rovai, M.; Gipson, T.A.; de Veth, M.J.; Bauman, D.E. A conjugated linoleic acid supplement containing trans-10, cis-12 conjugated linoleic acid reduces milk fat synthesis in lactating goats. J. Dairy Sci. 2008, 91, 3291–3299. [Google Scholar] [CrossRef]
  11. Shi, H.P.; Zhang, T.Y.; Li, C.; Wang, J.J.; Huang, J.T.; Li, Z.Y. trans-10,cis-12-Conjugated Linoleic Acid Affects Expression of Lipogenic Genes in Mammary Glands of Lactating Dairy Goats. J. Agric. Food Chem. 2017, 65, 9460–9467. [Google Scholar] [CrossRef]
  12. Xing, Z.Y.; Zhang, M.L.; Wang, Y.Y.; Yang, G.Y.; Han, L.Q.; Loor, J.J. Short communication: A decrease in diameter of milk fat globules accompanies milk fat depression induced by conjugated linoleic acid supplementation in lactating dairy cows. J. Dairy Sci. 2020, 103, 5143–5147. [Google Scholar] [CrossRef] [PubMed]
  13. Zhang, M.L.; Xing, Z.Y.; Huang, Q.X.; Han, L.Q. Effect of conjugated linoleic acid supplementation on fat globule size in raw milk. Int. Dairy J. 2021, 115, 104919. [Google Scholar] [CrossRef]
  14. Rico, D.E.; Preston, S.H.; Risser, J.M.; Harvatine, K.J. Rapid changes in key ruminal microbial populations during the induction of and recovery from diet-induced milk fat depression in dairy cows. Br. J. Nutr. 2015, 114, 358–367. [Google Scholar] [CrossRef] [PubMed]
  15. Ren, H.; Su, X.D.; Bai, H.X.; Yang, Y.T.; Wang, H.R.; Dan, Z.; Lu, J.B.; Wu, S.R.; Cai, C.J.; Cao, Y.C.; et al. Specific enrichment of microbes and increased ruminal propionate production: The potential mechanism underlying the high energy efficiency of Holstein heifers fed steam-flaked corn. Amb Express 2019, 9, 209. [Google Scholar] [CrossRef] [PubMed]
  16. Zeng, H.B.; Guo, C.Z.; Sun, D.M.; Seddik, H.E.; Mao, S.Y. The Ruminal Microbiome and Metabolome Alterations Associated with Diet-Induced Milk Fat Depression in Dairy Cows. Metabolites 2019, 9, 154. [Google Scholar] [CrossRef]
  17. Zou, C.X.; Gu, Q.C.; Zhou, X.K.; Xia, Z.S.; Muhammad, W.I.; Tang, Q.F.; Liang, M.Z.; Lin, B.; Qin, G.S. Ruminal microbiota composition associated with ruminal fermentation parameters and milk yield in lactating buffalo in Guangxi, China-A preliminary study. J. Anim. Physiol. Anim. Nutr. 2019, 103, 1374–1379. [Google Scholar] [CrossRef]
  18. Pitta, D.W.; Indugu, N.; Vecchiarelli, B.; Rico, D.E.; Harvatine, K.J. Alterations in ruminal bacterial populations at induction and recovery from diet-induced milk fat depression in dairy cow. J. Dairy Sci. 2018, 101, 295–309. [Google Scholar] [CrossRef]
  19. Lu, J.; Argov-Argaman, N.; Anggrek, J.; Boeren, S.; van Hooijdonk, T.; Vervoort, J.; Hettinga, K.A. The protein and lipid composition of the membrane of milk fat globules depends on their size. J Dairy Sci 2016, 99, 4726–4738. [Google Scholar] [CrossRef]
  20. Harvatine, K.J.; Boisclair, Y.R.; Bauman, D.E. Time-dependent effect of trans-10, cis-12 conjugated linoleic acid on gene expression of lipogenic enzymes and regulators in mammary tissue of dairy cows. J. Dairy Sci. 2018, 101, 7585–7592. [Google Scholar] [CrossRef]
  21. Perfield, J.W.; Lock, A.L.; Griinari, J.M.; Sæbo, A.; Delmonte, P.; Dwyer, D.A.; Bauman, D.E. trans-9, cis-11 conjugated linoleic acid reduces milk fat synthesis in lactating dairy cows. J. Dairy Sci. 2007, 90, 2211–2218. [Google Scholar] [CrossRef]
  22. Peterson, D.G.; Matitashvili, E.A.; Bauman, D.E. Diet-induced milk fat depression is characterized by increased milk fat content of t10, c12 CLA and corresponding reductions in mammary tissue expression of lipogenic genes. Faseb J. 2002, 16, A232. [Google Scholar]
  23. Baumgard, L.H.; Sangster, J.K.; Bauman, D.E. Milk fat synthesis in dairy cows is progressively reduced by increasing supplemental amounts of trans-10, cis-12 conjugated linoleic acid (CLA). J. Nutr. 2001, 131, 1764–1769. [Google Scholar] [CrossRef]
  24. Viswanadha, S.; Giesy, J.G.; Hanson, T.W.; McGuire, M.A. Dose response of milk fat to intravenous administration of the trans-10, cis-12 isomer of conjugated linoleic acid. J. Dairy Sci. 2003, 86, 3229–3236. [Google Scholar] [CrossRef] [PubMed]
  25. Zhang, M.L.; Liu, Z.T.; Kang, F.Y.; Wu, K.X.; Ni, H.; Han, Y.Q.; Yang, Y.B.; Fu, T.; Yang, G.Y.; Gao, T.Y.; et al. Is milk fat globule size correlated with milk fat content in Ruminants? Food Chem. 2024, 439, 138101. [Google Scholar] [CrossRef] [PubMed]
  26. Tzirkel-Hancock, N.; Sharabi, L.; Argov-Argaman, N. Milk fat globule size: Unraveling the intricate relationship between metabolism, homeostasis, and stress signaling. Biochimie 2023, 215, 4–11. [Google Scholar] [CrossRef] [PubMed]
  27. Yang, S.L.; Suwal, S.; Andersen, U.; Otte, J.; Ahrn, L. Effects of pulsed electric field on fat globule structure, lipase activity, and fatty acid composition in raw milk and milk with different fat globule sizes. Innov. Food Sci. Emerg. Technol. 2021, 67, 102548. [Google Scholar] [CrossRef]
  28. Chitchumroonchokchai, C.; Riedl, K.; García-Cano, I.; Chaves, F.; Walsh, K.R.; Jimenez-Flores, R.; Failla, M.L. Efficient in vitro digestion of lipids and proteins in bovine milk fat globule membrane ingredient (MFGMi) and whey-casein infant formula with added MFGMi. J. Dairy Sci. 2023, 106, 3086–3097. [Google Scholar] [CrossRef]
  29. Bhinder, G.; Allaire, J.M.; Garcia, C.; Lau, J.T.; Chan, J.M.; Ryz, N.R.; Bosman, E.S.; Graef, F.A.; Crowley, S.M.; Celiberto, L.S.; et al. Milk Fat Globule Membrane Supplementation in Formula Modulates the Neonatal Gut Microbiome and Normalizes Intestinal Development. Sci. Rep. 2017, 7, 45274. [Google Scholar] [CrossRef]
  30. Argov-Argaman, N.; Mida, K.; Cohen, B.C.; Visker, M.; Hettinga, K. Milk fat content and DGAT1 genotype determine lipid composition of the milk fat globule membrane. PLoS ONE 2013, 8, e68707. [Google Scholar] [CrossRef]
  31. Mesilati-Stahy, R.; Moallem, U.; Magen, Y.; Argov-Argaman, N. Altered concentrate to forage ratio in cows ration enhanced bioproduction of specific size subpopulation of milk fat globules. Food Chem. 2015, 179, 199–205. [Google Scholar] [CrossRef] [PubMed]
  32. Zhang, M.; Fu, T.; Huang, Q.; Xing, Z.; Yang, J.; Lu, W.; Hu, M.; Han, L.Q.; Loor, J.J.; Gao, T.Y. Size, number and phospholipid composition of milk fat globules are affected by dietary conjugated linoleic acid. J. Anim. Physiol. Anim. Nutr. 2022, 107, 995–1005. [Google Scholar] [CrossRef] [PubMed]
  33. Hook, S.E.; Steele, M.A.; Northwood, K.S.; Dijkstra, J.; France, J.; Wright, A.D.G.; McBride, B.W. Impact of subacute ruminal acidosis (SARA) adaptation and recovery on the density and diversity of bacteria in the rumen of dairy cows. Fems Microbiol. Ecol. 2011, 78, 275–284. [Google Scholar] [CrossRef]
  34. Huo, W.J.; Zhu, W.Y.; Mao, S.Y. Impact of subacute ruminal acidosis on the diversity of liquid and solid-associated bacteria in the rumen of goats. World J. Microbiol. Biotechnol. 2014, 30, 669–680. [Google Scholar] [CrossRef]
  35. Sadet, S.; Martin, C.; Meunier, B.; Morgavi, D.P. PCR-DGGE analysis reveals a distinct diversity in the bacterial population attached to the rumen epithelium. Animal 2007, 1, 939–944. [Google Scholar] [CrossRef] [PubMed]
  36. Griinari, J.M.; Dwyer, D.A.; McGuire, M.A.; Bauman, D.E.; Palmquist, D.L.; Nurmela, K.V. Trans-octadecenoic acids and milk fat depression in lactating dairy cows. J. Dairy Sci. 1998, 81, 1251–1261. [Google Scholar] [CrossRef]
  37. Piperova, L.S.; Teter, B.B.; Bruckental, I.; Sampugna, J.; Mills, S.E.; Yurawecz, M.P.; Fritsche, J.; Ku, K.; Erdman, R.A. Mammary lipogenic enzyme activity, trans fatty acids and conjugated linoleic acids are altered in lactating dairy cows fed a milk fat-depressing diet. J. Nutr. 2000, 130, 2568–2574. [Google Scholar] [CrossRef]
  38. Rico, D.E.; Holloway, A.W.; Harvatine, K.J. Effect of diet fermentability and unsaturated fatty acid concentration on recovery from diet-induced milk fat depression. J. Dairy Sci. 2015, 98, 7930–7943. [Google Scholar] [CrossRef]
  39. Huws, S.A.; Kim, E.J.; Cameron, S.J.S.; Girdwood, S.E.; Davies, L.; Tweed, J.; Vallin, H.; Scollan, N.D. Characterization of the rumen lipidome and microbiome of steers fed a diet supplemented with flax and echium oil. Microb. Biotechnol. 2015, 8, 331–341. [Google Scholar] [CrossRef]
  40. Lourenço, M.; Ramos-Morales, E.; Wallace, R.J. The role of microbes in rumen lipolysis and biohydrogenation and their manipulation. Animal 2010, 4, 1008–1023. [Google Scholar] [CrossRef]
  41. Liu, K.Z.; Zhang, Y.D.; Huang, G.X.; Zheng, N.; Zhao, S.G.; Wang, J.Q. Ruminal bacterial community is associated with the variations of total milk solid content in Holstein lactating cows. Anim. Nutr. 2022, 9, 175–183. [Google Scholar] [CrossRef]
  42. Naas, A.E.; Mackenzie, A.K.; Mravec, J.; Schückel, J.; Willats, W.G.T.; Eijsink, V.G.H.; Pope, P.B. Do Rumen Bacteroidetes Utilize an Alternative Mechanism for Cellulose Degradation? Mbio 2014, 5, e01401-14. [Google Scholar] [CrossRef]
  43. La Reau, A.J.; Suen, G. The Ruminococci: Key symbionts of the gut ecosystem. J. Microbiol. 2018, 56, 199–208. [Google Scholar] [CrossRef]
  44. Henderson, G.; Cox, F.; Ganesh, S.; Jonker, A.; Young, W.; Janssen, P.H.; Global Rumen Census, C. Rumen microbial community composition varies with diet and host, but a core microbiome is found across a wide geographical range. Sci. Rep. 2015, 5, 14567, Erratum in Sci. Rep. 2016, 6, 19175. [Google Scholar] [CrossRef] [PubMed]
  45. Kopecny, J.; Zorec, M.; Mrázek, J.; Kobayashi, Y.; Marinsek-Logar, R. Butyrivibrio hungatei sp nov and Pseudobutyrivibrio xylanivorans sp nov., butyrate-producing bacteria from the rumen. Int. J. Syst. Evol. Microbiol. 2003, 53, 201–209. [Google Scholar] [CrossRef]
  46. Purushe, J.; Fouts, D.E.; Morrison, M.; White, B.A.; Mackie, R.I.; Coutinho, P.M.; Henrissat, B.; Nelson, K.E.; Bacteria, N.A.C.R. Comparative Genome Analysis of Prevotella ruminicola and Prevotella bryantii: Insights into Their Environmental Niche. Microb. Ecol. 2010, 60, 721–729. [Google Scholar] [CrossRef]
  47. Seshadri, R.; Leahy, S.C.; Attwood, G.T.; Teh, K.H.; Lambie, S.C.; Cookson, A.L.; Eloe-Fadrosh, E.A.; Pavlopoulos, G.A.; Hadjithomas, M.; Varghese, N.J.; et al. Cultivation and sequencing of rumen microbiome members from the Hungate1000 Collection. Nat. Biotechnol. 2018, 36, 359–367. [Google Scholar] [CrossRef] [PubMed]
  48. Peng, B.Y.; Huang, S.C.; Liu, T.T.; Geng, A.L. Bacterial xylose isomerases from the mammal gut Bacteroidetes cluster function in Saccharomyces cerevisiae for effective xylose fermentation. Microb. Cell Factories 2015, 14, 70. [Google Scholar] [CrossRef] [PubMed]
  49. Xue, M.Y.; Sun, H.Z.; Wu, X.H.; Guan, L.L.; Liu, J.X. Assessment of Rumen Microbiota from a Large Dairy Cattle Cohort Reveals the Pan and Core Bacteriomes Contributing to Varied Phenotypes. Appl. Environ. Microbiol. 2018, 84, e00970-18. [Google Scholar] [CrossRef]
  50. Xue, M.Y.; Sun, H.Z.; Wu, X.H.; Guan, L.L.; Liu, J.X. Assessment of rumen bacteria in dairy cows with varied milk protein yield. J. Dairy Sci. 2019, 102, 5031–5041. [Google Scholar] [CrossRef]
  51. Pitta, D.W.; Kumar, S.; Vecchiarelli, B.; Shirley, D.J.; Bittinger, K.; Baker, L.D.; Ferguson, J.D.; Thomsen, N. Temporal dynamics in the ruminal microbiome of dairy cows during the transition period. J. Anim. Sci. 2014, 92, 4014–4022. [Google Scholar] [CrossRef] [PubMed]
  52. Jami, E.; White, B.A.; Mizrahi, I. Potential role of the bovine rumen microbiome in modulating milk composition and feed efficiency. PLoS ONE 2014, 9, e85423. [Google Scholar]
Figure 1. The effects of CLA on milk fat globule size. (A) D[3,2]: surface area-related equivalent diameter; (B) D[4,3]: volume-related equivalent diameter; (C) SSA: specific surface area. CON: control group; L-CLA: low-dose CLA group; M-CLA: medium-dose CLA group; H-CLA: high-dose CLA group.
Animals 14 02614 g001
Figure 2. The effects of conjugated linoleic acid (CLA) on milk fat globule (MFG) size proportions. H-CLA: high-dose CLA group; M-CLA: medium-dose CLA group; L-CLA: low-dose CLA group; CON: control group.
Animals 14 02614 g002
Figure 3. Shared and unique operational taxonomic units (OTUs) between the control (CON) and the high-dose conjugated linoleic acid (H-CLA) group.
Animals 14 02614 g003
Figure 4. Comparative analysis of ruminal bacteria alpha-diversity between the control (CON) and high-dose conjugated linoleic acid (H-CLA) groups. (A) Sob index, (B) ACE index, (C) Chao index, (D) Shannon index, (E) Simpson index.
Animals 14 02614 g004
Figure 5. The relative abundance of ruminal bacteria at the phylum (A) and genus (B) levels in the control (CON) and high-dose conjugated linoleic acid group (H-CLA) groups.
Animals 14 02614 g005
Figure 6. Comparison of the abundance of ruminal bacteria at the genus level between the control (CON) and high-dose conjugated linoleic acid (H-CLA) groups.
Animals 14 02614 g006
Figure 7. Correlations between differential bacteria and milk composition in the control (CON) and high-dose conjugated linoleic acid (H-CLA) groups. The color code indicates the direction of the correlations (red indicates a positive correlation and blue indicates a negative correlation); * p < 0.05.
Animals 14 02614 g007
Figure 8. Correlations between differential bacteria and milk fat granule (MFG) size parameters in the control (CON) and high-dose conjugated linoleic acid (H-CLA) groups. The color code indicates the direction of the correlations (red indicates a positive and blue indicates a negative correlation); * p < 0.05 and ** p < 0.01.
Animals 14 02614 g008
Table 1. Fatty acid composition of the conjugated linoleic acid.
Fatty AcidTotal Fatty Acids (%)
Palmitic acid3.0
Stearic acid2.7
Oleic acid11.3
Linoleic acid1.3
Conjugated linoleic acid80.5
C18:2 cis-9, trans-1138.5
C18:2 trans-10, cis-1238.1
Other CLA isomers3.8
Others<0.1
CLA: conjugated linoleic acid.
Table 2. The effects of CLA on milk production, milk composition, and MFG size.
ItemCONL-CLAM-CLAH-CLASEMp-Value
Milk yield (kg/day)1.211.131.231.220.0970.501
Milk fat (g/100 mL)3.63 a2.69 b1.85 c1.74 c0.252<0.01
Milk protein (g/100 mL)3.523.543.483.790.1930.676
Milk lactose (g/100 mL) 4.214.234.294.250.0900.920
Note: In the same row, values with different small letter superscripts differ significantly (p < 0.05). CON: control group; L-CLA: low-dose conjugated linoleic acid group; M-CLA: medium-dose conjugated linoleic acid group; H-CLA: high-dose conjugated linoleic acid group; SEM: standard error of mean.
Disclaimer/Publisher’s Note: The statements, opinions and data contained in all publications are solely those of the individual author(s) and contributor(s) and not of MDPI and/or the editor(s). MDPI and/or the editor(s) disclaim responsibility for any injury to people or property resulting from any ideas, methods, instructions or products referred to in the content.

