Article

Sturnidae sensu lato Mitogenomics: Novel Insights into Codon Aversion, Selection, and Phylogeny

1
Anhui Provincial Key Laboratory of the Conservation and Exploitation of Biological Resources, College of Life Sciences, Anhui Normal University, Wuhu 241000, China
2
Teaching and Research Office of Evidence-Based Medicine, Wannan Medical College, Wuhu 241002, China
3
Anhui Academy of Medical Sciences, Anhui Medical College, Hefei 230061, China
4
School of Basic Medical Sciences, Wannan Medical College, Wuhu 241002, China
5
The Institute of Bioinformatics, College of Life Sciences, Anhui Normal University, Wuhu 241000, China
*
Authors to whom correspondence should be addressed.
These authors equally contributed to this work.
Animals 2024, 14(19), 2777; https://doi.org/10.3390/ani14192777
Submission received: 4 August 2024 / Revised: 12 September 2024 / Accepted: 24 September 2024 / Published: 26 September 2024
(This article belongs to the Section Animal Genetics and Genomics)

Abstract

:

Simple Summary

Sturnidae sensu lato (Muscicapoidea) consists of Sturnidae, Mimidae, and Buphagidae. However, the deep-node evolutionary relationships within this group remain undetermined, and few efforts have been made to elucidate their mitogenomic evolution. Here, we focus on Sturnidae sensu lato and present five newly sequenced mitogenomes. Together with analysis of publicly available data, comprehensive analyses of mitogenome features, codon usage and aversion, RNA and CR structures, and phylogeny are performed. In conclusion, we determine the basic organizations of Sturnidae sensu lato mitogenomes, demonstrate the pervasiveness of natural selection in forming the CUB patterns, depict the RNA secondary structures, and construct both the backbone and deep-node relationships within Sturnidae sensu lato. The main finding of our research is obtained through codon aversion motifs (CAM) analyses. The surprisingly unique CAMs from 11 mt PCGs for each species offer new opportunities for the identification of the molecular species identification of these taxa. This work can shed new light on the mitogenomic evolution of Sturnidae sensu lato.

Abstract

The Sturnidae family comprises 123 recognized species in 35 genera. The taxa Mimidae and Buphagidae were formerly treated as subfamilies within Sturnidae. The phylogenetic relationships among the Sturnidae and related taxa (Sturnidae sensu lato) remain unresolved due to high rates of morphological change and concomitant morphological homoplasy. This study presents five new mitogenomes of Sturnidae sensu lato and comprehensive mitogenomic analyses. The investigated mitogenomes exhibit an identical gene composition of 37 genes—including 13 protein-coding genes (PCGs), 2 rRNA genes, and 22 tRNA genes—and one control region (CR). The most important finding of this study is drawn from CAM analyses. The surprisingly unique motifs for each species provide a new direction for the molecular species identification of avian. Furthermore, the pervasiveness of the natural selection of PCGs is found in all examined species when analyzing their nucleotide composition and codon usage. We also determine the structures of mt-tRNA, mt-rRNA, and CR structures of Sturnidae sensu lato. Lastly, our phylogenetic analyses not only well support the monophyly of Sturnidae, Mimidae, and Buphagidae, but also define nine stable subclades. Taken together, our findings will enable the further elucidation of the evolutionary relationships within Sturnidae sensu lato.

1. Introduction

As part of the Muscicapoidea superfamily of passerine birds, the Sturnidae sensu lato consists of starlings (Sturnidae), mimids (Mimidae), and oxpeckers (Buphagidae) [1]. Within this group, starlings are most closely related to mimids, and these two lineages form a sister relationship with oxpeckers. The Old World family Sturnidae contains approximately 123 species in 35 genera, with centers of diversity in Africa and Southeast Asia [2,3,4]. In contrast, Mimidae consists of New World species (34 species in 10 genera) that cover large parts of the West Indies and North, Central, and South America [2,4]. Furthermore, Buphagidae, comprising only two Buphagus species, is endemic to the savannah of Sub-Saharan Africa [5]. Mimidae and Buphagidae, formerly treated as subfamilies within Sturnidae, are now usually considered to be two distinct families [3,4,6]. Over the years, considerable research has been undertaken to address the evolutionary history of Sturnidae sensu lato [1,2,7,8,9,10]. Unfortunately, owing to extreme morphological variations and a high level of morphological homoplasy, the deep-node phylogenetic relationships within this group remain poorly understood [2].
Mitochondria play a vital role in various biological processes, such as energy production, calcium homeostasis, signaling, apoptosis, and cellular proliferation [11,12,13,14]. In all animal lineages (expect only for the recently discovered Henneguya salminicola [15]), mitochondria possess their own genomes and independent transcriptional and translational machineries. In vertebrates, the mitogenome is a circular double-stranded molecule with a relatively stable gene organization, containing 37 coding genes (two for rRNA, 22 for tRNA, and 13 for PCGs) and one noncoding region (CR) [16,17]. Significantly, due to their low recombination and rapid evolution rates, mitogenomes have been extensively utilized as molecular markers for evolutionary research [18,19,20,21,22,23]. In recent years, the significant development of next-generation sequencing technologies has led to the attainment of an increasing amount of sequencing data for avian mitogenomes. So far, a total of 1608 mitogenome sequences from birds have been published in the National Center for Biotechnology Information (NCBI) database, with sizes ranging from 15,523 bp (Coturnicops noveboracensis, Gruiformes) to 25,624 bp (Nettapus auritus, Anseriformes) and a mean size of 17,121 bp. Coupled with such a burgeoning availability of data, the field of avian mitochondrial phylogenomics (mitophylogenomics) has undergone unprecedented growth [24,25,26,27,28,29,30,31,32,33,34,35,36,37]. However, the mitogenomes for only five of the 159 known Sturnidae sensu lato species have been reported. Therefore, to gain further insights into the characteristics of the mitogenomes of these closely related taxa and their phylogenetic implications, more samples are needed.
In this paper, we report five new complete mitogenome sequences of Sturnidae sensu lato taxa, as well as two low-coverage nuclear genomes of Spodiopsar (Sturnidae) species. Together with the sequences available in the NCBI database, these new sequences are utilized for further analyses. Based on both nuclear and mitochondrial sequence data, we attempt to address the following: (1) the nucleotide features and organization of Sturnidae sensu lato mitogenomes, (2) the codon usage bias and aversion patterns of mitochondrial genes, (3) the structures of mitochondrial tRNA and rRNA genes, and (4) the phylogenetic relationships within and among the three related families (Sturnidae, Mimidae, and Buphagidae). As far as we know, the current work is the first to explore the mitogenome-wide evolution of these taxa.

2. Materials and Methods

2.1. Sampling, DNA Extraction, Sequencing, and Assembly

This study displayed five new mitogenome sequences. Four of the five sequences were obtained from the frozen muscle tissues of Acridotheres cristatellus, A. tristis, Gracupica nigricollis, and Spodiopsar cineraceus. These samples were collected from the Ningguo Museum of Natural History (NMNH), Xuancheng, China. The remaining sequence (Mimus polyglottos) was obtained from the NCBI database using third-party annotation (TPA).
Whole-genomic DNA was extracted from muscle using phenol–chloroform using the standard protocol [38]. New PCR primers (Tables S1–S4) for amplification and sequencing were designed based on the sequences available in GenBank. The entire mitogenomes were amplified into long overlapping segments using the LA PCRTM Kit (Takara, Dalian, China). The resulting amplicons were used as templates for nested PCR with specific primer sets. After being purified, the PCR products were sequenced on the ABI-PRISM 3730xl platform. The resulting sequences were assembled in Sequencer v4.14 (Gene Codes Corp., Ann Arbor, MI, USA). Furthermore, the short-paired reads files for Mimus polyglottos were derived from the NCBI SRA database. Subsequently, the mitochondrial reads were extracted and de novo assembled using the GetOrganelle v1.7.5 [39,40]. The resulting filtered circular de Brujin mitogenome graphs were checked using Bandage v0.8.1 [41].
The current study additionally presents low-coverage nuclear genomic data from two species of Spodiopsar (S. cineraceus and S. sericeus) for further phylogenetic study. Frozen muscle tissues for these two species were also provided by NMNH. The genomic DNA extraction was conducted using the E.Z.N.A. Tissue DNA kit (Omega Bio-Tek, Norcross, GA, USA). The library was generated using the TruSeq DNA PCR-Free Library Prep Kit (Illumina, San Diego, CA, USA), which was then sequenced using Illumina Hiseq X Ten (Illumina, San Diego, CA, USA) under the 150-paired-ends strategy with 350 bp insert sizes.

2.2. Gene Annotation and Comprehensive Sequence Analyses

The mitogenomes were annotated with GeSeq [42]. The mitochondrial genes were named according to the HUGO Nomenclature Committee (HGNC) [43]. The species scientific names followed the Clements Checklist 2019 [4]. The mitogenomic map of Sturnidae sensu lato was depicted using the CGview comparison tool (https://paulstothard.github.io/cgview_comparison_tool/, accessed on 24 August 2024) [44]. The nucleotide composition was calculated using MEGA X [45]. The GC content of the synonymous third codon positions (GC3s) and the nucleotide polymorphisms for each species were determined with DnaSP v6.12.03 [46]. PAML v4.9 (F3X4 and M0 models) was used to assess the nonsynonymous substitution rate (dN), synonymous substitution rate (dS), and dN/dS. Specifically, the value of dN/dS quantified the selection pressure, with <1, =1, and >1 indicating purifying, neutral, and positive selection, respectively. The relative synonymous codon usage (RSCU) values and the effective number of codons (ENCs) were calculated using CodonW v1.4.4 [47]. Subsequently, the aversive codons were determined according to the rule that codons with RSCU = 0. The ENC-GC3 plot, principal component analysis (PCA), and the parity rule 2 (PR2) plot were plotted using R x64 4.0.2. The tRNA secondary structures were created using the tRNAscan-SE v2.0.3 [48], and the rRNA secondary structures were predicted based on those from other birds [25,49]; the numbering of the helixes of rRNAs followed the method proposed by Cannone et al. [50].

2.3. Phylogenetic Inferences

To assess the evolutionary affinities among Sturnidae sensu lato, two datasets were established. One dataset comprised 13 mitogenomic PCGs from 10 available Sturnidae sensu lato species. Meanwhile, the other was generated by combining the nuclear and mitochondrial data of 132 Sturnidae sensu lato species from 45 genera, including five mtDNA loci (MT-ATP6, MT-ATP8, MT-CO1, MT-CO2, and MT-ND2) and eight nuclear loci (Fib5, Fib7, RDP1, TGFB2-4, ODC, GAPDH-11, myo, and RAG-1) (Table S5). Furthermore, two species from the family Muscicapidae, namely, Ficedula albicollis, and F. zanthopygia, were employed as outgroups for both datasets. Additionally, to obtain the optimal resolution and clade confidence, three frequently used methods were employed to obtain a combined phylogenetic inference, i.e., maximum likelihood (ML), maximum parsimony (MP), and Bayesian inference (BI).
The ML analyses were conducted using RAxML 8.2.12 [51], with 100 random starting trees, 1000 bootstrap replicates (under GTRCAT model), and a bootstrap convergence criterion. PAUP* version 4.0a168 was used to perform the MP analyses [52] with heuristic search settings: 10 random-stepwise-addition replicates with tree-bisection reconnection (TBR) branch swapping, and 1000 bootstrap replicates. Subsequently, prior to the BI analyses, the model best suited to each genomic locus was determined using ModelTest-NG 0.1.6 [53]. For the BI inference, two simultaneous runs and four independent Markov chains were run for 10,000,000 generations (sampling every 1000th generations) using MrBayes 3.2.7a [54]. Lastly, the over-100 effective sample sizes (ESSs) of all parameters were considered to check the convergence of chains.

3. Results

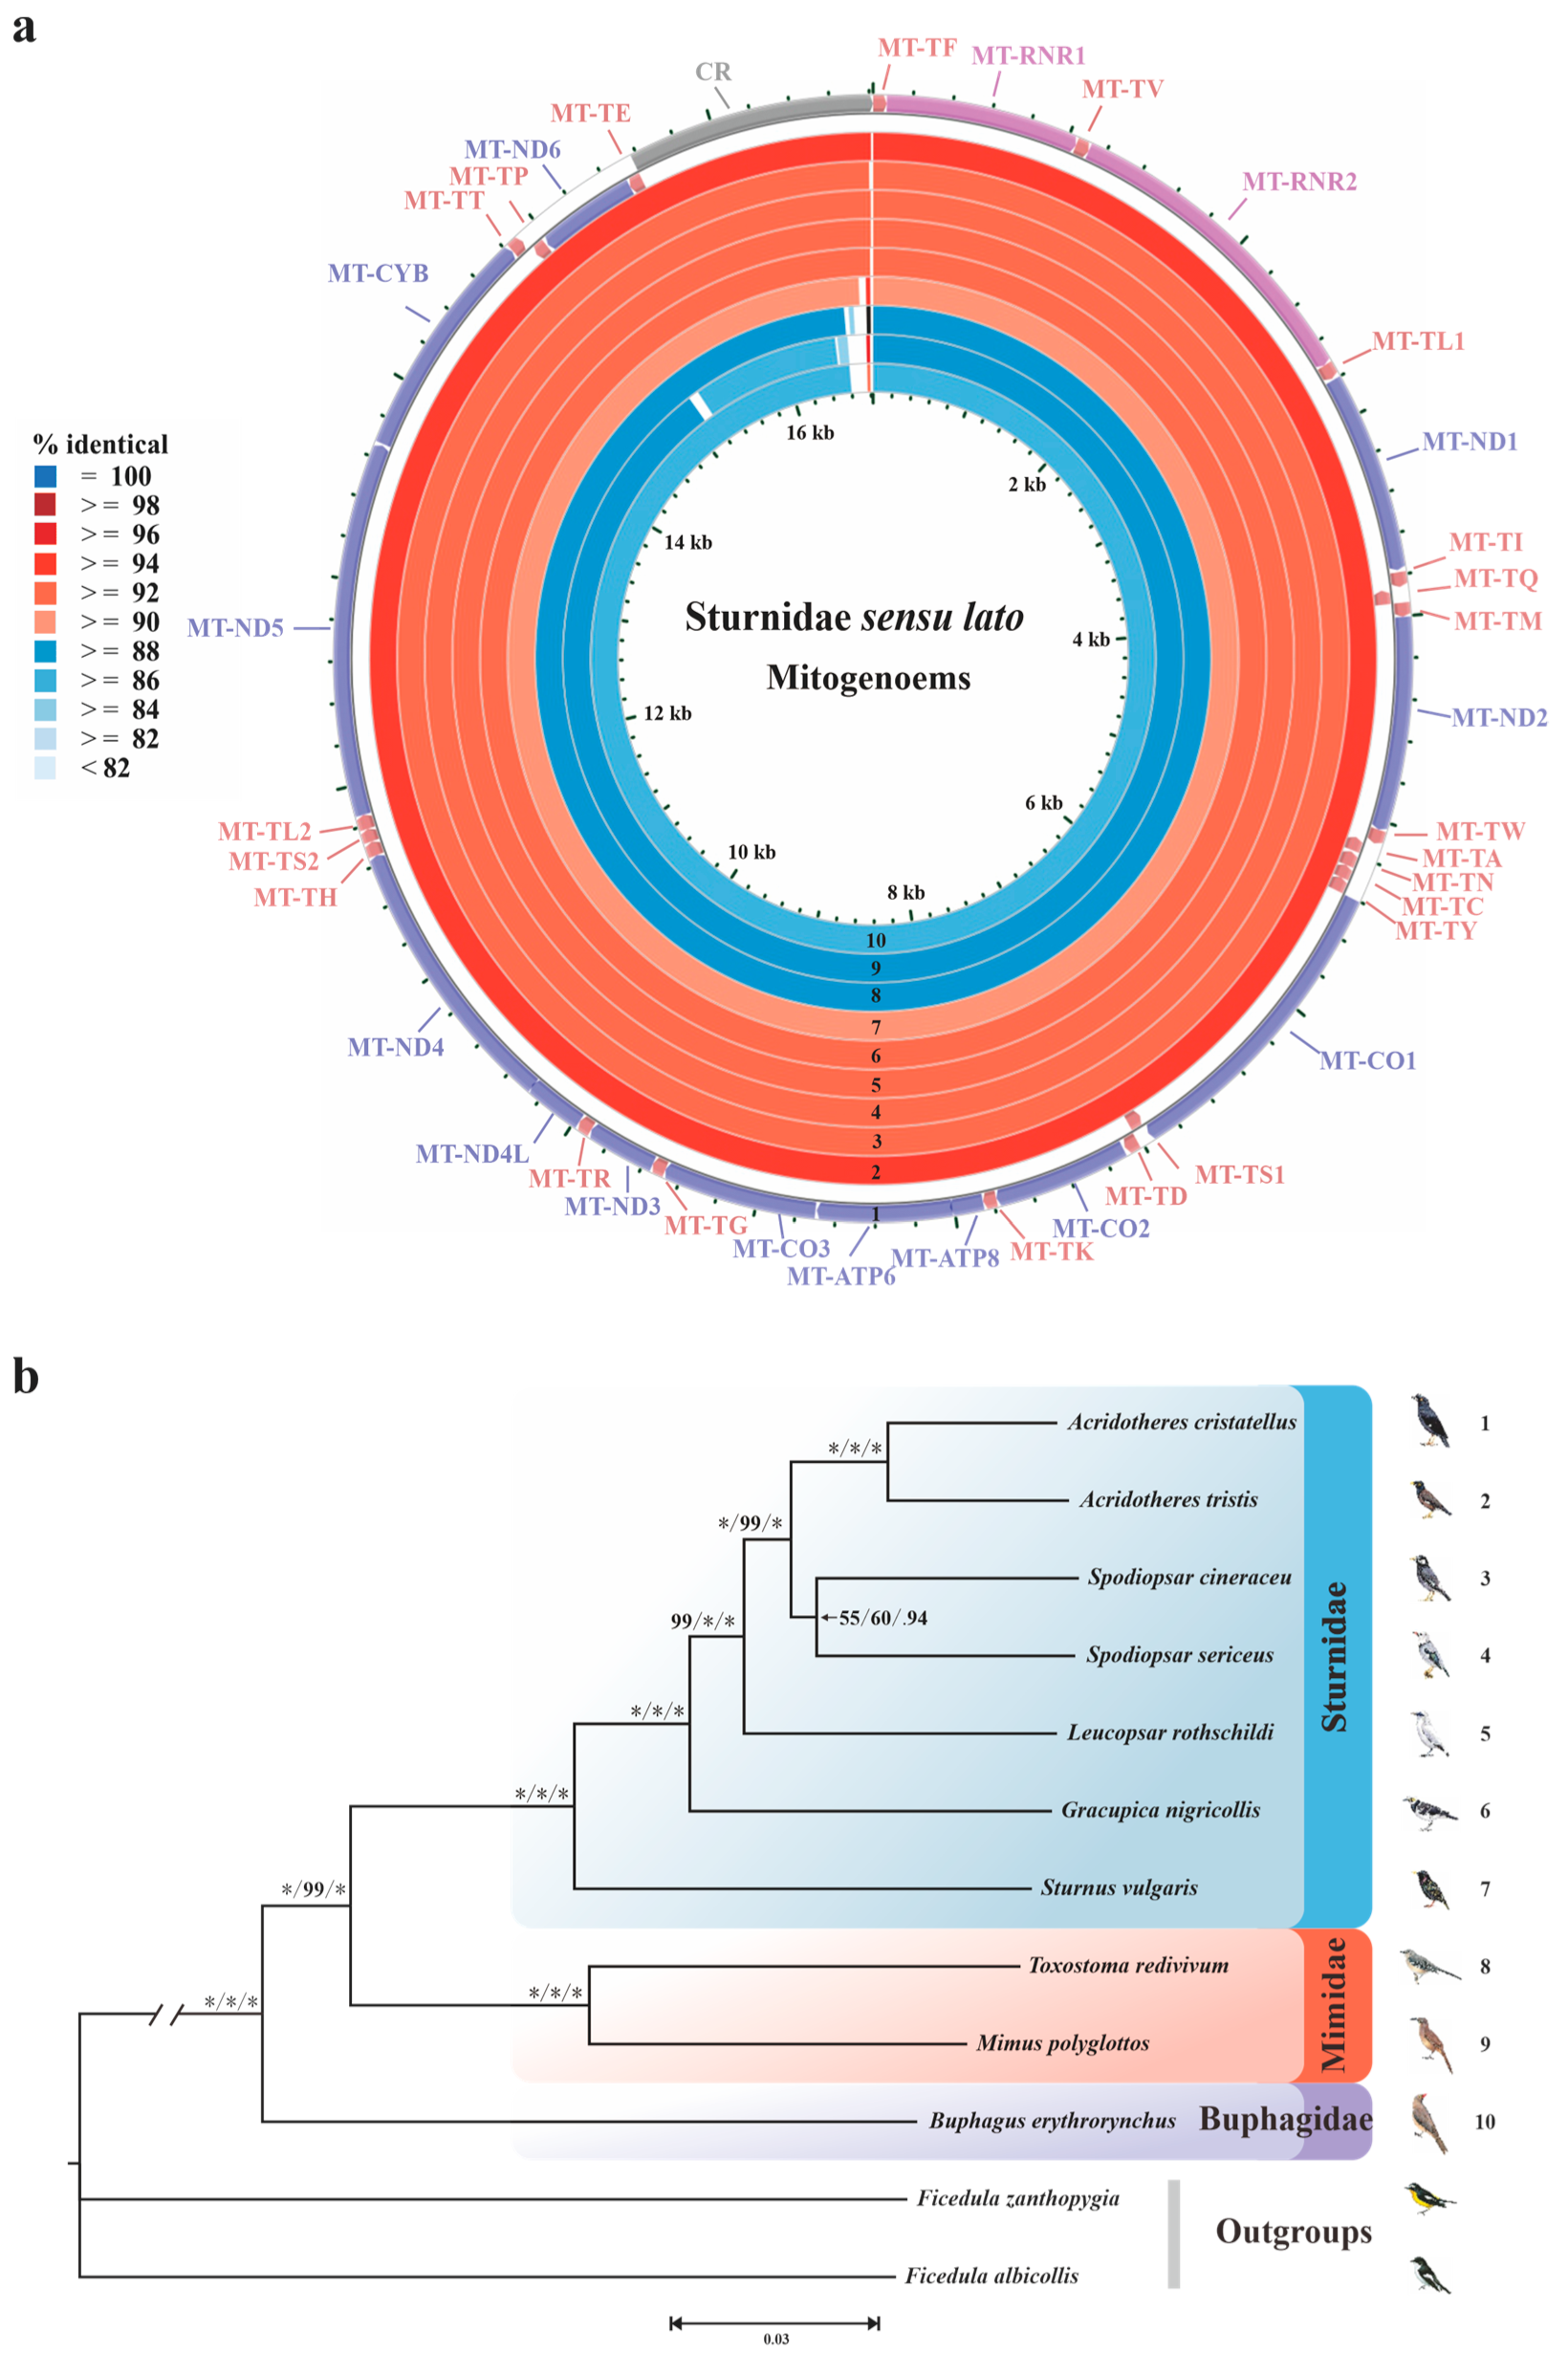
3.1. NGS Data Information and Mitogenome Organization

In the present study, we obtained five new mitogenomes of Sturnidae sensu lato, and their GenBank accession numbers can be found in Table S6. All five of our newly generated mitogenomes were supercoiled, double-stranded, and circular macromolecules. Comparatively, we analyzed all ten mitogenomes that were obtained from Sturnidae sensu lato. It should be noted that the publicly available mitogenome sequence of Gracupica nigricollis (JQ003192) was not included here, as these data were actually derived from both Gracupica nigricollis and Acridotheres cristatellus [55]. The results showed that the sizes of the mitogenomes ranged from 16,780 bp (Toxostoma redivivum) to 16,845 bp (Leucopsar rothschildi) (Table 1). Similar to most passerine birds, the nucleotide compositions of their mitogenomes (heavy strand) were slightly biased toward A and T, while the total of AT content ranged from 51.85% (Buphagus erythrorynchus) to 52.95% (Gracupica nigricollis) (Table 1). As expected, most of these genes were encoded on the heavy strand except for eight tRNA genes and MT-ND6 (Figure 1a). Including stop codons, the total length of the PCGs of each mitogenome was identical (11,400 bp), with the AT content ranging from 50.65% to 52.13% (Table 1).
In addition, our study also provided new NGS data for two Spodiopsar species. A total of 35,782,311 and 33,050,441 clean reads were sequenced from the S. cineraceus and S. sericeus libraries, respectively. All clean reads that were yielded have been submitted to the NCBI SRA database under the accession numbers SRR10053857 (S. cineraceus) and SRR10053850 (S. sericeus). Here, we obtained eight new nuclear loci for S. cineraceus and S. sericeus from the NGS data.

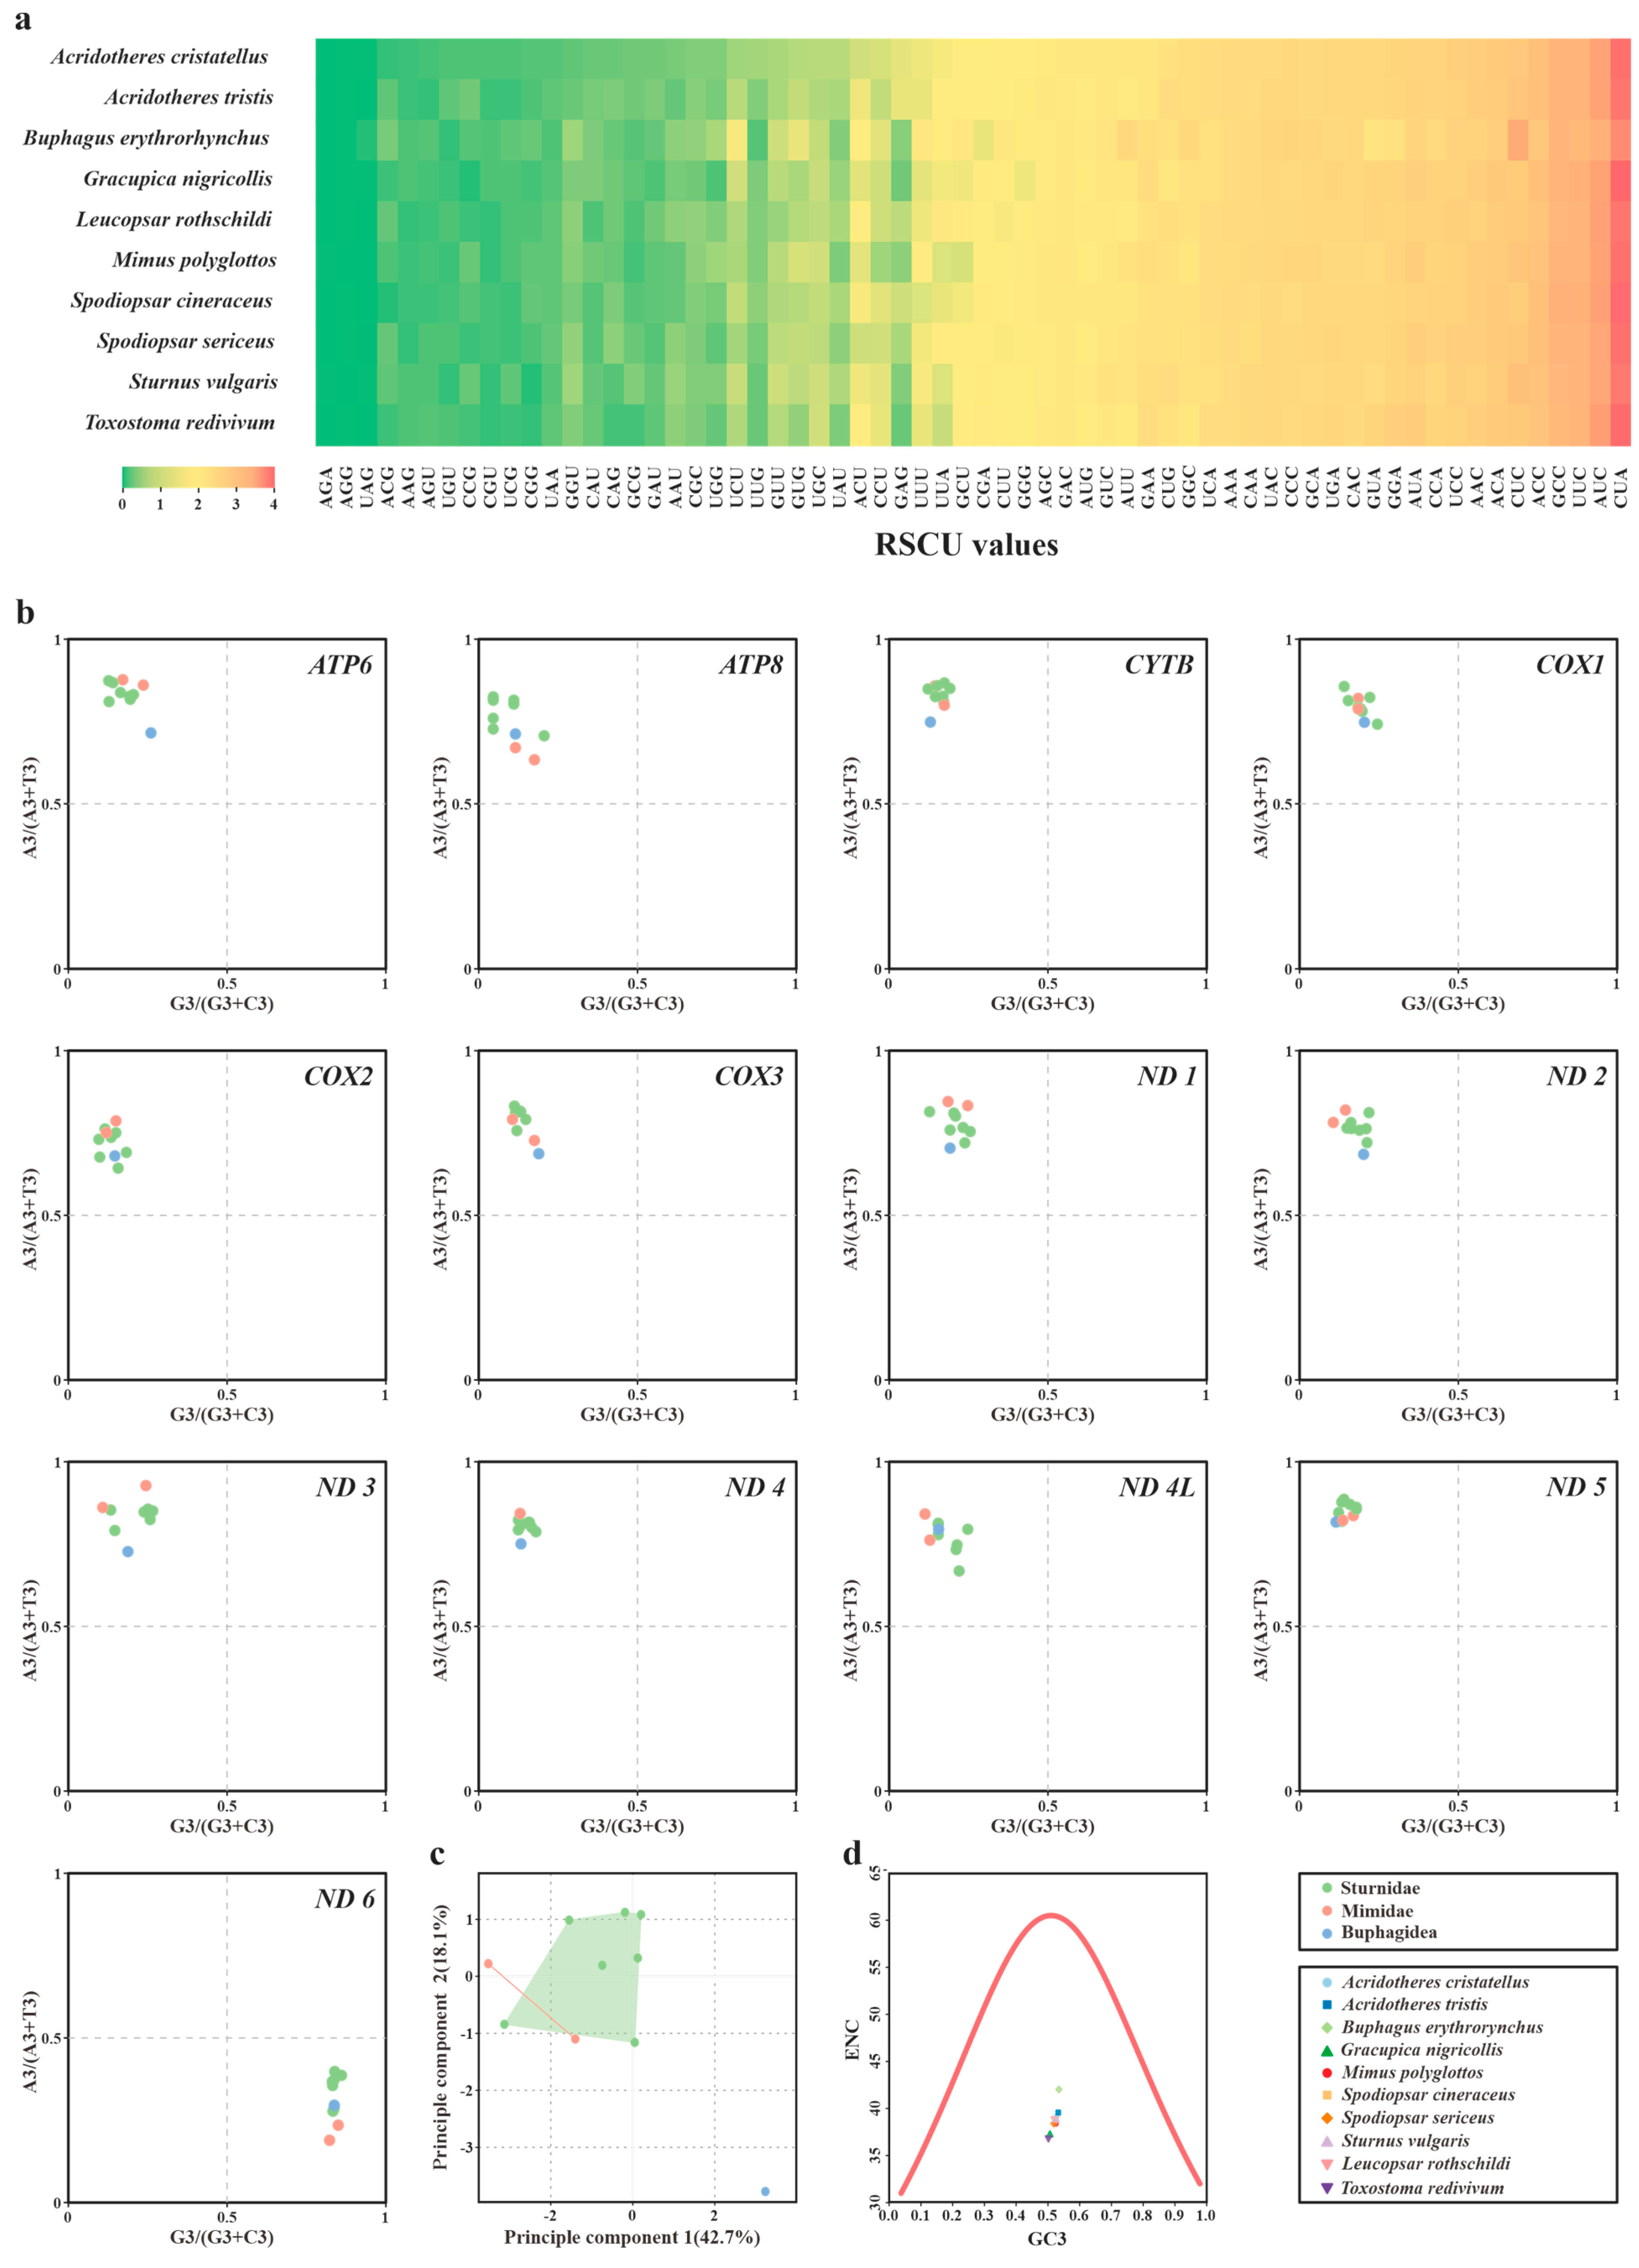
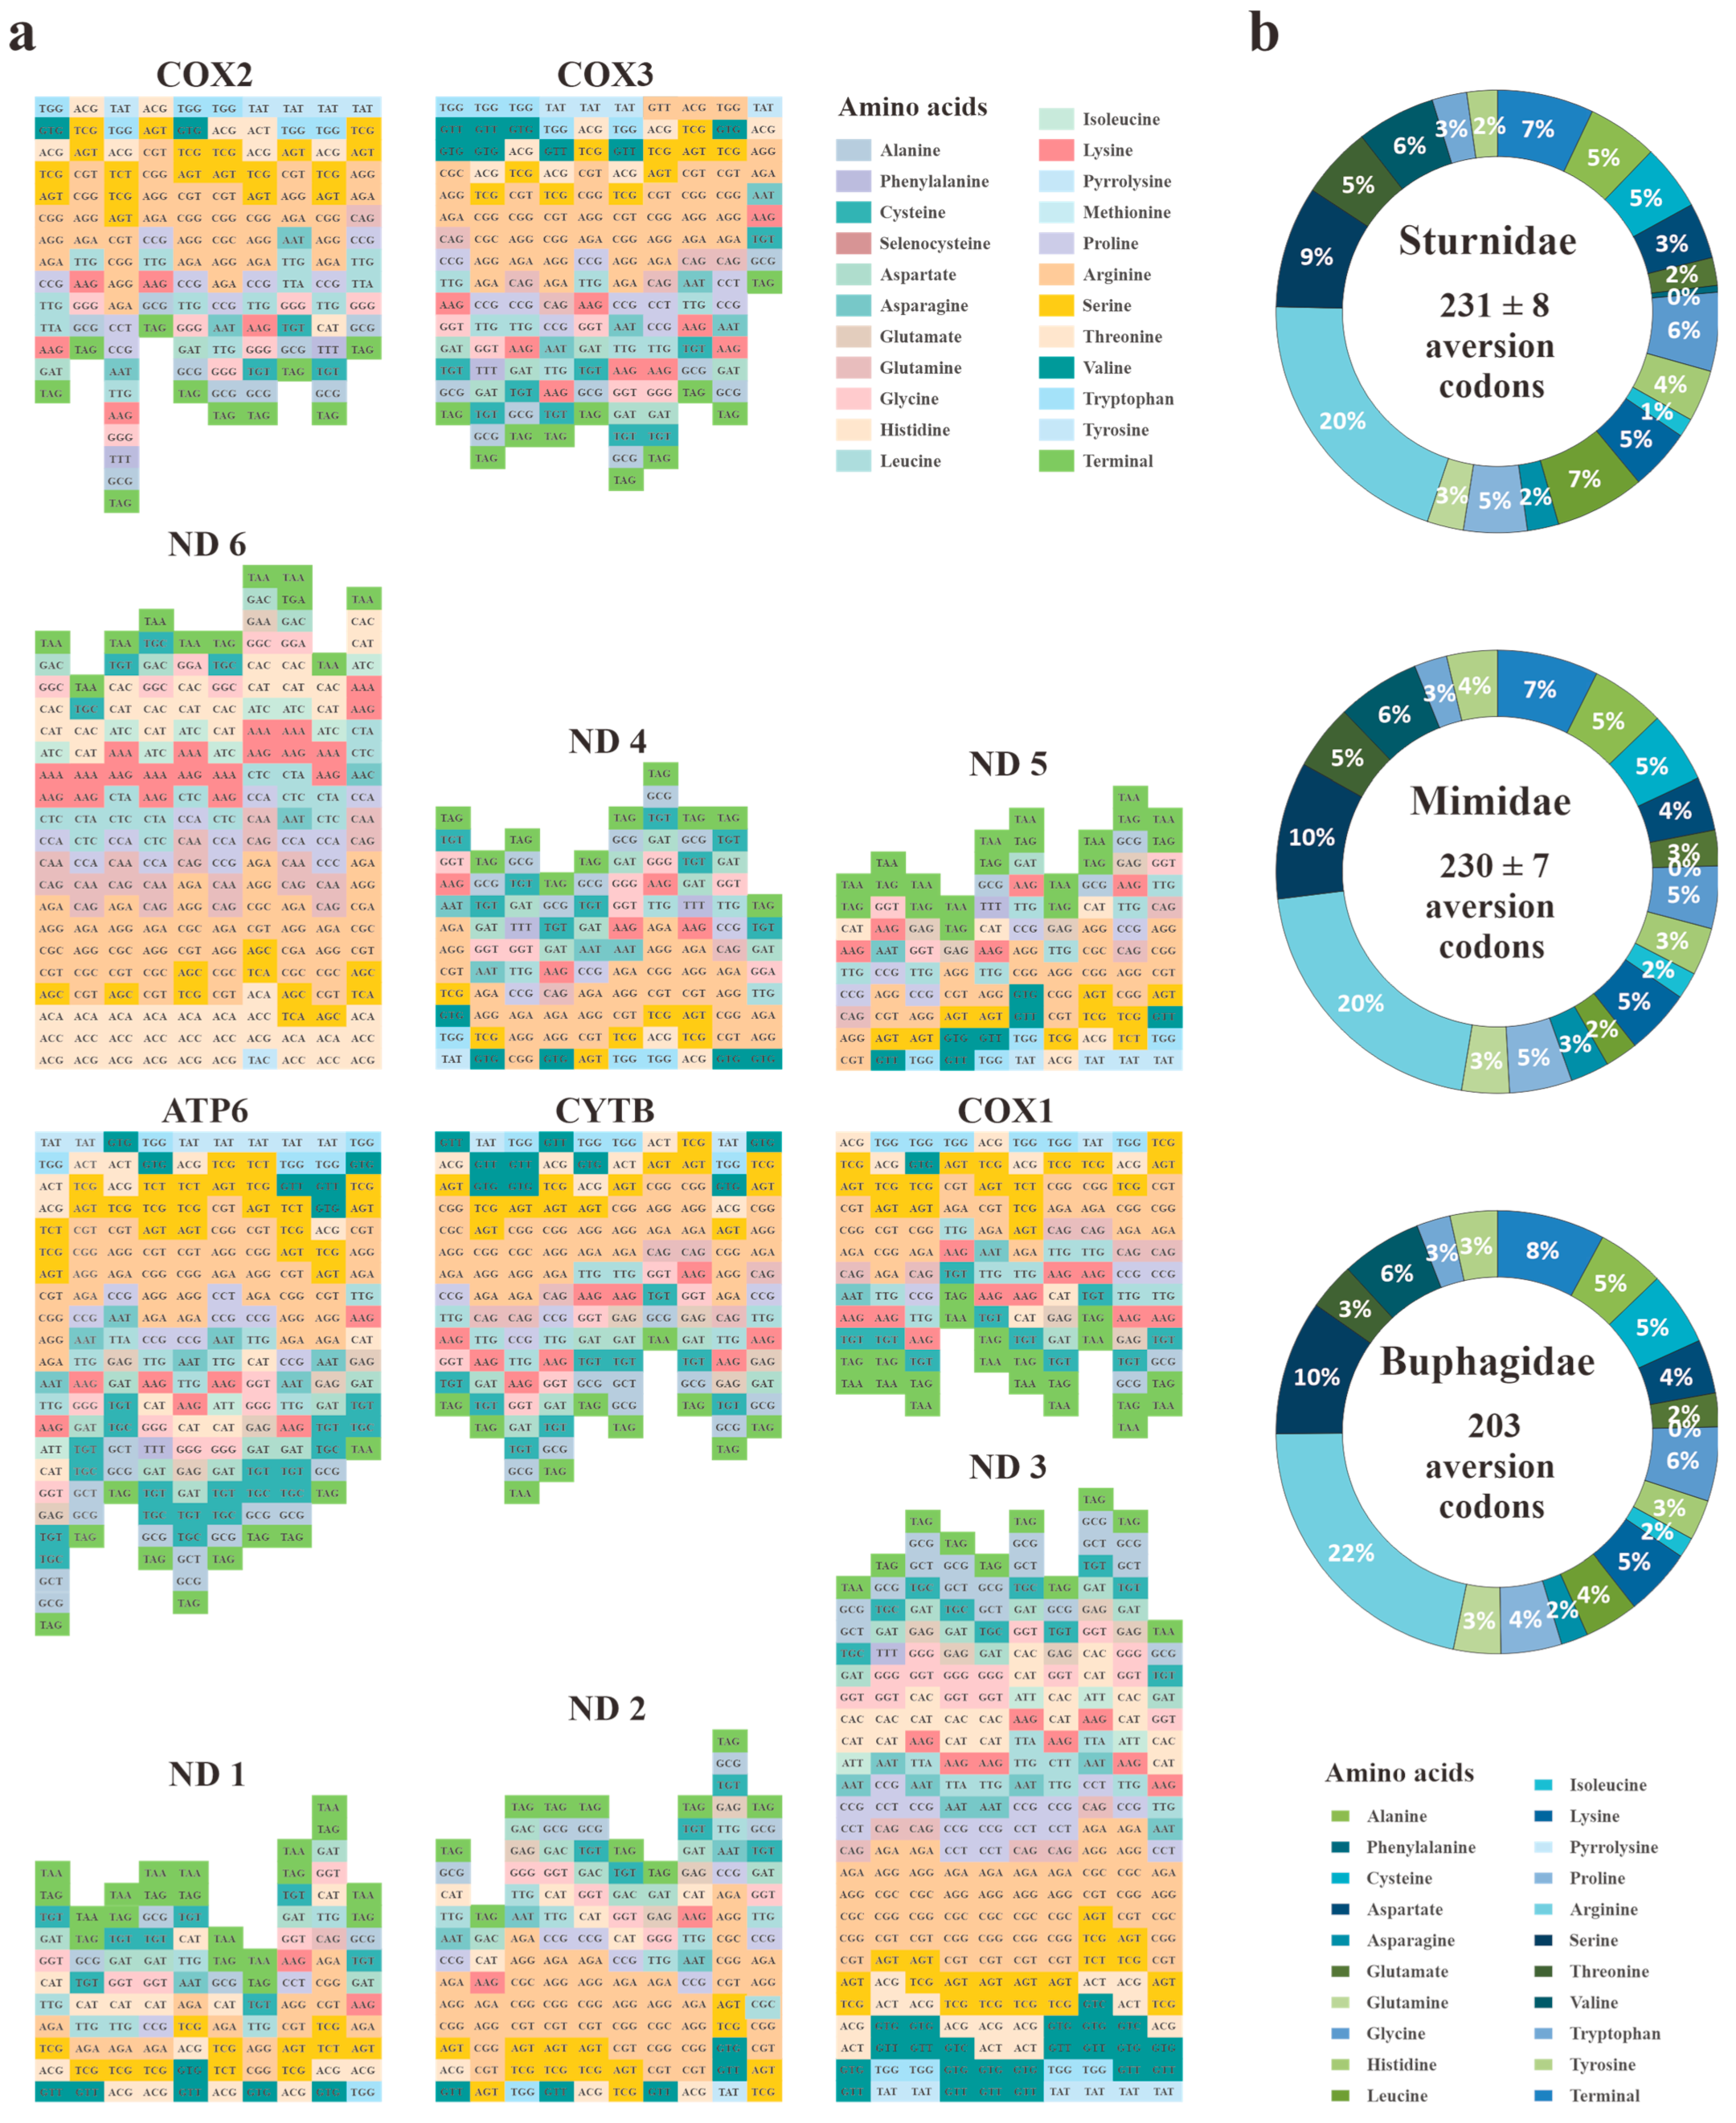
3.2. Codon Usage Bias (CUB) and Codon Aversion of Mitochondria PCGs

To elucidate the codon usage patterns of the mitogenomes among Sturnidae sensu lato taxa, we assessed the RSCU values, PR2 plots, PCA, and ENC-GC3s plots for the ten involved taxa.
With the exclusion of initial and stop codons, the RSCU of the overall PCGs was compared among the Sturnidae sensu lato mitochondria. Displaying a relatively high level of diversity, the RSCU values ranged from 0.04 (codon ACG of Spodiopsar cineraceu) to 4.17 (codon CGA of Toxostoma redivivum) (Figure 2a). Notably, across the synonymous codons, those ending with A or T were mostly favored.
For each of the 13 mitochondrial PCGs, the PR2 plots were further produced by restricting four-fold degenerate codon families to third-codon sites (Figure 2b). For the overwhelming majority of the mt PCGs (12 of the 13), the points fell into the quadrant II and were far off the central axes, implying a strong AC bias at the third-codon positions of these codons. Most remarkably, MT-ND6 showed the exact opposite pattern in quadrant IV, demonstrating a TG-ending bias.
Surprisingly, the codon aversion analyses revealed the most striking interspecies disparities within Sturnidae sensu lato. For all 11 mt PCGs with a size over 300 bp, the codon aversion motifs differed among the ten species examined (Figure 3a). Meanwhile, it was interesting that the numbers and corresponding amino acids of the aversion codons were identical among the three families (Figure 3b). Within this pattern, Sturnidae seemed to share a higher level of similarity with Mimidae than Buphagidae.
The ENC analyses were performed to further explore the codon usage bias. The ENC values of the ten species were found to possess a narrow range of 36.88 to 42.02 (Table S7). Collectively, the results revealed no strong codon usage bias within Sturnidae sensu lato. Moreover, PCA was employed to determine the variety of codon usage patterns based on ENC (Figure 2c). PC1 explained 42.7% of the variance, while PC2 accounted for 18.1%. As shown in Figure 2d, the points of the ENC-GC3s plot dipped well below the curve, demonstrating that the codon usage pattern of mitogenomes within Sturnidae sensu lato might result from natural selection.

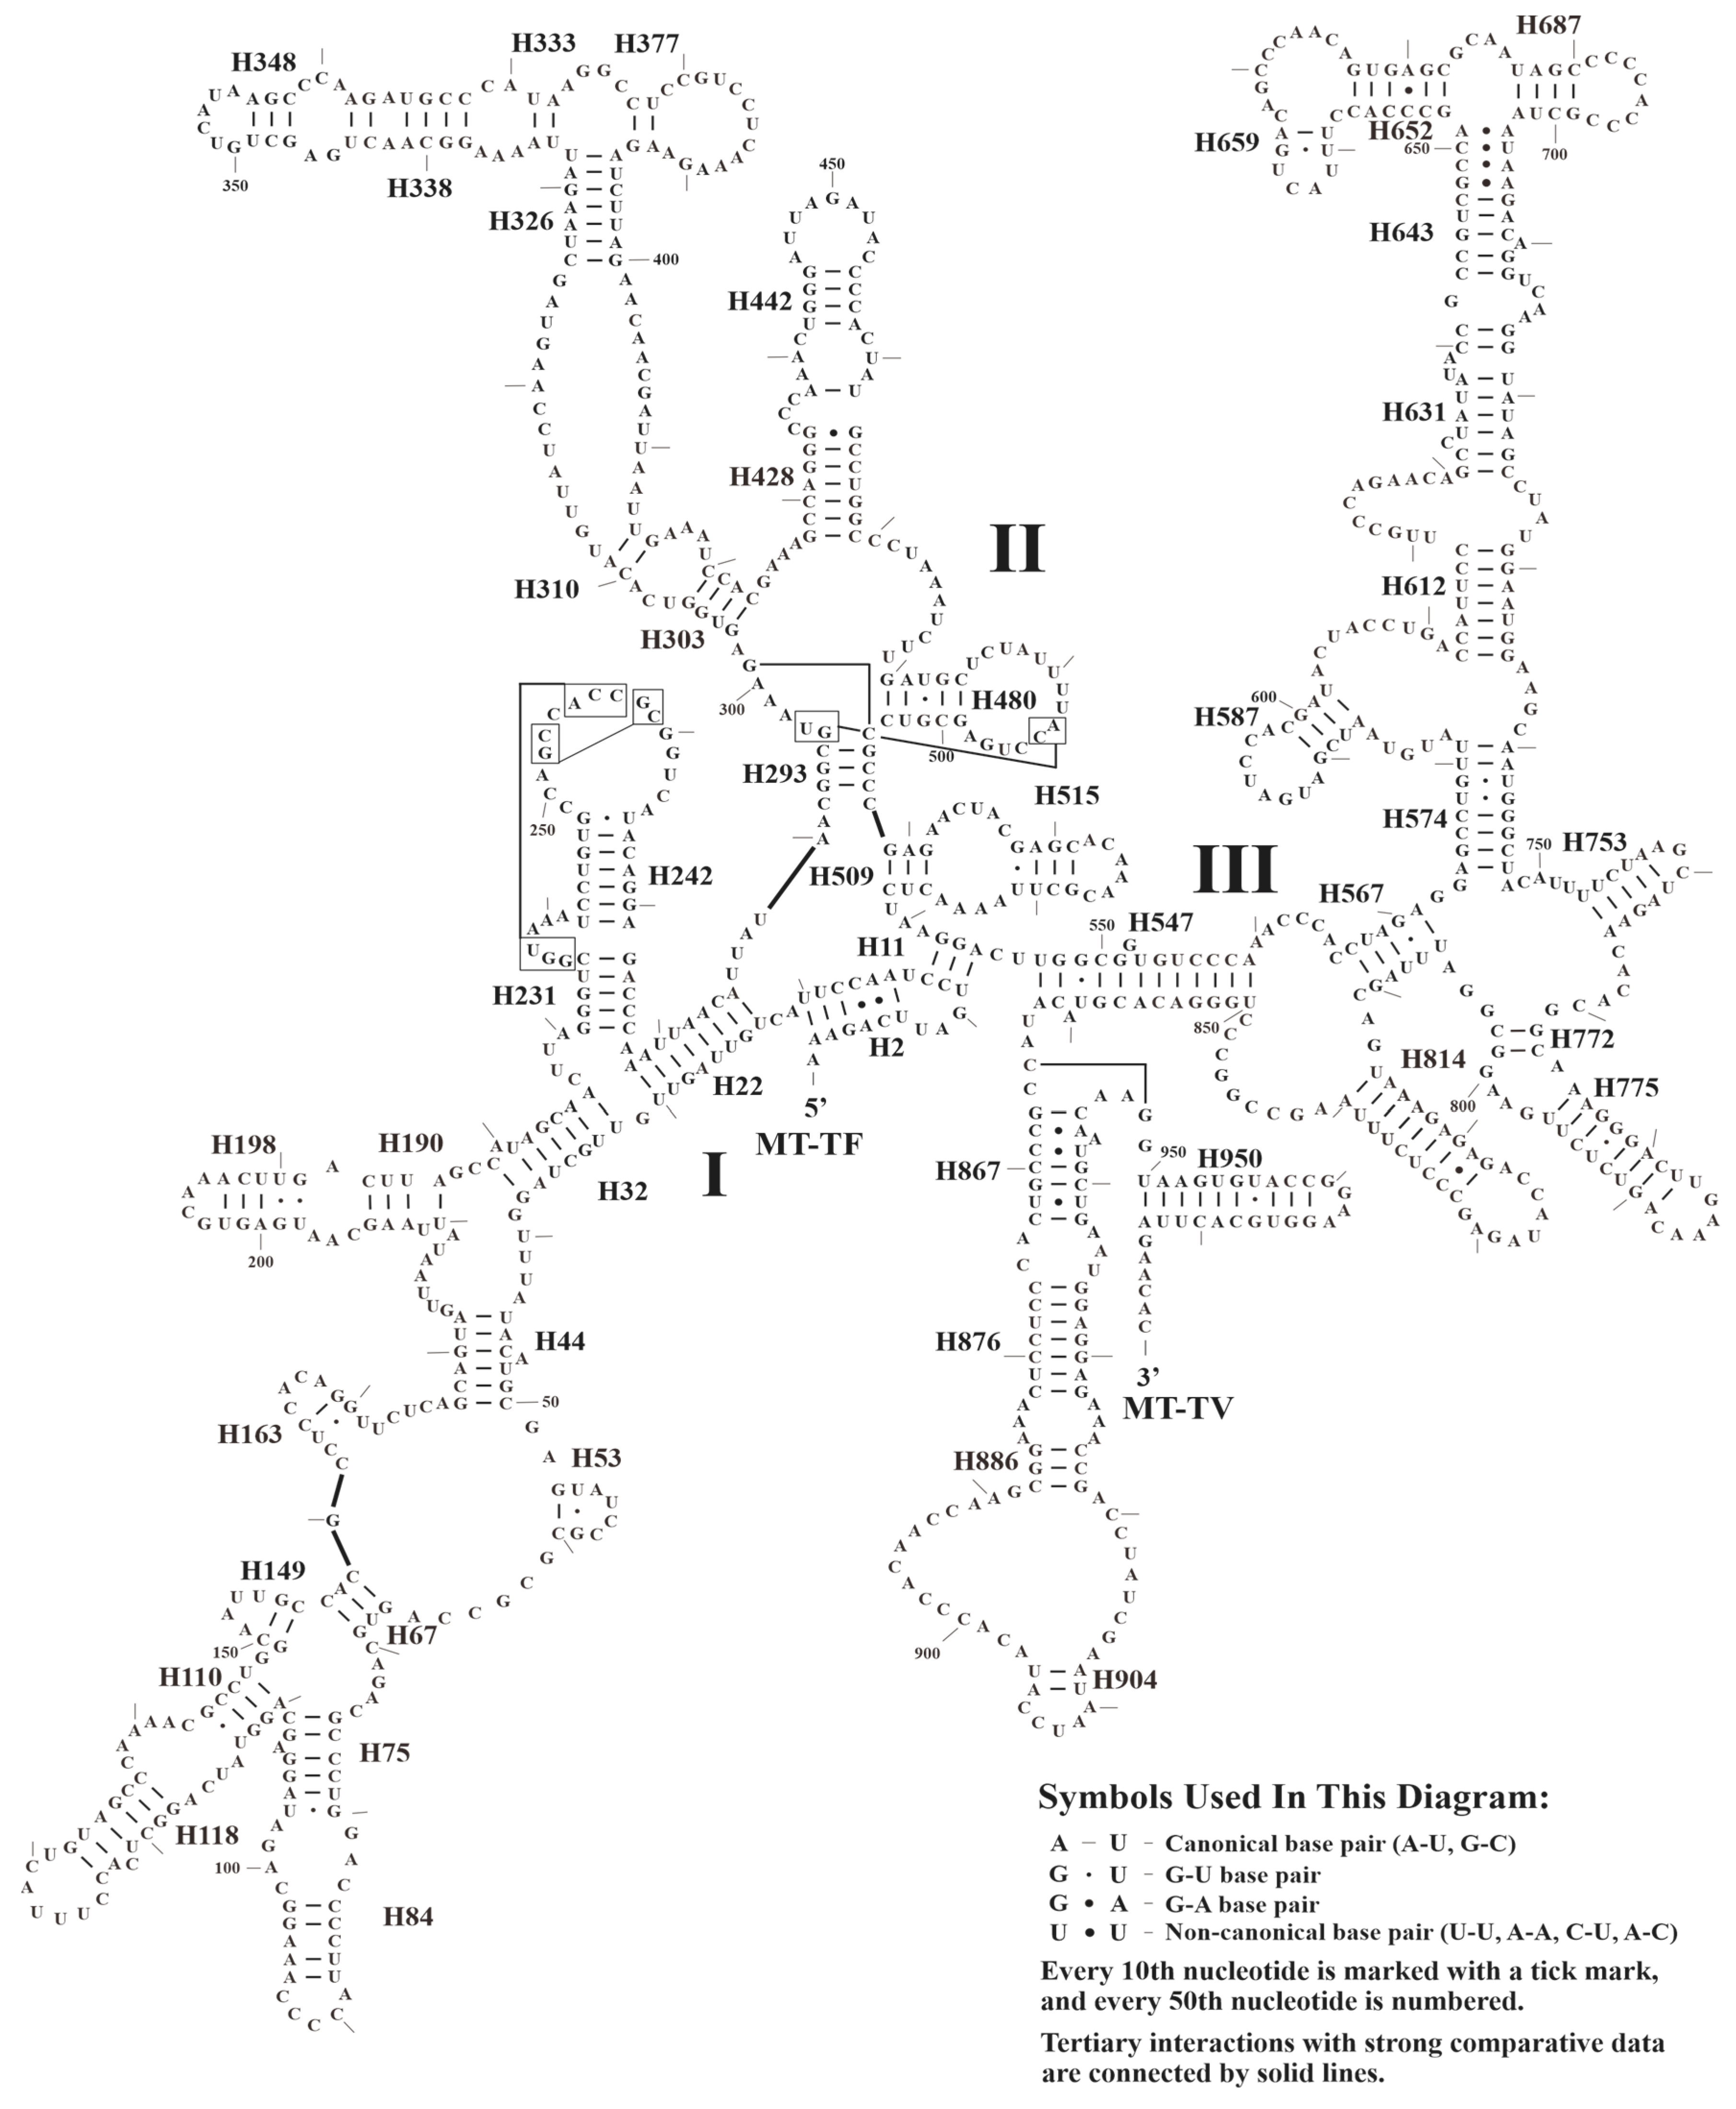
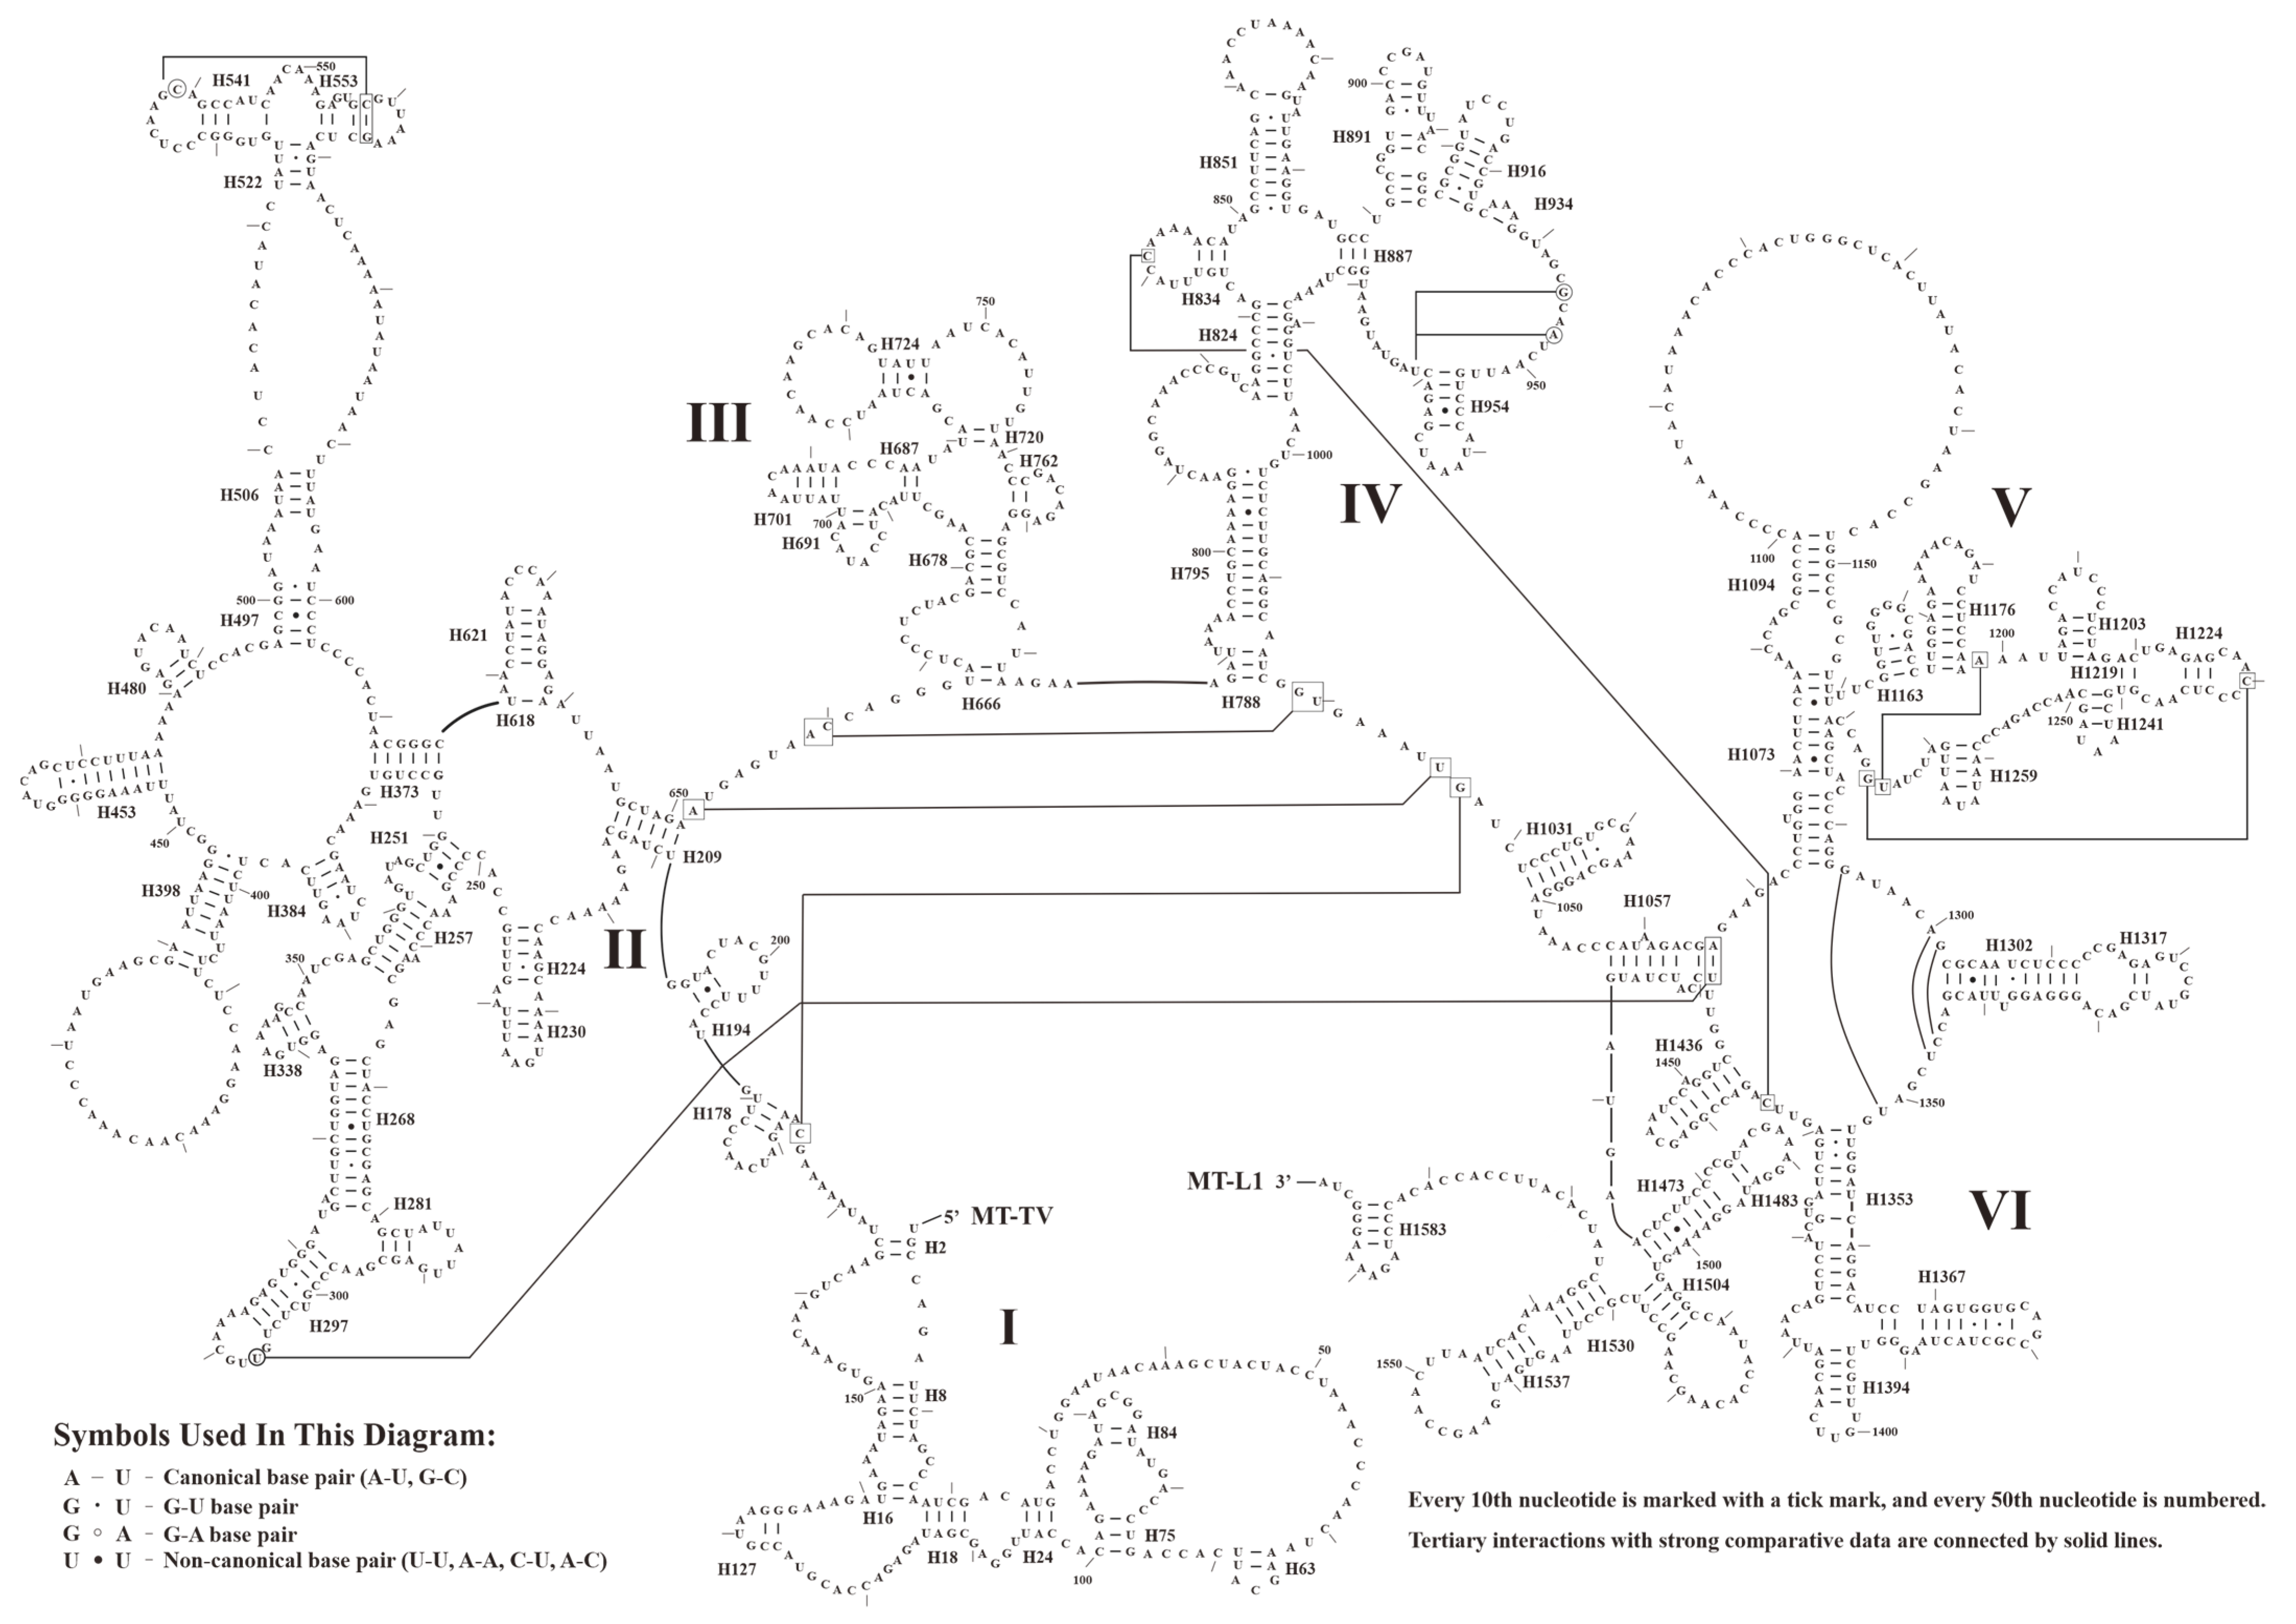
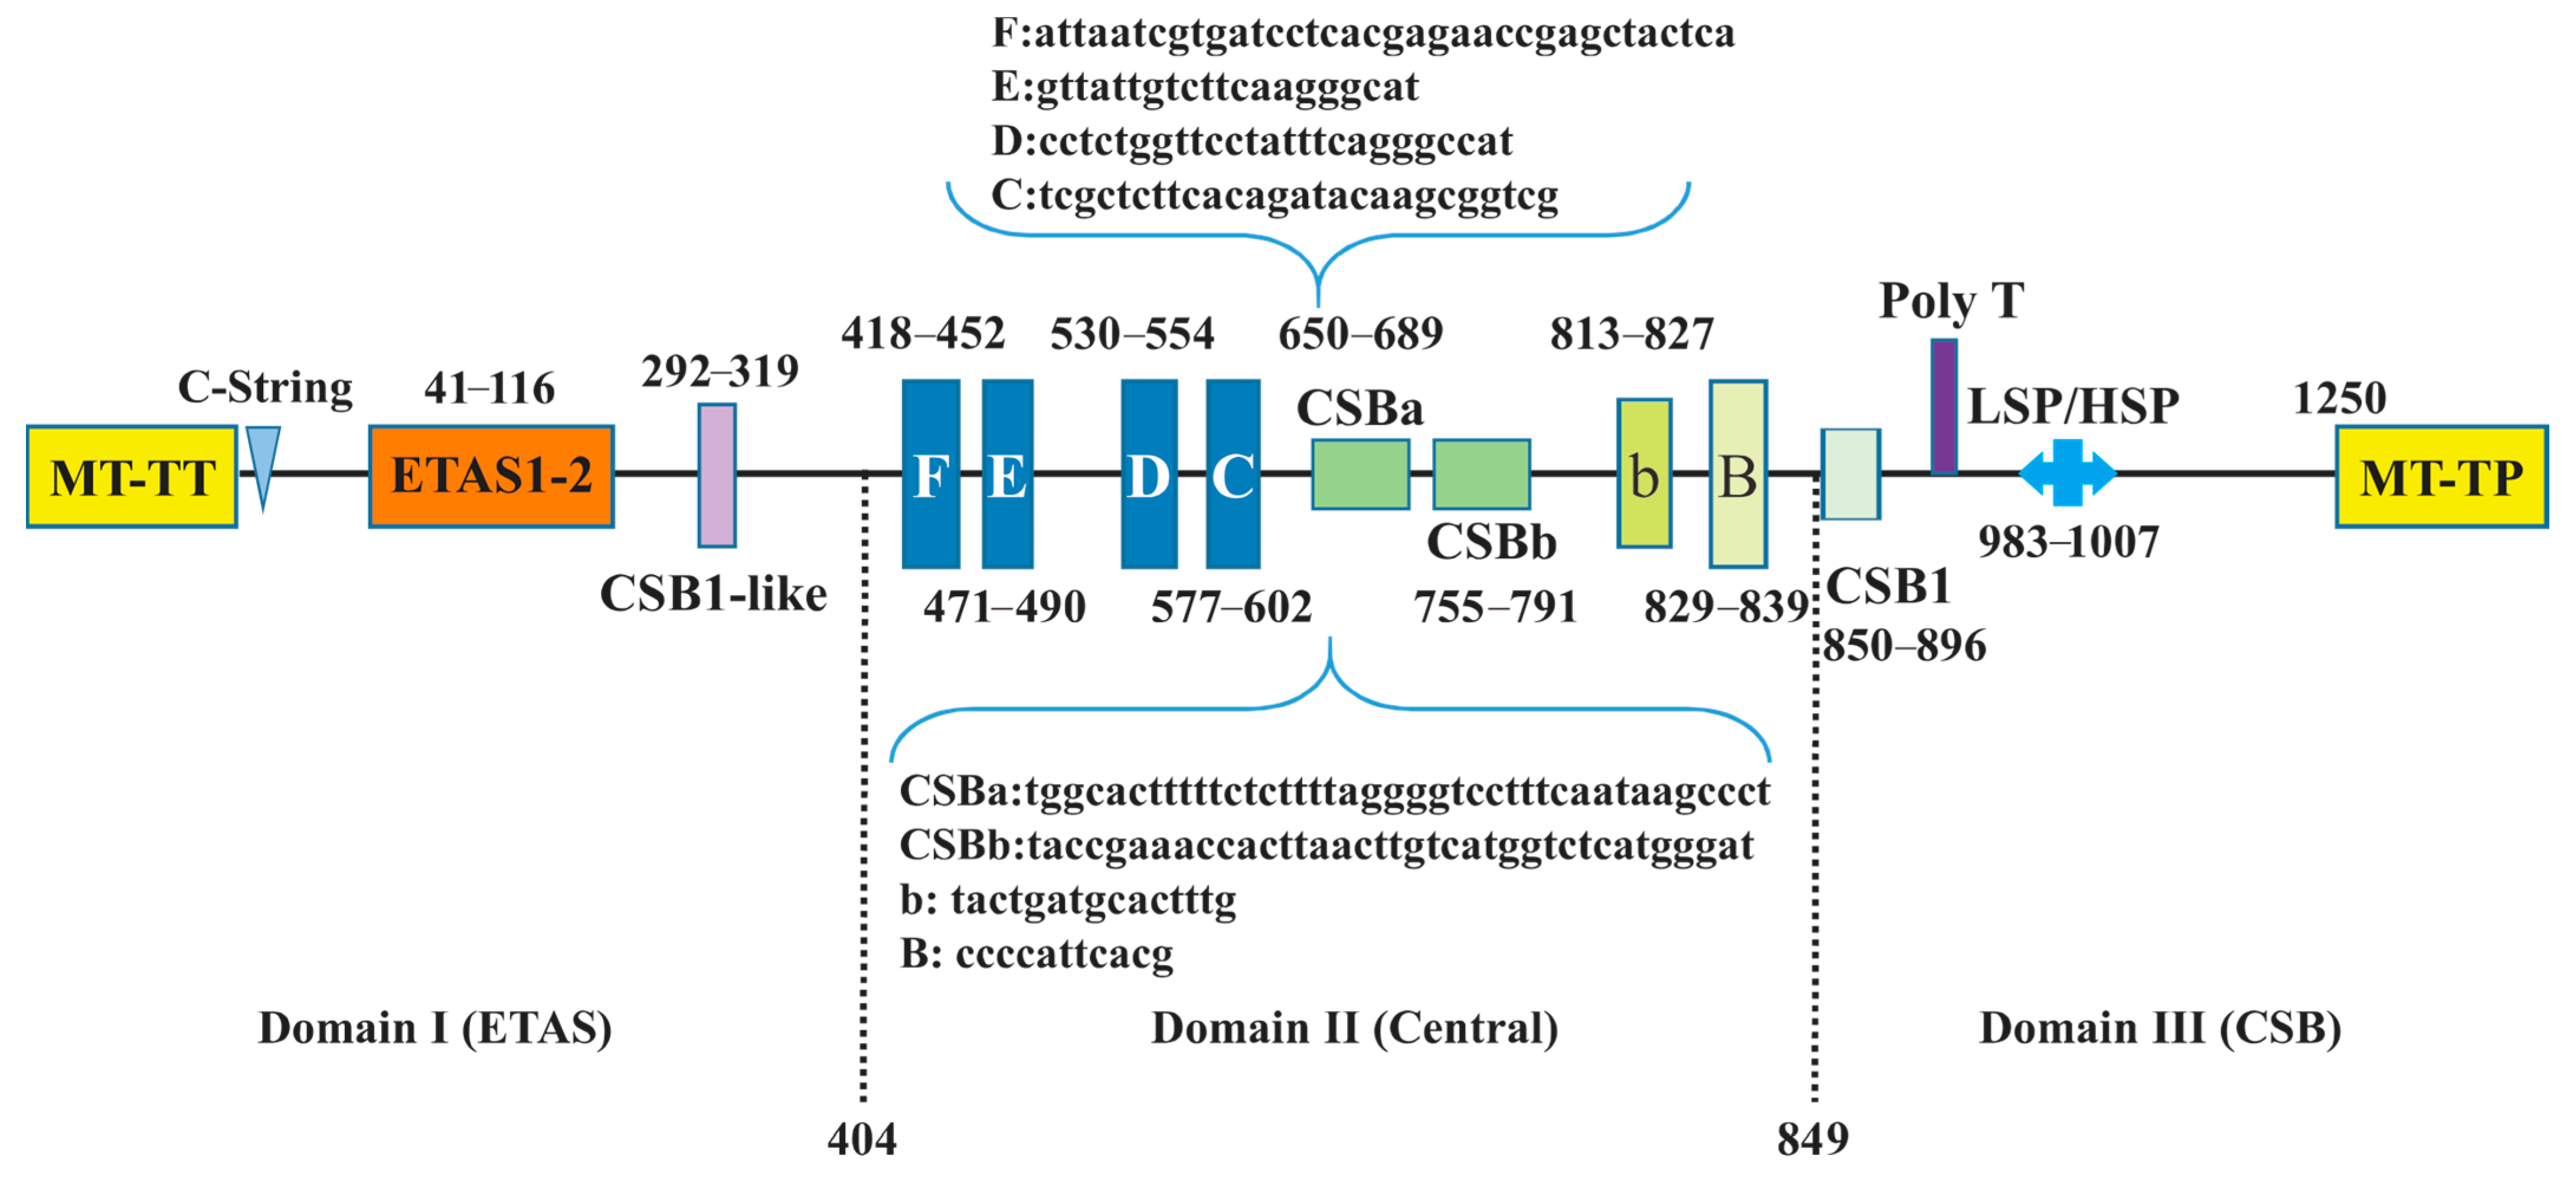
3.3. Secondary Structure of tRNAs, rRNAs, and CRs

All ten mitogenomes contained 22 tRNA genes with a total length ranging from 1540 bp (M. polyglottos and S. vulgaris) to 1546 bp (B. erythrorynchus) (Figure 4 and Table 1). In addition, all the tRNAs could be folded into typical cloverleaf secondary structures, except for MT-TS2 (trnS-AGY), which lacks the stem of the dihydrouridine (DHU) arm. Moreover, three unpaired nucleotides (A, C, and C) were observed in the TΨC stem of MT-TF within Sturnidae sensu lato mitogenomes (Figure 4).
Similar to the typical avian mitogenomes, MT-RNR1 and MT-RNR2 were separated by MT-TV. The size and AT contents of MT-RNR1 and MT-RNR2 are presented in Table 1. Here, we used A. cristatellus as an example to predict the secondary structures of MT-RNR1 and MT-RNR2, which comprised 49 helices (three domains) and 71 helices (six domains), respectively (Figure 5 and Figure 6). Further comparative analysis showed that the overall secondary structures of MT-RNR1 and MT-RNR2 were conserved well among the birds, except for a few small differences. Among our sampled species, the CRs were located between MT-TT and MT-TF, with their size ranging from 1208 bp (T. redivivum) to 1254 bp (L. rothschildi) (Table 1); this also contained three conserved domains and eight conserved blocks, namely, boxes F, E, D, C, CSBa, and CSBb, b, and B in Domain II (Figure 7).

3.4. Rates and Patterns of Mitochondrial Gene Evolution

To examine the evolutionary patterns of the mitogenomes within Sturnidae sensu lato further, we calculated the variable sites, nucleotide diversity (π), dN/dS, and ts/tv of 13 mt PCGs. The results showed that MT-ND2 had the most variable sites (37.66%), followed by MT-ATP8 (34.52%), MT-ND6 (34.30%), and MT-ND1 (33.74%) (Table 2). In contrast, the cytochrome c oxidase genes and cytochrome b gene (MT-CO1, MT-CO2, MT-CO3, and MT-CYB) had lower percentages among the PCGs (Var. sites [%] = 23.79, 28.65, 27.35, and 25.55, respectively). Furthermore, the π values range from 0.09015 (MT-CO1) to 0.13797 (MT-ND2), with the ts/tv ratios varying from MT-ATP8 (5.4548) to MT-ND4 (12.7131) (Table 2).
Our analyses revealed a dN/dS pattern with a clear signature of purifying selection on the mitogenomes within Sturnidae sensu lato (Table 2). Compared with other PCGs, MT-ATP8 had the highest dN/dS ratio (0.25631); it also had some highly variable sites with extreme changes in the properties of amino acids. In contrast, the lowest dN/dS ratio was estimated for MT-CO1 (0.00579).

3.5. Phylogenetic Implications

The phylogenetic affinities among the Sturnidae sensu lato taxa were inferred using two datasets (mitogenomic dataset and multilocus dataset). The best-fit models were also assessed (Table 3 and Table S8). In addition, the substitution saturation test demonstrated that all three codon positions were unsaturated (Table 4 and Table S9).
Firstly, according to the 12-mitogenome dataset (ten Sturnidae sensu lato taxa and two outgroups), the phylogenetic topologies of the ML, MP, and Bayesian trees were nearly identical (Figure 1b). The monophyly of Sturnidae sensu lato was also confirmed (100% in ML and MP, and 1.00 in BI). The family Buphagidae formed a sister-group with (Sturnidae + Mimidae). Notably, the clade of two species of Spodiopsar (S. cineraceus and S. sericeus) was only weakly supported (55% in ML, 60% in MP, and 0.94 in BI).
Secondly, to obtain more densely sampled phylogenies of Sturnidae sensu lato, a combined dataset (five mitochondrial genes and eight nuclear genes) was generated; this represented 83% of the known species and almost all currently recognized constituent genera. As shown in Figure 8, the trees that resulted from the three methods exhibited similar topologies. For deeper-node level, the Sturnidae family could be further classified into six major subclades: (1) Phillipine Rhabdornis, (2) South Asian/Pacific Starlings, (3) Eurasian Starlings, (4) Red-winged Starlings, (5) African Starlings, and (6) Amethyst and Madagascar Starlings (Figure 8). It was proven that all the former five had monophyly, with strong support; the only exception was African Starlings, which had moderate support (84% in MP, 1.00 in BI, and <50 in ML). Furthermore, the monophyly of Amethyst and Madagascar Starlings was not found in either analysis ((BSML) = 55, (BSMP) = 73, (PP) = 0.96).
Within the African Starlings subclade, the monophyly of Lamprotornis, Poeoptera, and Onychognathus was strongly supported by the ML and BI methods (Figure 8). Furthermore, Pholia sharpii is currently the only species of the monotypic genus Pholia in both Clements Checklist v. 2019 [4] and Birds of the World v. 1.0 [59]. However, it was embedded within the genus Poeoptera, forming a well-supported clade.
Furthermore, the results showed that the subclade Eurasian Starlings comprised six polytypic genera (Acridotheres, Agropsar, Gracupica, Spoliopsar, Sturnia, and Sturnus) and five monotypic genera (Creatophora, Fregilupus, Leucopsar, Pastor, and Sturnornis). The monophyly of the six polytypic genera was well supported by all estimators (≥98, ≥80, and 1.00 in ML, MP, and BI, respectively). In addition, A. tristis and A. ginginiianus are recognized as a sister group to the remaining taxa of Acridotheres.
The South Asian/Pacific Starlings subclade consisted of 10 genera, five of which were monotypic (Ampeliceps, Sarcops, Goodfellowia, Enodes, and Scissirosrum). According to the IOC World Bird List v. 11.1 [60], Apo Myna (G. miranda), which is endemic to the Philippines, belongs to the genus Basilornis, namely, B. mirandus. Nevertheless, B. mirandus and B. celebensis did not form a monophyletic group. On the contrary, the monophyly of G. miranda and (S. albicollis + S. calvus) was strongly supported (Figure 8).
For the family Mimidae, all 34 recognized species were included in the present analyses. In our trees, this family could be divided into two well-supported monophyletic subclades: one comprising Mockingbirds and continental Thrashers and the other containing Catbirds and Caribbean Thrashers. In the former subclade, the clade of M. graysoni, M. gilvus and M. polyglottos was recovered with strong support ((BSML) = 100, (BSMP) = 99, (PP) = 1.00). Furthermore, the latter subclade comprised five monotypic genera (Allenia, Dumatella, Margarops, Melanoptila, and Ramphocinclus) and two bitypic genera (Cinclocerthia and Melanotis). However, the relationships among Dumetella, Melanoptila, and Ramphocinclus were not recovered in any of our trees.

4. Discussion

The present study reported five mitogenomes of Sturnidae sensu lato and two low-coverage nuclear genomes of Spodiopsar (Sturnidae) species for the first time. Then, multidimensional analyses were performed by combining all the available mitogenomic data of Sturnidae sensu lato, including general mitogenomic characteristics, codon usage and aversion patterns, RNA structures, substitution rates, and phylogenetic tree constructions.
Codon usage bias (CUB), a gene- and taxon-specific phenomenon, has long been considered essential in understanding the evolution of both genes and taxa [23,61,62]. The ENC is often used as a measure of the bias caused by equal codon usage in a gene [63]. Generally, the range of ENC values is 20 to 61, signifying extreme codon usage bias to no bias at all [64]. It is worth mentioning that genes with ENC ≤ 35 are considered strongly biased [65,66]. Here, we showed that the mt genes of the ten investigated Sturnidae sensu lato taxa have no strong codon usage bias. This finding is actually similar to the result of a previous study focusing on the mitogenomes of Odonata [67], but is different from the results of a study on Lepidoptera species that presented obvious bias (ENC ranged from 27.7 to 33.8) [68]. Unfortunately, there is currently very little information regarding this issue available. Thus, further large-scale investigations of the mitogenomic ENC in birds and other animals are needed. In recent years, analyzing the ENC versus GC3s plot analysis has proven to be a highly efficient tool for verifying the main driving factor of CUB (natural selection or mutational bias) [63,64,65,66,69]. If mutational bias is the single factor, the analyzed points will lie on or just below the ENC curve. Alternatively, if natural selection is the single factor, the points will fall below the expected curve [63,64,65,66,69]. For Sturnidae sensu lato mitogenomes, natural selection was presumed to be the main cause of their CUB patterns. Notably, such conclusions have also been reported in the mitogenomes of other animals, e.g., odonates [67] and ladybirds [65]. As we know, codon usage may vary significantly between genomes, even between genes within the same genome. Thus, to explore the impact of codon usage patterns on avian mitogenomes, more complicated analyses are required.
One novel phylogenetic characteristic and potential molecular marker, the codon aversion motif (CAM), was recently proposed by Miller et al. [70]. Then, these strong evolutionary implications were further proven across the tree of life [71]. More importantly, our previous work on the codon aversion of plastomic genes in various taxa subsequently discovered abundant taxon-unique molecular markers, including Aeonium [72], Monanthes [72], and Crassula [73] (Crassulaceae), as well as Bletilla [74] (Orchidaceae). In this work, we first focused on the mt PCGs of Sturnidae sensu lato. Remarkably, according to our results, the interspecific disparities in avian mt genes were even much stronger than in plant cp (chloroplast) genes. Most surprisingly, for all examined 11 mt PCGs, the ten species investigated possessed completely different CAMs. All of these identified CAMs have the potential to serve as unique markers for corresponding Sturnidae sensu lato species. Meanwhile, this observation might indicate the potential use of mt-gene CAM in the molecular species identification and evolutionary demonstration.
As is well known to us, mitochondria have their own set of mtDNA that is distinct from nDNA. Moreover, they embody the mt-rRNAs and mt-tRNAs necessary for synthesizing essential proteins [75]. As previously noted, the structural features of tRNA provide important insights into their biological function [76]. The present research presumed that all the mt-tRNAs fold as typical cloverleaf secondary structures, with the exception of known MT-TS2 (trnS-AGY), which lacks the stem of the dihydrouridine (DHU) arm. As documented, this unusual D-arm-lacking tRNA exists in almost all metazoan mitochondria, and has been experimentally verified to be functional in translation [77,78,79,80,81,82,83], despite having a much lower translational ability compared with MT-TS1 (trnS-UCN) [77,78]. Furthermore, we also detected unpaired nucleotides in the TΨC stem of MT-TF. It is noteworthy that, for Aves, a total of five matching patterns in the TΨC stem of MT-TF had been discovered by previous studies [84,85,86]. These patterns were presumed to possess evolutionary significance [86]. Most importantly, differing from the C-insertion pattern (form b that displayed in Figure 4 of the study by Ma et al. [86]) of many Passerine birds, the MT-TF examined in our study featured an AC-C mismatch. We presume that this novel matching pattern might be a derivative of the C-C mismatching pattern (form e displayed in Figure 4 of the study by Ma et al. [86]). Collectively, these discussed findings suggest that the matching patterns of MT-TF might be a potential taxonomic marker for birds.
Numerous efforts have hitherto been dedicated to interpreting the relationships within Sturnidae sensu lato [2,3,9,10]. Nevertheless, a complete picture of its phylogeny remains lacking, and a denser sampling strategy and multidimensional datasets are required. In this study, the topologies of the trees obtained using the three methods were identical, except for the positions of only two species (Lamprotornis iris and Aplonis grandis), which were both weakly supported. Indeed, such high similarity seems to be reasonable. The assessment of Torres et al. [87] indicated that the incongruences between the trees created using different methods might more frequently occur in higher-level phylogenies (e.g., phylum/kingdom).
A clear and stable backbone of Sturnidae sensu lato was disentangled by our mt-nuclear combined phylogeny; namely, it was found that Buphagidae is a sister to (Sturnidae + Mimidae). This result is congruent with the conclusions of Lovette and Rubenstein [2]. More importantly, the previously undetermined relationships among four subclades (African Starlings, Red-winged Starlings, Amethyst and Madagascar Starlings, and Eurasian Starlings) were established [2]. Here, our Bayesian tree illustrated a closer relationship between African and Red-winged Starlings ((PP) = 1.00), which together formed a sister group with the Amethyst and Madagascar Starlings subclade ((PP) = 0.91). The Eurasian Starlings subclade was a sister to these three subclades.
Our phylogenetic inference also advanced our understanding of some deep-node affinities compared with previous work. For instance, within the African Starlings subclade, three species (Lamprotornis albicapillus, L. bicolor, and L. fischeri) that were previously treated as members of the genus Spreo [2,3] were found to be nested within the remaining Lamprotornis birds in our trees. Moreover, we gained insights regarding the Eurasian Starlings subclade. Differing from the mitochondrial tree produced by Zuccon et al. [10], our results clearly demonstrated that Acridotheres javanicus is a sister to A. fuscus, not to A. cinereus.
Beyond the progress that has been made, a few topological uncertainties persist. For instance, the phylogenetic relationships within the Catbirds and Caribbean Thrashers subclade remain controversial. For example, three previous studies suggested a sister relationship between Dumetella and Ramphocinclus [2,8,88]. In addition, the sister relationship between the genus Dumetella and the genus Melanoptila was strongly supported by a recent report based on nuclear genomic data [7]. Unfortunately, neither of the two sister relationships were found in any of our trees. To resolve this uncertainty, more data from this clade are needed in the future.

5. Conclusions

This study provides comprehensive insights into the mitogenomic diversities and evolutionary relationships among Sturnidae sensu lato. Based on our five newly reported mitogenomes and all currently publicly available data, we conducted comparative analyses and phylogenetic inferences. The general organization and gene content of the examined mitogenomes were clarified. Additionally, we depicted the overall CUB patterns of the mt PCGs, including the A/T-ending codon preference (via RSCU analyses), the major AC bias for the third positions of four-fold degenerate codons (using PR2 plots), and the pervasiveness of natural selection over mutational bias (using ENC-GC3s plots). These insights might enlighten us regarding the evolution of Sturnidae sensu lato to a degree. The key finding of this study was drawn from CAM analyses. The unique motifs found in each species provide new opportunities for the molecular species identification of avian. For structural analyses, except for MT-TS2, all tRNAs were presumed to possess classic cloverleaf structures. MT-RNR1 and MT-RNR2 consisted of three domains with 49 helices and six domains with 71 helices, respectively. The CRs in all investigated species consisted of three conserved domains. Furthermore, our phylogenetic reconstructions not only supported the monophyly of Sturnidae, Mimidae, and Buphagidae, but also revealed nine subclades among Sturnidae and its related taxa, with high support values. In summary, the conclusions presented here will enhance our understanding of the evolutionary relationships within Sturnidae sensu lato.

Supplementary Materials

The following supporting information can be downloaded at: https://www.mdpi.com/article/10.3390/ani14192777/s1, Table S1: Primers used in amplifying the mitogenome of Acridotheres cristatellus; Table S2: Primers used in amplifying the mitogenome of Acridotheres tristis; Table S3: Primers used in amplifying the mitogenomes of Gracupica nigricollis; Table S4: Primers used in amplifying the mitogenome of Spodiopsar cineraceus; Table S5: Sampling and GenBank accession numbers for multigene analysis; Table S6: Species of mitogenomes examined in this study; Table S7: The ENC and GC3s of PCGs examined in this study; Table S8: The best Bayesian evolutionary models of combined dataset; Table S9: Determination of substitution saturation of PCGs for combined dataset.

Author Contributions

Conceptualization, X.K.; methodology, S.H. and H.D.; software, S.Z., S.H. and J.Y.; validation, J.G.; formal analysis, S.H. and H.D.; investigation, H.P. and C.D.; resources, H.D.; data curation, S.H.; writing—original draft preparation, S.H. and H.D.; writing—review and editing, X.K.; supervision, X.K.; project administration, H.P. and X.K.; funding acquisition, H.P. and X.K. All authors have read and agreed to the published version of the manuscript.

Funding

This research was funded by the Opening Foundation of Anhui Provincial Key Laboratory of the Conservation and Exploitation of Biological Resources (grant no. swzy202002), as well as the Wuhu “Huatuo” Plan (Youth Project Special for Hui Peng).

Institutional Review Board Statement

Not applicable.

Informed Consent Statement

Not applicable.

Data Availability Statement

The sequence data generated in this study are available in GenBank of the National Center for Biotechnology Information (NCBI) under the access numbers NC_014455, NC_015195, NC_015237, NC_0s15613, and NC_020423.

Conflicts of Interest

The authors declare no conflicts of interest.

References

  1. Cibois, A.; Cracraft, J. Assessing the passerine “Tapestry”: Phylogenetic relationships of the Muscicapoidea inferred from nuclear DNA sequences. Mol. Phylogenet. Evol. 2004, 32, 264–273. [Google Scholar] [CrossRef] [PubMed]
  2. Lovette, I.J.; Rubenstein, D.R. A comprehensive molecular phylogeny of the starlings (Aves: Sturnidae) and mockingbirds (Aves: Mimidae): Congruent mtDNA and nuclear trees for a cosmopolitan avian radiation. Mol. Phylogenet. Evol. 2007, 44, 1031–1056. [Google Scholar] [CrossRef] [PubMed]
  3. Zuccon, D.; Cibois, A.; Pasquet, E.; Ericson, P.G. Nuclear and mitochondrial sequence data reveal the major lineages of starlings, mynas and related taxa. Mol. Phylogenet. Evol. 2006, 41, 333–344. [Google Scholar] [CrossRef] [PubMed]
  4. Clements, J.F.; Schulenberg, T.S.; Iliff, M.J.; Billerman, S.M.; Fredericks, T.A.; Sullivan, B.L.; Wood, C.L. The eBird/Clements Checklist of Birds of the World: V2019. 2019. Available online: https://www.birds.cornell.edu/clementschecklist/download/ (accessed on 25 June 2021).
  5. Mengesha, Y.A. A study of oxpecker-mammal symbiosis in Ethiopia. East Afr. Agric. For. J. 1978, 43, 321–326. [Google Scholar] [CrossRef]
  6. Jubber, W.R. Interspecific competition between Oxpecker Buphagus species. Biodivers. Observ. 2014, 5, 325–335. [Google Scholar]
  7. DaCosta, J.M.; Miller, M.J.; Mortensen, J.L.; Reed, J.M.; Curry, R.L.; Sorenson, M.D. Phylogenomics clarifies biogeographic and evolutionary history, and conservation status of West Indian tremblers and thrashers (Aves: Mimidae). Mol. Phylogenet. Evol. 2019, 136, 196–205. [Google Scholar] [CrossRef]
  8. Lovette, I.J.; Arbogast, B.S.; Curry, R.L.; Zink, R.M.; Botero, C.A.; Sullivan, J.P.; Talaba, A.L.; Harris, R.B.; Rubenstein, D.R.; Ricklefs, R.E. Phylogenetic relationships of the mockingbirds and thrashers (Aves: Mimidae). Mol. Phylogenet. Evol. 2012, 63, 219–229. [Google Scholar] [CrossRef]
  9. Lovette, I.J.; McCleery, B.V.; Talaba, A.L.; Rubenstein, D.R. A complete species-level molecular phylogeny for the “Eurasian” starlings (Sturnidae: Sturnus, Acridotheres, and allies): Recent diversification in a highly social and dispersive avian group. Mol. Phylogenet. Evol. 2008, 47, 251–260. [Google Scholar] [CrossRef]
  10. Zuccon, D.; Pasquet, E.; Ericson, P.G. Phylogenetic relationships among Palearctic–Oriental starlings and mynas (genera Sturnus and Acridotheres: Sturnidae). Zool. Scr. 2008, 37, 469–481. [Google Scholar] [CrossRef]
  11. Bock, F.J.; Tait, S.W. Mitochondria as multifaceted regulators of cell death. Nat. Rev. Mol. Cell Biol. 2020, 21, 85–100. [Google Scholar] [CrossRef]
  12. Green, D.R. Apoptotic pathways: The roads to ruin. Cell 1998, 94, 695–698. [Google Scholar] [CrossRef] [PubMed]
  13. Santulli, G.; Xie, W.; Reiken, S.R.; Marks, A.R. Mitochondrial calcium overload is a key determinant in heart failure. Proc. Natl. Acad. Sci. USA 2015, 112, 11389–11394. [Google Scholar] [CrossRef] [PubMed]
  14. Tiku, V.; Tan, M.-W.; Dikic, I. Mitochondrial functions in infection and immunity. Trends Cell Biol. 2020, 30, 263–275. [Google Scholar] [CrossRef] [PubMed]
  15. Yahalomi, D.; Atkinson, S.D.; Neuhof, M.; Chang, E.S.; Philippe, H.; Cartwright, P.; Bartholomew, J.L.; Huchon, D. A cnidarian parasite of salmon (Myxozoa: Henneguya) lacks a mitochondrial genome. Proc. Natl. Acad. Sci. USA 2020, 117, 5358–5363. [Google Scholar] [CrossRef]
  16. Desjardins, P.; Morais, R. Sequence and gene organization of the chicken mitochondrial genome: A novel gene order in higher vertebrates. J. Mol. Biol. 1990, 212, 599–634. [Google Scholar] [CrossRef] [PubMed]
  17. Ren, Q.; Yuan, J.; Ren, L.; Zhang, L.; Zhang, L.; Jiang, L.; Chen, D.; Kan, X.; Zhang, B. The complete mitochondrial genome of the yellow-browed bunting, Emberiza chrysophrys (Passeriformes: Emberizidae), and phylogenetic relationships within the genus Emberiza. J. Genet. 2014, 93, 699–707. [Google Scholar] [CrossRef]
  18. Dai, L.; Zhou, X.; Kausar, S.; Abbas, M.N.; Wu, L.; Zhou, H. Mitochondrial genome of Diaphania indica (saunders) (Lepidoptera: Pyraloidea) and implications for its phylogeny. Int. J. Biol. Macromol. 2018, 108, 981–989. [Google Scholar] [CrossRef]
  19. Sriboonlert, A.; Wonnapinij, P. Comparative mitochondrial genome analysis of the firefly, Inflata indica (Coleoptera: Lampyridae) and the first evidence of heteroplasmy in fireflies. Int. J. Biol. Macromol. 2019, 121, 671–676. [Google Scholar] [CrossRef]
  20. Yuan, X.; Cao, M.; Li, P.; Cheng, S.; Liu, X.; Du, Y.; Zhang, Z.; Shen, G.; Zhang, P. The mitochondrial genome of Arthrinium arundinis and its phylogenetic position within Sordariomycetes. Int. J. Biol. Macromol. 2019, 121, 956–963. [Google Scholar] [CrossRef]
  21. Su, T.; Liang, A. Comparative analysis of seven mitochondrial genomes of Phymatostetha (Hemiptera: Cercopidae) and phylogenetic implications. Int. J. Biol. Macromol. 2019, 125, 1112–1117. [Google Scholar] [CrossRef]
  22. Curole, J.P.; Kocher, T.D. Mitogenomics: Digging deeper with complete mitochondrial genomes. Trends Ecol. Evol. 1999, 14, 394–398. [Google Scholar] [CrossRef] [PubMed]
  23. Ding, H.; Bi, D.; Han, S.; Yi, R.; Zhang, S.; Ye, Y.; Gao, J.; Yang, J.; Kan, X. Mitogenomic Codon Usage Patterns of Superfamily Certhioidea (Aves, Passeriformes): Insights into Asymmetrical Bias and Phylogenetic Implications. Animals 2022, 13, 96. [Google Scholar] [CrossRef] [PubMed]
  24. Barker, F.K. Mitogenomic data resolve basal relationships among passeriform and passeridan birds. Mol. Phylogenet. Evol. 2014, 79, 313–324. [Google Scholar] [CrossRef] [PubMed]
  25. Bi, D.; Ding, H.; Wang, Q.; Jiang, L.; Lu, W.; Wu, X.; Zhu, R.; Zeng, J.; Zhou, S.; Yang, X. Two new mitogenomes of Picidae (Aves, Piciformes): Sequence, structure and phylogenetic analyses. Int. J. Biol. Macromol. 2019, 133, 683–692. [Google Scholar] [CrossRef] [PubMed]
  26. Gibb, G.C.; Kardailsky, O.; Kimball, R.T.; Braun, E.L.; Penny, D. Mitochondrial genomes and avian phylogeny: Complex characters and resolvability without explosive radiations. Mol. Biol. Evol. 2007, 24, 269–280. [Google Scholar] [CrossRef]
  27. Huang, Z.; Tu, F.; Tang, S. Two new mitogenomes of Pellorneidae (Aves: Passeriformes) and a phylogeny of the superfamily Sylvioidea. Aust. J. Zool. 2019, 66, 167–173. [Google Scholar] [CrossRef]
  28. Jiang, L.; Chen, J.; Wang, P.; Ren, Q.; Yuan, J.; Qian, C.; Hua, X.; Guo, Z.; Zhang, L.; Yang, J. The mitochondrial genomes of Aquila fasciata and Buteo lagopus (Aves, Accipitriformes): Sequence, structure and phylogenetic analyses. PLoS ONE 2015, 10, e0136297. [Google Scholar] [CrossRef]
  29. Kan, X.Z.; Li, X.F.; Zhang, L.Q.; Chen, L.; Qian, C.J.; Zhang, X.W.; Wang, L. Characterization of the complete mitochondrial genome of the Rock pigeon, Columba livia (Columbiformes: Columbidae). Genet. Mol. Res. 2010, 9, 1234–1249. [Google Scholar] [CrossRef]
  30. Kan, X.Z.; Yang, J.K.; Li, X.F.; Chen, L.; Lei, Z.P.; Wang, M.; Qian, C.J.; Gao, H.; Yang, Z.Y. Phylogeny of major lineages of galliform birds (Aves: Galliformes) based on complete mitochondrial genomes. Genet. Mol. Res. 2010, 9, 1625–1633. [Google Scholar] [CrossRef]
  31. Mackiewicz, P.; Urantówka, A.D.; Kroczak, A.; Mackiewicz, D. Resolving phylogenetic relationships within Passeriformes based on mitochondrial genes and inferring the evolution of their mitogenomes in terms of duplications. Genome Biol. Evol. 2019, 11, 2824–2849. [Google Scholar] [CrossRef]
  32. Marshall, H.D.; Baker, A.J.; Grant, A.R. Complete mitochondrial genomes from four subspecies of common chaffinch (Fringilla coelebs): New inferences about mitochondrial rate heterogeneity, neutral theory, and phylogenetic relationships within the order Passeriformes. Gene 2013, 517, 37–45. [Google Scholar] [CrossRef] [PubMed]
  33. Song, X.; Huang, J.; Yan, C.; Xu, G.; Zhang, X.; Yue, B. The complete mitochondrial genome of Accipiter virgatus and evolutionary history of the pseudo-control regions in Falconiformes. Biochem. Syst. Ecol. 2015, 58, 75–84. [Google Scholar] [CrossRef]
  34. Sun, C.-H.; Liu, H.-Y.; Lu, C.-H. Five new mitogenomes of Phylloscopus (Passeriformes, Phylloscopidae): Sequence, structure, and phylogenetic analyses. Int. J. Biol. Macromol. 2020, 146, 638–647. [Google Scholar] [CrossRef] [PubMed]
  35. Sun, Z.; Pan, T.; Hu, C.; Sun, L.; Ding, H.; Wang, H.; Zhang, C.; Jin, H.; Chang, Q.; Kan, X. Rapid and recent diversification patterns in Anseriformes birds: Inferred from molecular phylogeny and diversification analyses. PLoS ONE 2017, 12, e0184529. [Google Scholar] [CrossRef]
  36. Zhang, L.; Wang, L.; Gowda, V.; Wang, M.; Li, X.; Kan, X. The mitochondrial genome of the Cinnamon Bittern, Ixobrychus cinnamomeus (Pelecaniformes: Ardeidae): Sequence, structure and phylogenetic analysis. Mol. Biol. Rep. 2012, 39, 8315–8326. [Google Scholar] [CrossRef]
  37. Zhou, X.; Lin, Q.; Fang, W.; Chen, X. The complete mitochondrial genomes of sixteen ardeid birds revealing the evolutionary process of the gene rearrangements. BMC Genom. 2014, 15, 573. [Google Scholar] [CrossRef]
  38. Sambrook, J.; Russell, D.W. Molecular Cloning: A Laboratory Manual, 3rd ed.; Cold Spring Harbor Laboratory Press: New York, NY, USA, 2001. [Google Scholar]
  39. Jin, J.-J.; Yu, W.-B.; Yang, J.-B.; Song, Y.; de Pamphilis, C.W.; Yi, T.-S.; Li, D.-Z. GetOrganelle: A fast and versatile toolkit for accurate de novo assembly of organelle genomes. Genome Biol. 2020, 21, 241. [Google Scholar] [CrossRef]
  40. Bankevich, A.; Nurk, S.; Antipov, D.; Gurevich, A.A.; Dvorkin, M.; Kulikov, A.S.; Lesin, V.M.; Nikolenko, S.I.; Pham, S.; Prjibelski, A.D. SPAdes: A new genome assembly algorithm and its applications to single-cell sequencing. J. Comput. Biol. 2012, 19, 455–477. [Google Scholar] [CrossRef]
  41. Wick, R.R.; Schultz, M.B.; Zobel, J.; Holt, K.E. Bandage: Interactive visualization of de novo genome assemblies. Bioinformatics 2015, 31, 3350–3352. [Google Scholar] [CrossRef]
  42. Tillich, M.; Lehwark, P.; Pellizzer, T.; Ulbricht-Jones, E.S.; Fischer, A.; Bock, R.; Greiner, S. GeSeq–versatile and accurate annotation of organelle genomes. Nucleic Acids Res. 2017, 45, W6–W11. [Google Scholar] [CrossRef]
  43. Braschi, B.; Denny, P.; Gray, K.; Jones, T.; Seal, R.; Tweedie, S.; Yates, B.; Bruford, E. Genenames. org: The HGNC and VGNC resources in 2019. Nucleic Acids Res. 2018, 47, D786–D792. [Google Scholar] [CrossRef] [PubMed]
  44. Grant, J.R.; Arantes, A.S.; Stothard, P. Comparing thousands of circular genomes using the CGView Comparison Tool. BMC Genomics 2012, 13, 202. [Google Scholar] [CrossRef] [PubMed]
  45. Kumar, S.; Stecher, G.; Li, M.; Knyaz, C.; Tamura, K. MEGA X: Molecular Evolutionary Genetics Analysis across Computing Platforms. Mol. Biol. Evol. 2018, 35, 1547–1549. [Google Scholar] [CrossRef] [PubMed]
  46. Rozas, J.; Ferrer-Mata, A.; Sánchez-DelBarrio, J.C.; Guirao-Rico, S.; Librado, P.; Ramos-Onsins, S.E.; Sánchez-Gracia, A. DnaSP 6: DNA sequence polymorphism analysis of large data sets. Mol. Biol. Evol. 2017, 34, 3299–3302. [Google Scholar] [CrossRef] [PubMed]
  47. Peden, J.F. Analysis of Codon Usage; Citeseer: Princeton, NJ, USA, 2000. [Google Scholar]
  48. Lowe, T.M.; Chan, P.P. tRNAscan-SE On-line: Integrating search and context for analysis of transfer RNA genes. Nucleic Acids Res. 2016, 44, W54–W57. [Google Scholar] [CrossRef]
  49. Li, X.; Huang, Y.; Lei, F. Comparative mitochondrial genomics and phylogenetic relationships of the Crossoptilon species (Phasianidae, Galliformes). BMC Genom. 2015, 16, 42. [Google Scholar] [CrossRef]
  50. Cannone, J.J.; Subramanian, S.; Schnare, M.N.; Collett, J.R.; D’Souza, L.M.; Du, Y.; Feng, B.; Lin, N.; Madabusi, L.V.; Müller, K.M. The comparative RNA web (CRW) site: An online database of comparative sequence and structure information for ribosomal, intron, and other RNAs. BMC Bioinform. 2002, 3, 2. [Google Scholar] [CrossRef]
  51. Stamatakis, A. RAxML version 8: A tool for phylogenetic analysis and post-analysis of large phylogenies. Bioinformatics 2014, 30, 1312–1313. [Google Scholar] [CrossRef]
  52. Swofford, D.L. Phylogenetic Analysis Using Parsimony (* and other Methods); Sinauer Associate: Sunderland, MA, USA, 2002. [Google Scholar]
  53. Darriba, D.; Posada, D.; Kozlov, A.M.; Stamatakis, A.; Morel, B.; Flouri, T. ModelTest-NG: A new and scalable tool for the selection of DNA and protein evolutionary models. Mol. Biol. Evol. 2020, 37, 291–294. [Google Scholar] [CrossRef]
  54. Ronquist, F.; Teslenko, M.; van der Mark, P.; Ayres, D.L.; Darling, A.; Höhna, S.; Larget, B.; Liu, L.; Suchard, M.A.; Huelsenbeck, J.P. MrBayes 3.2: Efficient Bayesian phylogenetic inference and model choice across a large model space. Syst. Biol. 2012, 61, 539–542. [Google Scholar] [CrossRef]
  55. Sangster, G.; Luksenburg, J.A. Sharp increase of problematic mitogenomes of birds: Causes, consequences, and remedies. Genome Biol. Evol. 2021, 13, evab210. [Google Scholar] [CrossRef] [PubMed]
  56. Feng, S.; Stiller, J.; Deng, Y.; Armstrong, J.; Fang, Q.; Reeve, A.H.; Xie, D.; Chen, G.; Guo, C.; Faircloth, B.C. Dense sampling of bird diversity increases power of comparative genomics. Nature 2020, 587, 252–257. [Google Scholar] [CrossRef] [PubMed]
  57. Qian, C.; Ren, Q.; Kan, X.; Guo, Z.; Yang, J.; Li, X.; Yuan, J.; Qian, M.; Hu, Q.; Zhang, L. Complete mitochondrial genome of the Red-billed Starling, Sturnus sericeus (Aves: Passeriformes): The first representative of the family Sturnidae with a single control region. Mitochondrial DNA 2013, 24, 129–131. [Google Scholar] [CrossRef] [PubMed]
  58. Rollins, L.A.; Woolnough, A.P.; Fanson, B.G.; Cummins, M.L.; Crowley, T.M.; Wilton, A.N.; Sinclair, R.; Butler, A.; Sherwin, W.B. Selection on mitochondrial variants occurs between and within individuals in an expanding invasion. Mol. Biol. Evol. 2016, 33, 995–1007. [Google Scholar] [CrossRef] [PubMed]
  59. Craig, A.J.F.; Feare, C.J. Sharpe’s Starling (Pholia sharpii), version 1.0. In Birds of the World; del Hoyo, J., Elliott, A., Sargatal, J., Christie, D.A., de Juana, E., Eds.; Cornell Lab of Ornithology: Ithaca, NY, USA, 2020. [Google Scholar] [CrossRef]
  60. Gill, F.; Donsker, D.; Rasmussen, P. IOC World Bird List (v11.1). 2021. Available online: https://www.worldbirdnames.org/new/ (accessed on 26 June 2021).
  61. Yang, J.; Ding, H.; Kan, X. Codon usage patterns and evolution of HSP60 in birds. Int. J. Biol. Macromol. 2021, 183, 1002–1012. [Google Scholar] [CrossRef]
  62. Iriarte, A.; Lamolle, G.; Musto, H. Codon Usage Bias: An Endless Tale. J. Mol. Evol. 2021, 89, 589–593. [Google Scholar] [CrossRef]
  63. Wright, F. The ‘effective number of codons’ used in a gene. Gene 1990, 87, 23–29. [Google Scholar] [CrossRef]
  64. Ismail, S.N.F.B.; Baharum, S.N.; Fazry, S.; Low, C.F. Comparative genome analysis reveals a distinct influence of nucleotide composition on virus–host species-specific interaction of prawn-infecting nodavirus. J. Fish Dis. 2019, 42, 1761–1772. [Google Scholar] [CrossRef]
  65. Yuan, M.L.; Zhang, L.J.; Zhang, Q.L.; Zhang, L.; Li, M.; Wang, X.T.; Feng, R.Q.; Tang, P.A. Mitogenome evolution in ladybirds: Potential association with dietary adaptation. Ecol. Evol. 2020, 10, 1042–1053. [Google Scholar] [CrossRef]
  66. Chen, Z.; Zhao, J.; Qiao, J.; Li, W.; Li, J.; Xu, R.; Wang, H.; Liu, Z.; Xing, B.; Wendel, J.F. Comparative analysis of codon usage between Gossypium hirsutum and G. barbadense mitochondrial genomes. Mitochondrial DNA B 2020, 5, 2500–2506. [Google Scholar] [CrossRef]
  67. Guan, D.-L.; Qian, Z.-Q.; Ma, L.-B.; Bai, Y.; Xu, S.-Q. Different mitogenomic codon usage patterns between damselflies and dragonflies and nine complete mitogenomes for odonates. Sci. Rep. 2019, 9, 678. [Google Scholar] [CrossRef] [PubMed]
  68. Wei, L.; He, J.; Jia, X.; Qi, Q.; Liang, Z.; Zheng, H.; Ping, Y.; Liu, S.; Sun, J. Analysis of codon usage bias of mitochondrial genome in Bombyx moriand its relation to evolution. BMC Evol. Biol. 2014, 14, 262. [Google Scholar] [CrossRef] [PubMed]
  69. Forcelloni, S.; Giansanti, A. Evolutionary Forces and Codon Bias in Different Flavors of Intrinsic Disorder in the Human Proteome. J. Mol. Evol. 2020, 88, 164–178. [Google Scholar] [CrossRef] [PubMed]
  70. Miller, J.B.; Hippen, A.A.; Belyeu, J.R.; Whiting, M.F.; Ridge, P.G. Missing something? Codon aversion as a new character system in phylogenetics. Cladistics 2017, 33, 545–556. [Google Scholar] [CrossRef] [PubMed]
  71. Miller, J.B.; McKinnon, L.M.; Whiting, M.F.; Ridge, P.G. Codon use and aversion is largely phylogenetically conserved across the tree of life. Mol. Phylogenet. Evol. 2020, 144, 106697. [Google Scholar] [CrossRef] [PubMed]
  72. Han, S.; Bi, D.; Yi, R.; Ding, H.; Wu, L.; Kan, X. Plastome evolution of Aeonium and Monanthes (Crassulaceae): Insights into the variation of plastomic tRNAs, and the patterns of codon usage and aversion. Planta 2022, 256, 35. [Google Scholar] [CrossRef] [PubMed]
  73. Ding, H.; Han, S.; Ye, Y.; Bi, D.; Zhang, S.; Yi, R.; Gao, J.; Yang, J.; Wu, L.; Kan, X. Ten Plastomes of Crassula (Crassulaceae) and Phylogenetic Implications. Biology 2022, 11, 1779. [Google Scholar] [CrossRef] [PubMed]
  74. Han, S.; Wang, R.; Hong, X.; Wu, C.; Zhang, S.; Kan, X. Plastomes of Bletilla (Orchidaceae) and Phylogenetic Implications. Int. J. Mol. Sci. 2022, 23, 10151. [Google Scholar] [CrossRef]
  75. Yarham, J.W.; Elson, J.L.; Blakely, E.L.; McFarland, R.; Taylor, R.W. Mitochondrial tRNA mutations and disease. Wiley Interdiscip. Rev. RNA 2010, 1, 304–324. [Google Scholar] [CrossRef]
  76. Kim, S.; Sussman, J.; Suddath, F.; Quigley, G.; McPherson, A.; Wang, A.; Seeman, N.; Rich, A. The general structure of transfer RNA molecules. Proc. Natl. Acad. Sci. USA 1974, 71, 4970–4974. [Google Scholar] [CrossRef]
  77. Hanada, T.; Suzuki, T.; Watanabe, K. Translation activity of mitochondrial tRNA with unusual secondary structure. In Nucleic Acids Symposium Series; Oxford University Press: Oxford, UK, 2000; pp. 249–250. [Google Scholar]
  78. Hanada, T.; Suzuki, T.; Yokogawa, T.; Takemoto-Hori, C.; Sprinzl, M.; Watanabe, K. Translation ability of mitochondrial tRNAsSer with unusual secondary structures in an in vitro translation system of bovine mitochondria. Genes Cells 2001, 6, 1019–1030. [Google Scholar] [CrossRef] [PubMed]
  79. Suematsu, T.; Sato, A.; Sakurai, M.; Watanabe, K.; Ohtsuki, T. A unique tRNA recognition mechanism of Caenorhabditis elegans mitochondrial EF-Tu2. Nucleic Acids Res. 2005, 33, 4683–4691. [Google Scholar] [CrossRef]
  80. Ohtsuki, T.; Kawai, G.; Watanabe, K. The minimal tRNA: Unique structure of Ascaris suum mitochondrial tRNASerUCU having a short T arm and lacking the entire D arm. FEBS Lett. 2002, 514, 37–43. [Google Scholar] [CrossRef]
  81. Frazer-Abel, A.A.; Hagerman, P.J. Variation of the acceptor–anticodon interstem angles among mitochondrial and non-mitochondrial tRNAs. J. Mol. Biol. 2004, 343, 313–325. [Google Scholar] [CrossRef] [PubMed]
  82. Jühling, F.; Pütz, J.; Bernt, M.; Donath, A.; Middendorf, M.; Florentz, C.; Stadler, P.F. Improved systematic tRNA gene annotation allows new insights into the evolution of mitochondrial tRNA structures and into the mechanisms of mitochondrial genome rearrangements. Nucleic Acids Res. 2012, 40, 2833–2845. [Google Scholar] [CrossRef] [PubMed]
  83. Watanabe, Y.-i.; Suematsu, T.; Ohtsuki, T. Losing the stem-loop structure from metazoan mitochondrial tRNAs and co-evolution of interacting factors. Front. Genet. 2014, 5, 109. [Google Scholar] [CrossRef] [PubMed]
  84. Yang, C.; Wang, Q.-X.; Huang, Y.; Xiao, H. Analysis of the complete mitochondrial genome sequence of Larus brunnicephalus (Aves, Laridae). Yi Chuan = Hereditas 2012, 34, 1434–1446. [Google Scholar] [CrossRef]
  85. Harrison, G.L.; McLenachan, P.A.; Phillips, M.J.; Slack, K.E.; Cooper, A.; Penny, D. Four new avian mitochondrial genomes help get to basic evolutionary questions in the late cretaceous. Mol. Biol. Evol. 2004, 21, 974–983. [Google Scholar] [CrossRef] [PubMed]
  86. Ma, Y.G.; Huang, Y.; Lei, F.M. Sequencing and phylogenetic analysis of the Pyrgilauda ruficollis (Aves, Passeridae) complete mitochondrial genome. Dongwuxue Yanjiu 2014, 35, 81–91. [Google Scholar]
  87. Torres, A.; Goloboff, P.A.; Catalano, S.A. Assessing topological congruence among concatenation-based phylogenomic approaches in empirical datasets. Mol. Phylogenet. Evol. 2021, 161, 107086. [Google Scholar] [CrossRef]
  88. Hunt, J.S.; Bermingham, E.; Ricklefs, E.R. Molecular systematics and biogeography of Antillean thrashers, tremblers, and mockingbirds (Aves: Mimidae). Auk 2001, 118, 35–55. [Google Scholar] [CrossRef]
Figure 1. (a) Circular map of mitogenomes of Sturnidae sensu lato. The different colors represent the BLAST-identical percentages. The mitogenomes from outside to inside are as follows (labeled 1 to 10, respectively): A. cristatellus, A. tristis, S. cineraceus, S. sericeus, L. rothschildi, G. nigricollis, S. vulgaris, T. redivivum, M. polyglottos, and B. erythrorynchus. (b) Phylogenetic tree of the relationships among the 10 Sturnidae sensu lato species based on 13 mitochondrial PCGs, with two Muscicapidae outgroups. The support values of each node are indicated in the order of ML, MP, and BI inferences, and “*” indicates full support.
Animals 14 02777 g001
Figure 2. (a) RSCU heatmap of overall mitochondrial PCGs of Sturnidae sensu lato. (b) PR2 plots of each mitochondrial PCG of Sturnidae sensu lato. (c) PCA analysis based on the ENC values of each mitochondrial PCG. (d) The comparison of the ENC vs. GC3s curve of the PCGs in the mitogenomes of Sturnidae sensu lato. The continuous red line represents the expected ENC curve.
Animals 14 02777 g002
Figure 3. (a) Codon aversion motifs of ten investigated Sturnidae sensu lato mitochondrial PCGs. (b) Codon aversion numbers of the three families.
Animals 14 02777 g003
Figure 4. The presumed secondary structures of the tRNAs in A. cristatellus. The new form of the TΨC stem in MT-TF is displayed using an orange box.
Animals 14 02777 g004
Figure 5. The predicted secondary structures of MT-RNR1 in A. cristatellus.
Animals 14 02777 g005
Figure 6. The predicted secondary structures of MT-RNR2 in A. cristatellus.
Animals 14 02777 g006
Figure 7. The structure of the control region in the mitogenome of A. cristatellus. Note that ETAS denotes extended termination-associated sequences, CSB denotes conserved sequence block, and HSP denotes heavy-strand transcription promoter.
Animals 14 02777 g007
Figure 8. Nucleotide-based phylogenetic tree of 132 Sturnidae sensu lato taxa with two Muscicapidae outgroups. This analysis utilized a combined multilocus dataset (five mitochondrial genes and eight nuclear genes). The support value for each node is denoted using different line types.
Animals 14 02777 g008
Table 1. The species of mitogenomes examined in this study.
FamilySpeciesAccessionReferenceSize (bp)/AT%
Heavy-StrandPCGsMT-RNR1MT-RNR2tRNA GenesCR
BuphagidaeBuphagus erythrorynchusMN356312[56]16,802/51.8511,400/50.65979/50.971602/54.241546/57.181231/54.51
MimidaeMimus polyglottosBK010995 #This study16,804/52.4611,400/51.26985/51.371600/54.441540/57.271231/56.38
MimidaeToxostoma redivivumMN356247[56]16,780/52.9111,400/52.13983/50.761600/54.811542/56.491208/55.55
SturnidaeAcridotheres cristatellusNC_015613This study16,820/52.3411,400/51.18979/50.971598/54.761541/57.301250/55.52
SturnidaeAcridotheres tristisNC_015195This study16,822/51.9911,400/50.87979/50.971598/54.381542/57.001251/54.60
SturnidaeGracupica nigricollisNC_020423This study16,839/52.9511,400/51.96978/50.921602/55.061541/58.081253/55.55
SturnidaeLeucopsar rothschildiMN356237[56]16,845/52.7011,400/51.61978/51.531600/55.131543/57.231254/55.58
SturnidaeSpodiopsar cineraceusNC_015237This study16,821/52.4911,400/51.29980/51.531598/55.191541/57.821249/54.68
SturnidaeSpodiopsar sericeusNC_014455[57]16,823/52.6711,400/51.51979/51.691598/55.071543/57.231250/55.76
SturnidaeSturnus vulgarisNC_029360[58]16,793/52.3811,400/51.29974/50.721599/54.281540/57.601233/55.31
# Mitogenomes retrieved from public database by third party annotation (TPA).
Table 2. Rates and patterns of evolution among mitochondrial PCGs and species of Sturnidae sensu lato.
GeneLength (bp)Var. Sites [%]πdNdSdN/dSts/tv
ATP6684224 (32.75)0.118160.11275.45020.0206810.2768
ATP816858 (34.52)0.132940.4331.68950.256315.4548
CO11551369 (23.79)0.090150.01913.30760.005796.1603
CO2684196 (28.65)0.106790.08553.91090.021856.6734
CO3786215 (27.35)0.09550.07564.12720.018337.3630
CYB1143292 (25.55)0.101920.08444.76120.017726.4004
ND1978330 (33.74)0.132630.08484.96680.017089.2547
ND21041392 (37.66)0.137970.21084.14550.050858.5414
ND3351115 (32.76)0.120230.13513.74090.036118.9541
ND41380457 (33.12)0.123080.10777.29080.0147712.7131
ND4L29797 (32.66)0.11380.09067.20690.0125711.8799
ND51818570 (31.35)0.107850.13265.93850.022329.6700
MT-ND6519178 (34.30)0.136970.23882.53860.094066.3762
Overall11,4003493 (30.64)0.1135
Table 3. The best Bayesian evolutionary models in the mitogenomic dataset.
GeneModelModel Setting
Lset nstRate
MT-ATP6HKY+I+G42invgamma
MT-ATP8GTR+I6propinv
MT-CO1GTR+G46gamma
MT-CO2HKY+I+G42invgamma
MT-CO3HKY+G42gamma
MT-CYBHKY+I+G42invgamma
MT-ND1HKY+I+G42invgamma
MT-ND2HKY+I+G42invgamma
MT-ND3HKY+G42gamma
MT-ND4GTR+G46gamma
MT-ND4LHKY+G42gamma
MT-ND5HKY+I+G42invgamma
MT-ND6HKY+I+G42invgamma
Table 4. Determination of the substitution saturation of the PCGs in the mitogenomic dataset.
GeneCodon PositionIss aIss.cSym bpIss.cAsym cp
ATP61st0.08770.6828<0.00010.5256<0.0001
2nd0.02010.6828<0.00010.5256<0.0001
3rd0.4860.6828<0.00010.52560.1973
ATP81st0.19310.8013<0.00010.8228<0.0001
2nd0.11140.8013<0.00010.8228<0.0001
3rd0.30770.8013<0.00010.8228<0.0001
CO11st0.02020.7237<0.00010.5571<0.0001
2nd0.00260.7237<0.00010.5571<0.0001
3rd0.42060.7237<0.00010.5571<0.0001
CO21st0.04780.6828<0.00010.5256<0.0001
2nd0.01390.6828<0.00010.5256<0.0001
3rd0.44660.6828<0.00010.52560.0125
CO31st0.04070.6873<0.00010.526<0.0001
2nd0.02360.6873<0.00010.526<0.0001
3rd0.4440.6873<0.00010.5260.0049
CYB1st0.06090.7051<0.00010.5386<0.0001
2nd0.00880.7051<0.00010.5386<0.0001
3rd0.46110.7051<0.00010.53860.0042
ND11st0.07340.6969<0.00010.5316<0.0001
2nd0.01680.6969<0.00010.5316<0.0001
3rd0.49840.6969<0.00010.53160.1917
ND21st0.12170.7001<0.00010.5341<0.0001
2nd0.05240.7001<0.00010.5341<0.0001
3rd0.47470.7001<0.00010.53410.0189
ND31st0.10750.6886<0.00010.5759<0.0001
2nd0.06350.6886<0.00010.5759<0.0001
3rd0.48170.68860.00010.57590.0643
ND41st0.08710.7161<0.00010.5494<0.0001
2nd0.030.7161<0.00010.5494<0.0001
3rd0.49360.7161<0.00010.54940.011
ND4L1st0.09780.7016<0.00010.6103<0.0001
2nd0.02030.7016<0.00010.6103<0.0001
3rd0.44690.7016<0.00010.61030.0005
ND51st0.08020.7349<0.00010.5684<0.0001
2nd0.03740.7349<0.00010.5684<0.0001
3rd0.46080.7349<0.00010.5684<0.0001
ND61st0.16640.6787<0.00010.5345<0.0001
2nd0.06890.6787<0.00010.5345<0.0001
3rd0.43710.6787<0.00010.53450.0135
a Iss: index of substitution saturation. b Iss.cSym: critical index of substitution saturation (assuming a symmetrical topology). c Iss.cAsym: critical index of substitution saturation (assuming an asymmetrical topology).
Disclaimer/Publisher’s Note: The statements, opinions and data contained in all publications are solely those of the individual author(s) and contributor(s) and not of MDPI and/or the editor(s). MDPI and/or the editor(s) disclaim responsibility for any injury to people or property resulting from any ideas, methods, instructions or products referred to in the content.

