Simple Summary
Salmonella is a significant foodborne disease affecting the poultry industry and human health worldwide. Understanding the protective role of the intestinal mucosal immune response to Salmonella infection is critical to developing immune-based strategies to control Salmonella infection in chickens. Therefore, this study was conducted to determine the kinetics of intraepithelial lymphocytes (IELs) and their role in Salmonella enterica serovar Typhimurium (S. Typhimurium) infection. The results revealed that various IEL subtypes respond to Salmonella infection, highlighting their essential role during infection.
Abstract
At day 21 of age, Ross-308 broilers were orally gavaged with 7.5 × 10⁶ CFU/mL S. Typhimurium (n = 30), and another 30 birds were kept as the control. The body weight of birds was recorded on days 0, 2, 7, and 14 days post-infection (dpi) to calculate body weight gains (BWGs). At each time point, seven birds per group were euthanized for sample collection to acquire IELs and lymphocytes from the ileum and spleen for flow cytometric analysis. A reduction in BWGs of the infected groups compared to the control group was observed only at 2 dpi. Additionally, there were no changes in the expression of IFN-γ, IL-1β, and TNF-α in the ileum at 2 and 7 dpi. The number of IELs increased significantly following Salmonella infection in the ileum at 2 and 7 dpi without any changes in spleen lymphocytes. The increase in the total number of IELs was derived from the elevated numbers of conventional CD8αβ+TCRαβ+ and natural IEL populations (CD4−CD8−TCRαβ+, CD8αα+TCRαβ+, TCRγδ+, non-T cells (TCRneg, and iCD8α cells)). The increase in regulatory IELs and the stable expression of proinflammatory cytokine genes during the first week of infection suggests the potential role of IELs in modulating intestinal inflammation.
1. Introduction
The prevalence of foodborne illnesses has drawn increasing attention to the role of bacterial pathogens, particularly Salmonella, in the contamination of poultry products, with chicken being a prominent concern. Salmonella, a Gram-negative bacterium, is recognized as a leading cause of foodborne infections globally, and its association with poultry, including chicken, presents a significant public health challenge. Salmonellosis, caused by numerous strains/serotypes of Salmonella enterica bacteria, manifests through disturbances in the gastrointestinal tract. In chickens, Salmonella enterica serovar Typhimurium (S. Typhimurium) typically induces a subclinical infection, with occasional instances of severe disease reported in young chicks [1]. An alarming concern arises from subclinical infections in chickens, which are challenging to diagnose and may contaminate poultry meat and eggs. These contaminated products can enter the human food chain, causing severe food poisoning, especially in immunocompromised, elderly, and young individuals [2]. Therefore, S. Typhimurium does not only cause economic losses in the poultry industry but also raises concerns for human health.
To some extent, the immune response to Salmonella has been studied in chickens, such as research by Sheela et al., where they concluded that the Salmonella enterica serovar Enteritidis challenge elevates gut-associated T cells, IgA, and IgG [3]. Moreover, the Salmonella challenge results in the upregulation of proinflammatory genes, such as IL-1β, IFN-γ, and IL-17, in the chicken cecum [4]. An increase in granulocytes and cytotoxic T cells (CD8αβ+ TCRαβ+) have also been observed in chicken ceca following Salmonella enterica infection [5]. However, there are a few studies on how intraepithelial lymphocytes (IELs) in the intestine respond to Salmonella infection in chickens. Therefore, this study aims mainly to characterize and quantify the IEL subset in the ileum. Understanding the characteristics of these cells could lead to developing preventive strategies against enteric infections in poultry.
IELs are interspersed within the intestinal epithelium and are considered first responders to enteric pathogens due to their proximity to the intestinal lumen [6]. Interestingly, these cells also interact with commensal microbiota and food without resorting to inflammation and cytotoxic effector functions, signifying their tolerogenic properties. IELs have been broadly researched in humans and mice, and the majority consist of T lymphocyte subtypes. They are broadly classified into induced/conventional and natural/unconventional IELs [7]. Induced IELs encompass classical lymphocytes: T helper cells (CD4+TCRαβ+) and cytotoxic T cells (CD8αβ+TCRαβ+) are initially activated in the periphery and, upon encountering their specific antigen, migrate to the IEL compartment. Natural IELs, on the other hand, migrate to the intestinal epithelium as soon as they mature in the thymus and consist of T cells (TCRγδ+, CD8αα+TCRαβ+, and CD4−CD8−TCRαβ). Non-T cell IELs are part of natural IELs and constitute the innate lymphoid cell (ILC)-1, ILC-3, intracellular CD3 (iCD3+), and innate CD8α (iCD8α+) [7].
IEL research is limited to chickens, although some characterization studies have been conducted. In 1988, Lawn and colleagues documented the presence of IELs in chickens, noting that the majority of chicken IELs resemble T cell IELs found in humans and mice [8]. Later, Meijerink et al. concluded that NK cells also comprise a portion of the chicken IEL population [9]. Some studies have investigated how IELs respond to specific pathogens. For instance, one study reported changes in the IEL population and alterations in proinflammatory cytokine gene expressions following an Eimeria challenge [10]. Additionally, differences in the IEL population were observed during viral infection when chickens were challenged with the Newcastle disease virus [11]. However, this research has primarily focused on TCRγδ+, CD4+, and CD8+ T cells without exploring other subsets within IELs. Our laboratory was the first to characterize numerous IEL subsets in chickens in response to Clostridium perfringes infection. We have reported that natural IEL subsets (TCRαβ+CD4−CD8−, TCRαβ+CD8αα+, TCRγδ+, TCRneg, and iCD8α+) exhibit elevated numbers during early stages of necrotic Enteritis in chickens [12]. However, a detailed analysis of the IEL population response to Salmonella has yet to be investigated. Therefore, in the present study, we infected the chickens with S. Typhimurium to determine the kinetics of IELs during the course of infection. Furthermore, we evaluated the gene expression of proinflammatory cytokines in the ileum to determine intestinal inflammation during Salmonellosis in poultry.
2. Materials and Methods
2.1. Bacterial Culture
The S. Typhimurium strain (the poultry isolate obtained by USDA National Veterinary Services Lab, Ames, IA, USA), graciously provided by Dr. Lisa Bielke [13], was propagated in LB broth (Sigma-Aldrich, St. Louis, MO, USA), followed by stock solution preparation in sterile phosphate-buffer saline (PBS). The concentration was adjusted to 1 × 10⁷ CFU/mL utilizing a spectrophotometer at a 625 nm wavelength. Subsequently, the concentration was validated by plating on XLT-4 agar (Sigma-Aldrich, USA), confirming the bacterial dose to be 7.5 × 10⁶ CFU/mL.
2.2. Husbandry, Experimental Design, and Performance
Sixty Ross 308 broiler chicks were housed in a floor pen covered with wood shaving in an environment-controlled housing facility designated as BSL-2. At 21 days of age (0 days post-infection (dpi)), the birds were divided into two groups (control and S. Typhimurium), weighed individually, and placed in two separate floor pens, each with thirty birds. The control group was administered 1 mL PBS, while the S. Typhimurium group was orally gavaged with 7.5 × 10⁶ CFU/mL of S. Typhimurium per bird (Supplementary Figure S1). At 2, 7, and 14 dpi, individual birds were weighed to calculate body weight gains (0–2 dpi, 0–7 dpi, and 0–14 dpi BWGs). At each time point, 7 chickens from each group were randomly selected and harvested for sample collections. Throughout the duration of the trial, mortality was recorded, and birds were observed for any clinical signs following the infection. The ileum and spleen were sampled for the isolation of IELs and T lymphocytes, respectively, and an additional ileum section was obtained for RNA isolation. Additionally, the cecal contents and spleen were collected to indicate local colonization levels and systematic infection, respectively.
2.3. Salmonella Recovery and Count
Ceca contents and spleen were collected in PBS and placed on ice. Tissues were weighed, homogenized, serially diluted in PBS, and plated on XLT-4 agar plates (Sigma-Aldrich, USA) and incubated at 37 °C for 24 h. Bacterial colonies were counted to obtain CFU/g and assess the recovery of S. Typhimurium from the birds. In the case of the absence of colonies, the samples were enriched overnight in tetrathionate broth at 37 °C. Following enrichment, the samples were re-plated on XLT-4 agar and incubated at 37 °C for 24 h.
2.4. Isolation of Immune Cells and Flow Cytometry
The isolation of IELs and flow cytometry were performed according to an established mouse protocol [14], which was modified for chickens [12]. At 2, 7, and 14 dpi, an approximately 7 cm segment of the middle ileum was removed, flushed with PBS, opened longitudinally to remove any feces and mucus, weighed, and cut into smaller pieces (approx. 1 cm). The ileum fragments were collected in a 50 mL tube containing PBS supplemented with 5% chicken serum (Sigma-Aldrich, USA), 2 mM EDTA (Quality Biological, Gaithersburg, MD, USA), and 2 mM dithiothreitol (Sigma-Aldrich, USA). Afterward, the tubes were placed in an incubator shaker (37 °C, 150 rpm) for 45 min. The supernatant was passed through the gauze column resuspended in 40% and overlaid on a 70% Percoll (Cytiva, Marlborough, MA, USA) density gradient to acquire the IEL fraction. To isolate splenocytes, the spleen tissues were crushed with a syringe plunger on a 70 µL cell strainer and rinsed in a supplemented PBS medium. Recovered IELs and splenocytes were incubated with an ACK buffer (Quality Biological, USA) for 5 min to lyse red blood cells. Then, cells were washed and resuspended in a staining buffer. Live cells were quantified using the Trypan blue exclusion method [15]. An aliquot of cells (1 × 10⁶) was stained with fluorochrome-conjugated anti-chicken CD45 SPRD (LT40), CD4 PE-CY7 (CT-4), CD3 AF547 (CT-3), TCRγδ FITC (TCR-1), CD8α AF700 (CT-8), and CD8β PE (EP42) antibodies (Southern Biotech, Birmingham, AL, USA). Ghost viability dye-Red 510 (Tonbo Biosciences, San Diego, CA, USA) was used to distinguish between live and dead cells. Stained cells were acquired through BD FACSCanto II flow cytometry (BD Biosciences, Franklin Lakes, NJ, USA). FlowJo v10.8.1 software (BD Biosciences, USA) was used to analyze the frequency of cells, and the gating strategy used was similar to our previous study [12]. The quantity of cells was expressed as the number of cells per gram of tissue.
2.5. RNA Isolation and Gene Expression
The ileum tissue section was collected in RNA later (Thermo Fisher Scientific, Waltham, MA, USA). The Monarch® Total RNA Miniprep Kit (New England Biolabs®, Ipswich, MA, USA) was used to isolate RNA from the ileum, and cDNA was synthesized from the isolated RNA using the LunaScript® RT SuperMix Kit (New England Biolabs®, USA). Luna® Universal qPCR Master Mix (New England Biolabs®, USA) was used to run real-time PCR in a Bio-Rad CFX Connect machine (Bio-Rad Laboratories, Hercules, CA, USA). The primer sequences for IFN-γ, IL-1β, and TNF-α genes are displayed in Table 1. The cycle threshold (Ct) for each gene was normalized to the housekeeping gene, GAPDH. Relative fold change was calculated compared to the control group using the 2−ΔΔCt method [16].

Table 1.
List of primer sequences used for quantitative real-time PCR.
2.6. Statistical Analysis
GraphPad PRISM v10.0.03 (GraphPad, Boston, MA, USA) was employed for data analysis, and individual chickens were considered an experimental unit. The Mann–Whitney U test was utilized to analyze flow cytometry data, and Student’s t-test was used for BWGs, bacterial count, and gene expression. p < 0.05 was considered statistically significant.
3. Results
3.1. Chicken Performance
BWGs decreased significantly (p < 0.05) at 2 dpi for the S. Typhimurium group, but they recovered by 7 dpi and were comparable to the control group at 14 dpi (Figure 1). No mortality or clinical signs were observed during the course of infection.
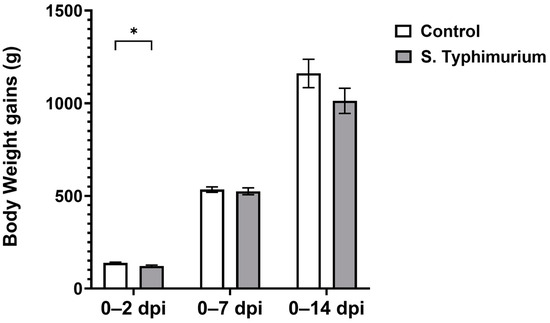
Figure 1.
Body weight gain following the Salmonella challenge. The control group was administered PBS, while the S. Typhimurium group was challenged with 7.5 × 10⁶ CFU/mL of S. Typhimurium at 21 days of age (0 dpi). Bars represent the mean values (n = 30 for 0–2 dpi, 23 for 0–7 dpi, 16 for 0–14 dpi), and the error lines indicate SEM. * p < 0.05.
3.2. Salmonella Loads
Salmonella loads in cecal contents were examined to confirm infection. The results verified that the infected group harbored S. Typhimurium, and their bacteria load decreased over time (3.44 × 10⁸ CFU/gram at 2 dpi, 5.63 × 10² CFU/gram at 7 dpi, and 3.13 × 101 CFU/gram at 14 dpi). No bacteria were detected in the control group. Spleen samples of the S. Typhimurium group showed that 47% and 73% of birds were Salmonella-positive at 2 and 7 dpi, respectively.
3.3. Effect of S. Typhimurium Challenge on IEL Populations
Through flow cytometry, we acquired diverse IEL subsets to study their response to S. Typhimurium infection. We focused on the ileum since it is one of the primary locations for Salmonella colonization in chickens [19]. Our results showed that the number of IELs increased significantly following Salmonella infection in the ileum at 2 and 7 dpi (Figure 2). Despite the numerical increases in IELs at 14 dpi, both infected and control groups had comparable numbers of IELs. Then, we performed a deep analysis of the IEL subpopulation by flow cytometry. Most of the increase in the number of total IELs was derived from the elevated numbers of conventional CD8αβ+TCRαβ+ and natural IEL populations (CD4−CD8−TCRαβ+, CD8αα+TCRαβ+, TCRγδ+, and non-T cells (TCRneg) (Figure 3, Figure 4 and Figure 5). Furthermore, there was a significant increase in the number of CD8αα+CD4+TCRαβ+ cells in the Salmonella-infected birds at 7 dpi only (Figure 3, right panel). Chicken TCRγδ T cells are well-known for expressing both CD8αα homodimers and CD8αβ heterodimers on the cell surface [20]. Therefore, we further characterized TCRγδ IELs according to their expression of CD8α and/or CD8β. The ileum of the S. Typhimurium group harbored significant increases in the number of CD8αα+TCRγδ+ cells at 2 and 7 dpi, as well as CD8αβ-TCRγδ+ cells at 7 dpi (Figure 4B). However, the number of CD8αβ+TCRγδ+ cells was comparable between groups during the course of infection. Finally, the number of iCD8α cells, which represent approximately 10% of TCRneg IELs, displayed a two-fold increase in the S. Typhimurium group compared to the control group at 2 and 7 dpi (Figure 5, left panel).
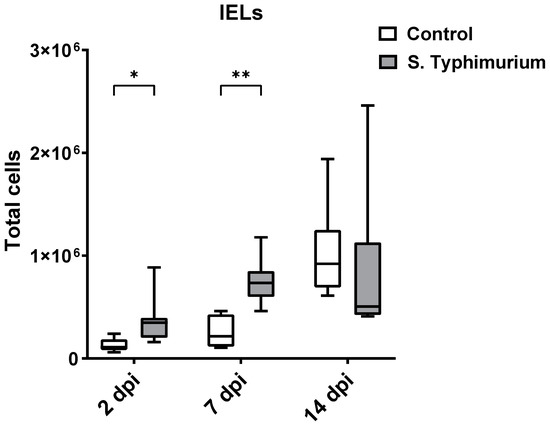
Figure 2.
Effect of the Salmonella challenge on IELs number (cells/gram of tissue) in the ileum. The control group was administered PBS, while the S. Typhimurium group was challenged with 7.5 × 10⁶ CFU/mL of S. Typhimurium at 21 days of age (0 dpi). The box plot shows the distribution of the data, and the central line shows the median (n = 7), while whiskers depict variability outside the upper and lower quartiles. * p < 0.05, ** p < 0.01.
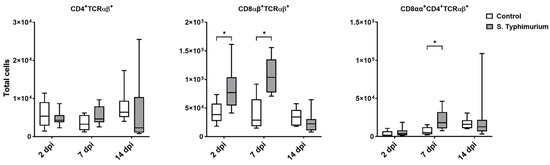
Figure 3.
Conventional IEL subpopulation (cells/gram of tissue) in the ileum following the Salmonella challenge. The control group was administered PBS, while the S. Typhimurium group was challenged with 7.5 × 10⁶ CFU/mL of S. Typhimurium at 21 days of age (0 dpi). The box plot shows the distribution of the data, and the central line shows the median (n = 7), while whiskers depict variability outside the upper and lower quartiles. * p < 0.05.
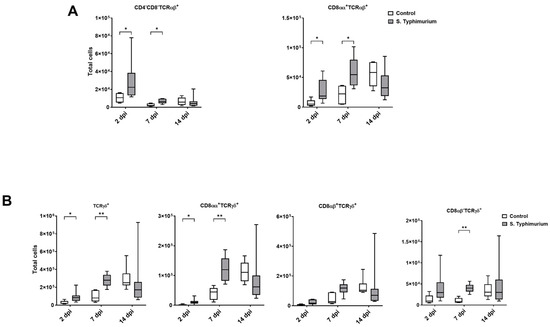
Figure 4.
Natural IEL population (cells/gram of tissue) in the ileum following the Salmonella challenge. (A) TCRαβ natural IELs; (B) TCRγδ natural IELs. The control group was administered PBS, while the S. Typhimurium group was challenged with 7.5 × 10⁶ CFU/mL of S. Typhimurium at 21 days of age (0 dpi). The box plot shows the distribution of the data, and the central line shows the median (n = 7), while whiskers depict variability outside the upper and lower quartiles. * p < 0.05; ** p < 0.01.
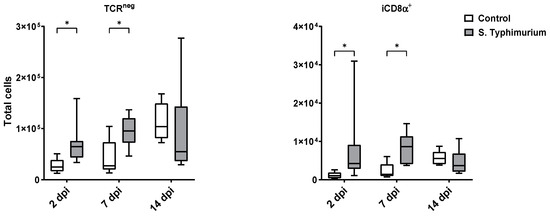
Figure 5.
The number of TCRneg cells and their subpopulation (cells/gram of tissue) in ileum after the Salmonella infection. The control group was administered PBS, while the S. Typhimurium group was challenged with 7.5 × 10⁶ CFU/mL of S. Typhimurium at 21 days of age (0 dpi). The box plot shows the distribution of the data, and the central line shows the median (n = 7), while whiskers depict variability outside the upper and lower quartiles. * p < 0.05.
3.4. Spleen Lymphocytes
We performed flow cytometry analysis on splenic lymphocytes, especially focusing on T cells at 2, 7, and 14 dpi. However, due to a technical issue with the flow cytometry machine during acquisition, the 2 dpi samples were lost. Surprisingly, no changes in the T cell populations were observed between groups (Figure 6).
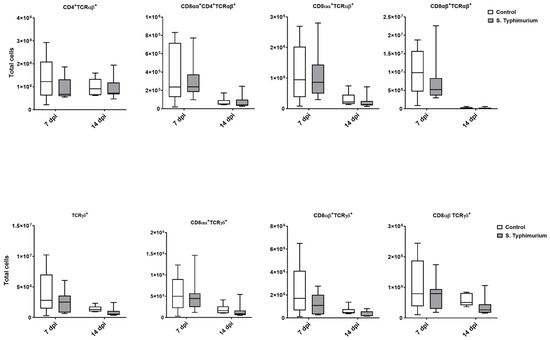
Figure 6.
Spleen lymphocyte (cells/gram of tissue) number following the Salmonella challenge. The control group was administered PBS, while the S. Typhimurium group was challenged with 7.5 × 10⁶ CFU/mL of S. Typhimurium at 21 days of age (0 dpi). The box plot shows the distribution of the data, and the central line shows the median (n = 7), while whiskers depict variability outside the upper and lower quartiles.
3.5. Gene Expression of Proinflammatory Cytokines
There were no changes in the gene expression of proinflammatory cytokines (IFN-γ, IL-1β, and TNF-α) in the ileum of both the infected and control groups (Figure 7).
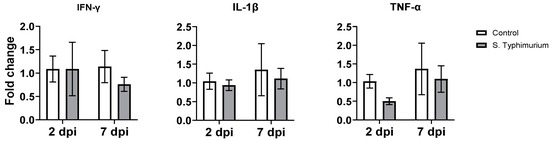
Figure 7.
The effect of Salmonella on the gene expression of selected genes in the ileum. The control group was administered PBS, while the S. Typhimurium group was challenged with 7.5 × 10⁶ CFU/mL of S. Typhimurium at 21 days of age (0 dpi). Bars represent the mean values (n = 4), and the error lines indicate SEM.
4. Discussion
Our study shows that Salmonella-infected birds exhibited no clinical signs with no mortality. There were no differences in body weight compared to the control birds, as BWGs remained similar between groups throughout the infection except for 2 dpi. Numerous other studies have also concluded that birds shed S. Typhimurium without displaying any overt clinical signs and symptoms [21,22,23,24,25].
Research on T cells has confirmed their vital role in Salmonella defense response [26]. Henceforth, we focused on IELs, primarily comprising T cells. At 2 and 7 dpi, there were significant increases in the number of IELs in the ileum, while the spleen lymphocytes remained unchanged. Broiler chicken’s early infection with Salmonella enterica serotype Enteritidis induced IEL infiltration in the ileum as early as 1 dpi, without any changes in splenic leukocytes [27]. Furthermore, the number of ileum cytotoxic CD8 T IELs was elevated during the first week of infection [27]. The later result aligned with ours, showing remarkable increases in conventional CD8αβ+TCRαβ+ cells in the infected group at 2 and 7 dpi, highlighting the importance of these cells during Salmonellosis. The cytotoxic CD8 T cells are an essential arm of adaptive immunity, primarily responsible for eliminating intracellular pathogens and cancerous cells [28]. In mice, cytotoxic CD8 T cells are critical to accelerating S. Typhimurium clearance [29], particularly during the late stage of infection with attenuated Salmonella [30]. The cytotoxic CD8 T cells displayed elevated levels of IFN-γ production, potentially enhancing the killing of Salmonella-infected macrophages [29].
Our results demonstrated that the ileum of the infected group harbored significantly higher numbers of two regulatory cell types: CD8αα+CD4+TCRαβ+ IELs at 7 dpi and CD8αα+TCRαβ+ IELs at 2 and 7 dpi. This might explain the absence of clinical signs in the S. Typhimurium-infected group, which coincided with similar expression levels of proinflammatory cytokine genes (IFN-γ, IL-1β, and TNF-α) between groups. Sadeyen et al. [31] investigated two chicken lines for proinflammatory cytokine expression and reported no difference from the control in IFN-γ expression in both lines and a similar IL-1β expression in one line during early Salmonella infection. A study of the suppressive potency of Foxp3+T regulatory cells during persistent Salmonella infection in mice indicates the presence of these cells, progressively increasing bacterial burden by delaying the activation of effector T cells [32]. Similarly, during chicken infection with Salmonella Enteritidis, the number of CD4+CD25+ T regulatory cells significantly increased with the up regulation of the anti-inflammatory cytokine IL-10 in the cecal tonsils of infected birds [33].
CD8αα+CD4+TCRαβ+ and CD8αα+TCRαβ+ IEL development and functions are well studied in mice. In chickens, however, only one study by our group indicated the importance of CD8αα+TCRαβ+, but not CD8αα+CD4+TCRαβ+ cells during necrotic Enteritis infection [12]. In mammals, CD8αα+CD4+TCRαβ+ IELs are generated from peripheral CD4+ TCRαβ+ cells when they migrate into the intestinal epithelium, where they acquire CD8αα expression [6,34]. There is also strong evidence that lamina propria regulatory T cells are precursors to CD8αα+CD4+TCRαβ+ cells, but they lose Foxp3 expression [35]. The expression of CD8αα requires the upregulation of transcription factors (Runx3 and T-bet) by CD4 T cells [36,37,38], epithelial signals (retinoic acid, IFN-γ, and IL-27) [37,38,39,40], and the intestinal microbiome, particularly Lactobacillus reuteri [41]. Studies in humans with inflammatory bowel diseases suggested the anti-inflammatory function of CD8αα+CD4+TCRαβ+ IELs [42,43]. In addition, these cells protected immunodeficient mice against intestinal colitis mediated by IL-10 [44]. CD8αα+TCRαβ+ cells are uniquely present in the IEL compartment, where they are generated from thymic emigrant CD4−CD8−TCRαβ+ cells by gaining CD8αα expression in the intestinal epithelium [45,46,47,48]. The development and maintenance of CD8αα+TCRαβ+ IELs require TGF-β, IFN-γ, IL-15, the Aryl hydrocarbon receptor, and microbiota, as well as Runx3 and T-bet [49]. CD8αα+TCRαβ+ IELs express immunomodulatory factors such as TGF-β3, lymphocyte activation 3, and fibrinogen-like protein 3 [50]. Moreover, they prevent the development of colitis after the adoptive transfer of naïve CD4 T cells into immunodeficient mice [51,52]. Together, the elevation of the number of IEL populations with regulatory functions during the first week of infection may explain the immune tolerance of chickens against Salmonella colonization and other commensal organisms [53,54,55,56,57]. However, more studies on chicken regulatory IELs are required to confirm this conclusion.
TCRγδ+ cells rapidly increase in various animal species following Salmonella infection [58,59,60]. TCRγδ+ cells, which represent 50% of total T cells in the IEL compartment, produce anti-inflammatory cytokines (TGF-β and IL-10), proinflammatory cytokines (TNF-α and IFN-γ), antimicrobial proteins, wound healing factors, and cytotoxicity proteins such as granzymes, among others [7]. In chickens, there was an expansion of the circulating CD8αα+highTCRγδ+ cells in the blood following oral vaccination with Salmonella enterica serovar Enteritidis [58]. In addition, the frequency of TCRγδ+ and CD8αα+TCRγδ+ cells in the peripheral blood, spleen, and cecum increased at 4 and 7 dpi of S. Typhimurium infection in young chicks [61]. Consistent with these findings, our data underscored the crucial role of TCRγδ+ IELs in anti-Salmonella mucosal immunity, demonstrated by the significant expansion of these cells and CD8αα+TCRγδ+ IELs in the ileum of infected birds at 2 and 7 dpi.
In mice and humans, TCRneg IELs are composed of innate-like lymphoid cells expressing NKP46, NK1.1, and/or NKP44 receptors [62,63,64], as well as lymphocytes expressing intracellular CD3γ (iCD3γ cells) that express CDαα (iCD8α cells) [8,65]. In chickens, only two subsets of the TCRneg IELs population have been characterized: natural killer (NK) cells [9,66] and iCD8α+ cells [12]. Previous studies have indicated their involvement in chicken intestinal responses to enteric diseases. For instance, the number of natural NK IELs peaked at 1 dpi following infection with Salmonella enterica serovar Enteritidis and gradually decreased over time [27]. The iCD8α+ cells increased numerically during necrotic Enteritis in chickens at 1 dpi [12]. In our current study, the S. Typhimurium group presented significant increases in the number of non-T cell IELs, TCRneg cells, and their subset iCD8α+ cells in the ileum at 2 and 7 dpi, suggesting the pivotal role of IELs with innate functions during early Salmonella infection.
5. Conclusions
We demonstrated that the diverse IEL population in the ileum of broilers responds to S. Typhimurium during the first week of infection. These IELs predominantly function as cytotoxic, regulatory, innate-like, and/or innate cells within the immune system. The increase in these IEL populations in the Salmonella-infected group coincided with a reduction in the cecal Salmonella load. Enhancing our understanding of IEL functions will be crucial for comprehending the host immune response to Salmonella and for developing effective preventive strategies against enteric diseases in chickens. Therefore, we plan to sort IEL subsets, particularly CD8αα+CD4+TCRαβ+ and CD8αα+TCRαβ+ IEL, and perform single-cell sequencing to precisely delineate their exact functions.
Supplementary Materials
The following supporting information can be downloaded at: https://www.mdpi.com/article/10.3390/ani14233463/s1, Supplementary Figure S1: Schematic of experimental design.
Author Contributions
Conceptualization, A.N.; methodology, A.N. and S.M.; validation, A.N., B.R.S. and N.K.; formal analysis, A.N. and S.M.; resources, A.N. and L.B.; writing—original draft preparation, S.M.; writing—review and editing, A.N., B.R.S. and N.K.; supervision, A.N. All authors have read and agreed to the published version of the manuscript.
Funding
This research received no external funding.
Institutional Review Board Statement
The trial complied with the regulations and guidelines of the Ohio State University Institutional Animal Care and Use Committee (IACUC 2019A00000118).
Informed Consent Statement
Not applicable.
Data Availability Statement
Data are available on request.
Conflicts of Interest
The authors declare no conflicts of interest.
References
- Arsenault, R.J.; Napper, S.; Kogut, M.H. Salmonella Enterica Typhimurium Infection Causes Metabolic Changes in Chicken Muscle Involving AMPK, Fatty Acid and Insulin/mTOR Signaling. Vet. Res. 2013, 44, 35. [Google Scholar] [CrossRef] [PubMed]
- Dar, M.A.; Ahmad, S.M.; Bhat, S.A.; Ahmed, R.; Urwat, U.; Mumtaz, P.T.; Bhat, S.A.; Dar, T.A.; Shah, R.A.; Ganai, N.A. Salmonella Typhimurium in Poultry: A Review. World’s Poult. Sci. J. 2017, 73, 345–354. [Google Scholar] [CrossRef]
- Sheela, R.R.; Babu, U.; Mu, J.; Elankumaran, S.; Bautista, D.A.; Raybourne, R.B.; Heckert, R.A.; Song, W. Immune Responses against Salmonella Enterica Serovar Enteritidis Infection in Virally Immunosuppressed Chickens. Clin. Diagn. Lab. Immunol. 2003, 10, 670–679. [Google Scholar] [CrossRef] [PubMed]
- Matulova, M.; Varmuzova, K.; Sisak, F.; Havlickova, H.; Babak, V.; Stejskal, K.; Zdrahal, Z.; Rychlik, I. Chicken Innate Immune Response to Oral Infection with Salmonella Enterica Serovar Enteritidis. Vet. Res. 2013, 44, 37. [Google Scholar] [CrossRef] [PubMed]
- Berndt, A.; Wilhelm, A.; Jugert, C.; Pieper, J.; Sachse, K.; Methner, U. Chicken Cecum Immune Response to Salmonella Enterica Serovars of Different Levels of Invasiveness. Infect. Immun. 2007, 75, 5993–6007. [Google Scholar] [CrossRef]
- Cheroutre, H.; Lambolez, F.; Mucida, D. The Light and Dark Sides of Intestinal Intraepithelial Lymphocytes. Nat. Rev. Immunol. 2011, 11, 445–456. [Google Scholar] [CrossRef]
- Olivares-Villagómez, D.; Van Kaer, L. Intestinal Intraepithelial Lymphocytes: Sentinels of the Mucosal Barrier. Trends Immunol. 2018, 39, 264–275. [Google Scholar] [CrossRef]
- Lawn, A.M.; Rose, M.E.; Bradley, J.W.A.; Rennie, M.C. Lymphocytes of the Intestinal Mucosa of Chickens. Cell Tissue Res. 1988, 251, 189–195. [Google Scholar] [CrossRef]
- Meijerink, N.; van Haarlem, D.A.; Velkers, F.C.; Stegeman, A.J.; Rutten, V.P.M.G.; Jansen, C.A. Analysis of Chicken Intestinal Natural Killer Cells, a Major IEL Subset during Embryonic and Early Life. Dev. Comp. Immunol. 2021, 114, 103857. [Google Scholar] [CrossRef]
- Choi, K.D.; Lillehoj, H.S.; Zalenga, D.S. Changes in Local IFN-Gamma and TGF-Beta4 mRNA Expression and Intraepithelial Lymphocytes Following Eimeria Acervulina Infection. Vet. Immunol. Immunopathol. 1999, 71, 263–275. [Google Scholar] [CrossRef]
- Hamisu, T.M.; Aliyu, H.B.; Hair-Bejo, M.; Omar, A.R.; Ideris, A. Alteration in the Population of Intraepithelial Lymphocytes and Virus Shedding in Specific-Pathogen-Free Chickens Following Inoculation with Lentogenic and Velogenic Newcastle Disease Virus Strains. Viral Immunol. 2022, 35, 328–337. [Google Scholar] [CrossRef]
- Majeed, S.; Hamad, S.K.; Shah, B.R.; Bielke, L.; Nazmi, A. Natural Intraepithelial Lymphocyte Populations Rise during Necrotic Enteritis in Chickens. Front. Immunol. 2024, 15, 1354701. [Google Scholar] [CrossRef] [PubMed]
- Kallapura, G.; Morgan, M.J.; Pumford, N.R.; Bielke, L.R.; Wolfenden, A.D.; Faulkner, O.B.; Latorre, J.D.; Menconi, A.; Hernandez-Velasco, X.; Kuttappan, V.A.; et al. Evaluation of the Respiratory Route as a Viable Portal of Entry for Salmonella in Poultry via Intratracheal Challenge of Salmonella Enteritidis and Salmonella Typhimurium. Poult. Sci. 2014, 93, 340–346. [Google Scholar] [CrossRef] [PubMed]
- Nanno, M.; Matsumoto, S.; Koike, R.; Miyasaka, M.; Kawaguchi, M.; Masuda, T.; Miyawaki, S.; Cai, Z.; Shimamura, T.; Fujiura, Y. Development of Intestinal Intraepithelial T Lymphocytes Is Independent of Peyer’s Patches and Lymph Nodes in Aly Mutant Mice. J. Immunol. 1994, 153, 2014–2020. [Google Scholar] [CrossRef]
- Strober, W. Trypan Blue Exclusion Test of Cell Viability. Curr. Protoc. Immunol. 2015, 111, A3.B.1–A3.B.3. [Google Scholar] [CrossRef]
- Livak, K.J.; Schmittgen, T.D. Analysis of Relative Gene Expression Data Using Real-Time Quantitative PCR and the 2−ΔΔCT Method. Methods 2001, 25, 402–408. [Google Scholar] [CrossRef]
- Emami, N.K.; Calik, A.; White, M.B.; Kimminau, E.A.; Dalloul, R.A. Effect of Probiotics and Multi-Component Feed Additives on Microbiota, Gut Barrier and Immune Responses in Broiler Chickens During Subclinical Necrotic Enteritis. Front. Vet. Sci. 2020, 7, 572142. [Google Scholar] [CrossRef]
- Blue, C.E.C.; Suarez, M.G.; Nacer-Khodja, E.; Rodriguez, M.A.; Dalloul, R.A. Positive Impact of Dietary Marine Sulfated Polysaccharides Derived from Macroalgae during a Necrotic Enteritis Challenge. Poult. Sci. 2024, 103, 104502. [Google Scholar] [CrossRef]
- Ijaz, A.; Veldhuizen, E.J.A.; Broere, F.; Rutten, V.P.M.G.; Jansen, C.A. The Interplay between Salmonella and Intestinal Innate Immune Cells in Chickens. Pathogens 2021, 10, 1512. [Google Scholar] [CrossRef]
- Luhtala, M. Chicken CD4, CD8alphabeta, and CD8alphaalpha T Cell Co-Receptor Molecules. Poult. Sci. 1998, 77, 1858–1873. [Google Scholar] [CrossRef]
- Rigby, C.E.; Pettit, J.R. Some Factors Affecting Salmonella Typhimurium Infection and Shedding in Chickens Raised on Litter. Avian Dis. 1979, 23, 442–455. [Google Scholar] [CrossRef]
- Fasina, Y.O.; Bowers, J.B.; Hess, J.B.; McKee, S.R. Effect of Dietary Glutamine Supplementation on Salmonella Colonization in the Ceca of Young Broiler Chicks. Poult. Sci. 2010, 89, 1042–1048. [Google Scholar] [CrossRef]
- Barrow, P.A.; Simpson, J.M.; Lovell, M.A. Intestinal Colonisation in the Chicken by Food-poisoning Salmonella Serotypes; Microbial Characteristics Associated with Faecal Excretion. Avian Pathol. 1988, 17, 571–588. [Google Scholar] [CrossRef] [PubMed]
- Sivula, C.P.; Bogomolnaya, L.M.; Andrews-Polymenis, H.L. A Comparison of Cecal Colonization of Salmonella Enterica Serotype Typhimurium in White Leghorn Chicks and Salmonella-Resistant Mice. BMC Microbiol. 2008, 8, 182. [Google Scholar] [CrossRef]
- Beal, R.K.; Wigley, P.; Powers, C.; Hulme, S.D.; Barrow, P.A.; Smith, A.L. Age at Primary Infection with Salmonella Enterica Serovar Typhimurium in the Chicken Influences Persistence of Infection and Subsequent Immunity to Re-Challenge. Vet. Immunol. Immunopathol. 2004, 100, 151–164. [Google Scholar] [CrossRef]
- Godinez, I.; Haneda, T.; Raffatellu, M.; George, M.D.; Paixão, T.A.; Rolán, H.G.; Santos, R.L.; Dandekar, S.; Tsolis, R.M.; Bäumler, A.J. T Cells Help To Amplify Inflammatory Responses Induced by Salmonella Enterica Serotype Typhimurium in the Intestinal Mucosa. Infect. Immun. 2008, 76, 2008–2017. [Google Scholar] [CrossRef] [PubMed]
- Meijerink, N.; van den Biggelaar, R.H.G.A.; van Haarlem, D.A.; Stegeman, J.A.; Rutten, V.P.M.G.; Jansen, C.A. A Detailed Analysis of Innate and Adaptive Immune Responsiveness upon Infection with Salmonella Enterica Serotype Enteritidis in Young Broiler Chickens. Vet. Res. 2021, 52, 109. [Google Scholar] [CrossRef]
- Walch, M.; Dotiwala, F.; Mulik, S.; Thiery, J.; Kirchhausen, T.; Clayberger, C.; Krensky, A.M.; Martinvalet, D.; Lieberman, J. Cytotoxic Cells Kill Intracellular Bacteria through Granulysin-Mediated Delivery of Granzymes. Cell 2014, 157, 1309–1323. [Google Scholar] [CrossRef]
- Labuda, J.C.; Depew, C.E.; Pham, O.H.; Benoun, J.M.; Ramirez, N.A.; McSorley, S.J. Unexpected Role of CD8 T Cells in Accelerated Clearance of Salmonella Enterica Serovar Typhimurium from H-2 Congenic Mice. Infect. Immun. 2019, 87, e00588-19. [Google Scholar] [CrossRef]
- Lee, S.-J.; Dunmire, S.; McSorley, S.J. MHC Class-I-Restricted CD8 T Cells Play a Protective Role during Primary Salmonella Infection. Immunol. Lett. 2012, 148, 138–143. [Google Scholar] [CrossRef]
- Sadeyen, J.-R.; Trotereau, J.; Velge, P.; Marly, J.; Beaumont, C.; Barrow, P.A.; Bumstead, N.; Lalmanach, A.-C. Salmonella Carrier State in Chicken: Comparison of Expression of Immune Response Genes between Susceptible and Resistant Animals. Microbes Infect. 2004, 6, 1278–1286. [Google Scholar] [CrossRef]
- Johanns, T.M.; Ertelt, J.M.; Rowe, J.H.; Way, S.S. Regulatory T Cell Suppressive Potency Dictates the Balance between Bacterial Proliferation and Clearance during Persistent Salmonella Infection. PLoS Pathog. 2010, 6, e1001043. [Google Scholar] [CrossRef] [PubMed]
- Shanmugasundaram, R.; Kogut, M.H.; Arsenault, R.J.; Swaggerty, C.L.; Cole, K.; Reddish, J.M.; Selvaraj, R.K. Effect of Salmonella Infection on Cecal Tonsil Regulatory T Cell Properties in Chickens. Poult. Sci. 2015, 94, 1828–1835. [Google Scholar] [CrossRef] [PubMed]
- Olivares-Villagómez, D.; Van Kaer, L. TL and CD8αα: Enigmatic Partners in Mucosal Immunity. Immunol. Lett. 2010, 134, 1–6. [Google Scholar] [CrossRef] [PubMed]
- Sujino, T.; London, M.; Hoytema van Konijnenburg, D.P.; Rendon, T.; Buch, T.; Silva, H.M.; Lafaille, J.J.; Reis, B.S.; Mucida, D. Tissue Adaptation of Regulatory and Intraepithelial CD4⁺ T Cells Controls Gut Inflammation. Science 2016, 352, 1581–1586. [Google Scholar] [CrossRef]
- Mucida, D.; Husain, M.M.; Muroi, S.; van Wijk, F.; Shinnakasu, R.; Naoe, Y.; Reis, B.S.; Huang, Y.; Lambolez, F.; Docherty, M.; et al. Transcriptional Reprogramming of Mature CD4+ T Helper Cells Generates Distinct MHC Class II-Restricted Cytotoxic T Lymphocytes. Nat. Immunol. 2013, 14, 281–289. [Google Scholar] [CrossRef]
- Reis, B.S.; Hoytema van Konijnenburg, D.P.; Grivennikov, S.I.; Mucida, D. Transcription Factor T-Bet Regulates Intraepithelial Lymphocyte Functional Maturation. Immunity 2014, 41, 244–256. [Google Scholar] [CrossRef]
- Reis, B.S.; Rogoz, A.; Costa-Pinto, F.A.; Taniuchi, I.; Mucida, D. Mutual Expression of Runx3 and ThPOK Regulates Intestinal CD4+ T Cell Immunity. Nat. Immunol. 2013, 14, 271. [Google Scholar] [CrossRef]
- Konkel, J.E.; Maruyama, T.; Carpenter, A.C.; Xiong, Y.; Zamarron, B.F.; Hall, B.E.; Kulkarni, A.B.; Zhang, P.; Bosselut, R.; Chen, W. Control of the Development of CD8αα+ Intestinal Intraepithelial Lymphocytes by TGF-β. Nat. Immunol. 2011, 12, 312–319. [Google Scholar] [CrossRef] [PubMed]
- Van Kaer, L.; Rabacal, W.A.S.; Scott Algood, H.M.; Parekh, V.V.; Olivares-Villagómez, D. In Vitro Induction of Regulatory CD4+CD8α+ T Cells by TGF-β, IL-7 and IFN-γ. PLoS ONE 2013, 8, e67821. [Google Scholar] [CrossRef] [PubMed]
- Cervantes-Barragan, L.; Chai, J.N.; Tianero, M.D.; Di Luccia, B.; Ahern, P.P.; Merriman, J.; Cortez, V.S.; Caparon, M.G.; Donia, M.S.; Gilfillan, S.; et al. Lactobacillus Reuteri Induces Gut Intraepithelial CD4+CD8αα+ T Cells. Science 2017, 357, 806–810. [Google Scholar] [CrossRef] [PubMed]
- Carton, J.; Byrne, B.; Madrigal-Estebas, L.; O’Donoghue, D.P.; O’Farrelly, C. CD4+CD8+ Human Small Intestinal T Cells Are Decreased in Coeliac Patients, with CD8 Expression Downregulated on Intra-Epithelial T Cells in the Active Disease. Eur. J. Gastroenterol. Hepatol. 2004, 16, 961–968. [Google Scholar] [CrossRef]
- Senju, M.; Wu, K.C.; Mahida, Y.R.; Jewell, D.P. Coexpression of CD4 and CD8 on Peripheral Blood T Cells and Lamina Propria T Cells in Inflammatory Bowel Disease by Two Colour Immunofluorescence and Flow Cytometric Analysis. Gut 1991, 32, 918–922. [Google Scholar] [CrossRef][Green Version]
- Das, G.; Augustine, M.M.; Das, J.; Bottomly, K.; Ray, P.; Ray, A. An Important Regulatory Role for CD4+CD8 Alpha Alpha T Cells in the Intestinal Epithelial Layer in the Prevention of Inflammatory Bowel Disease. Proc. Natl. Acad. Sci. USA 2003, 100, 5324–5329. [Google Scholar] [CrossRef]
- Gangadharan, D.; Lambolez, F.; Attinger, A.; Wang-Zhu, Y.; Sullivan, B.A.; Cheroutre, H. Identification of Pre- and Postselection TCRalphabeta+ Intraepithelial Lymphocyte Precursors in the Thymus. Immunity 2006, 25, 631–641. [Google Scholar] [CrossRef] [PubMed]
- Baldwin, T.A.; Sandau, M.M.; Jameson, S.C.; Hogquist, K.A. The Timing of TCR Alpha Expression Critically Influences T Cell Development and Selection. J. Exp. Med. 2005, 202, 111–121. [Google Scholar] [CrossRef]
- McDonald, B.D.; Bunker, J.J.; Ishizuka, I.E.; Jabri, B.; Bendelac, A. Elevated T Cell Receptor Signaling Identifies a Thymic Precursor to the TCRαβ(+)CD4(-)CD8β(-) Intraepithelial Lymphocyte Lineage. Immunity 2014, 41, 219–229. [Google Scholar] [CrossRef]
- Ruscher, R.; Kummer, R.L.; Lee, Y.J.; Jameson, S.C.; Hogquist, K.A. CD8αα Intraepithelial Lymphocytes Arise from Two Main Thymic Precursors. Nat. Immunol. 2017, 18, 771–779. [Google Scholar] [CrossRef]
- Van Kaer, L.; Olivares-Villagómez, D. Development, Homeostasis, and Functions of Intestinal Intraepithelial Lymphocytes. J. Immunol. 2018, 200, 2235–2244. [Google Scholar] [CrossRef]
- Denning, T.L.; Granger, S.W.; Mucida, D.; Graddy, R.; Leclercq, G.; Zhang, W.; Honey, K.; Rasmussen, J.P.; Cheroutre, H.; Rudensky, A.Y.; et al. Mouse TCRalphabeta+CD8alphaalpha Intraepithelial Lymphocytes Express Genes That Down-Regulate Their Antigen Reactivity and Suppress Immune Responses. J. Immunol. 2007, 178, 4230–4239. [Google Scholar] [CrossRef]
- Poussier, P.; Ning, T.; Banerjee, D.; Julius, M. A Unique Subset of Self-Specific Intraintestinal T Cells Maintains Gut Integrity. J. Exp. Med. 2002, 195, 1491–1497. [Google Scholar] [CrossRef]
- Hu, M.D.; Edelblum, K.L. Sentinels at the Frontline: The Role of Intraepithelial Lymphocytes in Inflammatory Bowel Disease. Curr. Pharmacol. Rep. 2017, 3, 321–334. [Google Scholar] [CrossRef] [PubMed]
- Round, J.L.; Mazmanian, S.K. Inducible Foxp3+ Regulatory T-Cell Development by a Commensal Bacterium of the Intestinal Microbiota. Proc. Natl. Acad. Sci. USA 2010, 107, 12204–12209. [Google Scholar] [CrossRef] [PubMed]
- Fernandez, F.; Hinton, M.; Van Gils, B. Dietary Mannan-Oligosaccharides and Their Effect on Chicken Caecal Microflora in Relation to Salmonella Enteritidis Colonization. Avian Pathol. 2002, 31, 49–58. [Google Scholar] [CrossRef] [PubMed]
- Belkaid, Y. Regulatory T Cells and Infection: A Dangerous Necessity. Nat. Rev. Immunol. 2007, 7, 875–888. [Google Scholar] [CrossRef]
- Li, Z.; Zhang, C.; Zhou, Z.; Zhang, J.; Zhang, J.; Tian, Z. Small Intestinal Intraepithelial Lymphocytes Expressing CD8 and T Cell Receptor Γδ Are Involved in Bacterial Clearance during Salmonella Enterica Serovar Typhimurium Infection. Infect. Immun. 2012, 80, 565–574. [Google Scholar] [CrossRef]
- Kao, J.Y.; Zhang, M.; Miller, M.J.; Mills, J.C.; Wang, B.; Liu, M.; Eaton, K.A.; Zou, W.; Berndt, B.E.; Cole, T.S.; et al. Helicobacter Pylori Immune Escape Is Mediated by Dendritic Cell-Induced Treg Skewing and Th17 Suppression in Mice. Gastroenterology 2010, 138, 1046–1054. [Google Scholar] [CrossRef]
- Berndt, A.; Methner, U. Gamma/Delta T Cell Response of Chickens after Oral Administration of Attenuated and Non-Attenuated Salmonella Typhimurium Strains. Vet Immunol. Immunopathol. 2001, 78, 143–161. [Google Scholar] [CrossRef]
- Hara, T.; Mizuno, Y.; Takaki, K.; Takada, H.; Akeda, H.; Aoki, T.; Nagata, M.; Ueda, K.; Matsuzaki, G.; Yoshikai, Y. Predominant Activation and Expansion of V Gamma 9-Bearing Gamma Delta T Cells in Vivo as Well as In Vitro in Salmonella Infection. J. Clin. Investig. 1992, 90, 204–210. [Google Scholar] [CrossRef]
- Mixter, P.F.; Camerini, V.; Stone, B.J.; Miller, V.L.; Kronenberg, M. Mouse T Lymphocytes That Express a Gamma Delta T-Cell Antigen Receptor Contribute to Resistance to Salmonella Infection In Vivo. Infect. Immun. 1994, 62, 4618–4621. [Google Scholar] [CrossRef]
- Pieper, J.; Methner, U.; Berndt, A. Characterization of Avian Γδ T-Cell Subsets after Salmonella Enterica Serovar Typhimurium Infection of Chicks. Infect. Immun. 2011, 79, 822–829. [Google Scholar] [CrossRef] [PubMed]
- Talayero, P.; Mancebo, E.; Calvo-Pulido, J.; Rodríguez-Muñoz, S.; Bernardo, I.; Laguna-Goya, R.; Cano-Romero, F.L.; García-Sesma, A.; Loinaz, C.; Jiménez, C.; et al. Innate Lymphoid Cells Groups 1 and 3 in the Epithelial Compartment of Functional Human Intestinal Allografts. Am. J. Transplant. 2016, 16, 72–82. [Google Scholar] [CrossRef] [PubMed]
- Van Acker, A.; Gronke, K.; Biswas, A.; Martens, L.; Saeys, Y.; Filtjens, J.; Taveirne, S.; Van Ammel, E.; Kerre, T.; Matthys, P.; et al. A Murine Intestinal Intraepithelial NKp46-Negative Innate Lymphoid Cell Population Characterized by Group 1 Properties. Cell Rep. 2017, 19, 1431–1443. [Google Scholar] [CrossRef] [PubMed]
- Ettersperger, J.; Montcuquet, N.; Malamut, G.; Guegan, N.; Lopez-Lastra, S.; Gayraud, S.; Reimann, C.; Vidal, E.; Cagnard, N.; Villarese, P.; et al. Interleukin-15-Dependent T-Cell-like Innate Intraepithelial Lymphocytes Develop in the Intestine and Transform into Lymphomas in Celiac Disease. Immunity 2016, 45, 610–625. [Google Scholar] [CrossRef] [PubMed]
- Van Kaer, L.; Scott Algood, H.M.; Singh, K.; Parekh, V.V.; Greer, M.J.; Piazuelo, M.B.; Weitkamp, J.-H.; Matta, P.; Chaturvedi, R.; Wilson, K.T.; et al. CD8αα Innate-Type Lymphocytes in the Intestinal Epithelium Mediate Mucosal Immunity. Immunity 2014, 41, 451–464. [Google Scholar] [CrossRef]
- Göbel, T.W.; Kaspers, B.; Stangassinger, M. NK and T Cells Constitute Two Major, Functionally Distinct Intestinal Epithelial Lymphocyte Subsets in the Chicken. Int. Immunol. 2001, 13, 757–762. [Google Scholar] [CrossRef]


Disclaimer/Publisher’s Note: The statements, opinions and data contained in all publications are solely those of the individual author(s) and contributor(s) and not of MDPI and/or the editor(s). MDPI and/or the editor(s) disclaim responsibility for any injury to people or property resulting from any ideas, methods, instructions or products referred to in the content. |
© 2024 by the authors. Licensee MDPI, Basel, Switzerland. This article is an open access article distributed under the terms and conditions of the Creative Commons Attribution (CC BY) license (https://creativecommons.org/licenses/by/4.0/).