

The Impacts of Heat Stress on Rumination, Drinking, and Locomotory Behavior, as Registered by Innovative Technologies, and Acid–Base Balance in Fresh Multiparous Dairy Cows

 ,
,  , , and
Abstract
:Simple Summary
Abstract
1. Introduction
2. Materials and Methods
2.1. Farm, Experiment Design and Duration
2.2. Assessments of Rumination, Drinking, and Locomotory Parameters Using RumiWatch Sensors
2.3. Registration of Acid–Base Balance
2.4. Statistical Analysis
3. Results
Descriptive Statistics of the Investigated Indicators
4. Discussion
5. Conclusions
Author Contributions
Funding
Institutional Review Board Statement
Informed Consent Statement
Data Availability Statement
Conflicts of Interest
References
- Annual 2020 Global Climate Report|National Centers for Environmental Information (NCEI). Available online: https://www.ncei.noaa.gov/access/monitoring/monthly-report/global/202013 (accessed on 23 March 2024).
- Jacobsen, K.L. The Well-Being of Dairy Cows in Hot and Humid Climates. Part 1. Housing and Effects of Heat Stress. Compend. Contin. Educ. Pract. Vet. 1996, 18, S59–S63. [Google Scholar]
- Gupta, S.; Sharma, A.; Joy, A.; Dunshea, F.R.; Chauhan, S.S. The Impact of Heat Stress on Immune Status of Dairy Cattle and Strategies to Ameliorate the Negative Effects. Animals 2023, 13, 107. [Google Scholar] [CrossRef] [PubMed]
- Vale, W.G. Effects of Environment on Buffalo Reproduction. Ital. J. Anim. Sci. 2007, 6, 130–142. [Google Scholar] [CrossRef]
- Jo, J.-H.; Nejad, J.G.; Lee, J.-S.; Lee, H.-G. Evaluation of Heat Stress Effects in Different Geographical Areas on Milk and Rumen Characteristics in Holstein Dairy Cows Using Robot Milking and Rumen Sensors: A Survey in South Korea. Animals 2022, 12, 2398. [Google Scholar] [CrossRef] [PubMed]
- Polsky, L.B.; Madureira, A.M.L.; Filho, E.L.D.; Soriano, S.; Sica, A.F.; Vasconcelos, J.L.M.; Cerri, R.L.A. Association between Ambient Temperature and Humidity, Vaginal Temperature, and Automatic Activity Monitoring on Induced Estrus in Lactating Cows. J. Dairy Sci. 2017, 100, 8590–8601. [Google Scholar] [CrossRef]
- Ramón-Moragues, A.; Carulla, P.; Mínguez, C.; Villagrá, A.; Estellés, F. Dairy Cows Activity under Heat Stress: A Case Study in Spain. Animals 2021, 11, 2305. [Google Scholar] [CrossRef] [PubMed]
- Sammad, A.; Wang, Y.J.; Umer, S.; Lirong, H.; Khan, I.; Khan, A.; Ahmad, B.; Wang, Y. Nutritional Physiology and Biochemistry of Dairy Cattle under the Influence of Heat Stress: Consequences and Opportunities. Animals 2020, 10, 793. [Google Scholar] [CrossRef] [PubMed]
- Ajeet, K.; Meena, K. Effect of Heat Stress in Tropical Livestock and Different Strategies for Its Amelioration. J. Stress Physiol. Biochem. 2011, 7, 45–54. [Google Scholar]
- Bernabucci, U.; Lacetera, N.; Baumgard, L.H.; Rhoads, R.P.; Ronchi, B.; Nardone, A. Metabolic and Hormonal Acclimation to Heat Stress in Domesticated Ruminants. Animal 2010, 4, 1167–1183. [Google Scholar] [CrossRef]
- Thom, E.C. The Discomfort Index. Weatherwise 1959, 12, 57–61. [Google Scholar] [CrossRef]
- García, R.; Aguilar, J.; Toro, M.; Pinto, A.; Rodríguez, P. A Systematic Literature Review on the Use of Machine Learning in Precision Livestock Farming. Comput. Electron. Agric. 2020, 179, 105826. [Google Scholar] [CrossRef]
- Stone, A.E.; Jones, B.W.; Becker, C.A.; Bewley, J.M. Influence of Breed, Milk Yield, and Temperature-Humidity Index on Dairy Cow Lying Time, Neck Activity, Reticulorumen Temperature, and Rumination Behavior. J. Dairy Sci. 2017, 100, 2395–2403. [Google Scholar] [CrossRef] [PubMed]
- Zehner, N.; Umstätter, C.; Niederhauser, J.J.; Schick, M. System Specification and Validation of a Noseband Pressure Sensor for Measurement of Ruminating and Eating Behavior in Stable-Fed Cows. Comput. Electron. Agric. 2017, 136, 31–41. [Google Scholar] [CrossRef]
- Gianesella, M.; Morgante, M.; Cannizzo, C.; Stefani, A.; Dalvit, P.; Messina, V.; Giudice, E. Subacute Ruminal Acidosis and Evaluation of Blood Gas Analysis in Dairy Cow. Vet. Med. Int. 2010, 2010, e392371. [Google Scholar] [CrossRef] [PubMed]
- Gokce, G.; Citil, M.; Gunes, V.; Atalan, G. Effect of Time Delay and Storage Temperature on Blood Gas and Acid–Base Values of Bovine Venous Blood. Res. Vet. Sci. 2004, 76, 121–127. [Google Scholar] [CrossRef] [PubMed]
- Hamann, J.; Krömker, V. Potential of Specific Milk Composition Variables for Cow Health Management. Livest. Prod. Sci. 1997, 48, 201–208. [Google Scholar] [CrossRef]
- Tian, H.; Zheng, N.; Wang, W.; Cheng, J.; Li, S.; Zhang, Y.; Wang, J. Integrated Metabolomics Study of the Milk of Heat-Stressed Lactating Dairy Cows. Sci. Rep. 2016, 6, 24208. [Google Scholar] [CrossRef]
- Pandey, S.; Kalwa, U.; Kong, T.; Guo, B.; Gauger, P.C.; Peters, D.J.; Yoon, K.-J. Behavioral Monitoring Tool for Pig Farmers: Ear Tag Sensors, Machine Intelligence, and Technology Adoption Roadmap. Animals 2021, 11, 2665. [Google Scholar] [CrossRef] [PubMed]
- Guo, J.; Gao, S.; Quan, S.; Zhang, Y.; Bu, D.; Wang, J. Blood Amino Acids Profile Responding to Heat Stress in Dairy Cows. Asian-Australas. J. Anim. Sci. 2018, 31, 47–53. [Google Scholar] [CrossRef]
- Antanaitis, R.; Juozaitienė, V.; Televičius, M.; Malašauskienė, D. Evaluation of Biomarkers of Heat Stress by Using Automatic Health Monitoring System in Dairy Cows 2020. Pol. J. Vet. Sci. 2021, 24, 253–260. [Google Scholar] [CrossRef]
- Morales-Piñeyrúa, J.T.; Damián, J.P.; Banchero, G.; Sant’Anna, A.C. The Effects of Heat Stress on Milk Production and the Grazing Behavior of Dairy Holstein Cows Milked by an Automatic Milking System. J. Anim. Sci. 2022, 100, skac225. [Google Scholar] [CrossRef] [PubMed]
- Hut, P.R.; Scheurwater, J.; Nielen, M.; van den Broek, J.; Hostens, M.M. Heat Stress in a Temperate Climate Leads to Adapted Sensor-Based Behavioral Patterns of Dairy Cows. J. Dairy Sci. 2022, 105, 6909–6922. [Google Scholar] [CrossRef] [PubMed]
- Tao, S.; Orellana Rivas, R.M.; Marins, T.N.; Chen, Y.-C.; Gao, J.; Bernard, J.K. Impact of Heat Stress on Lactational Performance of Dairy Cows. Theriogenology 2020, 150, 437–444. [Google Scholar] [CrossRef] [PubMed]
- VandeHaar, M.J.; St-Pierre, N. Major Advances in Nutrition: Relevance to the Sustainability of the Dairy Industry. J. Dairy Sci. 2006, 89, 1280–1291. [Google Scholar] [CrossRef] [PubMed]
- National Academies of Sciences, Engineering, and Medicine; Division on Earth and Life Studies; Board on Agriculture and Natural Resources; Committee on Nutrient Requirements of Dairy Cattle. Nutrient Requirements of Dairy Cattle: Eighth Revised Edition; National Academies Press: Washington, DC, USA, 2021; ISBN 978-0-309-67777-6. [Google Scholar]
- Gantner, V.; Mijić, P.; Kuterovac, K.; Solić, D.; Gantner, R. Temperature-Humidity Index Values and Their Significance on the Daily Production of Dairy Cattle. Mljekarstvo Časopis Za Unaprjeđenje Proizv. I Prerade Mlijeka 2011, 61, 56–63. [Google Scholar]
- Authority (EFSA), E.F.S. Scientific Opinion on the Overall Effects of Farming Systems on Dairy Cow Welfare and Disease. EFSA J. 2009, 7, 1143. [Google Scholar] [CrossRef]
- Henriksen, J.C.S.; Weisbjerg, M.R.; Løvendahl, P.; Kristensen, T.; Munksgaard, L. Effects of an Individual Cow Concentrate Strategy on Production and Behavior. J. Dairy Sci. 2019, 102, 2155–2172. [Google Scholar] [CrossRef] [PubMed]
- Thorup, V.M.; Munksgaard, L.; Robert, P.-E.; Erhard, H.W.; Thomsen, P.T.; Friggens, N.C. Lameness Detection via Leg-Mounted Accelerometers on Dairy Cows on Four Commercial Farms. Animal 2015, 9, 1704–1712. [Google Scholar] [CrossRef]
- Caja, G.; Castro-Costa, A.; Knight, C.H. Engineering to Support Wellbeing of Dairy Animals. J. Dairy Res. 2016, 83, 136–147. [Google Scholar] [CrossRef]
- Brzozowska, A.; Łukaszewicz, M.; Sender, G.; Kolasińska, D.; Oprządek, J. Locomotor Activity of Dairy Cows in Relation to Season and Lactation. Appl. Anim. Behav. Sci. 2014, 156, 6–11. [Google Scholar] [CrossRef]
- Meneses, J.A.M.; de Sá, O.A.A.L.; Coelho, C.F.; Pereira, R.N.; Batista, E.D.; Ladeira, M.M.; Casagrande, D.R.; Gionbelli, M.P. Effect of Heat Stress on Ingestive, Digestive, Ruminal and Physiological Parameters of Nellore Cattle Feeding Low- or High-Energy Diets. Livest. Sci. 2021, 252, 104676. [Google Scholar] [CrossRef]
- Provolo, G.; Riva, E. One year study of lying and standing behaviour of dairy cows in a frestall barn in Italy. J. Agric. Eng. 2009, 40, 27–34. [Google Scholar] [CrossRef]
- Becker, C.A.; Collier, R.J.; Stone, A.E. Invited Review: Physiological and Behavioral Effects of Heat Stress in Dairy Cows. J. Dairy Sci. 2020, 103, 6751–6770. [Google Scholar] [CrossRef] [PubMed]
- Abeni, F.; Galli, A. Monitoring Cow Activity and Rumination Time for an Early Detection of Heat Stress in Dairy Cow. Int. J. Biometeorol. 2017, 61, 417–425. [Google Scholar] [CrossRef] [PubMed]
- Baumgard, L.H.; Rhoads, R.P. Effects of Heat Stress on Postabsorptive Metabolism and Energetics. Annu. Rev. Anim. Biosci. 2013, 1, 311–337. [Google Scholar] [CrossRef] [PubMed]
- West, J.W. Effects of Heat-Stress on Production in Dairy Cattle. J. Dairy Sci. 2003, 86, 2131–2144. [Google Scholar] [CrossRef] [PubMed]
- Chang-Fung-Martel, J.; Harrison, M.T.; Brown, J.N.; Rawnsley, R.; Smith, A.P.; Meinke, H. Negative Relationship between Dry Matter Intake and the Temperature-Humidity Index with Increasing Heat Stress in Cattle: A Global Meta-Analysis. Int. J. Biometeorol. 2021, 65, 2099–2109. [Google Scholar] [CrossRef]
- Qu, M.; Wei, S.; Chen, Z.; Wang, G.; Zheng, Y.; Yan, P. Differences of Hormones Involved in Adipose Metabolism and Lactation between High and Low Producing Holstein Cows during Heat Stress. Anim. Nutr. 2015, 1, 339–343. [Google Scholar] [CrossRef]
- Hill, D.L.; Wall, E. Weather Influences Feed Intake and Feed Efficiency in a Temperate Climate. J. Dairy Sci. 2017, 100, 2240–2257. [Google Scholar] [CrossRef]
- Webster, J.R.; Stewart, M.; Rogers, A.R.; Verkerk, G.A. Assessment of Welfare from Physiological and Behavioural Responses of New Zealand Dairy Cows Exposed to Cold and Wet Conditions. Anim. Welf. 2008, 17, 19–26. [Google Scholar] [CrossRef]
- Albright, J.L.; Alliston, C.W. Effects of Varying the Environment upon the Performance of Dairy Cattle. J. Anim. Sci. 1971, 32, 566–577. [Google Scholar] [CrossRef]
- Bouraoui, R.; Lahmar, M.; Majdoub, A.; Djemali, M.; Belyea, R. The Relationship of Temperature-Humidity Index with Milk Production of Dairy Cows in a Mediterranean Climate. Anim. Res. 2002, 51, 479–491. [Google Scholar] [CrossRef]
- Spiers, D.E.; Spain, J.N.; Sampson, J.D.; Rhoads, R.P. Use of Physiological Parameters to Predict Milk Yield and Feed Intake in Heat-Stressed Dairy Cows. J. Therm. Biol. 2004, 29, 759–764. [Google Scholar] [CrossRef]
- Montanholi, Y.R.; Odongo, N.E.; Swanson, K.C.; Schenkel, F.S.; McBride, B.W.; Miller, S.P. Application of Infrared Thermography as an Indicator of Heat and Methane Production and Its Use in the Study of Skin Temperature in Response to Physiological Events in Dairy Cattle (Bos Taurus). J. Therm. Biol. 2008, 33, 468–475. [Google Scholar] [CrossRef]
- Anderson, S.D.; Bradford, B.J.; Harner, J.P.; Tucker, C.B.; Choi, C.Y.; Allen, J.D.; Hall, L.W.; Rungruang, S.; Collier, R.J.; Smith, J.F. Effects of Adjustable and Stationary Fans with Misters on Core Body Temperature and Lying Behavior of Lactating Dairy Cows in a Semiarid Climate. J. Dairy Sci. 2013, 96, 4738–4750. [Google Scholar] [CrossRef]
- St-Pierre, N.R.; Cobanov, B.; Schnitkey, G. Economic Losses from Heat Stress by US Livestock Industries1. J. Dairy Sci. 2003, 86, E52–E77. [Google Scholar] [CrossRef]
- Bohmanova, J.; Misztal, I.; Cole, J.B. Temperature-Humidity Indices as Indicators of Milk Production Losses Due to Heat Stress. J. Dairy Sci. 2007, 90, 1947–1956. [Google Scholar] [CrossRef]
- Paterson, J.A.; Belyea, R.L.; Bowman, J.P.; Kerley, M.S.; Williams, J.E. The Impact of Forage Quality and Supplementation Regimen on Ruminant Animal Intake and Performance. In Forage Quality, Evaluation, and Utilization; John Wiley & Sons, Ltd.: Hoboken, NJ, USA, 1994; pp. 59–114. ISBN 978-0-89118-579-6. [Google Scholar]
- Dado, R.G.; Allen, M.S. Variation in and Relationships Among Feeding, Chewing, and Drinking Variables for Lactating Dairy Cows. J. Dairy Sci. 1994, 77, 132–144. [Google Scholar] [CrossRef] [PubMed]
- Allen, M.S. Relationship Between Fermentation Acid Production in the Rumen and the Requirement for Physically Effective Fiber. J. Dairy Sci. 1997, 80, 1447–1462. [Google Scholar] [CrossRef]
- Schneider, P.L.; Beede, D.K.; Wilcox, C.J. Nycterohemeral Patterns of Acid-Base Status, Mineral Concentrations and Digestive Function of Lactating Cows in Natural or Chamber Heat Stress Environments. J. Anim. Sci. 1988, 66, 112–125. [Google Scholar] [CrossRef]
- Kadzere, C.T.; Murphy, M.R.; Silanikove, N.; Maltz, E. Heat Stress in Lactating Dairy Cows: A Review. Livest. Prod. Sci. 2002, 77, 59–91. [Google Scholar] [CrossRef]
- McGuire, M.A.; Beede, D.K.; DeLorenzo, M.A.; Wilcox, C.J.; Huntington, G.B.; Reynolds, C.K.; Collier, R.J. Effects of Thermal Stress and Level of Feed Intake on Portal Plasma Flow and Net Fluxes of Metabolites in Lactating Holstein Cows. J. Anim. Sci. 1989, 67, 1050–1060. [Google Scholar] [CrossRef]
- Gao, S.T.; Guo, J.; Quan, S.Y.; Nan, X.M.; Fernandez, M.V.S.; Baumgard, L.H.; Bu, D.P. The Effects of Heat Stress on Protein Metabolism in Lactating Holstein Cows. J. Dairy Sci. 2017, 100, 5040–5049. [Google Scholar] [CrossRef] [PubMed]
- Afsal, A.; Sejian, V.; Bagath, M.; Krishnan, G.; Devaraj, C.; Bhatta, R. Heat Stress and Livestock Adaptation: Neuro-Endocrine Regulation. Int. J. Vet. Anim. Med. 2018, 1, 108. [Google Scholar]
- Renaudeau, D.; Collin, A.; Yahav, S.; de Basilio, V.; Gourdine, J.L.; Collier, R.J. Adaptation to Hot Climate and Strategies to Alleviate Heat Stress in Livestock Production. Animal 2012, 6, 707–728. [Google Scholar] [CrossRef]
- Ji, B.; Banhazi, T.; Perano, K.; Ghahramani, A.; Bowtell, L.; Wang, C.; Li, B. A Review of Measuring, Assessing and Mitigating Heat Stress in Dairy Cattle. Biosyst. Eng. 2020, 199, 4–26. [Google Scholar] [CrossRef]
- Hendricks, J.; Mills, K.E.; Sirovica, L.V.; Sundermann, L.; Bolton, S.E.; von Keyserlingk, M.A.G. Public Perceptions of Potential Adaptations for Mitigating Heat Stress on Australian Dairy Farms. J. Dairy Sci. 2022, 105, 5893–5908. [Google Scholar] [CrossRef]
- Schüller, L.-K.; Burfeind, O.; Heuwieser, W. Effect of Short- and Long-Term Heat Stress on the Conception Risk of Dairy Cows under Natural Service and Artificial Insemination Breeding Programs. J. Dairy Sci. 2016, 99, 2996–3002. [Google Scholar] [CrossRef]


| Ingredient | % |
|---|---|
| Corn silage | 25 |
| Alfalfa grass hay | 5 |
| Grass silage | 20 |
| Sugar beet pulp silage | 15 |
| Concentrate mash | 30 |
| Mineral mixture | 5 |
| Parameter | Composition |
|---|---|
| Dry matter (DM) | 48.8% |
| Neutral detergent fiber | 28.2% of DM |
| Acid detergent fiber | 19.8% of DM |
| Non-fiber carbs | 38.7% of DM |
| Crude protein | 15.8% of DM |
| Net energy for lactation | MJ/kg DM |
| Parameters | High (THI > 78) a | Medium (THI 72–78) b | Low (THI < 72) c | RMSE |
|---|---|---|---|---|
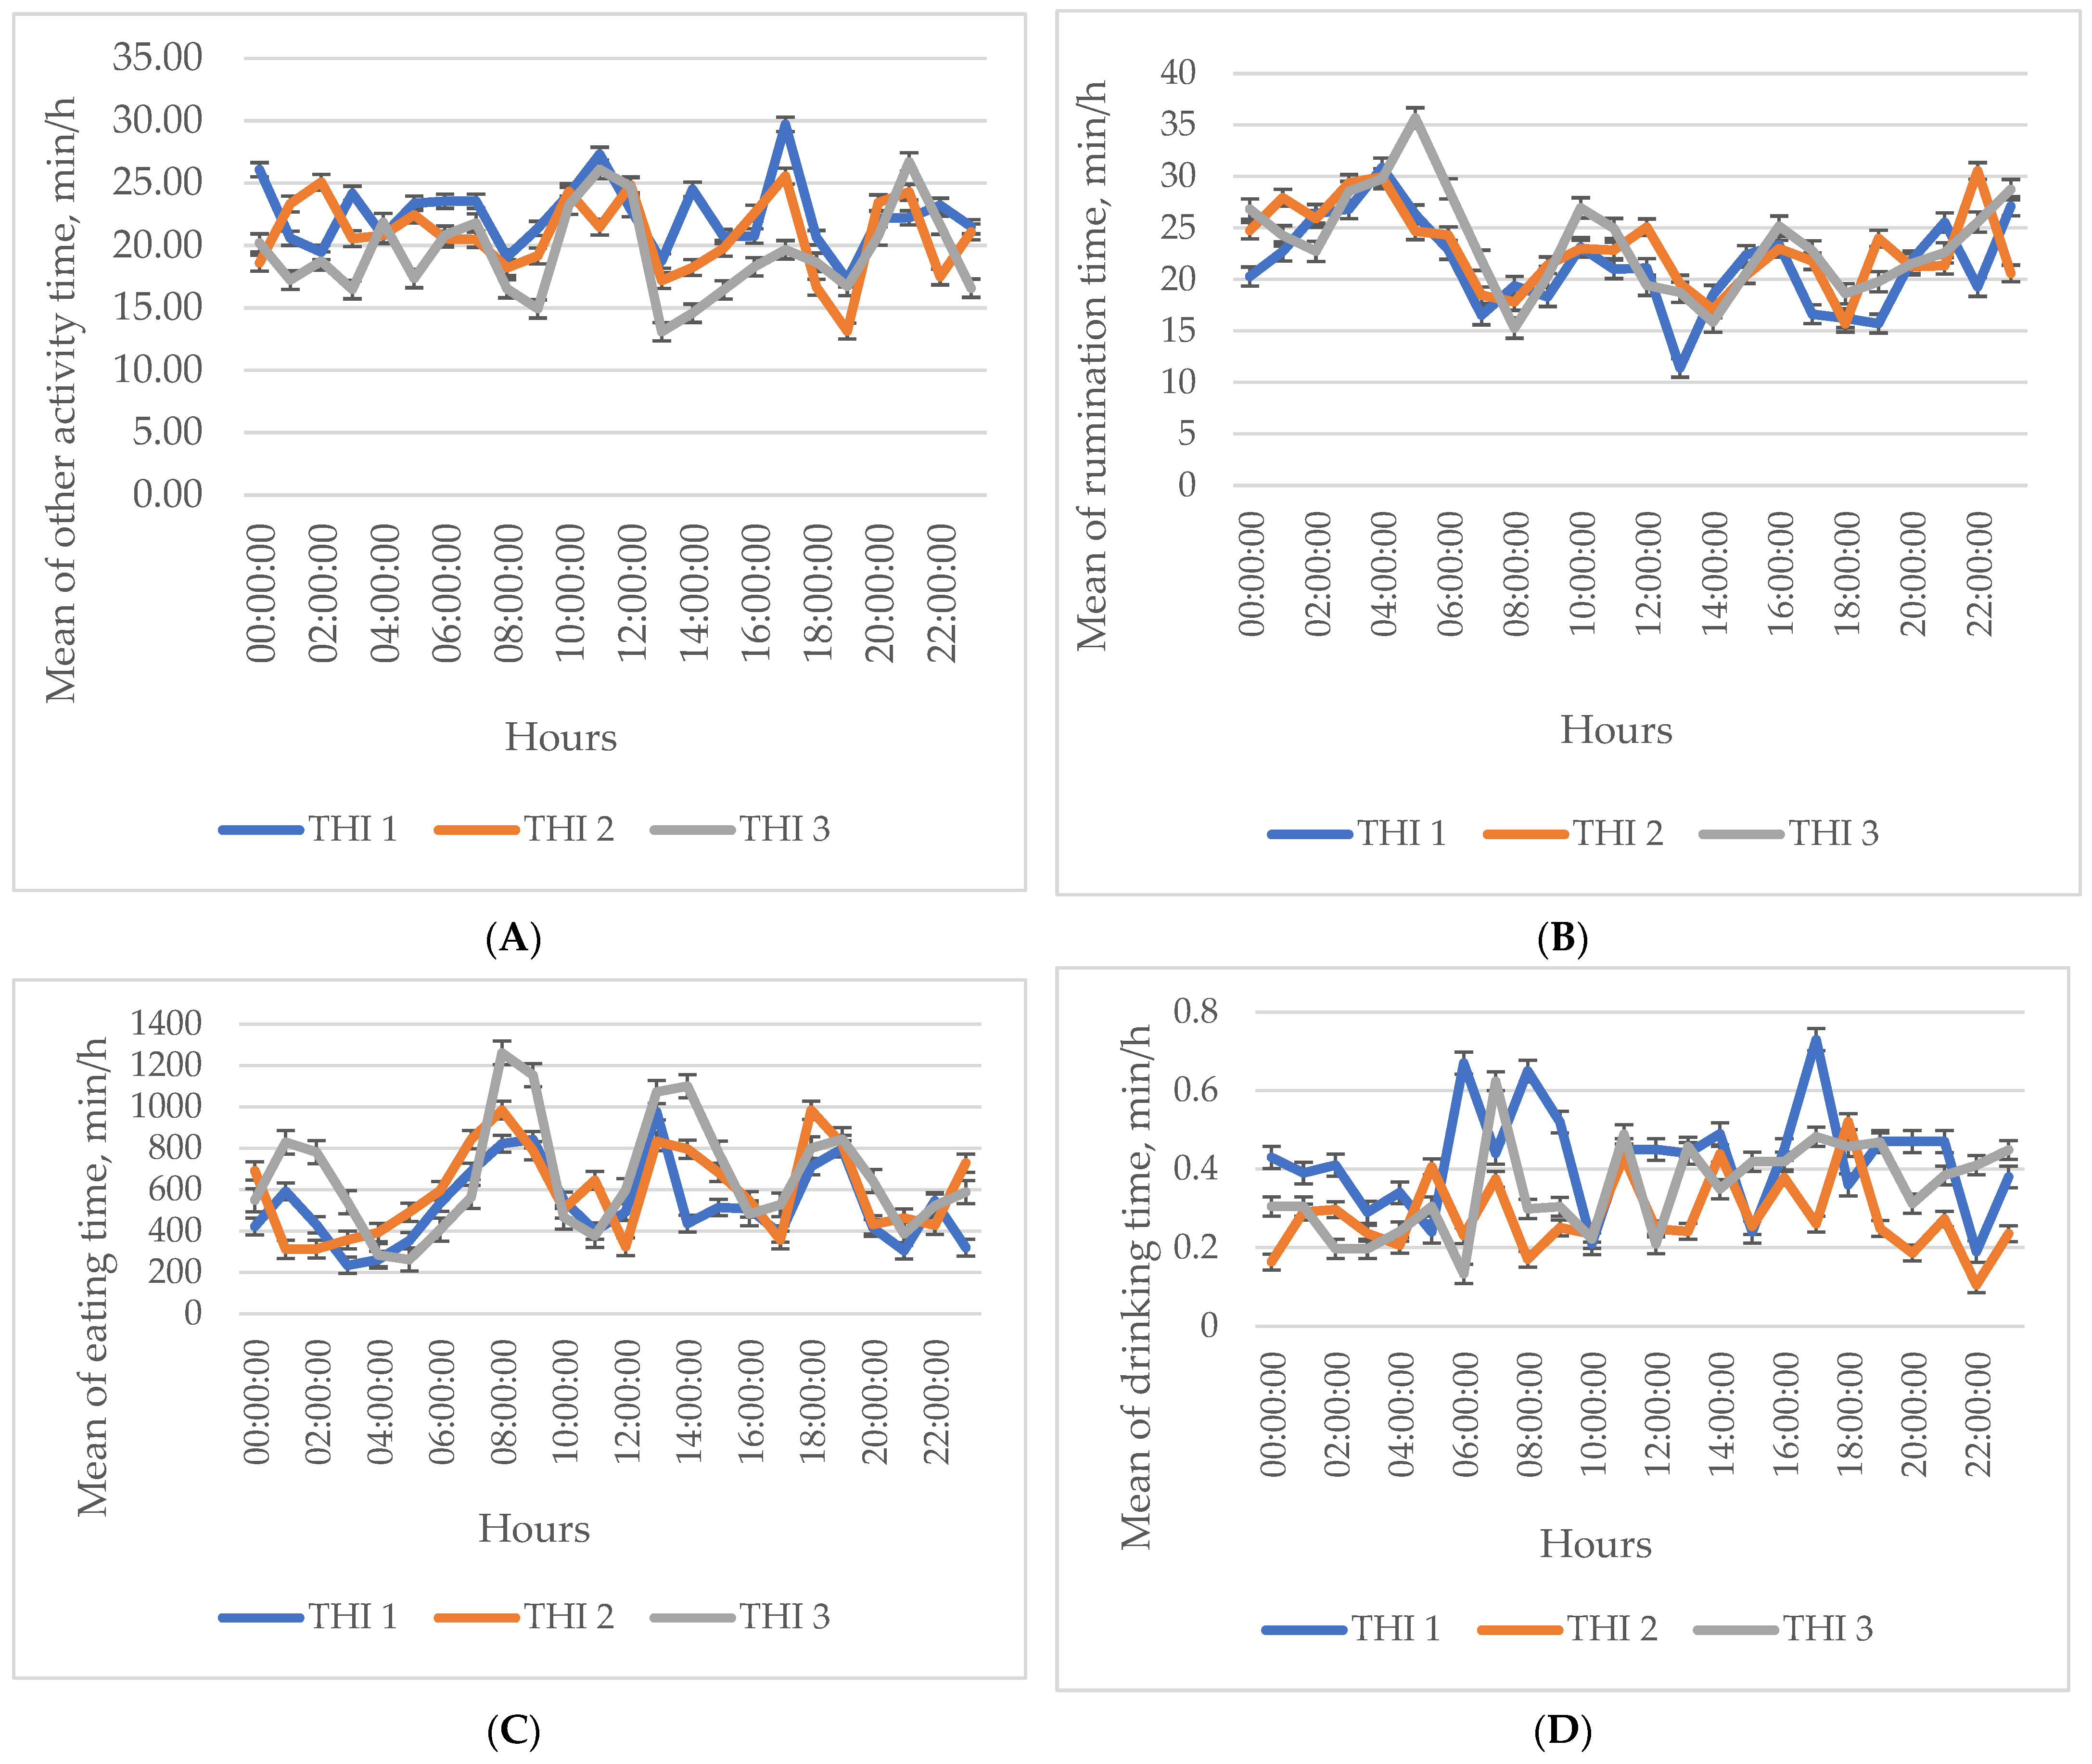
| Other activity time (min/h) | 22.80 c | 21.83 | 20.12 a | 0.71 |
| Rumination time (min/h) | 21.31 | 22.25 | 22.80 | 0.77 |
| Eat down time (min/h) | 7.20 c | 8.18 | 8.69 a | 0.49 |
| Eat up time (min/h) | 8.32 | 7.49 | 8.08 | 0.42 |
| Drink time (min/h) | 0.39 b | 0.27 a | 0.32 | 0.35 |
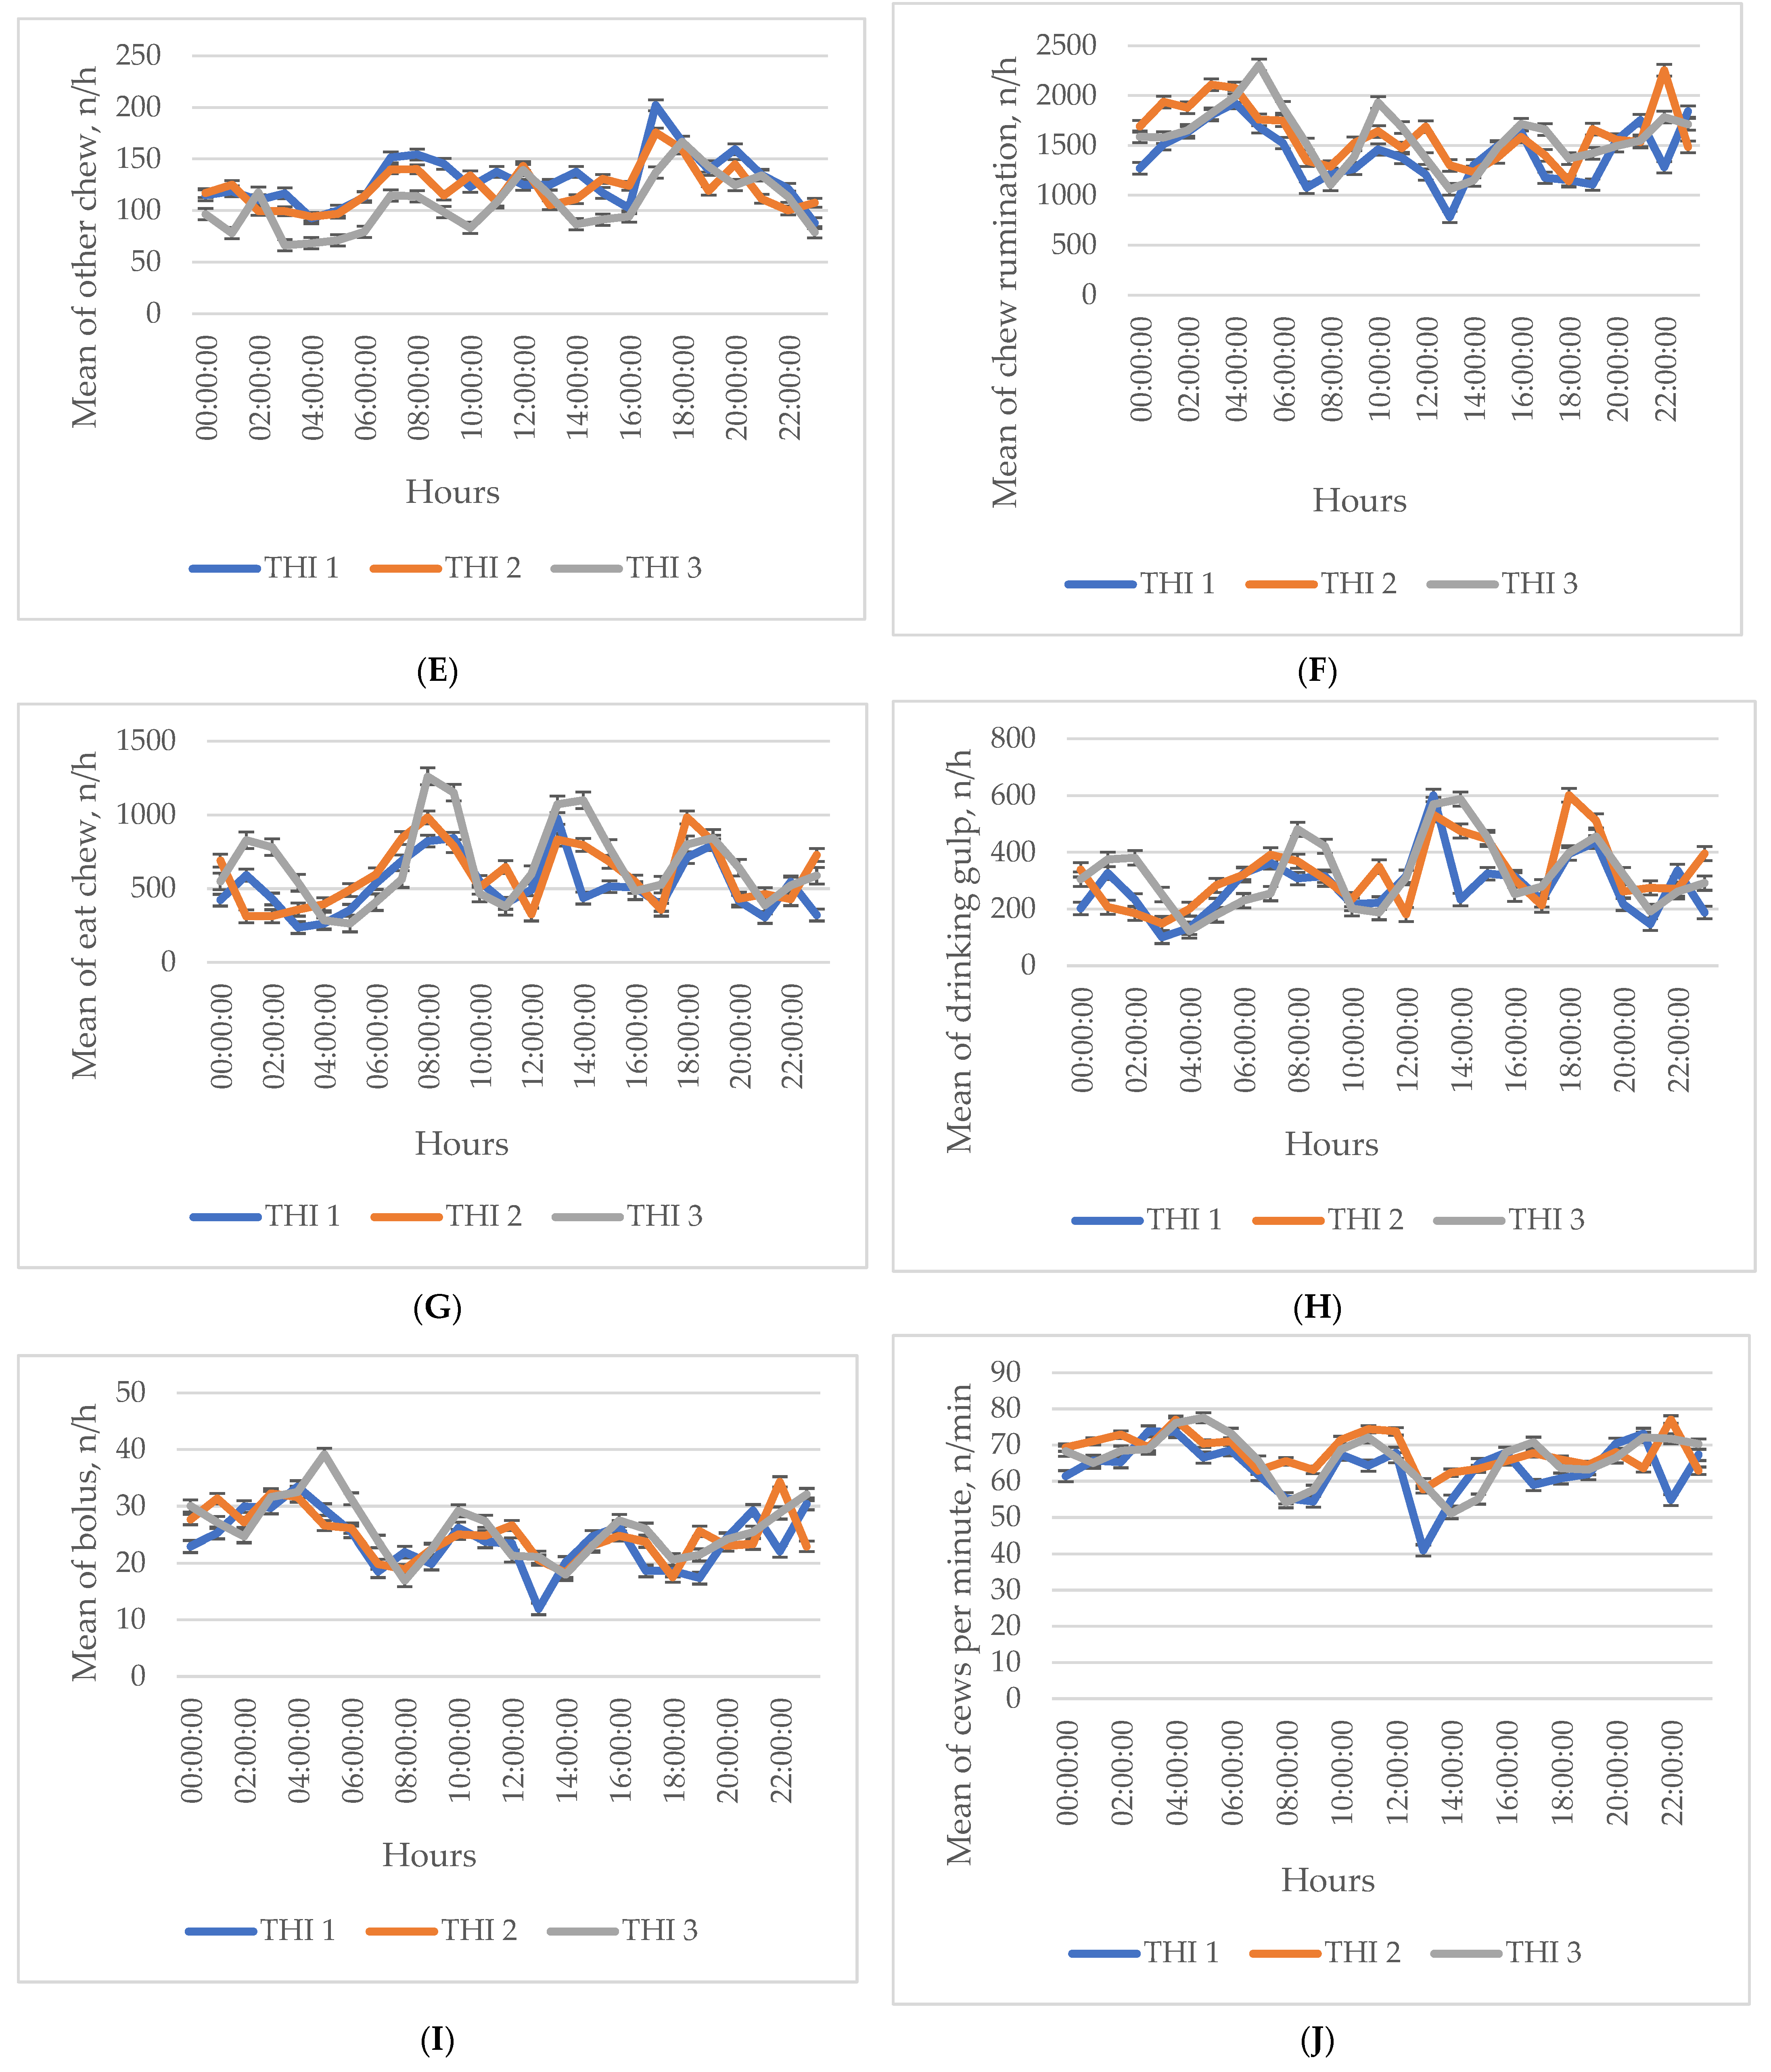
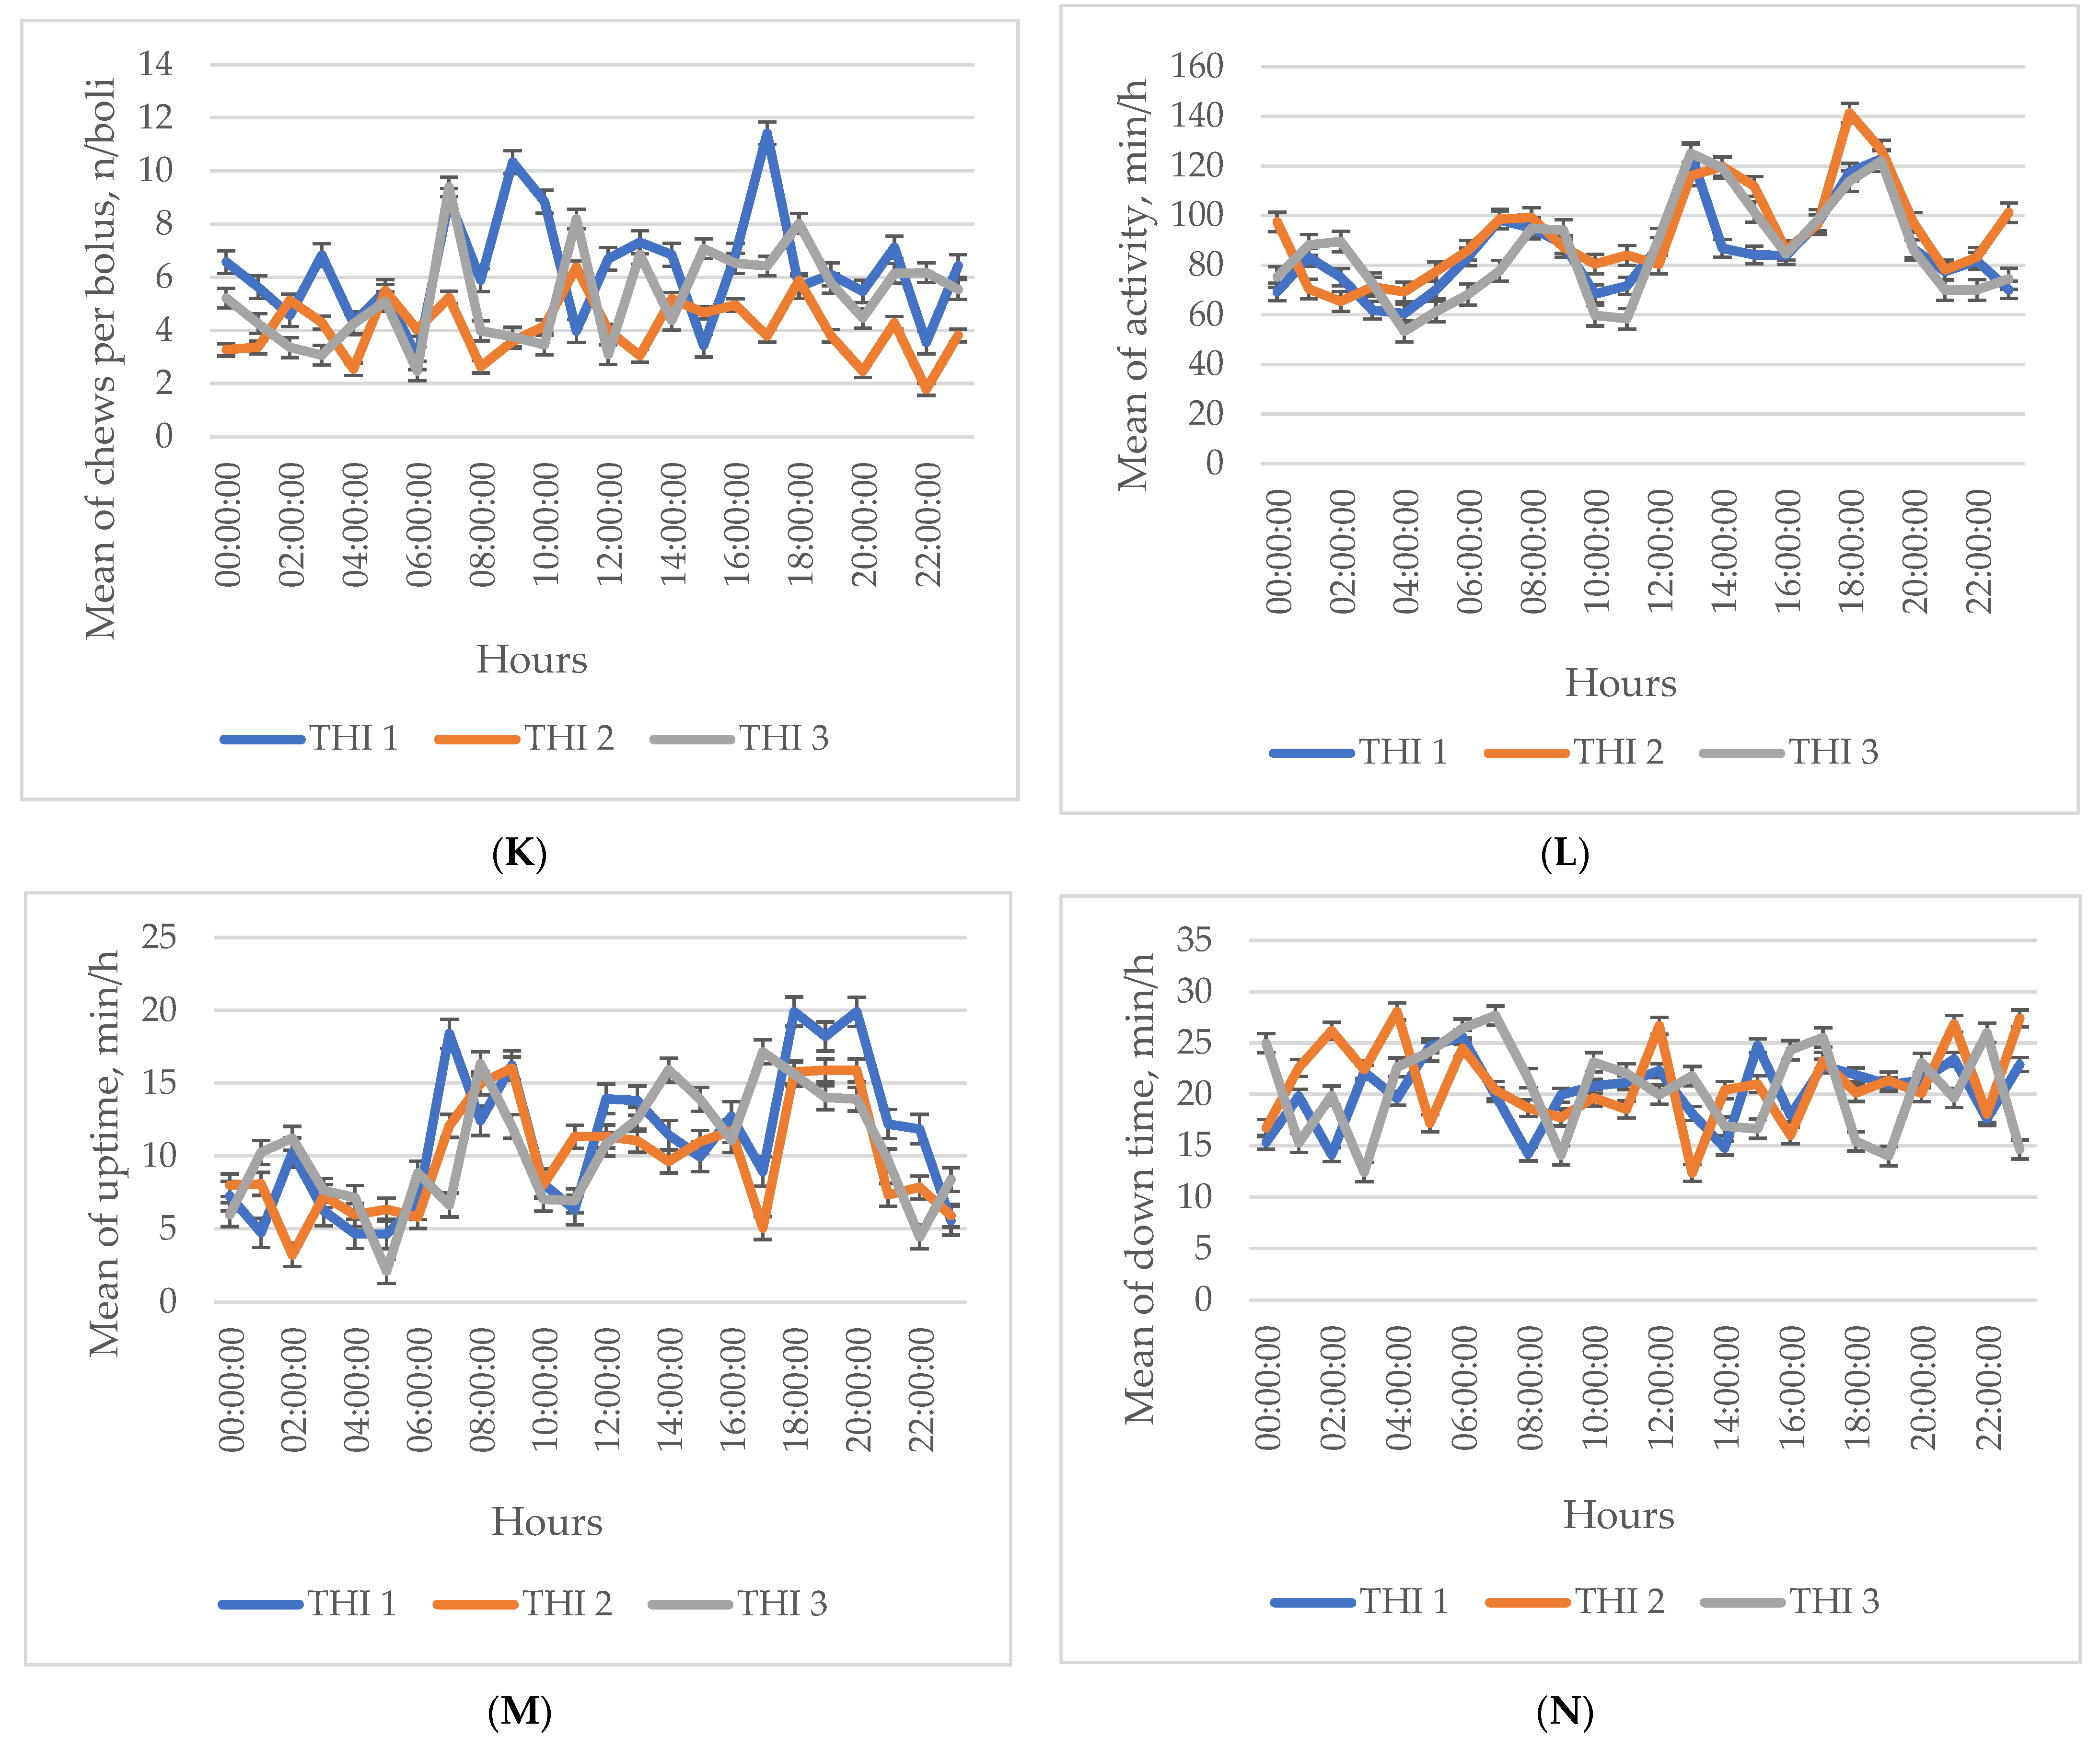
| Other chew (n/h) | 133.28 c | 127.30 c | 109.73 a,b | 0.49 |
| Rumination (n/h) | 1422.42 b | 1569.72 a | 1548.79 | 54.10 |
| Eat down chews (n/h) | 544.02 | 605.99 | 647.20 | 38.06 |
| Eat up chews (n/h) | 576.64 | 526.95 | 558.34 | 31.20 |
| Gulp (n/h) | 286.11 | 344.49 | 316.33 | 21.23 |
| Bolus (n/h) | 23.48 | 24.19 | 25.02 | 0.87 |
| Chews per minute (n/min) | 63.96 | 66.30 | 65.72 | 1.52 |
| Chews per bolus (n/boli) | 5.59 b | 3.91 a | 4.93 | 0.57 |
| Walking time (WT) (min/h) | 85.83 b | 96.65 a,c | 86.38 b | 2.80 |
| Up time (min/h) | 10.64 | 10.04 | 10.27 | 0.89 |
| Down time (min/h) | 21.02 | 20.58 | 20.43 | 1.06 |
| Activity change (min/h) | 7.80 | 7.07 | 8.11 | 0.24 |
| OAT | RT | EDT | EUT | DT | OC | CR | EDC | EUC | G | B | CPM | CPB | WT | UT | DT | AC | |
|---|---|---|---|---|---|---|---|---|---|---|---|---|---|---|---|---|---|
| THI group | −0.083 * | 0.054 ** | 0.069 * | −0.033 | −0.040 * | −0.103 * | 0.063 * | 0.072 * | −0.028 | 0.041 * | 0.047 * | 0.039 * | −0.039 * | 0.000 | −0.014 | 0.006 | −0.037 * |
| Blood Parameters | Risk of HS | |||
|---|---|---|---|---|
| High (THI > 78) a | Medium (THI 72–78) b | Low (THI < 72) c | RMSE | |
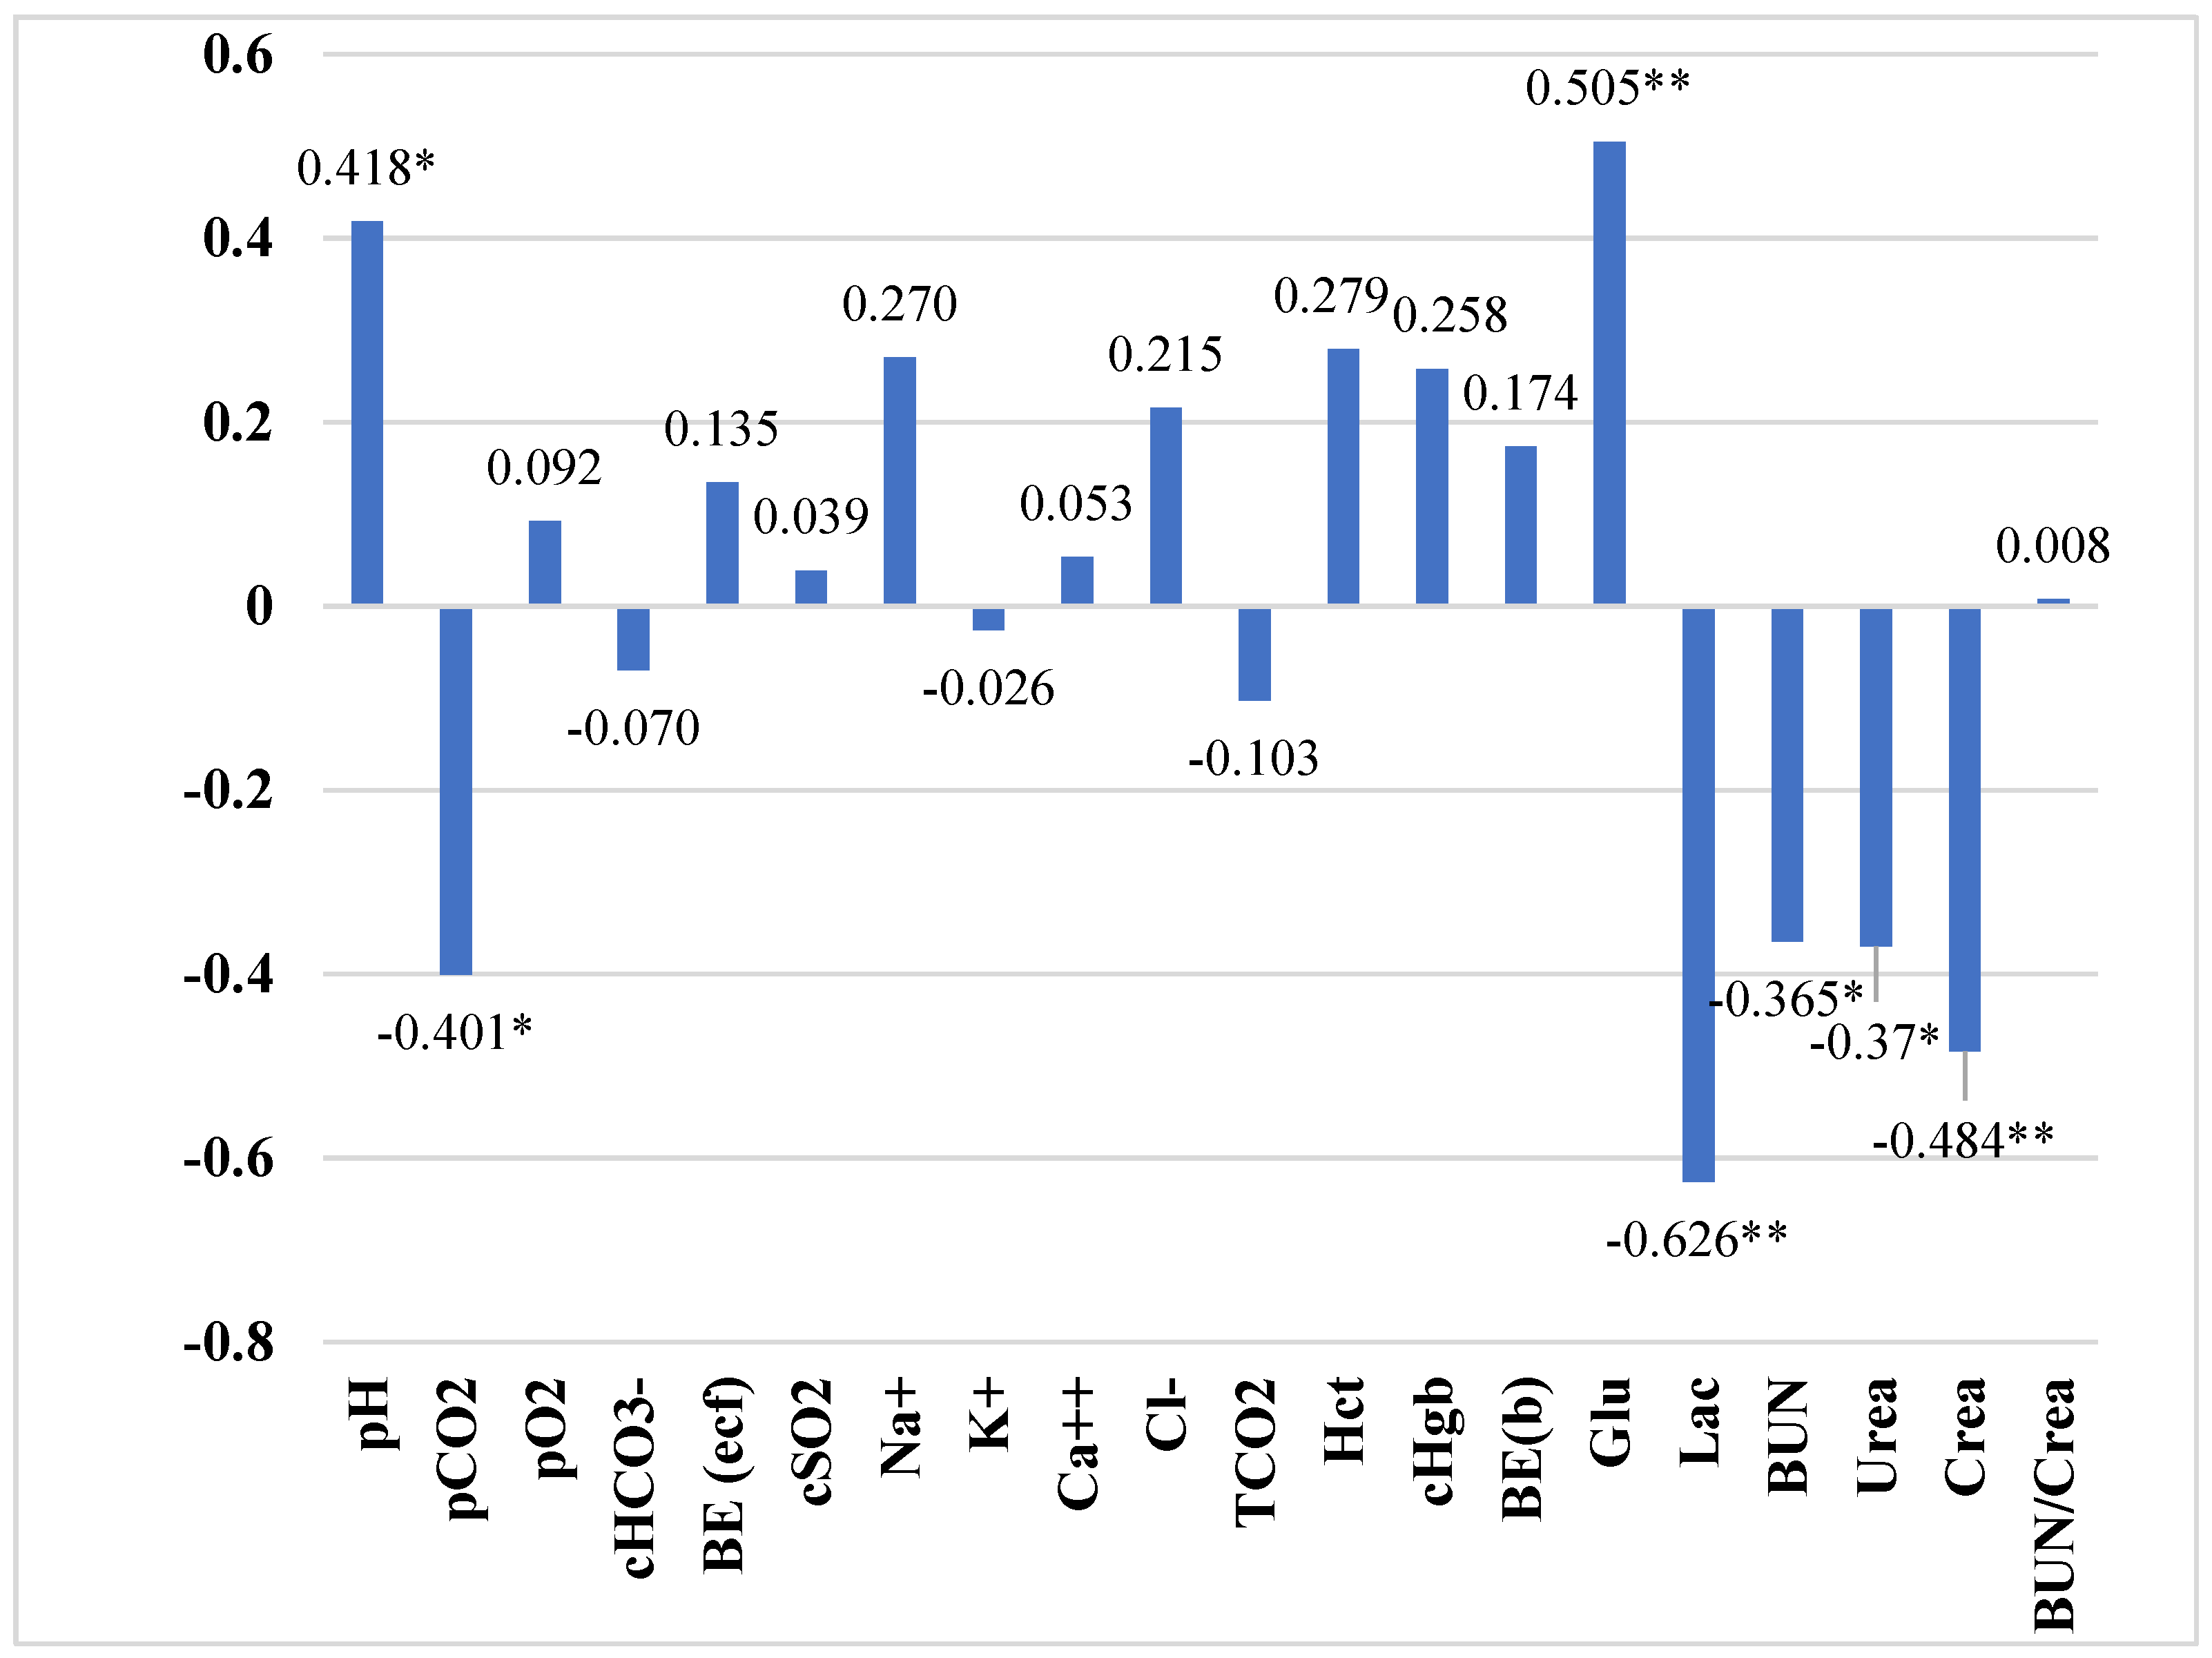
| pH | 7.41 ± 0.017 | 7.46 ± 0.019 | 7.47 ± 0.013 | 0.23 |
| pCO2 | 46.77 ± 1.850 | 41.17 ± 2.033 | 40.57 ± 1.773 | 2.67 |
| pO2 | 191.93 ± 9.683 | 153.83 ± 16.603 | 202.35 ± 6.586 | 19.35 |
| HCO3- | 29.52 ± 0.551 | 28.67 ± 0.541 | 29.21 ± 0.679 | 0.84 |
| BE (ecf) | 4.88 ± 0.644 | 4.74 ± 0.623 | 5.50 ± 0.584 | 0.87 |
| cSO2 | 99.59 ± 0.074 | 98.00 ± 0.851 | 99.75 ± 0.037 | 0.70 |
| Na+ | 135.30 ± 0.539 | 135.90 ± 0.690 | 136.50 ± 0.500 | 0.82 |
| K+ | 4.17 ± 0.086 | 4.02 ± 0.137 | 4.15 ± 0.069 | 0.14 |
| Ca++ | 1.18 ± 0.020 | 1.17 ± 0.025 | 1.19 ± 0.014 | 0.03 |
| Cl− | 100.70 ± 0.539 | 101.40 ± 0.748 | 101.70 ± 0.539 | 0.87 |
| TCO2 | 29.410 ± 0.546 | 28.450 ± 0.540 | 28.950 ± 0.688 | 0.84 |
| Hct | 25.30 ± 0.423 | 25.90 ± 0.657 | 26.40 ± 0.427 | 0.73 |
| cHgb | 8.66 ± 0.128 | 8.80 ± 0.230 | 8.98 ± 0.150 | 0.23 |
| BE(b) | 4.32 ± 0.591 | 4.350 ± 0.584 | 5.05 ± 0.504 | 0.79 |
| Glu | 3.01 ± 0.145 c | 3.12 ± 0.081 c | 3.45 ± 0.054 a,b | 0.14 |
| Lac | 2.03 ± 0.150 c | 1.45 ± 0.131 | 1.27 ± 0.086 a | 0.17 |
| BUN | 14.80 ± 0.814 b,c | 12.30 ± 0.700 a | 12.60 ± 0.670 a | 1.03 |
| Urea | 5.28 ± 0.287 b,c | 4.36 ± 0.249 a | 4.49 ± 0.230 a | 0.36 |
| Crea | 81.90 ± 1.616 | 77.60 ± 2.798 | 70.40 ± 3.661 | 3.99 |
| BUN/Crea | 15.96 ± 0.729 | 14.27 ± 1.288 | 16.02 ± 0.841 | 1.39 |
Disclaimer/Publisher’s Note: The statements, opinions and data contained in all publications are solely those of the individual author(s) and contributor(s) and not of MDPI and/or the editor(s). MDPI and/or the editor(s) disclaim responsibility for any injury to people or property resulting from any ideas, methods, instructions or products referred to in the content. |
© 2024 by the authors. Licensee MDPI, Basel, Switzerland. This article is an open access article distributed under the terms and conditions of the Creative Commons Attribution (CC BY) license (https://creativecommons.org/licenses/by/4.0/).
Share and Cite
Antanaitis, R.; Džermeikaitė, K.; Krištolaitytė, J.; Ribelytė, I.; Bespalovaitė, A.; Bulvičiūtė, D.; Palubinskas, G.; Anskienė, L. The Impacts of Heat Stress on Rumination, Drinking, and Locomotory Behavior, as Registered by Innovative Technologies, and Acid–Base Balance in Fresh Multiparous Dairy Cows. Animals 2024, 14, 1169. https://doi.org/10.3390/ani14081169
Antanaitis R, Džermeikaitė K, Krištolaitytė J, Ribelytė I, Bespalovaitė A, Bulvičiūtė D, Palubinskas G, Anskienė L. The Impacts of Heat Stress on Rumination, Drinking, and Locomotory Behavior, as Registered by Innovative Technologies, and Acid–Base Balance in Fresh Multiparous Dairy Cows. Animals. 2024; 14(8):1169. https://doi.org/10.3390/ani14081169
Chicago/Turabian StyleAntanaitis, Ramūnas, Karina Džermeikaitė, Justina Krištolaitytė, Ieva Ribelytė, Agnė Bespalovaitė, Deimantė Bulvičiūtė, Giedrius Palubinskas, and Lina Anskienė. 2024. "The Impacts of Heat Stress on Rumination, Drinking, and Locomotory Behavior, as Registered by Innovative Technologies, and Acid–Base Balance in Fresh Multiparous Dairy Cows" Animals 14, no. 8: 1169. https://doi.org/10.3390/ani14081169
APA StyleAntanaitis, R., Džermeikaitė, K., Krištolaitytė, J., Ribelytė, I., Bespalovaitė, A., Bulvičiūtė, D., Palubinskas, G., & Anskienė, L. (2024). The Impacts of Heat Stress on Rumination, Drinking, and Locomotory Behavior, as Registered by Innovative Technologies, and Acid–Base Balance in Fresh Multiparous Dairy Cows. Animals, 14(8), 1169. https://doi.org/10.3390/ani14081169