
External Hoof Measurements of Untrimmed and Unshod Mules in Northern Thailand

 , , , , , and
Abstract
Simple Summary
Abstract
1. Introduction
2. Materials and Methods
2.1. Research Ethics
2.2. Study Design and Sample Population
2.3. Data Collection
2.3.1. Photographic Method
2.3.2. Image Analysis
2.3.3. Accuracy
2.4. Statistical Analysis
3. Results
3.1. Conformational Measurement
3.2. Forelimb Hoof Measurement and Body Condition Scores
4. Discussion
4.1. Conformation
4.2. Symmetries in Left and Right Forelimbs
4.3. Hoof Symmetry
4.4. Comparison of the External Hoof Characteristics Stratified by Body Condition Scores
5. Conclusions
Author Contributions
Funding
Institutional Review Board Statement
Informed Consent Statement
Data Availability Statement
Acknowledgments
Conflicts of Interest
References
- Brosnahan, M.M. Genetics, Evolution, and Physiology of Donkeys and Mules. Vet. Clin. N. Am. Equine Pract. 2019, 35, 457–467. [Google Scholar] [CrossRef] [PubMed]
- Goodrich, E.L.; Behling-Kelly, E. Clinical Pathology of Donkeys and Mules. Vet. Clin. N. Am. Equine Pract. 2019, 35, 433–455. [Google Scholar] [CrossRef] [PubMed]
- Neves, E.S.; Chiarini-Garcia, H.; França, L.R. Comparative Testis Morphometry and Seminiferous Epithelium Cycle Length in Donkeys and Mules. Biol. Reprod. 2002, 67, 247–255. [Google Scholar] [CrossRef] [PubMed][Green Version]
- Norris, S.L.; Little, H.A.; Ryding, J.; Raw, Z. Global Donkey and Mule Populations: Figures and Trends. PLoS ONE 2021, 16, e0247830. [Google Scholar] [CrossRef] [PubMed]
- Ali, A.; Orion, S.; Tesfaye, T.; Zambriski, J.A. The Prevalence of Lameness and Associated Risk Factors in Cart Mules in Bahir Dar, Ethiopia. Trop. Anim. Health Prod. 2016, 48, 1483–1489. [Google Scholar] [CrossRef] [PubMed]
- Savory, T.H. The mule. Sci. Am. 1970, 223, 102–109. [Google Scholar] [CrossRef]
- Celani, G.; Robbe, D.; Martucci, P.; Petrizzi, L.; Stratico, P.; Carluccio, A. “Iron and Fire”: History and Advances of Mule Shoeing. Large Anim. Rev. 2021, 27, 215–220. [Google Scholar]
- Watson, T.; Kubasiewicz, L.M.; Nye, C.; Thapa, S.; Norris, S.L.; Chamberlain, N.; Burden, F.A. “Not All Who Wander Are Lost”: The Life Transitions and Associated Welfare of Pack Mules Walking the Trails in the Mountainous Gorkha Region, Nepal. Animals 2022, 12, 3152. [Google Scholar] [CrossRef] [PubMed]
- Silva, G.A.O.; Rodrigues, L.M.; Monteiro, B.S.; de Souza, V.R.C.; Filho, H.C.S.; Coelho, C.S. Effect of a Marcha Field Test on Some Blood and Electrocardiographic Parameters of Mules. J. Equine Vet. Sci. 2018, 70, 42–47. [Google Scholar] [CrossRef]
- Reilly, J.D. “No Hoof No Horse?”. J. Equine Vet. Sci. 1995, 27, 166–168. [Google Scholar] [CrossRef]
- Souza, A.F.; Kunz, J.R.; Laus, R.; Moreira, M.A.; Muller, T.R.; Fonteque, J.H. Biometrics of Hoof Balance in Equids. Arq. Bras. Med. Vet. Zootec. 2016, 68, 825–831. [Google Scholar] [CrossRef]
- Eliashar, E.; Mcguigan, M.P.; Wilson, A.M. Relationship of Foot Conformation and Force Applied to the Navicular Bone of Sound Horses at the Trot. Equine Vet. J. 2004, 36, 431–435. [Google Scholar] [CrossRef] [PubMed]
- Lizarraga, I.; Janovyak, E. Comparison of the Mechanical Hypoalgesic Effects of Five Alpha2-Adrenoceptor Agonists in Donkeys. Vet. Rec. 2013, 173, 294. [Google Scholar] [CrossRef] [PubMed]
- Grosenbaugh, D.A.; Reinemeyer, C.R.; Figueiredo, M.D. Pharmacology and Therapeutics in Donkeys. Equine Vet. Educ. 2011, 23, 523–530. [Google Scholar] [CrossRef]
- Dyson, S.J.; Tranquille, C.A.; Collins, S.N.; Parkin, T.D.; Murray, R.C. External Characteristics of the Lateral Aspect of the Hoof Differ Between Non-Lame and Lame Horses. Vet. J. 2011, 190, 364–371. [Google Scholar] [CrossRef]
- Gordon, S.; Rogers, C.; Weston, J.; Bolwell, C.; Doloonjin, O. The Forelimb and Hoof Conformation in a Population of Mongolian Horses. J. Equine Vet. Sci. 2013, 33, 90–94. [Google Scholar] [CrossRef]
- Wilson, A.; Agass, R.; Vaux, S.; Sherlock, E.; Day, P.; Pfau, T.; Weller, R. Foot Placement of the Equine Forelimb: Relationship Between Foot Conformation, Foot Placement and Movement Asymmetry. Equine Vet. J. 2016, 48, 90–96. [Google Scholar] [CrossRef]
- Labuschagne, W.; Rogers, C.W.; Gee, E.K.; Bolwell, C.F. A Cross-Sectional Survey of Forelimb Hoof Conformation and the Prevalence of Flat Feet in a Cohort of Thoroughbred Racehorses in New Zealand. J. Equine Vet. Sci. 2017, 51, 1–7. [Google Scholar] [CrossRef]
- Dyson, S.J.; Tranquille, C.A.; Collins, S.N.; Parkin, T.D.; Murray, R.C. An Investigation of the Relationships Between Angles and Shapes of the Hoof Capsule and the Distal Phalanx. Equine Vet. J. 2011, 43, 295–301. [Google Scholar] [CrossRef]
- Mostafa, M.B.; Abdelgalil, A.I.; Farhat, S.F.; Raw, Z.; Kubasiewicz, L.M. Morphometric Measurements of the Feet of Working Donkeys Equus Asinus in Egypt. J. Equine Vet. Sci. 2020, 31, 17–22. [Google Scholar] [CrossRef]
- Turner, T.A. The Use of Hoof Measurements for the Objective Assessment of Hoof Balance. In Proceedings of the Annual Convention of the American Association of Equine Practitioners, San Antonio, TX, USA, 5–8 December 1993; pp. 389–395. [Google Scholar]
- Moyer, W.A.; Carter, G.K. Examination of the Equine Foot. In Equine Podiatry, 1st ed.; Floyd, A.E., Mansmann, R.A., Eds.; Elsevier: Philadelphia, PA, USA, 2007; pp. 112–127. [Google Scholar]
- Balch, O.; White, K.; Butler, D. Factors Involved in the Balancing of Equine Hooves. J. Am. Vet. Med. Assoc. 1991, 198, 1980–1989. [Google Scholar] [CrossRef] [PubMed]
- O’Grady, S.E.; Poupard, D.A. Physiological Horseshoeing: An Overview. Equine Vet. Educ. 2001, 13, 330–334. [Google Scholar] [CrossRef]
- Moleman, M.; van Heel, M.C.V.; van den Belt, A.J.M.; Back, W. Accuracy of Hoof Angle Measurement Devices in Comparison with Digitally Analysed Radiographs. Equine Vet. Educ. 2005, 17, 319–322. [Google Scholar] [CrossRef]
- Broster, C.E.; Burn, C.C.; Barr, A.R.; Whay, H.R. The Range and Prevalence of Pathological Abnormalities Associated with Lameness in Working Horses from Developing Countries. Equine Vet. J. 2009, 41, 474–481. [Google Scholar] [CrossRef] [PubMed]
- Reix, C.E.; Dikshit, A.K.; Hockenhull, J.; Parker, R.M.A.; Banerjee, A.; Burn, C.C.; Pritchard, J.C.; Whay, H.R. A Two-Year Participatory Intervention Project with Owners to Reduce Lameness and Limb Abnormalities in Working Horses in Jaipur, India. PLoS ONE 2015, 10, e0124342. [Google Scholar] [CrossRef] [PubMed]
- McLean, A.; Varnum, A.; Ali, A.; Heleski, C.; Navas González, F.J. Comparing and Contrasting Knowledge on Mules and Hinnies as a Tool to Comprehend Their Behavior and Improve Their Welfare. Animal 2019, 9, 488. [Google Scholar] [CrossRef]
- Pritchard, J.C.; Lindberg, A.C.; Main, D.C.; Whay, H.R. Assessment of The Welfare of Working Horses, Mules and Donkeys, Using Health and Behaviour Parameters. Prev. Vet. Med. 2005, 69, 265–283. [Google Scholar] [CrossRef] [PubMed]
- Florence, L.; McDonnell, S.M. Hoof Growth and Wear of Semi-Feral Ponies During an Annual Summer ‘Self-Trimming’ Period. Equine Vet. J. 2006, 38, 642–645. [Google Scholar] [CrossRef] [PubMed][Green Version]
- Phannithi, T.; Cherdchutham, W.; Laikul, A.; Pathomsakulwong, W.; Rungsri, P. Hoof disorders of Mules in Northern Thailand. In Proceedings of the 22nd Chulalongkorn University Veterinary Conference CUVC 2023: Accelerating Impactful Innovative Research for Global Health, Food Security & Pet Wellness, Bangkok, Thailand, 19–21 April 2023. Thai J. Vet. Med. 2023, 53, 253–255. [Google Scholar]
- Khan, R.Z.U.; Rosanowski, S.M.; Parkes, R.S.V. Hoof Morphometry in a Population of Lame and Nonlame Working Donkeys in Pakistan. Equine Vet. J. 2023, 55, 435–445. [Google Scholar] [CrossRef]
- Carroll, C.L.; Huntington, P.J. Body Condition Scoring and Weight Estimation of Horses. Equine Vet. J. 1988, 20, 41–45. [Google Scholar] [CrossRef] [PubMed]
- Cruz, C.; Thomason, J.J.; Faramarzi, B.; Bignell, W.W.; Sears, W.R.; Dobson, H.; Konyer, N. Changes in Shape of the Standardbred Distal Phalanx and Hoof Capsule in Response to Exercise. Equine Comp. Exerc. Physiol. 2006, 3, 199–208. [Google Scholar] [CrossRef]
- Hampson, B.A.; Ramsey, G.; Macintosh, A.M.; Mills, P.C.; de Laat, M.A.; Pollitt, C.C. Morphometry and Abnormalities of the Feet of Kaimanawa Feral Horses in New Zealand. Aust. Vet. J. 2010, 88, 124–131. [Google Scholar] [CrossRef] [PubMed]
- White, J.M.; Mellor, D.J.; Duz, M.; Lischer, C.J.; Voute, L.C. Diagnostic Accuracy of Digital Photography and Image Analysis for the Measurement of Foot Conformation in the Horse. Equine Vet. J. 2008, 40, 623–628. [Google Scholar] [CrossRef] [PubMed]
- Thiemann, A.; Rickards, K.J. Donkey Hoof Disorders and Their Treatment. Practice 2013, 35, 134–140. [Google Scholar] [CrossRef]
- Thiemann, A.K.; Poore, L.A. Hoof Disorders and Farriery in the Donkey. Vet. Clin. N. Am. Equine Pract. 2019, 35, 643–658. [Google Scholar] [CrossRef] [PubMed]
- Cust, A.R.; Anderson, G.A.; Whitton, R.C.; Davies, H.M. Hoof Conformation and Performance in the Racing Thoroughbred in Macau. Aust. Vet. J. 2013, 91, 108–112. [Google Scholar] [CrossRef]
- Hampson, B.A.; de Laat, M.A.; Mills, P.C.; Pollitt, C.C. The Feral Horse Foot. Part A: Observational Study of the Effect of Environment on the Morphometrics of the Feet of 100 Australian Feral Horses. Aust. Vet. J. 2013, 91, 14–22. [Google Scholar] [CrossRef] [PubMed]
- Kauffmann, S.; Cline, C. The Essential Hoof Book, 1st ed.; Trafalgar Square Books: North Pomfret, VT, USA, 2017; p. 548. [Google Scholar]
- Craig, M. A Modern Look at The Hoof, 1st ed.; Outskirts Press, Inc.: Parker, CO, USA, 2015; p. 337. [Google Scholar]
- Casanova, P.M.; Oosterlinck, M. Hoof Size and Symmetry in Young Catalan Pyrenean Horses Reared Under Semi-Extensive Conditions. J. Equine Vet. Sci. 2012, 32, 231–234. [Google Scholar] [CrossRef]
- Turner, T.A. Examination of the Equine Foot. Vet. Clin. Equine 2003, 19, 309–332. [Google Scholar] [CrossRef]
- Van Heel, M.C.; Barneveld, A.; van Weeren, P.R.; Back, W. Dynamic Pressure Measurements for the Detailed Study of Hoof Balance: The Effect of Trimming. Equine Vet. J. 2004, 36, 778–782. [Google Scholar] [CrossRef] [PubMed]
- O’Grady, S.E.; Poupard, D.A. Proper Physiologic Horseshoeing. Vet. Clin. Equine 2003, 19, 333–351. [Google Scholar] [CrossRef]
- Stashak, T.S. Avulsion Injuries of the Foot. In Adams Lameness in Horses, 5th ed.; Williams & Wilkins: Baltimore, MD, USA, 2002; pp. 725–732. [Google Scholar]
- Parks, A.H.; Ovnicek, G.; Sigafoos, R. The Foot and Shoeing, in Diagnosis and Management of Lameness in the Horse; Elsevier: St. Louis, MO, USA, 2003; pp. 250–275. [Google Scholar]
- Craig, M. The Value of Measuring the Hoof. In TrailBlazer Magzine; 2008; Available online: https://ifpe-ouest.fr/wp-content/uploads/2021/01/Value_of_Measuring.pdf (accessed on 29 April 2022).
- Clayton, H.M.; Gray, S.; Kaiser, L.J.; Bowker, R.M. Effects of Barefoot Trimming on Hoof Morphology. Aust. Vet. J. 2011, 89, 305–311. [Google Scholar] [CrossRef] [PubMed]
- McClinchey, H.L.; Thomason, J.J.; Jofriet, J.C. Isolating the Effects of Equine Hoof Shape Measurements on Capsule Strain with Finite Element Analysis. Vet. Comp. Orthop. Traumatol. 2003, 16, 67–75. [Google Scholar] [CrossRef]
- Thomason, J.J. Variation in Surface Strain on the Equine Hoof Wall at the Midstep with Shoeing, Gait, Substrate, Direction of Travel, and Hoof Shape. Equine Vet. J. Suppl. 1998, 26, 86–95. [Google Scholar] [CrossRef] [PubMed]
- Ovnicek, G.D.; Page, B.T.; Trotter, G.W. Natural Balance Trimming and Shoeing: Its Theory and Application. Vet. Clin. N. Am. Equine Pract. 2003, 19, 353–377. [Google Scholar] [CrossRef] [PubMed]
- Leśniak, K.; Whittington, L.; Mapletoft, S.; Mitchell, J.; Hancox, K.; Draper, S.; Williams, J. The Influence of Body Mass and Height on Equine Hoof Conformation and Symmetry. J. Equine Vet. Sci. 2019, 77, 43–49. [Google Scholar] [CrossRef] [PubMed]
- Van Heel, M.C.; van Dierendonck, M.C.; Kroekenstoel, A.M.; Back, W. Lateralised Motor Behaviour Leads to Increased Unevenness in Front Feet and Asymmetry in Athletic Performance in Young Mature Warmblood Horses. Equine Vet. J. 2010, 42, 444–450. [Google Scholar] [CrossRef]
- Souza, A.F.; Souza Junior, A.A. Relationship Between Body Mass and the Hoof Area: Understanding the Turner’s Formula. J. Equine Vet. Sci. 2021, 103, 103682. [Google Scholar] [CrossRef]
- Casanova, P.M. A Nonlinear Model for Estimating Hoof Surface Area in Unshod Meat-type Horses. J. Equine Vet. Sci. 2011, 31, 379–382. [Google Scholar] [CrossRef]


| Variable | Abbreviation | Description of Measurement |
|---|---|---|
| Angular parameters | ||
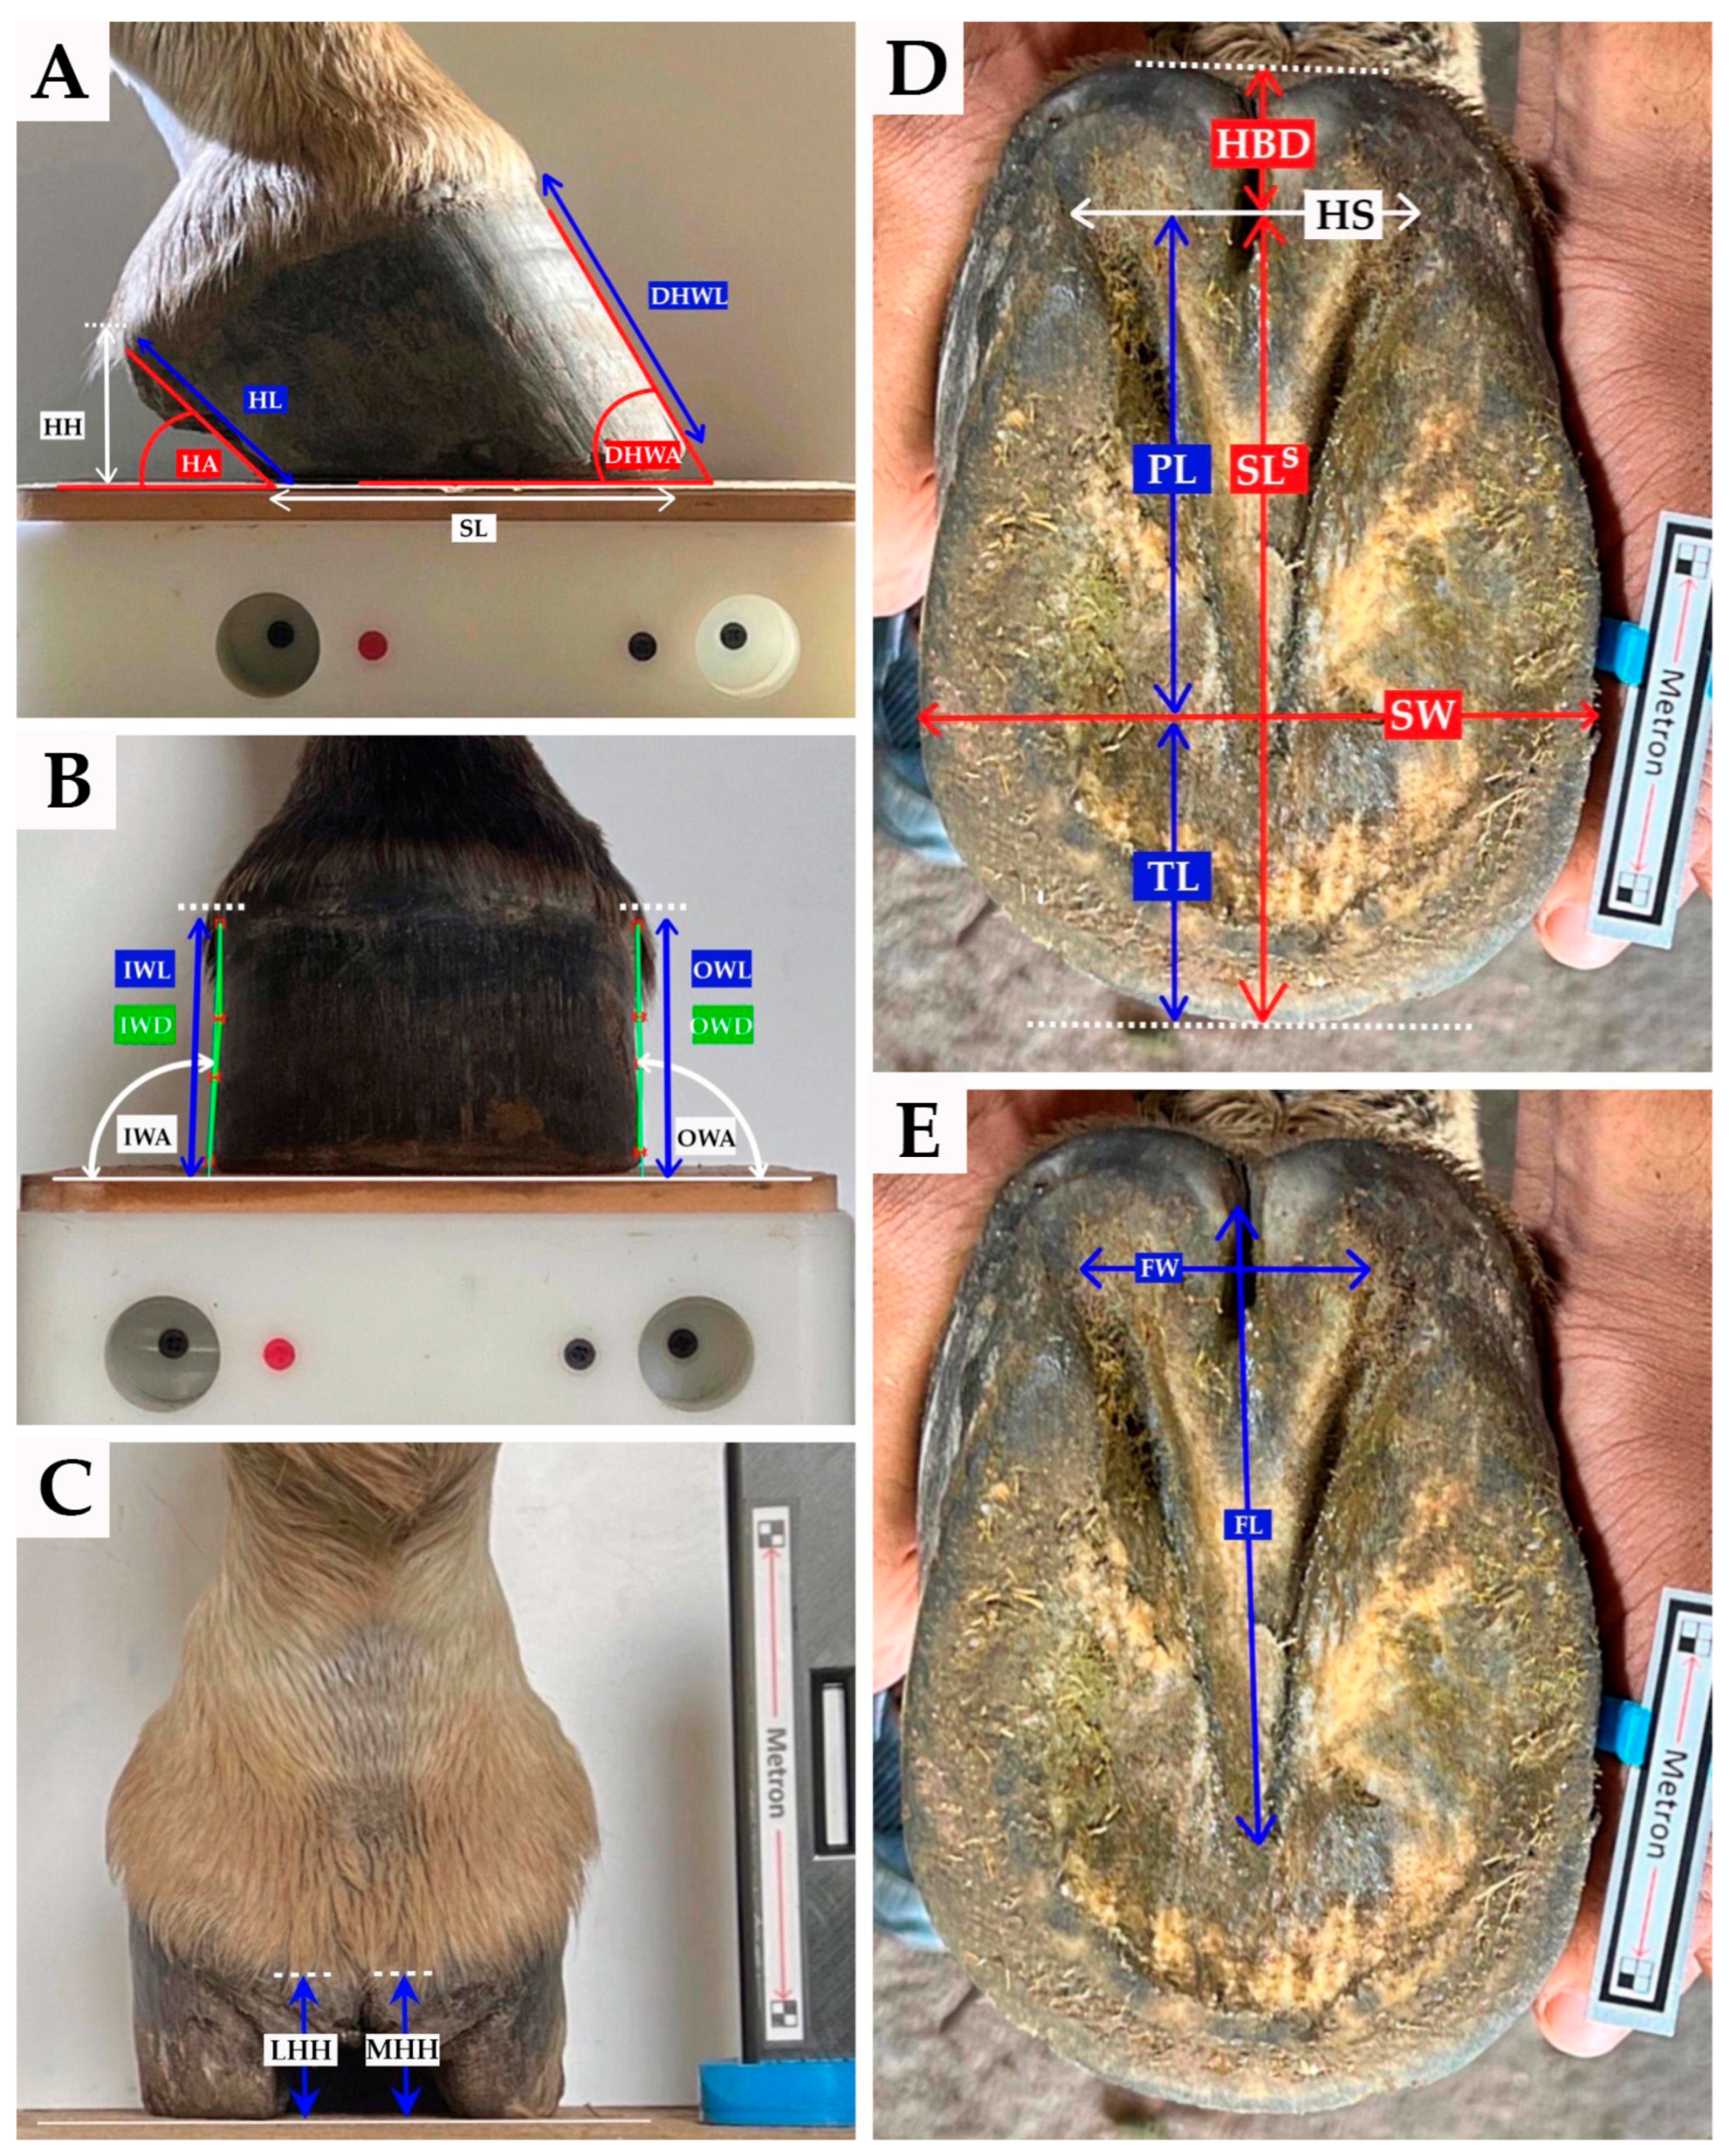
| Dorsal hoof wall angle | DHWA | Angle subtended between the dorsal hoof wall and the ground surface. |
| Heel angle | HA | Angle subtended between the palmar aspect of the hoof and the ground surface. |
| Outer wall angle | OWA | Angle subtended between the dorsal lateral angle between the abaxial aspects of the hoof wall, in dorsal view. |
| Inner wall angle | IWA | Angle subtended between the dorsal medial angle between the abaxial aspects of the hoof wall, in dorsal view. |
| Linear parameters | ||
| Dorsal hoof wall length | DHWL | Length from the hairline along the dorsal surface of dorsal hoof wall to the tip of the hoof. |
| Heel height | HH | Vertical distance between the palmar aspect of the lateral heel at the level of the coronary band and the ground surface. |
| Heel length | HL | Linear length of palmar hoof wall to the distal limit of the palmar hoof wall at the weight bearing boarder. |
| Support length | SL | Horizontal distance between the dorsal-most point and the palmar-most point of weight-bearing surfaces of the foot, in lateral view. |
| Heel separation | HS | Horizontal distance between the heel points support that are on the hoof wall (the distance between the heel points). |
| Heel bulb distance | HBD | Linear distance from the heel to the torus ungulae. |
| Sole width | SW | Linear distance between the widest point of the sole. |
| Sole length | SLS | Vertical distance between the center of the toe to the heel buttress line (excluding the heel bulb), in solar view. |
| Toe length | TL | Linear distance of the center of the toe (solar view) to the center of the widest point of the sole. |
| Palmar length | PL | Linear distance between the center of the widest part of the sole to the center of the heel separation. |
| Frog width | FW | Linear distance at the widest point of the frog. |
| Frog length | FL | Linear distance between the tip of the apex cunei (point of frog) and the line connecting the palmar ends of the cuneus ungulae (base of frog). |
| Outer wall length | OWL | Linear distance from the hairline to the ground, on the abaxial aspects of the lateral hoof wall, in dorsal view. |
| Inner wall length | IWL | Linear distance from the hairline to the ground, on the abaxial aspects of the medial hoof wall, in dorsal view. |
| Outer wall deviation | OWD | Imaginary line distance between the same angle all the way from the coronet to the ground, on the abaxial aspects of the lateral hoof wall. |
| Inner wall deviation | IWD | Imaginary line distance between the same angle all the way from the coronet to the ground, on the abaxial aspects of the lateral hoof wall. |
| Lateral heel height | LHH | Linear distance from the hairline at the palmar most aspect to the lateral heel bulb to the ground. |
| Medial heel height | MHH | Linear length from the hairline at the palmar most aspect to the medial heel bulb to the ground. |
| Transformation of measurement | ||
| Differences | ||
| Dorsal hoof wall to heel angle difference or Degree of heel collapse (DHC) | DHWA-HA or DHC | Angular difference between dorsal hoof wall and heel angles. |
| Outer wall to inner wall length difference | OWL–IWL | Length difference between outer wall length and inner wall length. |
| Sole length to sole width difference | SLS–SW | Length difference between sole length and sole width. |
| Dorsal hoof wall to heel length difference | DHWL–HL | Length difference between dorsal hoof wall length and heel length. |
| Frog length to frog width difference | FL–FW | Length difference between frog length and frog width. |
| Ratios | ||
| Heel collapse index | HCI | Ratio between heel angle and dorsal hoof wall angle. |
| Heel/sole width ratio | HS:SW | Ratio between heel separation and sole width. |
| Heel bulb distance/Support length ratio | HBD:SLS | Ratio between heel bulb distance and supporting length from solar view. |
| Toe/Length ratio | TL:PL | Ratio between linear distance of the center of the toe to the center of the widest part of the sole and linear distance between the center of the widest part of the sole to the center of the heel separate. |
| Medial sole width/Sole width ratio | SWMed:SW | Ratio between linear distance of Pars medialis/widest part of sole width. |
| Inner/Outer height ratio | IWH:OWH | Ratio between the vertical distance from the dorsal medial coronary band to the ground surface divided by the vertical distance from the dorsal lateral coronary band to the ground surface. |
| Heel length/Dorsal hoof wall length | HL:DHWL | Ratio between heel length and dorsal hoof wall length. |
| Area parameter | ||
| Sole area | SA | Total area of the sole area excluding the area of the frog. |
| Left Forelimb (n = 38) | Right Forelimb (n = 38) | p-Value | |||||||
|---|---|---|---|---|---|---|---|---|---|
| Mean ± SD | Min | Max | CI | Mean ± SD | Min | Max | CI | ||
| Measured on Lateral view (see Figure 1A) | |||||||||
| DHWA | 55.08 ± 3.42 | 49.58 | 64.83 | [54.98, 57.18] | 55.57 ± 3.13 | 48.93 | 63.37 | [54.55, 56.57] | 0.498 |
| DHWL | 7.32 ± 0.09 | 6.09 | 8.47 | [7.13, 7.50] | 7.20 ± 0.09 | 5.99 | 8.61 | [7.01, 7.39] | 0.072 |
| HA | 36.25 ± 6.53 | 22.03 | 54.18 | [34.14, 38.35] | 35.65 ± 4.92 | 26.60 | 45.86 | [34.06, 37.24] | 0.835 A |
| HH | 2.40 ± 0.37 | 1.82 | 3.56 | [2.27, 2.51] | 2.32 ± 0.40 | 1.44 | 3.19 | [2.18, 2.44] | 0.354 |
| HL | 3.31 ± 0.65 | 2.22 | 4.57 | [3.11, 3.52] | 3.39 ± 0.57 | 2.33 | 4.65 | [3.21, 3.58] | 0.424 |
| SL | 10.09 ± 1.07 | 7.98 | 12.72 | [9.74, 10.44] | 10.28 ± 1.19 | 8.15 | 12.86 | [9.90, 10.65] | 0.484 |
| Measured on Dorsopalmar view (see Figure 1B) | |||||||||
| OWL | 5.53 ± 0.50 | 4.36 | 6.60 | [5.36, 5.68] | 5.55 ± 0.53 | 4.30 | 6.69 | [5.37, 5.71] | 0.885 |
| IWL | 5.64 ± 0.66 | 3.69 | 6.90 | [5.42, 5.85] | 5.45 ± 0.51 | 4.52 | 6.64 | [5.28, 5.61] | 0.176 |
| OWA | 94.46 ± 5.56 | 84.81 | 109.33 | [92.67, 96.25] | 93.33 ± 8.95 | 48.40 | 105.48 | [90.44, 96.21] | 0.835 A |
| IWA | 95.08 ± 5.46 | 83.03 | 107.80 | [93.31, 96.83] | 93.88 ± 5.82 | 85.43 | 110.57 | [92.00, 95.75] | 0.365 |
| OWD | 0.30 ± 0.20 | 0.05 | 0.96 | [0.23, 0.36] | 0.35 ± 0.30 | 0.02 | 1.67 | [0.24, 0.44] | 0.611 A |
| IWD | 0.37 ± 0.17 | 0.03 | 0.75 | [0.31, 0.42] | 0.45 ± 0.32 | 0.03 | 1.38 | [0.34, 0.55] | 0.611 A |
| Measured on Palmarodorsal view (see Figure 1C) | |||||||||
| LHH | 2.02 ± 0.36 | 1.40 | 3.00 | [1.90, 2.13] | 2.00 ± 0.43 | 1.10 | 3.50 | [1.86, 2.13] | 0.499 A |
| MHH | 1.99 ± 0.38 | 1.40 | 2.80 | [1.86, 2.10] | 2.00 ± 0.41 | 1.10 | 2.90 | [1.86, 2.13] | 0.877 |
| Measured on Solar view (see Figure 1D,E) | |||||||||
| HS | 4.56 ± 0.72 | 2.93 | 6.38 | [4.32, 4.78] | 4.62 ± 0.66 | 3.26 | 6.11 | [4.41, 4.83] | 0.599 |
| HBD | 1.97 ± 0.65 | 1.08 | 4.04 | [2.61, 2.99] | 2.11 ± 0.60 | 1.20 | 3.74 | [2.49, 2.94] | 0.175 A |
| SW | 9.31 ± 0.69 | 7.89 | 10.93 | [9.09, 9.53] | 9.40 ± 0.70 | 8.25 | 11.97 | [9.17, 9.63] | 0.678 A |
| SLS | 10.96 ± 0.88 | 8.04 | 12.79 | [10.67, 11.24] | 10.87 ± 1.01 | 8.66 | 13.13 | [10.54, 11.19] | 0.454 A |
| FW | 3.93 ± 0.10 | 2.79 | 5.26 | [3.72, 4.13] | 3.99 ± 0.11 | 2.90 | 5.60 | [3.76, 4.20] | 0.562 |
| FL | 7.82 ± 0.13 | 6.05 | 9.19 | [7.54, 8.08] | 7.81 ± 0.13 | 6.29 | 9.87 | [7.53, 8.07] | 0.938 |
| SA | 56.71 ± 9.32 | 39.79 | 74.30 | [53.74, 59.67] | 56.32 ± 7.74 | 41.79 | 76.88 | [53.85, 58.78] | 0.795 |
| Left | Right | p-Value | CI | ||
|---|---|---|---|---|---|
| Mean (SD; Range) | Mean (SD; Range) | Left | Right | ||
| Hoof parameters (%) | |||||
| HCI | 64.79 (11.87; 39.82–92.19) | 64.24 (8.74; 44.78–81.98) | 0.952 | [61.02, 68.57] | [61.47, 67.03] |
| HS:SW | 48.92 (6.43; 31.57–61.83) | 48.93 (5.98; 34.15–61.40) | 0.991 | [49.63, 50.65] | [49.76, 50.47] |
| HBD:SLS | 18.21 (6.93; 9.20–44.10) | 19.78 (6.75; 11.46–43.16) | 0.220 * | [15.97, 20.44] | [17.60, 21.95] |
| TL:PL | 43.85 (6.34; 27.45–60.96) | 44.26 (4.98; 30.36–55.93) | 0.762 | [41.81, 45.89] | [42.65, 45.86] |
| SWMed:SW | 50.14 (1.58; 45.94–53.10) | 50.12 (1.11; 47.27–52.18) | 0.941 | [49.63, 50.65] | [49.76, 50.47] |
| IWH:OWH | 102.23 (10.74; 70.87–125.21) | 98.64 (7.64; 76.35–112.77) | 0.102 | [98.77, 105.69] | [96.17, 101.10] |
| HL:DHWL | 45.43 (8.76; 27.97–58.51) | 47.26 (7.85; 31.32–64.17) | 0.185 | [42.65, 48.22] | [44.77, 49.76] |
| Differences in hoof parameters | |||||
| Angle (°) | |||||
| DHC | 19.83 (7.08; 4.42–33.29) | 19.91 (5.24; 10.08–32.80) | 0.952 | [17.58, 22.08] | [18.25, 21.58] |
| Hoof wall height (cm) | |||||
| OWL–IWL | 0.11 (0.66; −1.81–1.52) | −0.12 (0.43; −1.25–0.68) | 0.141 | [−0.09, 0.32] | [−0.24, 0.05] |
| Sole (cm) | |||||
| SLS–SW | 1.65 (0.76; −0.39–3.04) | 1.46 (0.89; −1.08–3.19) | 0.087 | [1.41, 1.89] | [1.18, 1.75] |
| Length (cm) | |||||
| DHWL–HL | 4.00 (0.80; 2.78–6.00) | 3.81 (0.72; 2.34–5.63) | 0.097 | [3.75, 4.26] | [3.58, 4.04] |
| Frog (cm) | |||||
| FL–FW | 3.88 (1.13; 1.81–5.35) | 3.82 (0.18; 1.68–5.31) | 0.604 * | [3.52, 4.25] | [3.47, 4.17] |
| Measurement | Mean ± SD | CI |
|---|---|---|
| Measured on Lateral view (see Figure 1A) | ||
| DHWA | 55.83 ± 3.31 | [55.09, 56.57] |
| DHWL | 7.26 ± 0.59 | [7.13, 7.39] |
| HA | 35.95 ± 5.83 | [34.64, 37.26] |
| HH | 2.36 ± 0.39 | [2.26, 2.45] |
| HL | 3.36 ± 0.61 | [3.21, 3.49] |
| SL | 10.19 ± 1.13 | [9.93, 10.44] |
| Measured on Dorsopalmar view (see Figure 1B) | ||
| OWA | 93.89 ± 7.52 | [92.21, 95.59] |
| OWD | 0.32 ± 0.26 | [0.26, 0.38] |
| OWL | 5.53 ± 0.52 | [5.42, 5.65] |
| IWA | 94.48 ± 5.71 | [93.19, 95.76] |
| IWD | 0.41 ± 0.26 | [0.35, 0.47] |
| IWL | 5.55 ± 0.60 | [5.41, 5.68] |
| Measured on Palmarodorsal view (see Figure 1C) | ||
| LHH | 2.01 ± 0.39 | [1.92, 2.09] |
| MHH | 1.99 ± 0.39 | [1.90, 2.08] |
| Measured on Solar view (see Figure 1D,E) | ||
| HS | 4.59 ± 0.69 | [4.43, 4.75] |
| HBD | 2.77 ± 0.65 | [2.62, 2.91] |
| SW | 9.36 ± 0.70 | [9.20, 9.52] |
| SLS | 10.91 ± 0.95 | [10.69, 11.13] |
| FW | 3.95 ± 0.66 | [3.81, 4.11] |
| FL | 7.81 ± 0.84 | [7.62, 8.00] |
| SA | 56.51 ± 8.51 | [54.60, 58.43] |
| Hoof parameters (%) | ||
| HCI | 64.52 ± 10.36 | [62.19, 66.85] |
| HS:SW | 48.92 ± 6.25 | [47.51, 50.33] |
| HBD:SLS | 18.99 ± 6.93 | [17.44, 20.55] |
| TL:PL | 44.05 ± 5.74 | [42.76, 45.35] |
| SWMed:SW | 50.13 ± 1.38 | [49.82, 50.44] |
| IWH:OWH | 100.44 ± 9.55 | [98.29, 102.58] |
| HL:DHWL | 46.35 ± 8.31 | [44.48, 48.22] |
| Differences in hoof parameters | ||
| DHC (°) | 19.87 ± 6.19 | [18.48, 21.26] |
| OWL–IWL (cm) | 0.01 ± 0.57 | [−0.12, 0.14] |
| SLS–SW (cm) | 1.56 ± 0.83 | [1.37, 1.74] |
| DHWL–HL (cm) | 3.91 ± 0.76 | [3.74, 4.08] |
| FL–FW (cm) | 3.85 ± 1.10 | [3.61, 4.10] |
| Measurement | Body Condition Score | p-Value | |||||
|---|---|---|---|---|---|---|---|
| Poor | No. | Moderate | No. | Good | No. | ||
| Lateral view (see Figure 1A) | |||||||
| DHWA | 54.65 ± 3.60 | 22 | 56.08 ± 3.34 | 38 | 56.84 ± 2.41 | 16 | 0.105 |
| DHWL | 6.95 ± 0.66 b | 22 | 7.33 ± 0.52 a | 38 | 7.53 ± 0.53 a | 16 | 0.007 |
| HA | 36.80 ± 5.70 | 22 | 35.86 ± 5.14 | 38 | 35.01 ± 7.57 | 16 | 0.646 |
| HH | 2.24 ± 0.48 | 22 | 2.43 ± 0.31 | 38 | 2.35 ± 0.41 | 16 | 0.211 |
| HL | 3.19 ± 0.50 | 22 | 3.42 ± 0.54 | 38 | 3.42 ± 0.87 | 16 | 0.331 |
| SL | 10.19 ± 0.96 | 22 | 10.06 ± 1.17 | 38 | 10.47 ± 1.25 | 16 | 0.483 |
| Dorsopalmar view (see Figure 1B) | |||||||
| OWA | 95.38 ± 12.57 | 22 | 93.88 ± 4.41 | 38 | 91.91 ± 2.57 | 16 | 0.380 |
| OWD | 0.36 ± 0.21 | 22 | 0.28 ± 0.21 | 38 | 0.38 ± 0.40 | 16 | 0.341 |
| OWL | 5.51 ± 0.57 | 22 | 5.53 ± 0.48 | 38 | 5.59 ± 0.57 | 16 | 0.897 |
| IWA | 93.90 ± 7.48 | 22 | 95.00 ± 4.92 | 38 | 94.02 ± 4.84 | 16 | 0.729 |
| IWD | 0.40 ± 0.29 | 22 | 0.40 ± 0.24 | 38 | 0.45 ± 0.28 | 16 | 0.802 |
| IWL | 5.26 ± 0.58 b | 22 | 5.61 ± 0.55 ab | 38 | 5.80 ± 0.61 a | 16 | 0.014 |
| Palmarodorsal view (see Figure 1C) | |||||||
| LHH | 2.05 ± 0.39 | 22 | 1.91 ± 0.35 | 38 | 2.18 ± 0.46 | 16 | 0.06 |
| MHH | 2.03 ± 0.41 | 22 | 1.92 ± 0.36 | 38 | 2.11 ± 0.44 | 16 | 0.220 |
| Solar view (see Figure 1D,E) | |||||||
| HS | 4.81 ± 0.84 a | 22 | 4.60 ± 0.62 ab | 38 | 4.16 ± 0.55 b | 16 | 0.019 |
| HBD | 2.35 ± 0.75 a | 22 | 1.96 ± 0.56 ab | 38 | 1.84 ± 0.44 b | 16 | 0.023 |
| SW | 9.48 ± 0.82 ab | 22 | 9.43 ± 0.71 b | 38 | 8.71 ± 0.32 c | 16 | 0.013 |
| SLS | 10.48 ± 1.02 | 22 | 11.03 ± 0.93 | 38 | 11.08 ± 0.74 | 16 | 0.082 |
| FW | 4.27 ± 0.75 a | 22 | 3.92 ± 0.58 ab | 38 | 3.63 ± 0.53 b | 16 | 0.008 |
| FL | 7.10 ± 0.70 c | 22 | 8.04 ± 0.80 b | 38 | 8.26 ± 0.42 ab | 16 | < 0.001 |
| SA | 58.77 ± 8.94 | 22 | 56.16 ± 8.60 | 38 | 52.11 ± 7.39 | 16 | 0.096 |
Disclaimer/Publisher’s Note: The statements, opinions and data contained in all publications are solely those of the individual author(s) and contributor(s) and not of MDPI and/or the editor(s). MDPI and/or the editor(s) disclaim responsibility for any injury to people or property resulting from any ideas, methods, instructions or products referred to in the content. |
© 2024 by the authors. Licensee MDPI, Basel, Switzerland. This article is an open access article distributed under the terms and conditions of the Creative Commons Attribution (CC BY) license (https://creativecommons.org/licenses/by/4.0/).
Share and Cite
Phannithi, T.; Laikul, A.; Pathomsakulwong, W.; Rungsri, P.; Apichaimongkonkun, T.; Watchrarat, K.; Cherdchutham, W. External Hoof Measurements of Untrimmed and Unshod Mules in Northern Thailand. Animals 2024, 14, 1197. https://doi.org/10.3390/ani14081197
Phannithi T, Laikul A, Pathomsakulwong W, Rungsri P, Apichaimongkonkun T, Watchrarat K, Cherdchutham W. External Hoof Measurements of Untrimmed and Unshod Mules in Northern Thailand. Animals. 2024; 14(8):1197. https://doi.org/10.3390/ani14081197
Chicago/Turabian StylePhannithi, Thawijit, Aree Laikul, Watcharapol Pathomsakulwong, Porrakote Rungsri, Tawanhathai Apichaimongkonkun, Krisana Watchrarat, and Worakij Cherdchutham. 2024. "External Hoof Measurements of Untrimmed and Unshod Mules in Northern Thailand" Animals 14, no. 8: 1197. https://doi.org/10.3390/ani14081197
APA StylePhannithi, T., Laikul, A., Pathomsakulwong, W., Rungsri, P., Apichaimongkonkun, T., Watchrarat, K., & Cherdchutham, W. (2024). External Hoof Measurements of Untrimmed and Unshod Mules in Northern Thailand. Animals, 14(8), 1197. https://doi.org/10.3390/ani14081197