Simple Summary
Cattle are important agricultural animals that provide essential sources of meat, milk, fertilizer for crops, clothing, and animal traction for human use, and the demand for these products has increased in recent years. There are existing differences in disease resistance between different cattle breeds. However, the genetic basis underlying disease resistance differences is poorly understood and requires further investigation. In this study, many immune- and disease-relevant genes and pathways were identified between Holstein and Yunnan humped cattle using RNA-sequencing. The novel findings regarding the genetic basis underlying disease resistance differences between zebu cattle and taurine cattle will provide a scientific basis and key technical support for disease-resistant breeding of domestic cattle, and thus have important social and economic significance.
Abstract
Previous studies have shown that Yunnan humped cattle have higher disease resistance than pure taurine cattle, such as Holsteins. However, there exists limited information about the molecular genetic basis underlying disease resistance differences between them. The objective of this study was to compare differentially expressed genes (DEGs) in the liver and spleen tissues of Holstein and Yunnan humped cattle through comparative transcriptome analysis, using RNA-sequencing. In total, 1564 (647 up- and 917 down-regulated genes) and 1530 (716 up- and 814 down-regulated genes) DEGs were obtained in the liver and spleen tissues of Holstein and Yunnan humped cattle comparison groups, respectively. Gene Ontology (GO) and Kyoto Encyclopedia of Genes and Genomes (KEGG) enrichment analysis showed that the DEGs were mainly associated with the RIG-I signaling pathway, immune responses, major histocompatibility complex (MHC) class I protein complex and complement activation, human T-cell lymphotropic virus type-I (HTLV-I) infection. Some genes related to immune function, such as C1QB, CD55, MASP2, C4BPA, MAVS, NOD2, and CD46, were up-regulated in Yunnan humped cattle, while C2, SERPING1, SERPINE1, TIRAP, TLR2, and TLR6 were down-regulated. The expression levels of 11 selected DEGs, analyzed by quantitative reverse-transcription polymerase chain reaction (RT-qPCR), were consistent with the deep sequencing results by RNA-sequencing. Our results will provide a scientific basis and key technical support for disease-resistant breeding of domestic cattle.
1. Introduction
Cattle consist of two main types—taurine (Bos taurus) and zebu (Bos indicus) [1,2,3]. Yunnan humped are pure zebu cattle (Bos indicus) [4] distributed in the tropical and subtropical region of Yunnan Province, Southwestern China. This zebu-type breed has developed several valuable traits, such as high disease resistance and good adaptability to humid and hot climatic conditions. Compared to pure taurine cattle, such as Holstein cattle (Bos taurus), Yunnan humped cattle are relatively resistant to several animal diseases such as theileriosis [5], tuberculosis [6], and ticks [7], while Holstein cattle exhibit higher resistance to trypanosomiasis than Yunnan humped cattle [7,8]. However, little is known about the genetic basis underlying disease resistance differences between Holstein and Yunnan humped cattle. We speculate that the zebu cattle evolved certain mechanisms to prevent disease infection.
In recent years, the phenomenon of the disease resistance differences among cattle breeds has attracted considerable interest, and various studies have shown that there are disease resistance differences between Holstein and zebu cattle [9]. Toll-like receptor genes (TLRs, TLR1-TLR10) have been extensively studied in cattle breeds, and the results have indicated that the nucleotide polymorphisms between Holstein and zebu cattle are different [10,11,12], and the single-nucleotide polymorphisms (SNPs) potentially are eliciting effects on susceptibility to Mycobacterium avium ssp. paratuberculosis infection in cattle breeds [13]. Additionally, previous studies have demonstrated that the diversity of many immunity-related genes (ART4, CD2, and IL13) is higher within zebu cattle than in Holstein cattle [14]. However, the research involved in diseases of domestic cattle is limited to some SNPs on single immunity-related genes [10,14]. Therefore, it is crucial for scientists to determine the causes of disease resistance and to identify the genes that are associated with immunity- and disease-related differences between breeds
The spleen is the largest organ in the lymphatic system and plays an important role in the immune system [15] and many immune cells, including B cells, T cells, natural killer (NK) cells, and macrophages, exist in the spleen [16]. The liver is the largest lymph-producing organ and is associated with many diseases [17]. Therefore, both spleen and liver are excellent materials for the study of differences in disease resistance between cattle breeds. Here, we used RNA-sequencing (RNA-seq) to investigate the gene expression patterns in liver and spleen transcriptomes in Holstein and Yunnan humped cattle. Differentially expressed genes (DEGs) were identified to investigate potential molecular biomarkers in the liver and spleen transcriptomes that are related to differences in disease resistance between Holstein and Yunnan humped cattle.
2. Material and Methods
2.1. Sample Collection
All of the animals mentioned in this study were approved by the Committee on Animal Research and Ethics of Yunnan University (approval number: ynucae20190011) and all the experimental methods were performed in accordance with the relevant guidelines and regulations. Ten unrelated Yunnan humped cattle (n = 5, experimental group) and Holstein cattle (n = 5, control group) were collected from Yunnan province, China. All of these individuals were of same age, unrelated, and reared under the same standard. The liver and spleen tissues were harvested within 20 min after slaughter, and all tissue samples were preserved in RNAlater solution (TIANGEN Biotech, Beijing, China). All samples were stored at 4 °C for 24 h, then frozen at −80 °C until use.
2.2. RNA Extraction, Transcriptome Library Construction, and Sequencing
Total RNA was extracted from liver and spleen tissues using the TRIzol total RNA extraction kit (Invitrogen Company, Shanghai, China) following the manufacturer’s instructions. RNA integrity was evaluated using the Agilent 2100 Bioanalyzer (Agilent Technologies, Santa Clara, CA, USA). Samples with RNA Integrity Numbers (RIN) ≥7 were subjected to further analysis. The libraries were constructed using TruSeq Stranded Total RNA with Ribo-Zero Gold, according to the manufacturer’s instructions, using high-quality RNA purified from liver and spleen tissues. These libraries were sequenced on the Illumina sequencing platform (HiSeqTM 2500 or other platform) and 150 bp/125 bp paired-end reads were generated. The clean reads were deposited in the National Center for Biotechnology Information (NCBI) sequence read archive (SRA) database under accession numbers SRR8712446–SRR8712465.
2.3. Quality Control and Reads Mapping
Clean data (clean reads) were obtained by removing reads containing adapters and ploy-N, as well as low-quality reads (reads containing only adapters and empty reads) from the raw data. At the same time, Q20, Q30, Q40, GC-content, and sequence duplication level of the clean data were calculated using Trimmomatic [18]. All the downstream analyses were based on the clean, high-quality data. The clean reads were aligned to the reference sequence of the Bos taurus genome (version UMD 3.1.1) using TopHat2 [19]. Additionally, this method was used to determine the position information in the reference genome or gene, and specific characteristic information of sequenced samples.
2.4. Differentially Expressed Gene Analysis
Numbers of reads in the RNA-seq analysis were normalized against reads per kilo base of transcripts per million (RPKM) to compute the gene expression levels [20]. The DESeq package [21] was used to identify the DEGs in liver and spleen transcriptomes between Holstein and Yunnan humped cattle. p-value < 0.05, false discovery rate (FDR) < 0.05 and |log2 (FoldChange)| > 2 were set as thresholds for significant differential expression.
2.5. Enrichment Analysis of Differentially Expressed Genes (DEGs)
To further investigate and compare the functions of those DEGs, Gene Ontology (GO) enrichment analysis and Kyoto Encyclopedia of Genes and Genomes (KEGG) pathway analysis were performed using the DAVID bioinformatics resource tool [22] to describe the biological process (BP), cellular components (CC), molecular function (MF), and KEGG pathway. GO and KEGG terms were calculated by Fisher’s exact test with a threshold p-value < 0.05.
2.6. Quantitative Reverse-Transcription Polymerase Chain Reaction (RT-qPCR) Validation
We randomly selected 11 DEGs for quantitative reverse-transcription polymerase chain reaction (RT-qPCR) validation to confirm the reliability and accuracy of the RNA-seq method. Quantification was performed with a two-step reaction process: reverse transcription (RT) and PCR. Each RT reaction had two steps. In the first step, 0.5 µg RNA and 2 µL of 4× gDNA wiper Mix were added to nuclease-free H2O, to a final volume of to 8 µL. Reactions were performed in a GeneAmp® PCR System 9700 (Applied Biosystems, Foster city, CA, USA) for 2 min at 42 °C. In the second step, 2 µL of 5× HiScript II Q RT SuperMix Iia was added to the solution from the first step. Reactions were performed in a GeneAmp® PCR System 9700 (Applied Biosystems, Foster city, CA, USA) for 10 min at 25 °C; 30 min at 50 °C, and 5 min at 85 °C. The 10 µL RT reaction mix was then diluted ten times in nuclease-free water and held at −20 °C. Real-time PCR was performed using a LightCycler® 480 II Real-time PCR Instrument (Roche, Basel, Switzerland) with 10 µL PCR mixture that included 1 µL of cDNA, 5 µL of 2× QuantiFast® SYBR® Green PCR Master Mix (QIAGEN, Hilden, Germany), 0.2 µL of forward primer, 0.2 µL of reverse primer, and 3.6 µL of nuclease-free water. Reactions were incubated in a 384-well optical plate (Roche, Basel, Switzerland) at 95 °C for 5 min, followed by 40 cycles of 95 °C for 10 s, and 60 °C for 30 s. Each sample was run in triplicate for analysis. At the end of the PCR cycles, melting curve analysis was performed to validate the specific generation of the expected PCR product. The specific primers used in these experiments are listed in Table 1. The expression levels of mRNAs were normalized to Glyceraldehyde-3-phosphate dehydrogenase (GAPDH) and were calculated using the 2−ΔΔCt method [23].

Table 1.
Primer sequences of the differentially expressed genes (DEGs) for real-time polymerase chain reaction (PCR) analysis.
3. Results
3.1. RNA-Seq and Mapping
After sequencing using Illumina HiseqTM2000, 20 GB of raw reads were generated per sample library. A total of 400 GB raw reads were obtained from 20 libraries. After removal of low-quality reads (reads containing only adapters and empty reads), 753, 355, 598, and 757, 858, 666 clean reads were obtained for Yunnan humped cattle liver and spleen, respectively, and 750, 519, 172 and 775, 726, 926 clean reads were obtained for Holstein cattle liver and spleen, respectively. The Q30 scores of clean bases were more than 88.87% for all twenty tissue samples, implying the high quality of our sequencing data. We next aligned the clean reads onto the Bos taurus reference genome, and the mapping ratio ranged from 94.98% to 97.54%. Detailed information of RNA-seq and mapping for every sample is listed in Table 2. All samples were distributed into two groups (spleen and liver samples of both Holstein and Yunnan humped cattle) to identity the DEGs.
Table 2.
Statistics and mapping results of RNA-seq data.
3.2. Identification of Differentially Expressed Genes
In this study, genes with FDR < 0.05, p < 0.05, and |log2 (FoldChange)| > 2 were considered as DEGs. Overall, a total of 1564 DEGs were identified in the liver group, with 647 up-regulated and 917 down-regulated genes (Figure 1A). In the spleen group, 1530 DEGs were detected, including 716 up-regulated and 814 down-regulated genes (Figure 1B). We analyzed the expression values of the DEGs in each sample by hierarchical clustering method. The dendrogram of clustering analysis showed that the DEGs of the two groups could separate the Yunnan humped cattle samples from the Holstein cattle completely (Figure 2A,B), implying that the expression differences of the DEGs in the two groups were significant.
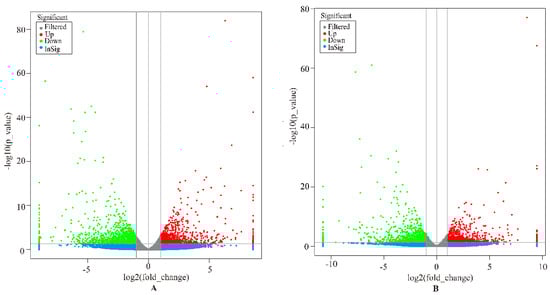
Figure 1.
Volcano plot displaying the differentially expressed genes in the livers (A) and spleens (B) of Holstein and Yunnan humped cattle. The y-axis corresponds to the mean expression value of −log10 (p-value), and the x-axis displays the log2 fold-change value. The red and green dots circled in the frame represent the significant DEGs (p < 0.05) between Holstein and Yunnan humped cattle; the blue and grey dots represent the transcripts whose expression levels did not reach statistical significance between Holstein and Yunnan humped cattle.
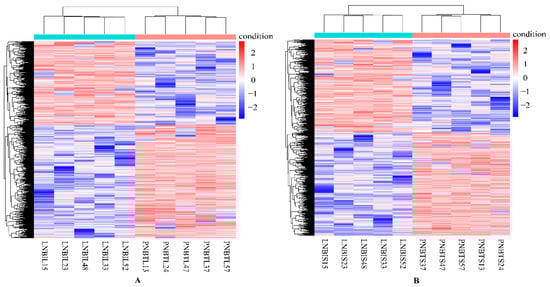
Figure 2.
Hierarchical clustering analysis of the expression level of the DEGs in the livers (A) and spleens (B) of Holstein and Yunnan humped cattle. Red and blue indicate higher and lower expression values, respectively.
3.3. Function Enrichment Analysis for DEGs
To investigate the functional association of the DEGs, GO and KEGG, enrichment analyses were performed using the database for annotation, visualization and integrated discovery (DAVID). In the liver group, 146 GO terms were significantly (p < 0.05) annotated within three major function groups: biological process (BP, 100), cellular component (CC, 12), and molecular function (MF, 34). The GO terms with p-values less than 0.01 are shown in Figure 3. The most significant GO categories observed were phosphoric ester hydrolase activity, major histocompatibility complex (MHC) class I protein complex, and metal ion binding. A total of 135 GO terms were significantly enriched in the spleen group, including 85 BP, 10 CC, and 40 MF (Figure 4), and the most significant GO categories observed were the MHC class I protein complex, which regulates cytokine production, immune responses, and activation of immune responses.
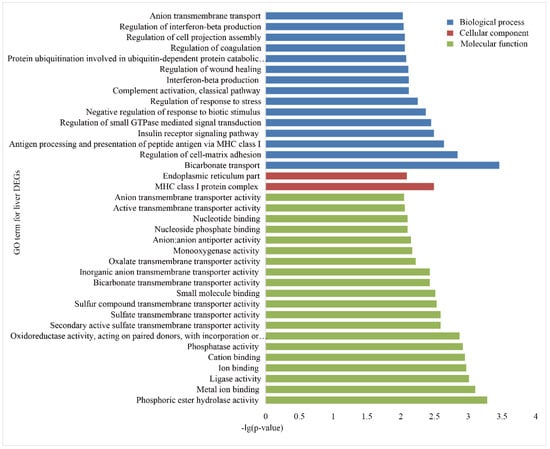
Figure 3.
Gene Ontology (GO) enrichment analysis of the DEGs in the livers of Holstein and Yunnan humped cattle. The GO terms belonging to biological processes (BP), cellular components (CC) and molecular functions (MF) are shown in blue, red, and green, respectively. The significance levels are p < 0.01.
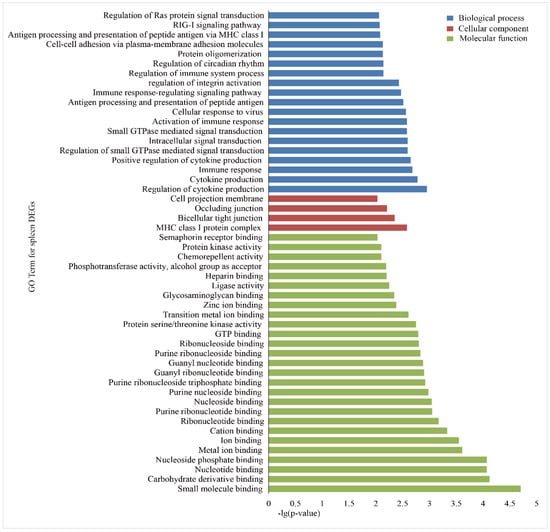
Figure 4.
GO enrichment analysis of the DEGs in the spleens of Holstein and Yunnan humped cattle. The GO terms belonging to biological processes (BP), cellular components (CC) and molecular functions (MF) are shown in blue, red, and green, respectively. The significance levels are p < 0.01.
Based on KEGG pathway enrichment analysis, 11 and 15 KEGG pathways were significantly (p < 0.05) enriched in the liver and spleen groups, respectively. The top five pathways with the most representation of DEGs were metabolic pathways (126 DEGs), HTLV-I infection (28 DEGs), AMPK signaling pathways (15 DEGs), chemical carcinogenesis (12 DEGs), and complement and coagulation cascades (12 DEGs) in the liver group (Table 3), while metabolic pathways (113 DEGs), endocytosis (31 DEGs), the Rap1 signaling pathway (25 DEGs), phagosome (22 DEGs), and tuberculosis (21 DEGs) had the most representation in the spleen group (Table 4). Through GO and KEGG enrichment analysis, 12 and 8 immunity- and disease-related genes were identified in liver and spleen tissue in Holstein and Yunnan humped cattle (Table 5).
Table 3.
Kyoto Encyclopedia of Genes and Genomes (KEGG) pathway analysis of the DEGs in the livers of Holstein and Yunnan humped cattle.
Table 4.
KEGG pathway analysis of the DEGs in the spleens of Holstein and Yunnan humped cattle.
Table 5.
The DEGs related to immunity and diseases in liver and spleen tissue of Holstein and Yunnan humped cattle.
3.4. Validation Analysis Using RT-qPCR
Eleven significant DEGs, identified from the RNA-seq data, were randomly selected for RT-qPCR validation, including six genes in the liver group (RDH5, ST6GAL1, MASP2, C4BPB, PON3, and MTHFS) and five genes in the spleen group (DEFB4A, HBA, ORM1, PENK, and PRSS2). The RT-qPCR confirmed that the DEGs had the same pattern of expression as observed with the RNA-seq (Figure 5A,B). Therefore, gene expression observed in the liver and spleen transcriptomes of Holstein and Yunnan humped cattle was highly credible.
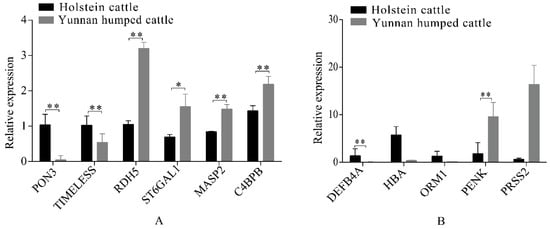
Figure 5.
Quantitative reverse-transcription polymerase chain reaction (RT-qPCR) analysis of differentially expressed genes in the livers (A) and spleens (B) of Holstein and Yunnan humped cattle. Significance levels: * p-value < 0.05, ** p-value < 0.01.
4. Discussion
In RNA-seq, RNA information of biological samples was generated from cDNA sequences using high-throughput sequencing technologies [24,25]. As an advanced technique, RNA-seq is widely applied to study the DEGs of organisms [26,27,28]. Marioni et al. (2008) demonstrated that RNA-seq and RT-qPCR have a high correlation, and that the Pearson correlation could reach 0.929 [29], which means RNA-seq is accurate and reproducible. Therefore, the objective of this study was to investigate DEGs in liver and spleen tissues between Holstein and Yunnan humped cattle, using comparative transcriptome analysis and screening of candidate genes related to immune function and disease.
As the largest lymph-producing organ in the body, the liver plays an important role in the metabolism and immune system [30,31] and is associated with many diseases [17]. In total, 1564 DEGs (p < 0.05) were detected in the liver tissue. GO and KEGG analysis showed that some of them were related to disease, immune function and metabolism. In the KEGG enrichment analysis, we found 12 genes that were enriched in the complement and coagulation cascades pathway, which is a proteolytic cascade in blood plasma and a mediator of innate immunity. The gene C1QB produced immune reactions through a series of complement cascades. Previous studies show that a C1Q deficiency could lead to lupus erythematosus and glomerulonephritis [32,33]. CD46 and CD55 were associated with complement and coagulation regulatory transgenes [34]. CD46 encodes a type I membrane protein and plays a major role in complement activation. Previous studies have reported its association with several autoimmune diseases [35]. CD55 encodes a glycoprotein involved in the regulation of the complement cascade, prevention of damage to host cells, and is associated with the progression of various cancers. Previous studies show that the expression level of the CD55 gene is greater in individuals with gastric, colon, and breast cancer, than in non-cancerous tissues [36,37,38], and the expression was higher in Yunnan humped cattle compared to Holstein cattle. This implies that Holstein cattle might have strong resistance to gastric, colon, and breast cancer. C2 mainly participates in apoptotic cell clearance, and its sequence variation can also be associated with lupus erythematosus [39]. MASP2 encodes a member of the peptidase S1 family of serine proteases. Kasanmoentalib et al., (2017) proved that wild-type mice have higher cytokine levels and a greater survival rate than MASP2-deficient mice with pneumococcal meningitis [40]. Its expression was higher in Yunnan humped cattle compared to Holstein cattle, which implies that Yunnan humped cattle are generally not susceptible to pneumococcal meningitis. F2 plays a role in maintaining vascular integrity during development and postnatal life. SERPING1 is involved in the regulation of the complement cascade, and its sequence variation mainly causes hereditary angioedema [41]. SERPINE1 is related to breast cancer, and the expression of this gene is significantly elevated in breast cancer tissues [42]; the results of the present study showed that its expression level was higher in Holstein cattle compared to Yunnan humped cattle. The genes of C4BPA and C4BPB are the binding proteins of the complement, and participate in the activation of the complement cascade [33]. Related pathways are immune response lectin-induced complement pathways and Creation of C4 and C2 activators.
The spleen is the largest lymphatic organ in the body, plays a critical role in the immune system [43], and contains many immune cells, including B cells, T cells, natural killer (NK) cells, and macrophages [16]. In the spleen tissues, 1530 DEGs were detected from which 135 GO terms and 15 KEGG pathways were annotated by GO and KEGG pathway enrichment analysis, respectively. Moreover, there were 19 biological process terms with p-values < 0.01, of which 11 were related to immune functions and 9 KEGG pathways were associated with disease and immune response, implying that Holstein and Yunnan humped cattle differed significantly in terms of disease resistance and immune systems.
Furthermore, a total of 157 DEGs participated in the immune-related biological processes and pathways. There were 9 DEGs that participated in more than five biological processes at the same time. MAVS encode an intermediary protein necessary in the virus-triggered beta interferon signaling pathway, and suppression of this gene can exacerbate the viral replication and killing of the host cells [44]. Its expression level was higher in Yunnan humped cattle compared to Holstein cattle. NLRX1 is a member of the NLR family, and the protein of this gene is a regulator of mitochondrial antivirus responses. Its expression level is low in acute myocardial ischemia tissues [45]. ANKRD17, which is up-regulated in Yunnan humped cattle [46], plays a role in DNA replication and in both innate anti-viral and anti-bacterial immune pathways [47]. High-level expression of this gene can promote RIG-I-like (RLR) signaling in response to influenza and Sendai virus RNA, and was up-regulated in Yunnan humped cattle. NOD2 is an intracellular pattern-recognition receptor and plays an important role in the immune system [48]. TIRAP is an adapter molecule associated with toll-like receptors and plays a crucial role in the TLR4 signaling pathway of the immune system [49]. TLR2 and TLR6 are toll-like receptor genes and played a central role in the immune system, as also indicated in a previous study [50]. Among those genes, MAVS, NLRX1, ANKRD17, NOD2, and CD46 were up-regulated in Yunnan humped cattle, while TIRAP, TLR2, and TLR6 were down-regulated. Our results show that the disease resistance differences between Holstein and Yunnan humped cattle might be caused by the DEGs, and those DEGs are critical candidate genes involved with disease resistance in cattle breeds.
The present study provides a non-invasive method to identify the DEGs in liver and spleen between Holstein and Yunnan humped cattle using RNA-seq. In total, 1564 and 1530 DEGs were detected in the two comparison groups (liver and spleen tissues). GO and KEGG enrichment analysis showed that immunological pathways and disease pathways were present in both groups. These results provide valuable resources for biological research in breeding of domestic cattle. Our results contribute to the understanding of the mechanisms in the spleen and liver that strengthen the disease resistance of animals. In addition, our results provide fundamental information on the studies of the immunity base of Holstein and Yunnan humped cattle that could support the future development of selective breeding techniques.
Author Contributions
Conceptualization, S.C., H.X. and P.S.; methodology, S.C. and Y.C.; project administration, S.C.; software, Y.C. and B.Z.; validation, Y.C.; investigation, S.C., B.Z. and Y.C.; resources, S.C., B.Z. and Y.C.; data curation, S.C. and Y.C.; writing–original draft preparation, Y.C.; writing–review and editing, S.C.; supervision, S.C., H.X. and P.S.
Acknowledgments
This research was funded by the National Natural Science Foundation of China (31460281) and the Hundred Overseas Talents Recruitment Program of Yunnan Province.
Conflicts of Interest
The authors declare that they have no conflict of interests.
References
- Loftus, R.T.; MacHugh, D.E.; Bradley, D.G.; Sharp, P.M.; Cunningham, P. Evidence for two independent domestications of cattle. Proc. Natl. Acad. Sci. USA 1994, 91, 2757–2761. [Google Scholar] [CrossRef] [PubMed]
- Troy, C.S.; MacHugh, D.E.; Bailey, J.F.; Magee, D.A.; Loftus, R.T.; Cunningham, P.; Chamberlain, A.T.; Sykes, B.C.; Bradley, D.G. Genetic evidence for Near-Eastern origins of European cattle. Nature 2001, 410, 1088–1091. [Google Scholar] [CrossRef] [PubMed]
- Bruford, M.W.; Bradley, D.G.; Luikart, G. DNA markers reveal the complexity of livestock domestication. Nat. Rev. Genet. 2003, 4, 900–910. [Google Scholar] [CrossRef] [PubMed]
- Pérez-Pardal, L.; Sánchez-Gracia, A.; Álvarez, I.; Traoré, A.; Ferraz, J.B.S.; Fernández, I.; Costa, V.; Chen, S.Y.; Tapio, M.; Cantet, R.J.C.; et al. Legacies of domestication, trade and herder mobility shape extant male zebu cattle diversity in South Asia and Africa. Sci. Rep. 2018, 8, 18027. [Google Scholar] [CrossRef] [PubMed]
- Glass, E.J.; Preston, P.M.; Springbett, A.; Craigmile, S.; Kirvar, E.; Wilkie, G.; Brown, C.G. Bos taurus and Bos indicus (Sahiwal) calves respond differently to infection with Theileria annulata and produce markedly different levels of acute phase proteins. Int. J. Parasitol. 2005, 35, 337–347. [Google Scholar] [CrossRef] [PubMed]
- Vordermeier, M.; Ameni, G.; Berg, S.; Bishop, R.; Robertson, B.D.; Aseffa, A.; Hewinson, R.G.; Young, D.B. The influence of cattle breed on susceptibility to bovine tuberculosis in Ethiopia. Comp. Immunol. Microbiol. Infect. Dis. 2012, 35, 227–232. [Google Scholar] [CrossRef] [PubMed]
- Mattioli, R.C.; Pandey, V.S.; Murray, M.; Fitzpatrick, J.L. Immunogenetic influences on tick resistance in African cattle with particular reference to trypanotolerant N’Dama (Bos taurus) and trypanosusceptible Gobra zebu (Bos indicus) cattle. Acta Trop. 2000, 75, 263–277. [Google Scholar] [CrossRef]
- Authié, E.; Duvallet, G.; Robertson, C.; Williams, D.J. Antibody responses to a 33 kDa cysteine protease of Trypanosoma congolense: Relationship to ‘trypanotolerance’ in cattle. Parasite Immunol. 2010, 15, 465–474. [Google Scholar] [CrossRef]
- Zeng, B.J.; Li, R.; Xiao, H.; Chen, S.Y. Advances in molecular genetic basis of disease resistance differences among domestic cattle breeds. Chin. J. Anim. Vet. Sci. 2017, 48, 193–200. [Google Scholar]
- Cargill, E.J.; Womack, J.E. Detection of polymorphisms in bovine Toll-like receptors 3, 7, 8, and 9. Genomics 2007, 89, 745–755. [Google Scholar] [CrossRef]
- Seabury, C.M.; Seabury, P.M.; Decker, J.E.; Schnabel, R.D.; Taylor, J.F.; Womack, J.E. Diversity and evolution of 11 innate immune genes in Bos taurus taurus and Bos taurus indicus cattle. Proc. Natl. Acad. Sci. USA 2010, 107, 151–156. [Google Scholar] [CrossRef] [PubMed]
- Bilgen, N.; Kul, B.C.; Offord, V.; Werling, D.; Ertugrul, O. Determination of genetic variations of Toll-like receptor (TLR) 2, 4, and 6 with next-generation sequencing in native cattle breeds of Anatolia and Holstein Friesian. Diversity 2016, 8, 23. [Google Scholar] [CrossRef]
- Fisher, C.A.; Bhattarai, E.K.; Osterstock, J.B.; Dowd, S.E.; Seabury, P.M.; Vikram, M.; Whitlock, R.H.; Schukken, Y.H.; Schnabel, R.D.; Taylor, J.F. Correction: Evolution of the Bovine TLR Gene Family and Member Associations with Mycobacterium avium Subspecies paratuberculosis Infection. PLoS ONE 2011, 6, e27744. [Google Scholar] [CrossRef] [PubMed]
- Freeman, A.R.; Lynn, D.J.; Murray, C.; Bradley, D.G. Detecting the effects of selection at the population level in six bovine immune genes. BMC Genet. 2008, 9, 62. [Google Scholar] [CrossRef] [PubMed]
- Peng, R.; Liu, Y.L.; Cai, Z.G.; Shen, F.J.; Chen, J.S.; Hou, R.; Zou, F.D. Characterization and analysis of whole transcriptome of giant panda spleens: Implying critical roles of long non-coding rnas in immunity. Cell. Physiol. Biochem. 2018, 46, 1065–1077. [Google Scholar] [CrossRef] [PubMed]
- Chen, H.B.; Li, C.C.; Fang, M.D.; Zhu, M.J.; Li, X.Y.; Zhou, R.; Li, K.; Zhao, S.H. Understanding Haemophilus parasuis infection in porcine spleen through a transcriptomics approach. BMC Genom. 2009, 10, 64. [Google Scholar] [CrossRef]
- Tanaka, M.; Iwakiri, Y. Lymphatics in the liver. Curr. Opin. Immunol. 2018, 53, 137–142. [Google Scholar] [CrossRef] [PubMed]
- Bolger, A.M.; Lohse, M.; Usadel, B. Trimmomatic: A flexible trimmer for Illumina sequence data. Bioinformatics 2014, 30, 2114–2120. [Google Scholar] [CrossRef]
- Kim, D.; Pertea, G.; Trapnell, C.; Pimentel, H.; Kelley, R.; Salzberg, S.L. TopHat2: Accurate alignment of transcriptomes in the presence of insertions, deletions and gene fusions. Genome Biol. 2013, 14, R36. [Google Scholar] [CrossRef]
- Mortazavi, A.; Williams, B.A.; McCue, K.; Schaeffer, L.; Wold, B. Mapping and quantifying mammalian transcriptomes by RNA-Seq. Nat. Methods 2008, 5, 621–628. [Google Scholar] [CrossRef]
- Anders, S.; Huber, W. Differential Expression of RNA-Seq Data at the Gene Level—The DESeq Package; EMBL: Heidelberg, Germany, 2013. [Google Scholar]
- Dennis, G.J.; Sherman, B.T.; Hosack, D.A.; Yang, J.; Gao, W.; Lane, H.C.; Lempicki, R.A. DAVID: Database for annotation, visualization, and integrated discovery. Genome Biol. 2003, 4, 3. [Google Scholar] [CrossRef]
- Livak, K.J.; Schmittgen, T.D. Analysis of Relative Gene Expression Data Using Real-Time Quantitative PCR and the 2−ΔΔCT Method. Methods 2001, 25, 402–408. [Google Scholar] [CrossRef] [PubMed]
- Tautz, D.; Ellegren, H.; Weigel, D. Next generation molecular ecology. Mol. Ecol. 2010, 19, 1–3. [Google Scholar] [CrossRef] [PubMed]
- Wang, Z.; Gerstein, M.; Snyder, M. RNA-Seq: A revolutionary tool for transcriptomics. Nat. Rev. Genet. 2009, 10, 57–63. [Google Scholar] [CrossRef]
- Yu, G.L.; Lin, Y.; Tang, Y.; Diao, Y.X. Comparative transcriptomic analysis of immune-related gene expression in duck embryo fibroblasts following duck tembusu virus infection. Int. J. Mol. Sci. 2018, 19, 2328. [Google Scholar] [CrossRef]
- Yang, X.; Zhang, H.; Shang, J.; Liu, G.; Xia, T.; Zhao, C.; Sun, G.; Dou, H. Comparative analysis of the blood transcriptomes between wolves and dogs. Anim. Genet. 2018, 49, 291–302. [Google Scholar] [CrossRef] [PubMed]
- Fang, X.B.; Zhao, Z.H.; Yu, H.B.; Li, G.P.; Ping, J.; Yang, Y.W.; Yang, R.J.; Yu, X.Z. Comparative genome-wide methylation analysis of longissimus dorsi muscles between Japanese black (Wagyu) and Chinese Red Steppes cattle. PLoS ONE 2017, 12, e0182492. [Google Scholar] [CrossRef]
- Marioni, J.C.; Mason, C.E.; Mane, S.M.; Stephens, M.; Gilad, Y. RNA-seq: An assessment of technical reproducibility and comparison with gene expression arrays. Genome Res. 2008, 18, 1509–1517. [Google Scholar] [CrossRef]
- Wang, X.; Zhang, Y.Q.; Zhang, X.H.; Wang, D.C.; Jin, G.; Li, B.; Xu, F.; Cheng, J.; Zhang, F.; Wu, S.J. The comprehensive liver transcriptome of two cattle breeds with different intramuscular fat content. Biochem. Biophys. Res. Commun. 2017, 490, 1018–1025. [Google Scholar] [CrossRef]
- MacParland, S.A.; Liu, J.C.; Ma, X.Z.; Innes, B.T.; Bartczak, A.M.; Gage, B.K.; Manuel, J.; Khuu, N.; Echeverri, J.; Linares, I.; et al. Single cell RNA sequencing of human liver reveals distinct intrahepatic macrophage populations. Nat. Commun. 2018, 9, 4383. [Google Scholar] [CrossRef]
- Mosaad, Y.M.; Hammad, A.; Fawzy, Z.; El-Refaaey, A.; Tawhid, Z.; Hammad, E.M.; Youssef, L.F.; ElAttar, E.A.; Radwan, D.F.; Fawzy, I.M. C1q rs292001 polymorphism and C1q antibodies in juvenile lupus and their relation to lupus nephritis. Clin. Exp. Immunol. 2015, 182, 23–34. [Google Scholar] [CrossRef] [PubMed]
- Wu, D.Y.; Qiu, T.Y.; Zhang, Q.C.; Kang, H.; Yuan, S.H.; Zhu, L.X.; Zhu, R.X. Systematic toxicity mechanism analysis of proton pump inhibitors: An in silico study. Chem. Res. Toxicol. 2015, 28, 419–430. [Google Scholar] [CrossRef] [PubMed]
- Pan, D.K.; Liu, T.; Lei, T.T.; Zhu, H.B.; Wang, Y.; Deng, S.P. Progress in multiple genetically modified minipigs for xenotransplantation in China. Xenotransplantation 2019, 26, e12492. [Google Scholar] [CrossRef] [PubMed]
- Qiao, P.; Dang, E.L.; Cao, T.Y.; Fang, H.; Zhang, J.Y.; Qiao, H.J.; Wang, G. Dysregulation of mCD46 and sCD46 contribute to the pathogenesis of bullous pemphigoid. Sci. Rep. 2017, 7, 145. [Google Scholar] [CrossRef] [PubMed]
- Madjd, Z.; Durrant, L.G.; Bradley, R.; Spendlove, I.; Ellis, I.O.; Pinder, S.E. Loss of CD55 is associated with aggressive breast tumors. Clin. Cancer. Res. 2004, 10, 2797–2803. [Google Scholar] [CrossRef] [PubMed]
- Nakagawa, M.; Mizuno, M.; Kawada, M.; Uesu, T.; Nasu, J.; Takeuchi, K.; Okada, H.; Endo, Y.; Fujita, T.; Tsuji, T. Polymorphic expression of decay-accelerating factor in human colorectal cancer. J. Gastroenterol. Hepatol. 2001, 16, 184–189. [Google Scholar] [CrossRef] [PubMed]
- Liu, Y.; Chen, L.; Peng, S.; Chen, Z.; Gimm, O.; Finke, R.; Hoang-Vu, C. The expression of CD97EGF and its ligand CD55 on marginal epithelium is related to higher stage and depth of tumor invasion of gastric carcinomas. Oncol. Rep. 2005, 14, 1413–1420. [Google Scholar] [CrossRef]
- Chen, H.H.; Tsai, L.J.; Lee, K.R.; Chen, Y.M.; Hung, W.T.; Chen, D.Y. Genetic association of complement component 2 polymorphism with systemic lupus erythematosus. Tissue Antigens 2015, 86, 122–133. [Google Scholar] [CrossRef]
- Kasanmoentalib, E.S.; Valls Seron, M.; Ferwerda, B.; Tanck, M.W.; Zwinderman, A.H.; Baas, F.; Van Der Ende, A.; Brouwer, M.C.; Van De Beek, D. Mannose-binding lectin-associated serine protease 2 (MASP-2) contributes to poor disease outcome in humans and mice with pneumococcal meningitis. J. Neuroinflammation 2017, 14, 2. [Google Scholar] [CrossRef]
- Nicolicht, P.; Faria, D.O.S.; Martins-Silva, L.; Maia, L.S.M.; Moreno, A.S.; Arruda, L.K.; Motta, A.A.; Grumach, A.S.; Pesquero, J.B. Gene mapping strategy for Alu elements rearrangements: Detection of new large deletions in the SERPING1 gene causing hereditary angioedema in Brazilian families. Gene 2019, 685, 179–185. [Google Scholar] [CrossRef]
- Xu, J.; Zhang, W.W.; Tang, L.; Chen, W.W.; Guan, X.X. Epithelial-mesenchymal transition induced PAI-1 is associated with prognosis of triple-negative breast cancer patients. Gene 2018, 670, 7–14. [Google Scholar] [CrossRef] [PubMed]
- Li, Y.K.; Carrillo, J.A.; Ding, Y.; He, Y.H.; Zhao, C.P.; Liu, J.N.; Liu, G.E.; Zan, L.S.; Song, J.Z. Transcriptomic profiling of spleen in Grass-Fed and Grain-Fed Angus cattle. PLoS ONE 2015, 10, e0135670. [Google Scholar] [CrossRef] [PubMed]
- Seth, R.B.; Sun, L.; Ea, C.K.; Chen, Z.J. Identification and Characterization of MAVS, a Mitochondrial Antiviral Signaling Protein that Activates NF-κB and IRF3. Cell 2005, 122, 669–682. [Google Scholar] [CrossRef] [PubMed]
- Li, H.; Zhang, S.; Li, F.; Qin, L. NLRX1 attenuates apoptosis and inflammatory responses in myocardial ischemia by inhibiting MAVS-dependent NLRP3 inflammasome activation. Mol. Immunol. 2016, 76, 90–97. [Google Scholar] [CrossRef] [PubMed]
- Wang, Y.T.; Tong, X.M.; Li, G.; Li, J.; Deng, M.; Ye, X. Ankrd17 positively regulates RIG-I-like receptor (RLR)-mediated immune signaling. Eur. J. Immunol. 2012, 42, 1304–1315. [Google Scholar] [CrossRef] [PubMed]
- Menning, M.; Kufer, T.A. A role for the Ankyrin repeat containing protein Ankrd17 in Nod1- and Nod2-mediated inflammatory responses. FEBS Lett. 2013, 587, 2137–2142. [Google Scholar] [CrossRef] [PubMed]
- Mahla, R.S.; Reddy, M.C.; Prasad, D.V.; Kumar, H. Sweeten PAMPs: Role of sugar complexed PAMPs in innate immunity and vaccine biology. Front. Immunol. 2013, 4, 248. [Google Scholar] [CrossRef]
- Cates, E.A.; Connor, E.E.; Mosser, D.M.; Bannerman, D.D. Functional characterization of bovine TIRAP and MyD88 in mediating bacterial lipopolysaccharide-induced endothelial NF-kappaB activation and apoptosis. Comp. Immunol. Microbiol. Infect. Dis. 2009, 32, 477–490. [Google Scholar] [CrossRef]
- Beutler, B.A. TLRs and innate immunity. Blood 2008, 113, 1399–1407. [Google Scholar] [CrossRef]


© 2019 by the authors. Licensee MDPI, Basel, Switzerland. This article is an open access article distributed under the terms and conditions of the Creative Commons Attribution (CC BY) license (http://creativecommons.org/licenses/by/4.0/).