Article

Prioritizing Flood-Prone Areas Using Spatial Data in the Province of New Brunswick, Canada

1
Department of Geography, University of Winnipeg, Winnipeg, MB R3B 2E9, Canada
2
Département de Génie Civil, Université de Moncton, Moncton, NB E1A 3E9, Canada
3
Higher Institute of Water Sciences and Technologies of Gabes, University of Gabes, Zrig 6072, Tunisia
4
New Brunswick Department of Environment and Local Government, Government of New Brunswick, Fredericton, NB E3B 5H1, Canada
*
Author to whom correspondence should be addressed.
Geosciences 2020, 10(12), 478; https://doi.org/10.3390/geosciences10120478
Submission received: 12 September 2020 / Revised: 15 November 2020 / Accepted: 18 November 2020 / Published: 24 November 2020

Abstract

:
Over the years, floods have caused economic damage that has impacted development in many regions. As a result, a comprehensive overview of flood-prone areas at the provincial scale is important in order to identify zones that require detailed assessment with hydrodynamic models. This study presents two approaches that were used to prioritize flood-prone areas at the provincial scale in New Brunswick, Canada. The first approach is based on a spatial multi-criteria evaluation (SMCE) technique, while the second approach pertains to flood exposure analysis. The results show the variation in the identified flood-prone areas and, depending on the methodology and scenario used, prioritization changes. Therefore, a standard methodology might not be feasible and should be developed based on the objective of the study. The results obtained can be useful for flood risk practitioners when making decisions about where to commence detailed flood hazard and risk assessment.

1. Introduction

In New Brunswick, floods are the most destructive type of hazard, with costs estimated at $245 million Canadian dollars for the period 1913–2014, although damage estimates have not been completed for many flood events [1]. These events have led to the destruction of properties, infrastructure and ecosystems. Infrastructural assets (roads, railways, ports, airports, electricity grids, Information and Communications Technology (ICT)) are important to our society, as they provide the means through which economic activity, connectivity and transportation are facilitated [2]. The disruption of movement along roads is recurrent in the province, and causes the displacement of people, goods and services. For instance, the flood event between 13 December and 14 December 2010, resulted in the closure of about 120 roads in the southern and western section of the province [1]. Flooding also caused the closure of the Trans-Canada Highway between Fredericton and Moncton for many days, especially during the May 2018 flood [3].
Prioritizing flood-prone areas is therefore important in identifying regions that require detailed mapping using hydrodynamic models. In fact, flood hazard identification and priority setting is one of the steps in the Federal Flood Mapping Guidelines Series document that is being developed by Natural Resources Canada (NRCan) and Public Safety Canada [4], as shown in Figure 1. A methodology is therefore needed to determine where to commence flood mapping based on the prioritization of flood-prone areas. However, this component of the guideline has not been completed. As a result, flood risk practitioners in Canada will have to develop their own methodology based on the availability of data and the scale of the analysis.
Various studies on the prioritization of flood-prone areas have been conducted in Canada. In Halifax, the capital of Nova Scotia, a flood risk assessment was conducted after the prioritization of flood-prone areas [5]. The high-risk areas were obtained through literature reviews, workshops and stakeholder consultations, along with the use of the Risk Assessment Information Template (RAIT), which was developed by Public Safety Canada, where weights were applied to each criterion in the form of a matrix. Afterwards, the sites ranked (numerically) with the highest priority were selected for a detailed assessment.
In the Regional District of Central Kootenay in British Columbia, a multi-hazard assessment was carried out to identify and prioritize floods and steep creek hazards that might threaten physical assets [6]. This resulted in a geohazard and consequence rating generated based on an exposure and geohazard assessment with the use of weights to produce high-risk areas.
Similarly, in Edmonton, Alberta, a multi-criteria analysis by sub-basins was conducted in order to rank mitigation options for flood risk management based on three levels of impact: moderate, major, and extreme [7]. The methodology incorporated the use of stakeholder participation, where public opinions were collected via surveys, community meetings, and in a focus group setting. The preferences were ranked according to the most and least important.
As this relates to the prioritization of flood risk in other jurisdictions, a wide variety of approaches have been used. For example, a qualitative flood risk prioritization study was conducted in a rural area in Columbia at the watershed level [8]. The study utilized a geomorphic approach to delineate the floodplain, which was combined with vulnerability indicators to produce an index that indicate watersheds that were ranked from low to high priority.
Prioritizing flood-prone areas was also conducted in the United Kingdom based on exposure analysis [2]. The methodology shows how to locate and make comparisons between transportation networks within flood-prone areas in order to prioritize mitigation options and increase the ability to cope with floods. Specifically, the authors assessed the impact of these assets on customer interruption. Additionally, a spatial prioritization of flood-prone areas at the catchment level in Newcastle was conducted based on the following priority criteria: contribution to total flood extent, maximum flood depths, flooded green spaces and roads and the likelihood of flood exposure [9]. For this, the physical impact of floods, land use and exposure to settlements and road infrastructure were considered.
In Bangkok, Thailand, the quick scan methodology was used to assess the vulnerability and mitigation of critical infrastructure from floods in urban areas in order to identify and rank critical infrastructural assets and building clusters in flood-prone areas in three communities [10]. This was achieved through the use of stakeholder engagement in workshops and interviews to gain input and feedback. The results demonstrated that secondary roads, markets, shopping centers, residential water supply and sanitation were ranked the highest.
As indicated, different approaches were used in the prioritization of flood risk. While some used stakeholder engagement and quantitative analysis, others applied weights to variables that represented flood hazard, vulnerability or exposure. Currently, there is no specific standard that is available; hence, the methodology used in flood priority studies depends on many factors. Furthermore, most of the studies presented, except [8] and [6], were within urban areas, and might not be applicable at the provincial scale and in rural areas.
Flood assessment can be conducted at various scales [11]: the supra-national (global), macro(national), meso (province, watershed or large city) and micro levels (town or river). Macro-level analysis can include the use of a single model or the aggregation of analysis conducted at the meso-scale; however, this can lead to inconsistency. At the meso-scale, the use of a standard return period can be misleading for large-scale analysis, resulting in the overestimation of flood risk. To overcome this, continuous rainfall runoff and hydrodynamic modelling can be used, but long computational times and the unavailability of data act as hindrances to hydrodynamic modelling at the meso-scale. Therefore, simple methods are normally used to circumvent the aforementioned issues [11]. Hence, the methodology used in flood research depends on the scale of analysis and the availability of data.
In this study, we present two approaches to prioritize flood-prone areas at the meso-scale in New Brunswick, a rural province in Canada. The first method involves a spatial multi-criteria evaluation technique (SMCE) [12]. The second approach involves the use of a geomorphic procedure to delineate floodplains based on a 20-year return period and the assessment of exposed assets [13]. Specifically, the prioritization based on the exposure analysis was conducted by intersecting the flood-prone areas with roads that were ranked similar to the method proposed in France for analyzing potential flood damage to transportation networks at the meso-scale [14]. The United Nations Platform for Space-based Information for Disaster Management and Emergency Response (UN-SPIDER) also suggests a similar approach for the damage assessment of assets after flood events [15].
As indicated by the World Bank [16], multi-criteria assessment is one of the methods that can be used for prioritization, especially in data-scarce environments. However, this approach might be challenging due to the difference in temporal and spatial scales of the datasets, which are available [17] and can have some amount of bias when weights are applied. Nonetheless, there has been an increase in the utilization of this technique for prioritization [18]. Furthermore, multi-criteria analysis is useful for analyzing flood hazard above the micro-scale in order to identify priority areas so that detailed analysis using hydrodynamic models can be conducted [19].
Even though the impact of infrastructural assets during floods can be severe, there a is paucity of studies that assess their impacts [2]. Moreover, most of the studies that have been undertaken might not be applicable in certain environments due to the complexity of the methods, which sometimes lead to unreliable results, particularly in data-sparse regions [20] such as New Brunswick. As a result, the use of a simple technique is sometimes necessary for the identification and ranking of infrastructural assets [10].

2. Materials and Methods

2.1. Study Area

This study was conducted at the provincial scale in New Brunswick, Canada (Figure 2). The province is located in the Atlantic Maritime Ecozone and has an area of approximately 71,388 km2. Based on the Ecological Regions of North America, New Brunswick is classified as the Northern Forests region, which is associated with “long, cold winters and short, warm summers” [21].
The province has a continental climate, though variability occurs. In fact, the mean annual rainfall was estimated at 856 mm, while the mean snow fall is about 303 cm [22]. Mount Carleton, located in the north-central region, is the highest point.
New Brunswick is subdivided into seven ecoregions: the Highland, Northern Upland, Central Upland, Fundy Coastal, Valley Lowland, Eastern Lowland and Grand Lake ecoregions. These regions were classified based on landform, soil, vegetation, water, fauna and climatic factors [23].
The province is vulnerable to flood events; however, as shown in Figure 2, there are limited streamflow gauges. Furthermore, some of the gauges have been discontinued, which makes flood mapping challenging in some areas.

2.2. Methodology

The prioritization of flood-prone areas was completed using two approaches. The first method incorporated a modification of the multi-criteria technique used in Toronto, Canada [24], to conduct flood risk mapping at the provincial level in New Brunswick [12]. The second method included an exposure analysis based on the Geomorphic Flood Area (GFA) tool [13] in QGIS, which is the same technique used to assess the risk of flood damage to the transportation network in France [14]. ArcGIS was used to prepare the dataset used in this study for the multi-criteria and exposure analyses.

2.2.1. Multi-Criteria Analysis

As it relates to the SMCE, each dataset used was assigned the same resolution (20 m) as the Canadian digital elevation model (DEM) that was obtained from the Government of Canada Open Data portal [25]. Afterwards, hydrological and terrain parameters were used to create a flood hazard map, while a socio-economic map was generated from census and land use data in order to create the flood risk map [12,22] for prioritization (Figure 3).
First, a flood hazard map was generated using three scenarios [12]. Scenario 1 included a slope map, the height above nearest drainage (HAND), the distance to stream, the curve number (index which is a function of soil group, land cover and antecedent soil moisture condition to estimate direct runoff from rainfall excess) and total rainfall, while scenario 2 substituted HAND with the topographic wetness index (TWI). Scenario 3 incorporated floodplain, distance to stream, HAND, slope map and curve number. Second, a social vulnerability map was created with the use of data gathered from the 2016 Canadian Census (social) obtained from [26]. The third step involved the creation of an economic vulnerability map using the land-use data (30 m) provided by Agriculture and Agri-Food Canada [27]. Each of the input data was converted to raster format and reclassified (Table 1, Table 2 and Table 3) to values ranging from 1 to 5, where 1 represents low flood risk and 5 refers to high flood risk 3. The indicators were reclassified to reflect the potential risk to flood hazard (the steeper the slopes, the lower the hazard; the closer the distance to river, the higher the hazard; the lower the curve number, the lower the runoff potential; the higher the rainfall value, the higher the risk of flooding; the lower the HAND value, the higher the risk of flooding; the lower the TWI, the lower the risk of flooding). Appendix A shows the different criteria maps used.
Afterwards, a spatial multi-criteria evaluation was conducted using the Integrated Land and Water Information Systems (ILWIS) software [28], where weights were applied to both variables (Table 1 and Table 2). Final weights of 33% and 67% were applied to social and economic vulnerability, respectively, to produce one vulnerability map. The flood hazard and vulnerability maps were then combined to produce a flood risk map with equal weights (50%) applied to both. This resulted in a map with values ranging from 0 to 1, where 0 refers to low flood risk and 1 to very high flood risk. Afterwards, the results were exported to ArcGIS, where they were re-scaled between 0 and 100 and also reclassified using natural breaks. The classification ranged from very high flood risk (Class 5 in dark red) to very low flood risk (Class 1 in dark green). The flood risk map was validated with reported flood events in the province that were obtained from the New Brunswick Flood History Database [12]. The next step involved the prioritization of the flood-prone areas per the dissemination area in ArcGIS using the Zonal Statistics and Frequency Tools based on the flood risk map. The Zonal Statistics tool was used to quantify the mean flood risk per dissemination area, while the Frequency Tool counts the occurrence of each pixel in the very high-risk zone in each of the dissemination areas in order to prioritize potential flood-prone areas. The results were then exported to Excel and ranked. Figure 3 shows the methodology utilized for the multi-criteria analysis. Appendix B shows the risk maps for Scenarios 1, 2 and 3.
Numerous approaches exist for assigning weights when conducting SMCE [29]. Weighting can be selected based on a subjective approach, where decision makers use skills and knowledge to determine the importance of each criterion [30]. Likewise, an objective method can be incorporated, where decision makers are not required to highlight the importance of one criterion over another.
In this study, expert knowledge was used to select the criteria and weights that were applicable to New Brunswick. Following literature review, it was revealed that the criteria and weights used in the Toronto case study [24] might be applicable to the prioritization of flood risk in the province. In fact, a study that was conducted by Environment Canada [31] identified rainfall as the leading cause of flooding in New Brunswick. Therefore, even though the other factors cause floods, rainfall being assigned the highest weight is justifiable within this regard.
Additionally, people over 85 years old were identified as the most vulnerable groups during flood events in New Brunswick [32]. Consequently, the direct weigh method, which allows users to specify relative importance of each factor in ILWIS was used. These weights were then normalized automatically by the software. Given that uncertainty might permeate the analysis through the application of weights, the incorporation of the three different scenarios becomes important.

2.2.2. Exposure Analysis–DEM-Based Identification

The prioritization of flood-prone areas based on the exposure analysis was based on the technique used to assess the risk of flood damage to transportation network in France [14]. This approach was tested because it was conducted at the meso-scale, which is the same level of our analysis. The floodplain was delineated based on the 20-year return period using the GFA tool in QGIS [13]. The parameters extracted from the Canadian DEM (raw DEM, filled DEM, flow direction, flow accumulation) and flood extent from GeoNB [28] for calibration were inputs for the Geomorphic Flood Area (GFA) tool. Figure 4 illustrates the floodplain that was generated.
The railway and road network derived from GeoNB [33] were merged, reclassified and ranked (the higher the number, the greater the potential damage) similar to the methodology used in France [14] as shown in Table 4. Subsequently, the Intersect tool in ArcGIS was used to combine the floodplain and transportation network maps to produce one map. The final step involved the prioritization of the exposed transportation network using natural breaks.
Only the transportation network was ranked. The floodplain was used as a hazard layer with no value range. Therefore, the hazard layer was just intersected with the road and railway layer that was ranked to produce the final result, using natural breaks. When combined, the roads that are ranked higher, will have a greater risk of being damaged. This was essential to highlight the current situation in the province, as major thoroughfares are impacted the most.

3. Results

3.1. Flood Risk Prioritization Based on Multi-Criteria Analysis

The results obtained from the prioritization study using the SMCE analysis are presented below in the form of maps (Figure 5, Figure 6 and Figure 7) and Tables (Table 5 and Table 6) per dissemination area (CSDNAME) obtained from Statistic Canada [25]. Scenario 1 included a slope map, height above nearest drainage (HAND), distance to stream, curve number and total rainfall while scenario 2 substituted HAND with topographic wetness index (TWI). Scenario 3 on the other hand incorporated floodplain, distance to stream, HAND, slope map and curve number.
As indicated, the level of risk varies across the province. In Scenario 1 (Figure 5), high to very high flood-prone areas are concentrated in the dissemination areas that are within the south-central region (Inset C). Even though the areas with moderate flood risk varies, the majority are located in the east central zone. Likewise, flood-prone areas vary from moderate to low in the Acadian Peninsula (Figure 2) while the north central zone is characterized with low to very low risk.
In Scenario 2 (Figure 6), there is an increase in flood risk for the dissemination areas in the north (Inset A), as some sections changed from low to moderate. More moderate flood risk is also visible for the Acadian Peninsula. However, a reduction in flood risk is evident in the south eastern part of the province.
For Scenario 3 (Figure 7), the classification with moderate to high flood-prone areas increases and are confined to some of the major towns and cities with higher populations compared to the rest of the province. Additionally, more dissemination areas are classified as moderate flood-prone regions in the north (Inset A). The majority of the dissemination areas in Inset B have a high flood risk, while the risk is reduced for Inset C.
In order to generate the prioritization list from the multi-criteria analysis, the Zonal Statistics as Table tool in ArcGIS was used. The results from the analysis indicate the average flood risk per dissemination area (Table 5). Only the dissemination areas that are ranked as very high flood-prone areas are included, along with the mean value of the flood risk map (ranking was done on actual value even though rounded value is shown). As indicated, Oromocto 26 is ranked the highest in all the scenarios, as it relates to the dissemination areas that are located within the very high flood risk zone. Scenario 1 has the majority of the dissemination areas ranked very high (41), while Scenario 3 has the least (19). As illustrated, Scenarios 1 and 2 have the same dissemination areas ranked in the top three. The results also show the change in the ranking of flood-prone areas in each of the scenarios.
Another set of prioritizations from the multi-criteria analysis was conducted using the Frequency tool in ArcGIS, where the results were produced in tabular form. For this, the flood risk map was converted to polygon and the very high flood risk areas were extracted for ranking in Excel. Table 6 shows the top 35 prioritization list based on the number of occurrences of the pixels classified with a very high flood risk per dissemination area. Northesk is ranked the highest in Scenarios 2 and 3, while Brunswick is the highest ranked flood-prone area in Scenario 1. Similar to Table 5, the ranking of flood-prone areas varies in each scenario.

3.2. Flood Risk Prioritization Based on Exposure Analysis

The results from the flood exposure analysis are presented in Figure 8. As demonstrated, the number of exposed roads and railways within the floodplain based on the 20-year return period varies. However, the majority of the transportation network that is at high to very high risk of flooding is located along the coast in the north, northwest and south-center of the province. High to very high risk is also depicted in the Acadian Peninsula and southeast region. It is also noticeable that the risk of damage is lower in the north central region.
The prioritization list (Top 35) generated from the exposure analysis, as it relates to the risk of damage to roads and railways, is presented based on the zonal statistics (Table 7) and frequency analysis per dissemination area (Table 8). Some of the flood exposure results were validated based on expert knowledge and the literature. In Table 7, Hanwell is ranked the highest.
Based on the frequency analysis, Tracadie (located along the Acadian Peninsula) is ranked as having the highest risk of damage (Table 8). While some of the roads are ranked as having a high risk of potential damage, this does not mean that they will be flooded. For instance, the results are based on the quality of the data used and might not reflect road improvements that will likely reduce the flood risk. Furthermore, some sections of roads might be elevated or have structural protection from inundation, such as dykes, which might not be impacted during regular flood events. However, flooding from extreme events, ice jam, dyke break and the damming of the river could cause them to be at risk.

4. Discussion

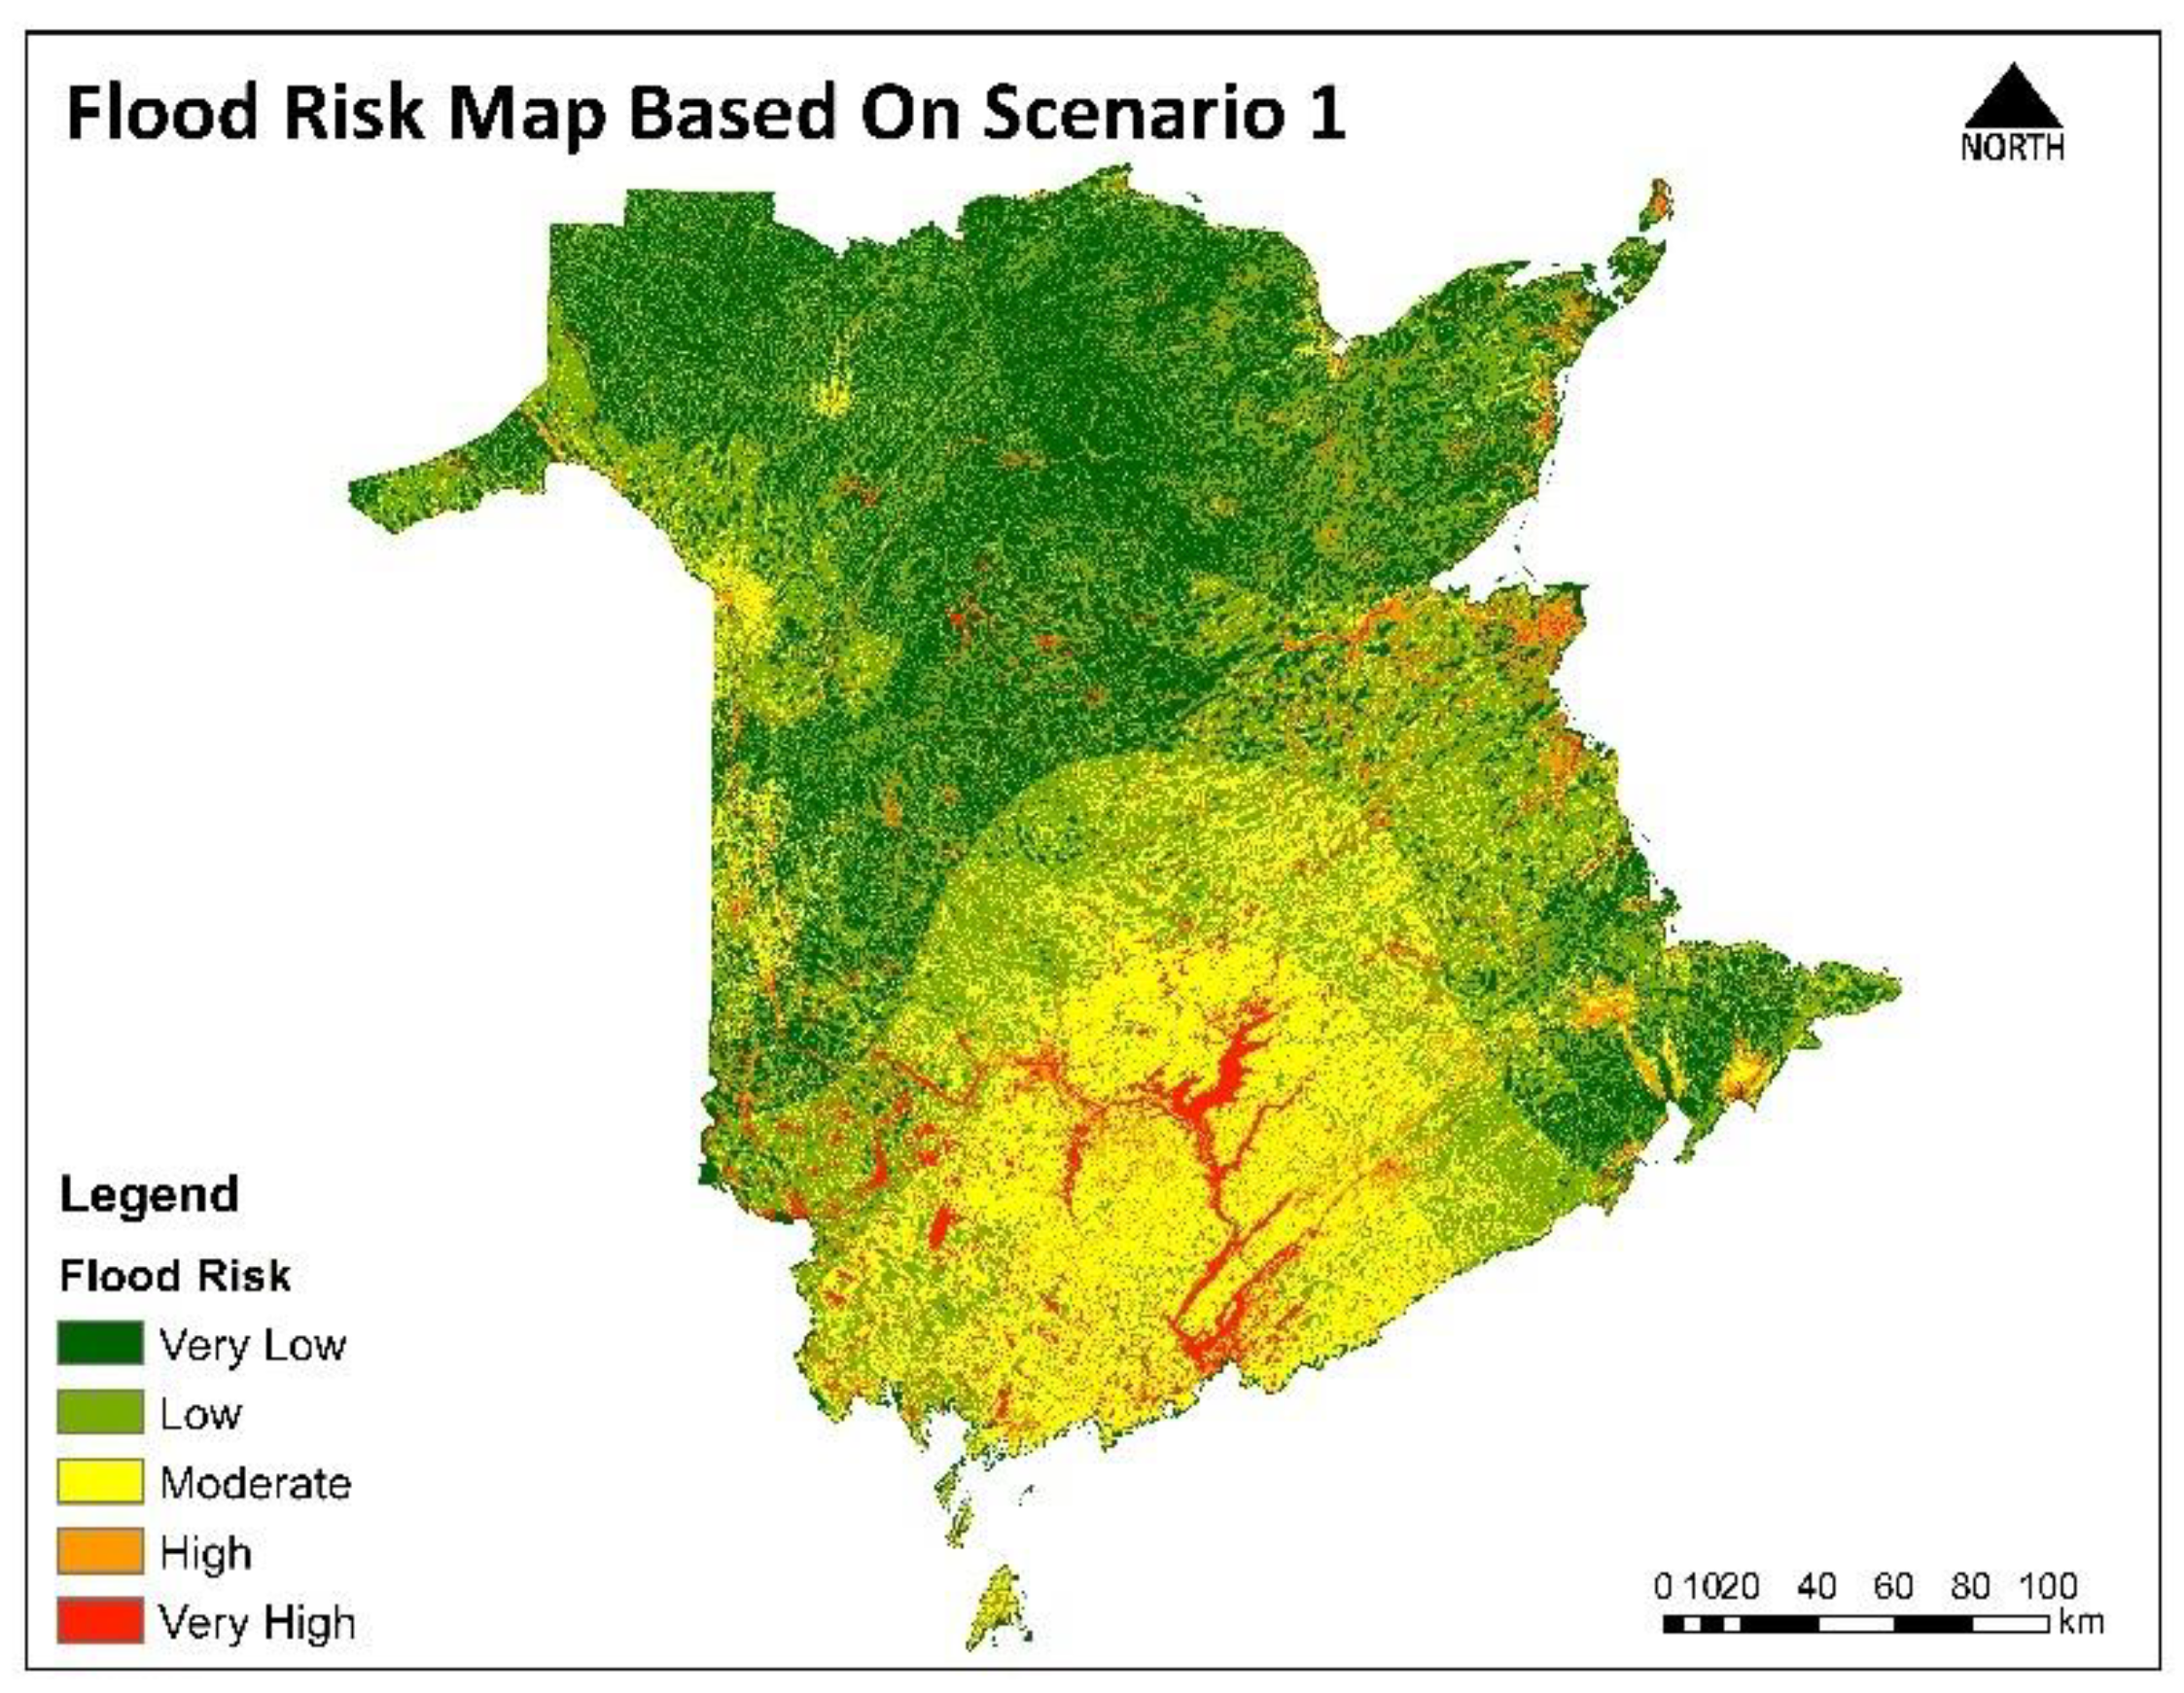
The results obtained from the multi-criteria analysis indicate the complexity involved when prioritizing flood-prone areas at the provincial scale. It is evident that both scenarios 1 and 2 have similarities in terms of the predominance of high flood-prone areas in the south-central part of the province, which is where the capital (Fredericton) and a major city (Saint John) are located. However, the ranking of flood-prone areas changed with each scenario. One possible reason could be due to the fact that scenarios 1 and 2 incorporated rainfall as the main variable that influence floods. In contrast, the floodplain was assigned the higher weight in scenario 3 and rainfall was not included. These very high flood risk areas, observed in dark red, were assigned the highest rainfall values, which implies that the flood hazard map with rainfall had a stronger influence on the results that were generated. Furthermore, HAND is based on height of the drainage network, while TWI demonstrates areas that are likely to become saturated. On the other hand, the floodplain is limited to the flat areas close to river channels that can be flooded.
The areas in the south-central region of the maps (Figure 9) with high risk are in line with flood risk zones that have been mapped in New Brunswick [33]. As demonstrated, many areas are unmapped, even though floods have been reported elsewhere. This provides justification for the use of SMCE in order to identify flood-prone areas that are needed for mapping purposes.
In the exposure analysis, the smaller roads were ranked lower, but the impact of the damage can be enormous, especially in rural areas when repairs are required for a small amount of people. To gain an overview of the impact of roads during floods in the province, the event between 14 April and 20 April 2014, is highlighted. This event caused damage to about 715 homes and commercial entities and the transportation network, which resulted in the closure of numerous roads [1]. The total damage from this event was estimated at $16 million Canadian dollars [1]. Moncton, for example, recorded about six road closures on 11 April 2014, while three roads were closed on 16 April 2014. In Sussex and Sussex Corner, about 1450 people had to be evacuated and numerous roads were damaged. Road closure was also reported in Miramichi, Fredericton, Saint John, Sackville and areas connected with the Trans-Canada Highway [1].
Another catastrophic flood includes the 2018 event that led to the closure of about 81 roads, including the Trans-Canada Highway, mostly along the Saint John River from Fredericton to Saint John [34]. Additionally, the flood between 15 April and 16 April 1994, which affected the Cains River Road in Upper Blackville, caused disruption to movement [1]. The number of roads affected shows the vulnerability of transportation networks during flood events in the province, which can affect the movement of goods, services and evacuation exercise during an emergency.
As demonstrated, it is difficult to use one standard approach to prioritize flood-prone areas, as the ranking can change depending on the criteria that are used. Similar to our study, the flood risk prioritization analysis that was conducted in Columbia [8] revealed changes in the level of vulnerability when a sensitivity analysis was conducted. Specifically, the results obtained were sensitive to the criteria used, as the vulnerability changed from low to medium and medium to high in some instances.
The challenge is, therefore, how to aggregate the risk, as the same dissemination areas in our study are not always ranked first in all the scenarios. This shows the difficulty involved in conducting flood risk prioritization at the meso-scale and the importance of using expert knowledge and stakeholder engagement. While expert knowledge was utilized, the use of stakeholders was a major limitation in our study due to COVID-19. The question is, therefore, on which basis should we evaluate and prioritize areas that are prone to flooding? Certainly, the level of risk will change depending on the methodology, criteria and scale of analysis as demonstrated. Hence, a standard methodology might not be feasible and should be developed based on the objective of the study.
It must be noted that the results obtained in this study are based on a methodology that was feasible, given the data availability and the objective. Numerous approaches exist, but the scale of our analysis presented challenges for replicability. For instance, the following author [35] illustrates the scales at which hazard assessments are normally conducted (Table 9). As indicated, the provincial level normally covers 1000–10,000 km2. However, New Brunswick has an area of about 71,388 km2, which is more in line with studies that are generally conducted at the national level (area between 30–600 thousand km2), as shown in Table 9.
In some research, one-dimensional models are used to approximate peak flow at the provincial scale [35]. Even though New Brunswick has many rivers, most of the streams are ungauged, which makes the use of such models challenging for use at the meso-scale. Moreover, the incorporation of building information such as height, type and use can be incorporated in flood assessment at the provincial scale with results generated from the models [35]. However, in New Brunswick detailed building information is not yet available for every location. This illustrates the challenges, as it relates to conducting flood hazard and risk assessment at the provincial scale, as the methodologies used in most studies are not always applicable in other locations. Therefore, we tested two approaches that were feasible based on the data availability, computational time and scale of the analysis.
Our approach falls within the context of a qualitative technique, which is normally useful for the identification of hazards and risks as a screening tool, especially at the provincial scale in data-sparse areas [35]. Since the approach used in this study was for screening purposes, other studies should be conducted based on a quantitative approach at other scales in order to obtain the direct and indirect losses for elements at risk (assets).

5. Conclusions

This study prioritized flood-prone areas at the provincial scale based on a qualitative approach in order to identify areas that will require detailed flood mapping using hydrodynamic models. The results from the multi-criteria and exposure analyses revealed some important aspects, as they relate to data, methodology, scale and decision-making, where risk and the prioritization of flood-prone areas are concerned.
Despite the complexity involved in flood assessment at the provincial scale, some patterns are evident. From the multi-criteria analysis, dissemination areas with high to very high flood-prone areas are located mostly in the south-central region of the province, while the lowest-ranked flood-prone areas are concentrated in the north central section in Scenarios 1 and 2 of the SMCE.
Similarly, transportation networks that have a high to very high risk of being damaged are located within the south-central section of the province, although some can be found along the coast and the north-west.
The results also indicate how prioritization changes based on the criteria used, which suggest that a standard methodology might not be applicable when ranking flood-prone areas. Nonetheless, this study can be applied to other locations where data paucity is a challenge.

Author Contributions

Conceptualization, S.H. and A.-M.L.; methodology, S.H.; software, S.H.; validation, S.H., A.-M.L. and A.H.; formal analysis, S.H.; investigation, S.H.; resources, S.H. and A.-M.L.; data curation, S.H., A.-M.L. and A.H.; writing—original draft preparation, S.H.; writing—review and editing, A.-M.L., J.B. and A.H.; visualization, S.H.; supervision, A.-M.L. and J.B.; project administration, A.-M.L.; funding acquisition, A.-M.L. and J.B. All authors have read and agreed to the published version of the manuscript.

Funding

This research was funded by the New Brunswick Department of Environment and Local Government and the National Disaster Mitigation Program (Public Safety Canada).

Acknowledgments

The authors are grateful to all members of the Inland Flood Mapping Project at the Laboratoire des sciences hydriques et climatiques at Université de Moncton for their assistance. We thank the two anonymous reviewers for their valuable comments of this manuscript.

Conflicts of Interest

The authors declare no conflict of interest.

Appendix A

Figure A1. Slope Map.
Geosciences 10 00478 g0a1
Figure A2. Total Rainfall.
Geosciences 10 00478 g0a2
Figure A3. Distance to Stream.
Geosciences 10 00478 g0a3
Figure A4. Height Above Nearest Drainage.
Geosciences 10 00478 g0a4
Figure A5. Curve Number.
Geosciences 10 00478 g0a5
Figure A6. Topographic Wetness Index.
Geosciences 10 00478 g0a6
Figure A7. Floodplain.
Geosciences 10 00478 g0a7
Figure A8. Lone Parents.
Geosciences 10 00478 g0a8
Figure A9. Population Over 85 Years Old.
Geosciences 10 00478 g0a9
Figure A10. Population Speaking Neither English Nor French.
Geosciences 10 00478 g0a10
Figure A11. Children Below 5 Years Old.
Geosciences 10 00478 g0a11
Figure A12. Total Median Income Per Household.
Geosciences 10 00478 g0a12
Figure A13. Population with High School Education Or Less.
Geosciences 10 00478 g0a13
Figure A14. Population Density (km2).
Geosciences 10 00478 g0a14
Figure A15. Population living In Rented Apartments.
Geosciences 10 00478 g0a15
Figure A16. Land Use.
Geosciences 10 00478 g0a16

Appendix B

Figure A17. Flood Risk Map Based on Scenario 1.
Geosciences 10 00478 g0a17
Figure A18. Flood Risk Map Based on Scenario 2.
Geosciences 10 00478 g0a18
Figure A19. Flood Risk Map Based on Scenario 3.
Geosciences 10 00478 g0a19

References

  1. ELGNB. Flood History Database. Available online: https://www.elgegl.gnb.ca/0001/en/Flood/Index (accessed on 14 August 2020).
  2. Pant, R.; Thacker, S.; Hall, J.W.; Alderson, D.; Barr, S. Critical infrastructure impact assessment due to flood exposure. J. Flood Risk Manag. 2018, 11, 22–33. [Google Scholar] [CrossRef]
  3. Lau, R. Flooding Forces Highway Closure between Moncton and Fredericton. Available online: https://globalnews.ca/news/4184512/flooding-forces-highway-closure-between-moncton-and-fredericton/ (accessed on 4 August 2020).
  4. Natural Resources Canada, Public Safety Canada. Federal Flood Mapping Framework. version 2.0. 2018, p. 112e. Available online: https://www.publicsafety.gc.ca/cnt/mrgnc-mngmnt/dsstr-prvntn-mtgtn/ndmp/fldpln-mppng-en.aspx (accessed on 1 November 2019).
  5. WSP. Flood Risk Assessments Halifax Regional Municipality. Available online: https://www.halifax.ca/sites/default/files/documents/city-hall/regional-council/181016rc1421.pdf (accessed on 1 November 2019).
  6. BGC Engineering. Flood and Steep Creek Geohazard Risk Prioritization; BGC Engineering Inc.: Vancouver, BC, Canada, 2019; p. 280. [Google Scholar]
  7. EPCOR Water Services Inc. Stormwater Integrated Resource Plan (SIRP)- Capital and Operational Plan Alternatives 2019. Available online: https://webcache.googleusercontent.com/search?q=cache:F2DX0ZzkZUUJ (accessed on 1 November 2019).
  8. Rogelis, M.C.; Werner, M.; Obregón, N.; Wright, N. Regional prioritisation of flood risk in mountainous areas. Nat. Hazards Earth Syst. Sci. 2016, 16, 833–853. [Google Scholar] [CrossRef] [Green Version]
  9. Vercruysse, K.; Dawson, D.A.; Glenis, V.; Bertsch, R.; Wright, N.; Kilsby, C. Developing spatial prioritization criteria for integrated urban flood management based on a source-to-impact flood analysis. J. Hydrol. 2019, 578, 124038. [Google Scholar] [CrossRef]
  10. Zevenbergen, C.; van Herk, S.; Escarameia, M.; Gersonius, B.; Serre, D.; Walliman, N.; de Bruijn, K.M.; de Graaf, R. Assessing quick wins to protect critical urban infrastructure from floods: A case study in Bangkok, Thailand. J. Flood Risk Manag. 2018, 11, S17–S27. [Google Scholar] [CrossRef]
  11. de Moel, H.; Jongman, B.; Kreibich, H.; Merz, B.; Penning-Rowsell, E.; Ward, P.J. Flood risk assessments at different spatial scales. Mitig. Adapt. Strat. Glob. Chang. 2015, 20, 865–890. [Google Scholar] [CrossRef] [PubMed] [Green Version]
  12. Henry, S.; Laroche, A.-M.; Boisvert, J. Identifying flood risk areas in New Brunswick using GIS. In Proceedings of the 53rd International Conference on Water Management Modeling, Toronto, ON, Canada, 26–27 February 2020. [Google Scholar]
  13. Samela, C.; Albano, R.; Sole, A.; Manfreda, S. A GIS tool for cost-effective delineation of flood-prone areas. Comput. Environ. Urban Syst. 2018, 70, 43–52. [Google Scholar] [CrossRef]
  14. Saint Martin, C.; Fouchier, C.; Javelle, P.; Douvinet, J.; Vinet, F. Assessing the exposure to floods to estimate the risk of flood-related damage in French Mediterranean basins. In Proceedings of the 3rd European Conference on Flood Risk Management (FLOODrisk 2016), Lyon, France, 17–21 October 2016; Volume 7, p. 04013. [Google Scholar]
  15. UN-Spider Knowledge Portal Recommended Practice: Flood Mapping and Damage Assessment Using Sentinel-2 (S2) Optical Data. Available online: http://www.un-spider.org/advisory-support/recommended-practices/recommended-practice-flood-mapping-and-damage-assessment (accessed on 12 August 2020).
  16. Kappes, M. Document Detail. Available online: https://documents.worldbank.org/en/publication/documents-reports/documentdetail (accessed on 4 August 2020).
  17. Henry, S.; Mendonça, F.A. Past, Present, and Future Vulnerability to Dengue in Jamaica: A Spatial Analysis of Monthly Variations. Int. J. Environ. Res. Public Health 2020, 17, 3156. [Google Scholar] [CrossRef] [PubMed]
  18. Thokala, P.; Madhavan, G. Stakeholder involvement in Multi-Criteria Decision Analysis. Cost Eff. Resour. Alloc. 2018, 16, 1–13. [Google Scholar] [CrossRef] [PubMed]
  19. Cabrera, J.S.; Lee, H.S. Flood risk assessment for Davao Oriental in the Philippines using geographic information system-based multi-criteria analysis and the maximum entropy model. J. Flood Risk Manag. 2020, 13, e12607. [Google Scholar] [CrossRef] [Green Version]
  20. McBain, W.; Wilkes, D.; Retter, M. Flood Resilience and Resistance for Critical Infrastructure; CIRIA: London, UK, 2010. [Google Scholar]
  21. Commission for Environmental Cooperation (CEC) Ecological Regions of North America—Toward a Common Perspective 1997. Available online: https://www.sciencebase.gov/catalog/item/537f6c83e4b021317a872a98 (accessed on 10 November 2019).
  22. Government of Canada. Available online: https://climate.weather.gc.ca/historical_data/search_historic_data_e.html (accessed on 30 August 2020).
  23. Marshall, I.B.; Ballard, M. A National Ecological Framework for Canada: Attribute Data, Research Branch, Centre for Land and Biological Resources Research and Environment Canada, State of the Environment Directorate, Ecozone Analysis Branch Ottawa/Hull. Available online: http://sis.agr.gc.ca/cansis/nsdb/ecostrat/1999report/framework.html (accessed on 16 August 2020).
  24. Rincón, D.; Khan, U.T.; Armenakis, C. Flood Risk Mapping Using GIS and Multi-Criteria Analysis: A Greater Toronto Area Case Study. Geosciences 2018, 8, 275. [Google Scholar] [CrossRef] [Green Version]
  25. Natural Resources Canada. Canadian Digital Elevation Model, 1945–2011. Available online: https://open.canada.ca/data/en/dataset/7f245e4d-76c2-4caa-951a-45d1d2051333 (accessed on 14 August 2020).
  26. Statistics Canada Census Profile, 2016 Census. Available online: https://www12.statcan.gc.ca/census-recensement/2016/dp-pd/prof/index.cfm?Lang=E (accessed on 14 August 2020).
  27. Soil Landscapes of Canada Working Group. Soil Landscapes of Canada Version 3.2. In Agriculture and Agri-Food Canada. (Digital Map and Database at 1:1 Million Scale). 2010. Available online: http://sis.agr.gc.ca/cansis/nsdb/slc/v3.2/index.html (accessed on 1 November 2019).
  28. ILWIS. ILWIS 3.86 The Integrated Land and Water Information System. 52° North ILWIS Community. 2020. Available online: https://52north.org/software/software-projects/ilwis/ (accessed on 1 November 2019).
  29. Sharifi, M.A.; Retsios, V. Site selection for waste disposal through Spatial Multiple Criteria Decision Analysis. In Proceedings of the 3rd International Conference on Decision Support for Telecommunications and Information Society DSTIS, Warsaw, Poland, 4–6 September 2003; p. 15. [Google Scholar]
  30. Zagonari, F.; Rossi, C. A heterogeneous multi-criteria multi-expert decision-support system for scoring combinations of flood mitigation and recovery options. Environ. Model. Softw. 2013, 49, 152–165. [Google Scholar] [CrossRef] [Green Version]
  31. Environment Canada. Flooding Events in Canada: Atlantic Provinces. Available online: https://www.canada.ca/en/environment-climate-change/services/water-overview/quantity/floods/events-atlantic-provinces.html (accessed on 20 March 2020).
  32. Mioc, D.; Moreiri, K.K.; Nkhwananam, J.N.; Anton, B.; Nickerson, B.; McGillivray, E.; Morton, A.; Tang, P. On-line early warning system for evacuation of socially vulnerable population during flooding. WIT Trans. Ecol. Environ. 2012, 159, 67–78. [Google Scholar] [CrossRef]
  33. GeoNB. Data Catalogue—GeoNB. Available online: http://www.snb.ca/geonb1/e/DC/catalogue-E.asp (accessed on 14 August 2020).
  34. Global News. By the Numbers: New Brunswick’s Record-Setting Flood. Available online: https://globalnews.ca/news/4187955/by-the-numbers-new-brunswicks-record-setting-flood-2/ (accessed on 4 August 2020).
  35. Van Westen, C.J. Remote Sensing and GIS for Natural Hazards Assessment and Disaster Risk Management. In Treatise on Geomorphology; Shroder, J.F., Ed.; Academic Press: San Diego, CA, USA, 2013; pp. 259–298. ISBN 978-0-08-088522-3. [Google Scholar]
Figure 1. Federal flood mapping framework. Source: NRCan [4].
Geosciences 10 00478 g001
Figure 2. Location of study area.
Geosciences 10 00478 g002
Figure 3. Flood risk prioritization schematization based on SMCE.
Geosciences 10 00478 g003
Figure 4. Floodplain generated with GFA.
Geosciences 10 00478 g004
Figure 5. Flood risk prioritization based on Scenario 1 using zonal statistics.
Geosciences 10 00478 g005
Figure 6. Flood risk prioritization based on scenario 2 using zonal statistics.
Geosciences 10 00478 g006
Figure 7. Flood risk prioritization based on scenario 3 using zonal statistics.
Geosciences 10 00478 g007
Figure 8. Transportation network that is at risk of being damaged.
Geosciences 10 00478 g008
Figure 9. Historical floods in New Brunswick. Adapted from GeoNB [33].
Geosciences 10 00478 g009
Table 1. Flood hazard indicators and weight.
Hazard IndicatorCategoryHazard ReclassificationScenario 1 Weight [%]Scenario 2 Weight [%]Scenario 3 Weight [%]
Slope (degrees)0–105141412
11–204
21–303
31–502
>511
Distance to Stream (m)0–1005252522
101–3004
301–5003
501–10002
>10001
Curve Number30–391998
40–612
62–773
78–854
86–1005
Total Rainfall (mm)76–9413636
95–1102
111–1293
130–1524
>1525
HAND0–5516 13
6–104
11–153
16–202
>211
TWI1–71 16
8–92
10–113
12–164
17–285
Floodplain 45
Source: adapted from the flood risk assessment study in New Brunswick and Toronto [12,24].
Table 2. Criteria used for social vulnerability.
DemographyIndicatorsSpecific IndicatorsWeight [%]
Demographic characteristicsAgePeople 85 years and older18
Children four years and younger17
Family structureLone parents16
Language proficiencyNon-English or French-speaking people15
Socio-economic statusIncomeTotal Median Income Per Household11
EducationHigh school education or less9
Land tenureRentersRented apartments8
Neighborhood characteristicsPopulation densityPopulation density per km26
Source: Adapted from the Risk Assessment Study in New Brunswick and Toronto [12,24].
Table 3. Classes for Economic Vulnerability.
ClassLevelLand Use
5Very highWater Bodies and Wetlands
4HighDeveloped
3ModerateAgriculture
2LowGrassland
1Very lowForest
Source: adapted from the risk assessment study in New Brunswick [12].
Table 4. Example of the ranking of the roads.
Original ClassificationClassification UsedRank
HighwayFreeway and highway, service lane, weigh station7
Highway rampHighway ramp6
Two lanes roadCollector, arterial5
RailwayRailway5
One lane roadLocal, NBDOT Local Named, local named numbered, NBDOT Road Public Access4
Small laneAlleyway3
Stone-paved, gravel roadDOT local named gravel, NBDNR Resource Roads2
Cycle trackLocal strata, local street, unknown, non-vehicular addressed segment1
Source: Adapted from the Study in France [14].
Table 5. Prioritization list based on zonal Statistics with a very high ranking.
Scenario 1Scenario 2Scenario 3
RankCSDNAMEMeanCSDNAMEMeanCSDNAMEMean
1Oromocto 264.7Oromocto 264.4Oromocto 264.8
2Canning4.0Canning4.0Rexton4.3
3Oromocto3.9Oromocto4.0Canning3.6
4Cambridge3.9St. Martins4.0Riverside-Albert3.6
5Fredericton3.9Rothesay3.9Oromocto3.5
6Rothesay3.8Fredericton3.9Bath3.5
7Fredericton Junction3.7Quispamsis3.8Indian Ranch3.5
8Plaster Rock3.7Cambridge3.8Plaster Rock3.3
9Quispamsis3.7Plaster Rock3.8Riverview3.3
10Riverside-Albert3.6Saint John3.8Derby3.3
11Kingston3.6Fredericton Junction3.7Dieppe3.2
12Saint John3.5Kingston3.6Richibucto 153.2
13Burton3.5St. Stephen3.6Inkerman3.2
14Cambridge-Narrows3.5Riverside-Albert3.5Saint-Louis de Kent3.2
15Rexton3.5Sussex Corner3.5Fredericton Junction3.0
16Saint-Louis de Kent3.5St. George3.5Aroostook2.9
17Lincoln3.5Minto3.5Chatham2.9
18Bath3.5Cambridge-Narrows3.5Fredericton2.9
19Kars3.5Lincoln3.5Perth-Andover2.9
20Sussex Corner3.4Grand Bay-Westfield3.5
21Wickham3.4Burton3.5
22Minto3.4Kars3.5
23Gagetown3.4Greenwich3.4
24Sheffield3.4Wickham3.4
25Grand Bay-Westfield3.4Hampton3.4
26Norton3.3Musquash3.4
27Greenwich3.3Rexton3.4
28Perth-Andover3.3Sheffield3.4
29Centreville3.3Bath3.4
30Westfield3.3Westfield3.4
31Hampton3.3Centreville3.4
32Waterborough3.3Saint-Louis de Kent3.3
33Hampstead3.3Perth-Andover3.3
34St. George3.2Norton3.3
35Sussex3.2Waterborough3.3
36Musquash3.2Gagetown3.3
37Hanwell3.2Hampstead3.3
38Clarendon3.2Hanwell3.3
39Blissville3.2Clarendon3.3
40Springfield3.2Lepreau3.3
41Grand Falls/Grand-Sault3.2
Table 6. Prioritization list based on frequency analysis with a very high flood risk.
Scenario 1Scenario 2Scenario 3
RankCSDNAMEFrequencyCSDNAMEFrequencyCSDNAMEFrequency
1Brunswick6229Northesk15,866Northesk4003
2Maugerville5952Southesk14,414Southesk2987
3Southesk5772Harcourt11,312Lorne2515
4Saint Martins5365Blissfield9715Tracadie2306
5Harcourt5209Brunswick9289Bathurst2102
6Upper Miramichi5196Bathurst9073Eldon1703
7Blissfield5188Upper Miramichi8737Saint-Quentin1575
8Douglas4688Maugerville8667Glenelg1452
9Waterborough4302Saint John8582Chipman1431
10Petersville4194Douglas8334Blackville1420
11Clarendon4018Lorne7280Salisbury1412
12Saint Marys3842Saint Martins7022Harcourt1404
13Saint James3817Glenelg7001Upper Miramichi1392
14Studholm3814Waterborough6374Gordon1387
15Chipman3718Blackville6311Inkerman1310
16Saint George3670Studholm6189Douglas1292
17Burton3630Caraquet6171Stanley1176
18Northesk3621Chipman6124Blissfield1160
19Pennfield3598Saint Marys6063Canning1103
20Gagetown3465Petersville5657Weldford1091
21Blackville3203Shippagan5347Saint George1069
22Lorne3108Saint George5331Balmoral1060
23Johnston3065Saint James5274Brunswick1047
24Stanley3029Stanley5223Alnwick1015
25Gordon2849Burton5134Waterborough965
26Salisbury2707Pennfield5107Studholm964
27Manners Sutton2618Salisbury5071Sackville948
28Lepreau2556Fredericton4973Maugerville936
29Northfield2392Huskisson4803Richibucto932
30Glenelg2381Carleton4784Denmark920
31Saint John2360Johnston4673Drummond919
32Sussex2282Gordon4670Addington842
33Sheffield2232Clarendon4607Manners Sutton829
34Norton2225Sussex4536Hardwicke783
35Kingston2215Gagetown4378Saint James774
Table 7. Risk of damage from road and railway prioritization based on zonal statistics.
RankCSDNAMEMean
1Hanwell5.7
2Botsford5.5
3Dalhousie5.5
4Derby5.1
5Fort Folly 15.0
5Shippagan5.0
7Andover4.9
8Saint-Léonard4.9
9Sainte-Anne-de-Madawaska4.8
10Saint Stephen4.8
11Queensbury4.6
12Saint David4.6
13Nelson4.6
14Wicklow4.6
15St. Stephen4.6
16Saint Croix4.6
17Dumfries4.5
18Southampton4.5
19Northampton4.5
20Dorchester4.5
21Peel4.5
22Pennfield4.4
23Musquash4.4
24Tracy4.4
25Florenceville-Bristol4.4
26Cardwell4.4
27Brunswick4.4
28Saint-Hilaire4.4
29Durham4.4
30Meductic4.3
31Hopewell4.3
32Norton4.3
33Harvey4.3
34St. Hilaire4.3
35Blissville4.2
Table 8. Risk to damage from road and railway prioritization based on frequency analysis.
FrequencyCSDNAMEFinal Rank
69Tracadie1
68Moncton2
49Sussex3
37Blackville4
35Alnwick5
33Edmundston6
29Musquash7
28Cardwell8
28Miramichi8
28Saint John8
26Eldon11
26Shediac11
25Salisbury13
24Bathurst14
23Inkerman15
23Saint-Léonard15
22Lincoln17
22Neguac17
22Richibucto17
21Sackville20
20Fredericton21
17Doaktown22
17Rivière-Verte22
16Bertrand24
16Derby24
16Upper Miramichi24
15Pennfield27
15St. George27
15Wellington27
14Norton30
14Sainte-Anne30
14Westmorland30
13Burton33
13Johnston33
13Lepreau33
Table 9. Scales for hazard assessment.
ScaleLevelCartographic Scale (million)Spatial ResolutionArea Covered (km2)
GlobalGlobal<1:51–5 km148 million
Very smallContinental/large countries1–515–20 million
SmallNational0.1–10.1–1 km30–600 thousand
RegionalProvincial0.05–0.1100 m1000–10,000
MediumMunicipal0.025–0.0510m100
LargeCommunity>0.0251–5m10
Publisher’s Note: MDPI stays neutral with regard to jurisdictional claims in published maps and institutional affiliations.

