Abstract
Soils are naturally occurring materials that carry loads of civil engineering structures including roads and buildings. However, not all natural soils are suitable for such uses due to limited strength and instability under varying environmental conditions. A lack of adequate geotechnical investigations and soil characterization can result in the over-design of foundations, unexpected excavations to remove unsuitable soils, cost overruns, construction delays; and, contract disputes. In this research, an experimental plan was executed to determine the engineering properties of subgrade soil in Jimma Town in southwestern Ethiopia by using both disturbed and undisturbed soil samples. The plan included tests to determine the moisture content, specific gravity, grain-size analysis, Atterberg limits, compaction-density relationship, California Bearing Ratio (CBR), unconfined compression strength, and triaxial shear strength. X-ray diffraction (XRD) analysis was also conducted to determine the chemical composition of the soil. The soil characterization indicated that soft clay is the predominant subgrade soil type and that it has a very low load-bearing capacity, high plasticity, low strength and, high compressibility, which makes the soil unsuitable to serve as a highway subgrade without the help of soil improvement techniques.
1. Introduction
Soil is a complex heterogeneous material that contains different minerals, resulting from the weathering or disintegration of rocks due to various physical phenomena. The properties of soil vary from one location to another since they are naturally occurring materials [1]. Soils are porous materials created on the earth’s surface through the processes of weathering. It is a multi-phase material that contains solids, liquids, and gases. In the soils, matter and energy exchange with the atmosphere, biosphere, and hydrosphere [2]. The speed of weathering for the formation of soil and the percentage of fine particles are the two crucial factors that can affect the geotechnical properties of soils [3]. Soils are naturally occurring materials that play a vital role in the design, construction, and performance of civil engineering structures. However, not all naturally occurring soils are appropriate for all uses due to the mechanical, physical, and chemical properties, as well as constructability. Soils are characterized in several ways, and one of which is its designation as soft. Soft soils have relatively low stiffness, and a high level of deformation when a load has applied the deformation of soft soils is high due to its relatively low stiffness. Therefore, the deformation analysis should consider soft soil as a large-deformation continuum approach of elastic and plastic material [4]. Soil geological origin, formation, and evolution processes of natural soils affect the nature of soils and their mechanical properties [5].
Soft clay soils are deposits of sedimentary soils under the alluvial, marine, lacustrine, or similar environment. They are highly compressible and have low shear strength, with a moderate to high clay fraction, making them highly plastic [6,7]. Soft soils are non-homogeneous and have highly variable and complex properties that are attributed to varying combinations of fibrous and amorphous materials of peat, clay, and silt [8].
The identification of problematic subgrades such as soft soils is essential at the project planning and design stages. Inadequate geotechnical site investigations can cause over-design, cost overruns, project delays, disputes, and unexpectedly deep excavations in areas that involve soft soils [9,10]. Disturbed soft soils are known for strength loss when remolded in a laboratory. Fine-grained soils can be highly compressible and overconsolidated [11]. There are several approaches for identifying and classifying soft soils. The oldest one was proposed by Terzaghi et al. [12], where clay is classified as soft soil when the unconfined compressive strength is less than 50 kPa. Das [13] suggested that a void ratio of soft soil is in the range of 0.9–1.4, and the dry unit weight ranges from 11.5–14.5 kN/m3. Soft soil has a coefficient of permeability that is less than 1.0 × 10⁻⁷ m/s, according to Kempfert and Gebreselassie [14]. The properties of fine-grained soil are assessed by its degree of firmness, which is called consistency, and it is expressed by terms such as soft, stiff, and hard. These terms are relative and they may have a different interpretation for different geotechnical engineers. Based on quantitative measurements, consistency is associated with shear strength and compressive strength. Clay soils with an unconfined compression strength of less than 50 kPa and a liquid limit of more than 50% are categorized under soft soils [15,16].
However, the soft soils that are improved while using reasonable measures can be suitable to support civil engineering structures. The admixture of Bentonite and Nano-clay are suitable additives to enhance the properties of weak road subgrade. The 10% admixture of Bentonite and Nano-clay improved the weak subgrade soil by 28.4%. The natural materials, such as soils, therefore, critically influence the success of a civil engineering structure [17]. As stated by Idrus et al. [17], soft clay soil can cause problems for civil engineering structures, particularly highway infrastructure, such as roadway pavements. The most common problems associated with soft soil in roadways are low load carrying capacity, excessive and differential settlement, and embankment slope instability. If the soft soil deposit is very thick, removing and replacing it with a soil that has better engineering properties can be cost-prohibitive. Therefore, a good understanding of the soft soil is essential at the design stage of the highway project to assess the feasibility of designing a roadway structure on soft soil in such a way to alleviate problems. A soft subgrade soil with a high degree of saturation is more prone to differential settlement and potential cracking of pavement under wheel loading [18]. Geotechnical engineers should consider the appropriate site investigation and analysis methods to ensure a roadway structure that provides a satisfactory level of service during its design life due to the nonlinearity of soil properties [19]. An investigation of a rural road failure that included distresses, such as edge cracking, alligator cracking, longitudinal cracking, and potholes, the causes of failure were associated with the drainage problem and the existence of soft subgrade soil [20]. A case involving a transportation project reported differential settlement during the construction stage, and piles installed subsequently deviated from their original position after some time. A site investigation revealed the presence of a thick deposit of very soft to soft clay, with thicknesses that ranged from 15 to 20 meters that were causing the problem [21]. There are also other types of problematic soils, the most common of which are swelling clay, dispersive soils, and collapsible soils. Problematic soils, like expansive clay, can cause significant challenges for roadway pavements. It is estimated that approximately 40% of the country of Ethiopia is covered with expansive clay, which is slowing down economic development and causing construction challenges [22]. The collapsing potential of soil can be estimated while using its liquid limit and dry density [23]. A large part of Ethiopia has thick deposits of soft soils, but there is no detailed study on their properties. The pavements that are built over these deposits can result in premature distresses, such as excessive settlement, rutting in the wheel paths, cracking, and potholes [24]. According to the study that was conducted by Jibril J. [25], the soil of Jimma town is a plastic clay soil with the medium to a very high degree of expansiveness.
Several studies have been conducted on the characterization of soil in different ways for different purposes. According to Adhanom and Toshome [26], morphological, physical, and chemical properties of soils were characterized while using field observation and laboratory tests for agricultural uses. Most of the soil characterization for engineering purpose use field and laboratory testing methods. Kelly et al. ([27] characterized soft soil properties while using field testing methods for engineering applications. There are two main classes of engineering characterization of soils, which are index properties and design properties. Index properties include grain size distribution, void ratio, porosity, water content, degree of saturation, unit weight, liquid limit, plastic limit, plasticity index, shrinkage limit, liquidity index, and activity index. The design properties are the parameters that influence the design and stability of structures. The design properties are compaction characteristics, consolidation characteristics, and shear strength parameters while using laboratory testing standards [28].
Therefore, this study aims to assess the existence and know the basic engineering properties of soft subgrade soils in Jimma town of Ethiopia while using laboratory tests. An experimental plan was executed to determine the engineering properties of subgrade soil while using both disturbed and undisturbed samples that were collected from two locations. Transportation is one of the essential components of physical infrastructure that is vital for the development of a country. In Ethiopia, many problems are encountered on roads. Therefore, a deeper understanding of such issues is essential to reduce them during road design and construction.
2. Research Design and Methods
2.1. Introduction
The soft soil characterization and an assessment of the engineering properties were determined while using information from the literature review and by conducting laboratory tests. Soil sampling techniques and laboratory analysis methods are presented in this section. The laboratory tests were conducted in the civil engineering laboratories at Jimma University, the geotechnical laboratory at the Ethiopian Construction Design and Supervision Works Corporation, and the materials science department laboratory at Adama Science and Technology University. Additional data that were relevant to the study area were obtained from the Geological Survey of Ethiopia (GSE). An experimental program was carried out to determine moisture content, specific gravity, grain size analysis, Atterberg limits, compaction, California Bearing Ratio (CBR), triaxial compression, and unconfined compression strength of sampled soils to investigate the properties of select soft soils. As outlined in the report [29], the fundamental parameters should be considered for pavement design are sieve analysis, Atterberg limits, specific gravity, compaction, resilient modulus, and triaxial compression tests, and each test should include a minimum of three samples within a particular sample location for the reliability of the results. The Ethiopian Road Authority (ERA) [30] also suggests that moisture content, sieve analysis, plasticity index, compaction, and CBR tests are the necessary engineering tests that are to be considered for pavement design.
2.2. Study Area Description
The town of Jimma is located approximately 354 km southwest of Addis Ababa. Its geographical coordinates are about 7°41’ N latitudes and 36°50’ E longitudes. The town, located at an elevation of 1718 to 2000 meters above mean sea level, has an average temperature that ranges from 20 to 30 °C and an annual rainfall that ranges from 800 to 2500 mm. The Jimma had a population of 120,960, according to the Ethiopia central statistical agency (CSA) census report of 2007. According to the recent information on [31], the population of Jimma town is 207,573 in 2012. The town is in the climatic zone, locally known as Woyna Dega, which is very suitable for agriculture as well as human settlement [32]. Figure 1, below, shows the map of the study area located near the town of Jimma in Ethiopia.
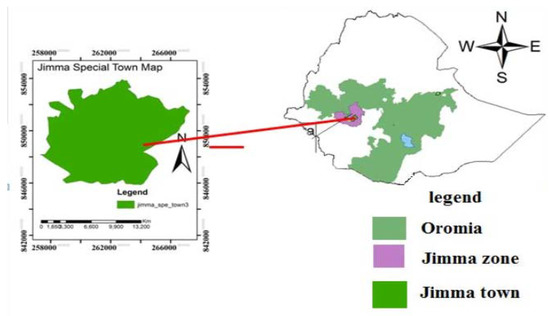
Figure 1.
Map of the study area.
In geological terms, the city is underlain by volcanic rocks of Tertiary age, which seems to be mostly basalt. The rock unit of the area consists of medium to acid lava and, thus, of the so-called Trap formation [33]. Quaternary alluvial deposits, Sentema Basalts, and middle trachyte flow mainly cover Jimma, according to the Geological Survey of Ethiopia (GSE) report [34]. The quaternary alluvial deposit is often marshy with soft clayey soil. At places, the alluvial deposit forms loose thick soil layers of clayey-silty material that is not well consolidated. The color of the surface soil is mostly light gray, which is covered with grass or low vegetation, such as reeds and bogs. The middle trachyte covers many areas of the town, especially around its northeast and southeast areas. In most of its exposure, the middle trachyte flows are light gray, fine- to medium-grained trachyte. The rock is often massive but shows fractures in some places. The color often changes to dark or greenish-gray. North of Jimma near the Jiren mountain, the trachyte is sheared and silicified that often changes to mylonitic trachyte.
2.3. Study Design
This study considered quantitative experimental since it was to measure the engineering properties of soil. The systematic random sampling was applied to collect soil samples while using field observation and some literature from the study area and analyzed by descriptive statistics to describe the property of soil while using laboratory test results. A laboratory experiment program was designed to conduct all of the fundamental engineering properties of the soft soil to investigate the engineering properties of the soil. Two representative disturbed and undisturbed soil samples were collected from different locations and taken samples from 1.5–2.0 m depth. The disturbed soil samples were first air-dried and laboratory tests were conducted according to the American Society for Testing and Materials (ASTM) and American Association of State Highway and Transportation Officials (AASHTO) soil testing procedures. The laboratory tests that were conducted for this study were moisture content, specific gravity, grain size analysis, Atterberg limits, Proctor compaction, California Bearing Ratio, unconfined compression, X-ray diffraction, and triaxial compression. However, the study was limited to two test pits that may not represent the whole study area. Therefore, the findings should be considered as indicative, rather than definitive, for the entire study area.
2.4. Data Collection Process
The different activities that were carried out in this research work can be classified into three main phases: pre-fieldwork, fieldwork, and post-fieldwork. The primary tasks conducted before fieldwork are a literature review, collection of supplementary materials, such as geological and geographical maps of the study area, identifying the availability and functioning of laboratory and field soil sampling apparatus, and site selection. For this study, two study areas were randomly selected while using field observation as the photo in Figure 2 indicates and some literature that showed areas where weak soils may exist in the town to understand the engineering properties of very weak soil in the area. The samples were collected from the Jimma town around Kidane-Mihret Church (designated as Sample 1) and Rift Valley University College (Sample 2).
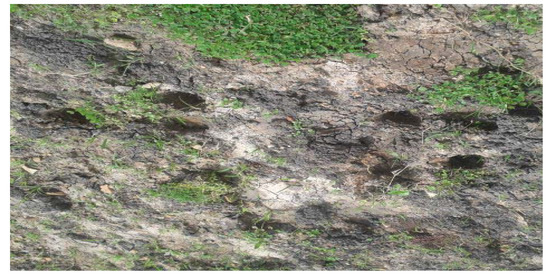
Figure 2.
Photo of soil observed at Kidane-Mihret (Jimma) church site.
During the fieldwork stage, visual identification of soils around the study area was observed, and the soil samples were extracted. The disturbed samples were obtained using hand shovel and undisturbed samples using a thin-walled Shelby tube penetrated using a mechanical method, as shown in Figure 3 during the fieldwork stage. The disturbed samples are for natural moisture content, unconfined compressive strength, and triaxial compressive tests. The disturbed samples are for sieve analysis, specific gravity, Atterberg limits, compaction, X-ray diffraction, and CBR tests.
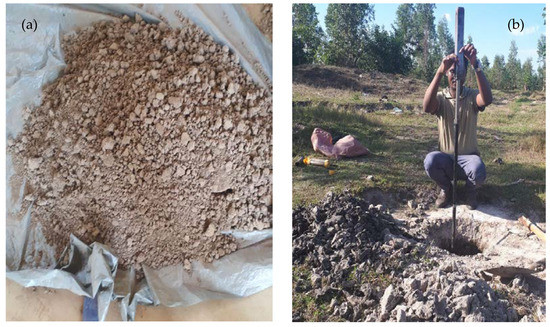
Figure 3.
Photos of samples under different conditions (a) disturbed sample after air-dried (b) obtaining an undisturbed soil sample in the field.
During post-fieldwork, a laboratory test program for the collected soil samples was conducted. The results from laboratory tests and visual identification from field surveys were interpreted, and they are reported in this paper. For this study, the disturbed and undisturbed soil samples were collected based on ASTM and AASHTO sampling procedures.
2.5. Laboratory Test Program
2.5.1. Standard Testing Procedures
The laboratory specifications used for this study were from ASTM and AASHTO standards that are presented in Table 1.

Table 1.
Standard Testing Procedures.
2.5.2. Moisture Content
The natural water content of a soil mass is the fraction of the mass of water to that of the solids expressed as a percentage. The knowledge of moisture content of a soil is a basic requirement in all studies that are related to geotechnical engineering. The natural moisture content of a soil can also be used to give some clues about the soil bearing capacity and settlement potential. This test is one of the simplest and cheapest tests to conduct in a laboratory. The moisture content of the samples in this research was determined while using the ASTM standards [35].
2.5.3. Specific Gravity
The specific gravity (Gs) of soil was determined to be used in the particle size analysis in the hydrometer method. The specific gravity of the soil samples was determined while using [36].
2.5.4. Grain Size Analysis
The determination of grain size analysis can be performed in two ways: the mechanical sieving method and the hydrometer method. Sieving is used to identify particles with a size greater than 75 μm, and the hydrometer method is used for particles that are smaller than that size. For this study, both wet sieve condition and hydrometer methods were conducted according to [37]. Finally, results from the two methods were combined to produce the overall particle size distribution curve.
2.5.5. Atterberg Limits
This test was used to determine the plastic limit (PL), liquid limit (LL), and the plasticity index (PI) of the soil. The standard laboratory test procedure that was used for this study was [38]. The soil sample for the plastic limit test should pass through a 475 μm sieve, and the plastic limit is the moisture content at which, when rolling the soil paste to a diameter of 3 mm, it begins to crumble. The liquid limit is determined while using the standard cup in which a groove is cut in the soil sample and the sample cup is raised and dropped a specified number of times for the groove to barely close. The soil moisture content at which this happens is the liquid limit. The plasticity index (PI) is the difference between LL and PL.
2.5.6. Moisture-Density Relationship
This test helps to understand the relationship between the dry density and the moisture content of soil for some stated compaction energy. Up to certain water content, the presence of water helps in the compaction process as a lubricant for grain packing. When the water content is increased beyond this, there is a negative impact on the soil dry density. The optimum moisture content (OMC) is the water content at which the maximum density is reached for specified compaction energy. This test was carried out according to the [39] standard test procedure.
2.5.7. California Bearing Ratio
The California Bearing Ratio (CBR) is determined by a load penetration test in the laboratory and is mostly used for the design of roadway pavements. The strength of natural ground soil is determined using the CBR test and assigned an index on a scale from 0 to 100 relative to a designated top-quality granular based material. The three-point CBR tests at 10, 30, and 65 blows were conducted according to [40] in the soaked state, and the CBR at 95% MDD was determined.
2.5.8. Unconfined Compressive Strength
Soil materials in structures, such as roadway pavements and bridges that are subjected to fatigue loading, do not typically fail in shear. Their failure that is caused by fatigue can be modeled in the laboratory while using a repeated load test, which is also known as the resilient modulus test. This test requires sophisticated testing equipment that is not available in developing countries, such as Ethiopia, and one way to overcome such a handicap is to use simpler tests to arrive at important soil properties. The unconfined compression test can be performed on cohesive materials, such as clay. The resulting unconfined compressive strength is a reasonable indicator of the mechanical properties of soil. This test was conducted in the laboratory while using static loading that significantly influences the structural responses and performance of pavement material under traffic loading. It was conducted while using the unconfined compression strength apparatus, according to [41] procedures.
2.5.9. Triaxial Compression
The triaxial test is one of the best laboratory tests for determining the shear strength of the soil. The unconsolidated undrained compressive strength of soil determined in an undisturbed condition while using a strain-controlled application of axial compression load with confining pressure. It was conducted using a triaxial compression test apparatus, according to the [42] procedures.
2.5.10. X-ray Diffraction (XRD)
X-ray Diffraction (XRD) analysis is the most widely used method for the identification of fine-grained soil minerals such as clays. A powdered sample is placed in front of a camera and a thin film is wrapped around the inner wall to act as a detector and recorder of X-rays diffracted from the sample. The interaction of the incident rays with the sample produces a multitude of diffracted rays in accordance with Bragg’s Law, being expressed by the Equation nλ = 2dsinθ, where n is an integer, λ is the wavelength of the rays, and θ is the angle between the planes of diffracted and incident X-ray beam. The spacing d between the lines on the recording is used to identify the material by converting the diffraction peaks to d-spacing and comparing it with standard patterns for known materials. Copper is the most common target material for single-crystal diffraction, with CuKα radiation the spacing is 1.54 Å, and it was used for this study. The angle and intensity of the diffraction pattern provide information regarding the material sample. All of the materials have a unique diffraction pattern for every phase. The angle at relative peak intensity is used to match experimental data to the reference patterns in a database, such as that of the International Centre for Diffraction Data (ICDD). The test procedure that was used for this study was from work by Harris [43]. Table 2 summarizes some of the common clay minerals and its identification method while using XRD peak intensity and d-spacing result.
Table 2.
Major d-spacings for some minerals that occur in soils, listed for each mineral in the commonly observed order of decreasing X-Ray Diffraction (XRD) peak intensity (Source [44]).
3. Result and Discussion
3.1. Introduction
The analysis was carried out on the experimental test results to characterize the engineering properties of the soil from the study area. The most important parameters to understand and identify soft soil are natural moisture content, specific gravity, Atterberg limits, unconfined compressive strength, and California Bearing Ratio results analyzed and interpreted while using the statistical description method.
3.2. Natural Moisture Content
The natural (in-situ) moisture content of the soil samples was determined from the undisturbed samples using ASTM D 4643-00, and Table 3 presents the results.
Table 3.
The laboratory test results of the natural moisture content of the samples.
Natural (in-situ) moisture content is a key parameter to understand the characteristics and the performance of soil and its degree of compaction at the site. The results in Table 3 show that these soils can hold a significant level of moisture. As stated by Terzaghi [12], most of the typical values of the natural moisture content of clay soil are within the ranges of 22–70%. The study results are also in agreement with the specified standard.
3.3. Specific Gravity
The specific gravity of the soil samples was determined using ASTM D 854-02, and Table 4 summarizes the results. The specific gravity is an important parameter in identifying the soil type, classification, and its suitability as a construction material.
Table 4.
The specific gravity of the studied soils.
The specific gravity is an important parameter in identifying the soil types, classification, and suitability for construction materials. Arora [15] suggested that the specific gravity of inorganic clay soil is in the range from 2.68–2.80. The result in Table 4 indicates the specific gravity of the soil.
3.4. Grain Size Analysis
Grain size analysis was conducted while using both the wet-sieve and hydrometer methods according to ASTM D422-98. Results from the two methods were combined while using accepted standards and the particle size distribution curves that are shown in Figure 4 were obtained. The chart does show that the soil samples can be classified as fine-grained soils, as the grain size analysis indicates more than 90% of the soil passed the #200 (0.075 mm) sieve.
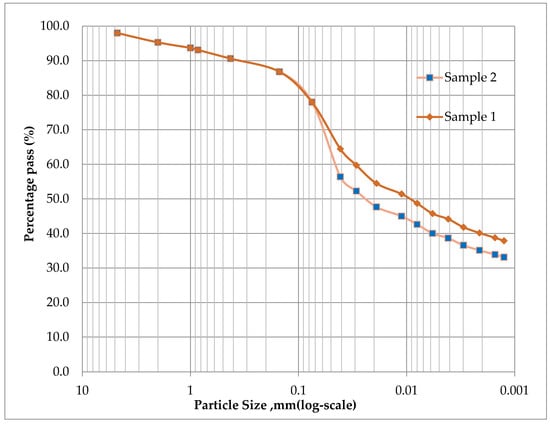
Figure 4.
Particle size distribution curve.
3.5. Atterberg Limits
The Atterberg Limits, or the soil index property test, involves the determination of the plastic limit (PL), liquid limit (LL) and plasticity index (PI) of the soil. The liquid limit and the plastic limit are moisture contents that correspond to the liquid and plastic state thresholds of the soil, respectively.
The word plasticity is synonymous with the moldability of soil, and it also indicates the cohesive nature of the soil. Different agencies have different ways of classifying the plasticity of the soil. Wagner [16] suggests that, if PI ≥ 20 for the soil, it can be classified as a cohesive clay soil with high plasticity characteristics. The Plastic index (PI) is also used as an indicator of the degree of cohesiveness of soil, with a high value of PI indicating a high degree of cohesion. The results in Table 5 suggest that the soil samples are highly plastic and further evidence of the relationship is reported in the literature [6,7,16,44]. The liquid limits and plasticity index of the studied soils are both greater than the values recommended by ERA [45], which is suggests that the liquid limit should be less than or equal to 30% and the plasticity index should be less than or equal to 10% for suitable materials for subgrade. AASHTO [46] also suggested that fine-grained soils are not suitable for subgrade material. This implies that these soils are not suitable for subgrade without improvement. The compression index (Cc) is one of the very important consolidation parameters in settlement estimation for the engineering foundation. There were a lot of formulas that were developed by different scholars for the correlation between Cc and other soil properties. However, most of the researchers recommended Cc = 0.009 (LL: 2.0%); Terzaghi’s method is the best for correlation of compression index with Atterberg limits, where Cc is the compression index. The compression index (Cc) values of medium to soft soil is in the range of 0.15 to 1.0 [47]. The correlation results of the compression index (Cc) for this study are 0.711 and 0.585 for samples 1 and 2, respectively, which shows that the soils are soft clay soil that is highly compressible.
Table 5.
Laboratory Atterberg limit test result of the soil samples.
3.6. Soil Classification
The most widely used soil classification systems are AASHTO and USCS systems. The AASHTO soil classification system groups soil into seven major groups from A-1 to A-7 with a total of 12, including subgroups. AASHTO classification system was used for this study. Figure 5 shows the soil classification chart for fine-grained soil, with the data points for each soil sample also indicated. It shows that both soil samples are AASHTO A-7-5 soils.
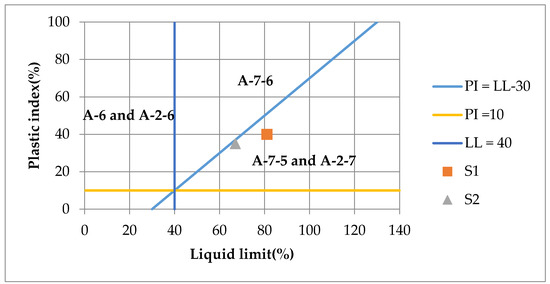
Figure 5.
Soil plasticity chart for fine-grained soil according to the AASHTO classification system.
3.7. Moisture-Density Relationship
Moisture-density relationship was determined while using the standard Proctor compaction method, as specified in ASTM D698-00, and the results for the maximum dry density (MDD) and the corresponding optimum moisture content (OMC) are shown in Figure 6.
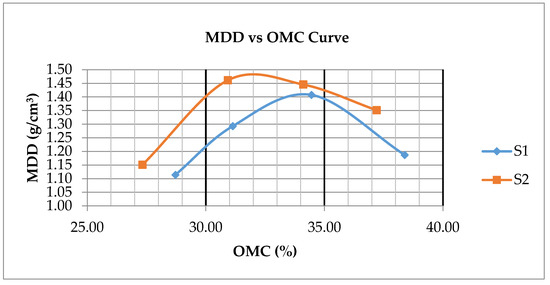
Figure 6.
Maximum dry density (MDD) versus optimum moisture content (OMC) for two soil samples.
These results show that the dry density values are low, which indicates that the soil is soft in its remolded state. The maximum dry density can be useful for determining the CBR value of soil to be used in roadway pavement design. It is common to achieve a relative density of 95% of the laboratory maximum dry density while using modern compaction equipment. The compaction results show the two soil samples achieve reasonably close maximum dry densities using the same compaction energy, but at different optimum moisture contents.
3.8. California Bearing Ratio (CBR)
This CBR test was conducted according to the AASHTO T193-93 procedure. The CBR values were determined for a soil sample that was molded at 95% of MDD at the penetration of 2.54 mm. CBR is one of the parameters used to indicate the load-bearing capacity of subgrade soil for roadway pavement design. Table 6, below, presents the CBR test results for the two field soil samples. The results show that the sampled soil has a very low load-bearing capacity, which requires the stabilization of the soil to be used as a roadway subgrade.
Table 6.
California Bearing Ratio (CBR) values of the natural soil samples.
The CBR test is the most common method to determine and evaluate the load-bearing capacity of subgrade soil, subbase, and base materials for pavement design. The CBR result of subgrade soil is the essential parameter in determining the thickness of pavement layers. As stated by [48], moisture content and density of the soil can affect the strength of the soil. Most of the clay soils have a CBR value of less than 15. This suggestion is also mentioned on the ERA [45] manual, which is used to design a low volume of flexible pavement in Ethiopia. According to [49], coarse-grained soils with a CBR greater than 10 is suitable for roadbed of subgrade soil. The result in Table 6 shows that the soils have a very low load-bearing capacity and high compressibility, which makes the soils unsuitable for subgrade without improvement. The obtained result is in agreement with the study that was performed in the same area [25].
3.9. Triaxial Compression
Triaxial test is a more useful test for determining the shear strength of a fine-grained soil because it can be performed under both drained and undrained conditions. The strength of clay is most relevant to consider in undrained conditions, during which the effective stress remains constant for saturated soils. The shear strength parameters obtained from the test and that are shown in Table 7 indicate that the two soil samples have low shear strength.
Table 7.
Unconsolidated undrained triaxial test result.
3.10. Unconfined Compressive Strength
This test was conducted using the unconfined compression strength apparatus based on the ASTM D2166-00 procedure.
The two soil samples are soft soils, as the unconfined compression strength test results show in Figure 7. The specimens failed at a pressure of 50 kPa or less. Clay soils with unconfined compression strength less than 50 kPa and liquid limit greater than 50% are categorized under soft soils [12,15,47]. Therefore, the results show that the soil samples meet the general principles of soft soil expressed in literature. Table 8 shows a summary of the laboratory results from the unconfined compression strength test on the two samples.
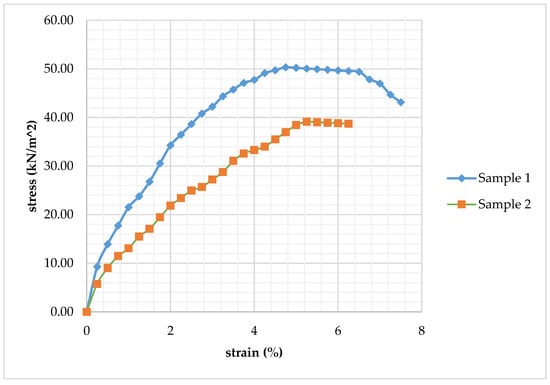
Figure 7.
Stress-strain curve of the natural soils from the unconfined compression test.
Table 8.
Summary of unconfined compression strength test result.
The shear strength (Cu) of the undrained cohesive soil is half of the unconfined compression strength (qu). One of the basic parameters used to classify a soil is based on its degree of firmness or consistency is the unconfined compression strength (qu), and its values appear to support the notion that the soil is weak [15].
3.11. X-ray Diffraction
The X-ray diffraction test was conducted to identify the different mineral species present in the soil. As a result of X-ray diffraction in Table 9 show, the two soil samples were composed of similar mineralogical groups. Figure 8 shows the major mineral groups present in the soils.
Table 9.
The three strongest peaks of X-ray diffraction laboratory result of the samples.
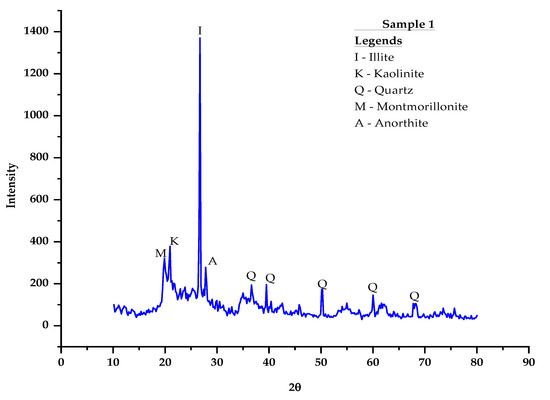
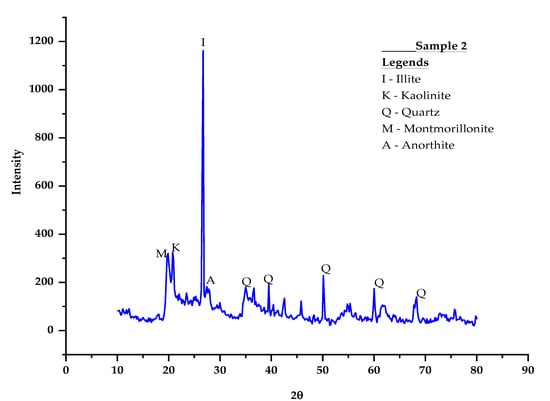
Figure 8.
X-ray diffraction patterns and mineral types present in soft clay soils of samples 1 and 2.
The determination of the types and intensity of minerals present in a fine-grained soil is crucial in the characterization of soil, because of its strong influence on soil behavior. The results of XRD are plotted as intensity on the y-axis vs. 2θ angle on the x-axis (Figure 8). The intensity is usually expressed as counts per second. The mineral types that are present in the soil should be determined from the graph of the XRD pattern by calculating the d-spacing at the 2θ peak intensity and then matching them with a reference of mineral diffraction data in the ICDD. Table 2 presents some of the most common clay mineral types and corresponding d-spacings. The XRD pattern identified that the dominant minerals present in the soil are illite, kaolinite, quartz, montmorillonite, and anorthite, as shown in Figure 8.
4. Conclusions
This study investigated the existence and the basic engineering properties of soft subgrade soils, which are important for an understanding of the soft soil behavior in Jimma town of Ethiopia for the safety of civil engineering structures, particularly highway infrastructure, such as roadway pavements. The laboratory tests that were conducted for this study were moisture content, specific gravity, grain size analysis, Atterberg limits, Proctor compaction test, California Bearing Ratio, unconfined compression, X-ray diffraction, and triaxial compression tests. The test procedures were based on AASHTO and ASTM test standards. From the study, the following findings are deduced:
- ➢
- Natural moisture content and the specific gravity of the soil are vital parameters to understand the characteristics of the soil. The conclusions from this study indicated that the soil is soft poor-quality inorganic clay.
- ➢
- Atterberg limits test results show that the soft soils have a high degree of cohesion and highly compressible.
- ➢
- The subgrade soils considered in this study were A-7-5, as per the AASHTO soil classification system.
- ➢
- One of the basic parameters used to classify a soil is based on its degree of firmness or consistency is the unconfined compression strength, and the results show that it is soft soil.
- ➢
- X-ray diffraction analysis established that dominant minerals present in the soil are illite, kaolinite, quartz, montmorillonite, and anorthite.
In general, the subgrade soils that were considered for this study had a very low load-bearing capacity and high compressibility, which makes the soils unsuitable for highway subgrade without improvement to make it feasible to build civil engineering structures on it. Based on the finding of this study, it is recommended to consider stabilization for the enhancement of soil properties.
Author Contributions
Conceptualization, A.S., and S.S.; methodology, A.S. and S.S.; validation, S.S. and Y.B.; formal analysis, A.S.; investigation, A.S.; resources, A.S.; data collection, A.S.; writing—original draft preparation, A.S.; writing—review and editing, A.S., S.S. and Y.B.; supervision, S.S. and Y.B.; project administration, A.S., S.S. and Y.B.; funding acquisition, A.S. All authors have read and agreed to the published version of the manuscript.
Funding
This research received no external funding
Acknowledgments
We would like to thank the GIZ (Deutsche Gesellschaft for Internationale Zusammenarbeit) for their financial support under the consultancy of the British Council, Ethiopia.
Conflicts of Interest
The authors declare no conflict of interest.
References
- Mathur, U.; Kumar, N.; Pandey, N.T.; Choudhary, A. Study of Index Properties of the Soil. IJARIIE 2017, 3, 656–661. [Google Scholar]
- Garrison, S. The Chemistry of Soils, 2nd ed.; Oxford University Press: New York, NY, USA, 2008; pp. 1–327. [Google Scholar]
- Saffari, P.; Nie, W.; Noor, M.J.M.; Zhang, X.; Liang, Q. Characterization the geotechnical properties of a Malaysian granitic residual soil grade V. In Proceedings of the IOP Conference Series: Earth and Environmental Science; IOP Publishing: Bristol, UK, 2019; pp. 1–12. [Google Scholar]
- Teunissen, H.; Zwanenburg, C. Modelling Strains of Soft Soils. Procedia Eng. 2017, 175, 165–174. [Google Scholar] [CrossRef]
- L’Heureux, J.S.; Lunne, T. Characterization and Engineering Properties of Natural Soils used for Geotesting. AIMS Geosci. 2020, 6, 35–53. [Google Scholar]
- Anisuzzaman; Arifuzzaman. Engineering Properties of Soft Organic Soil Underlying Dredge Fill Areas of Dhaka, Bangladesh. In Proceedings of the 2nd International Conference on Transport, Environment and Civil Engineering, ICTECE’2013, Dhaka, Bangladesh, 25–26 September 2013. [Google Scholar]
- Dixit, M. Damage mechanism in problematic soils. IJCIET 2016, 7, 232–241. [Google Scholar]
- Omar, R.; Jaafar, R. The Characteristics and Engineering Properties of Soft Soil at Cyberjaya. In Geological Society of Malaysia Annual Geological Conference; Geological Society of Malaysia: Pulau Pinang, Malaysia, 2000; pp. 313–322. [Google Scholar]
- Sushma, B.V. Importance of Reliable Geotechnical Investigation for Safe and Economical Foundation Design of Civil Structures. IGC 2009, 7–10. Available online: http://conf.tac-atc.ca/english/resourcecentre/readingroom/conference/conf2009/pdf/Lister.pdf (accessed on 21 February 2020).
- Tsegaselassie, A.; Tadesse, S. Supplementing Conventional Site Investigation Techniques of Earthworks and Sub-Grade Soils with Geophysical Investigation in Road Design. J. EEA 2015, 33, 27–34. [Google Scholar]
- Weech, C.N.; Lister, D.R. Highway Embankment Construction Over Soft Soils in the Lower Mainland of British Columbia. Available online: http://conf.tac-atc.ca/english/resourcecentre/readingroom/conference/conf2009/pdf/Lister.pdf (accessed on 21 February 2020).
- Terzaghi, K.; Peck, R.B.; Mesri, G. Soil Mechanics in Engineering Practice, 3rd ed.; John Wiles & Sons. Inc.: New York, NY, USA, 1996; pp. 175–187. [Google Scholar]
- Das, B. Weight-Volume Relationships, Plasticity, and Structures of Soils. In Principles of Geotechnical Engineering, 5th ed.; Chris Carson: Toronto, ON, Canada, 2006; pp. 45–82. [Google Scholar]
- Kempfert, H.; Gebreselassie, B. Excavations, and Foundations in Soft Soils; Springer: Berlin, Germany, 2006; pp. 11–55. [Google Scholar]
- Arora, K. Shear Strength. In Soil Mechanics and Foundation Engineering, 6th ed.; Standard Publishers Distributors: Delhi, India, 2003; pp. 345–348. [Google Scholar]
- Wagner, J. Mechanical Properties of Clays and Clay Minerals. In Developments in Clay Science; Elsevier Ltd.: Amsterdam, The Netherlands, 2013; pp. 347–381. [Google Scholar]
- Idrus, M.; Singh, M.; Musbah, A.; Wijeyesekera, C. Investigation of Stabilised Batu Pahat Soft Soil Pertaining on its CBR and Permeability Properties for Road Construction. In Soft Soil Engineering International Conference; IOP Publishing: Bristol, UK, 2016; pp. 1–7. [Google Scholar]
- Hopkins, T.; Sun, L.; Beckham, T. Characteristics and engineering properties of the soft soil layer in highway soil subgrades; Research Report for Kentucky Transportation Center, University of Kentucky: Lexington, KY, USA, 2006; pp. 1–82. [Google Scholar]
- Bhatkar, T.; Barman, D.; Mandal, A.; Usmani, A. Prediction of behaviour of a deep excavation in soft soil: A case study. IJGE 2017, 11, 10–19. [Google Scholar] [CrossRef]
- Hakimi, A.; Masirin, I.; Sanik, M. Site Investigation Of Road Drains For Rural Road On Batu Pahat Soft Clay. IOSR-JMCE 2014, 11, 12–19. [Google Scholar]
- Mohamad, O.N.; Razali, E.C.; Hadi, A.A.; Som, P.P.; Eng, C.B.; Rusli, B.M.; Mohamed, R.F. Challenges in Construction over Soft Soil-Case Studies in Malaysia; IOP Publishing: Bristol, UK, 2016; pp. 1–8. [Google Scholar]
- Negussie, E.; Dinku, A. Investigation on the Effects of Combining Lime and Sodium Silicate for Expansive Subgrade Stabilization. J. EEA 2014, 31, 33–44. [Google Scholar]
- Rezaei, M.; Ajalloeian, R.; Ghafoori, M. Geotechnical Properties of Problematic Soils Emphasis on Collapsible Cases. IJG 2012, 3, 105–110. [Google Scholar] [CrossRef]
- Yitagesu, F.A. Remote Sensing and Geotechnical Investigations of Expansive Soils. Ph.D. Thesis, University of Twente, Enschede, The Netherlands, 28 March 2012. [Google Scholar]
- Jibril, J. In-depth Investigation into Engineering Characteristics of Jimma Soils. MSc. Thesis, Addis Ababa University, Addis Ababa, Ethiopia, 2014. [Google Scholar]
- Adhanom, D.; Toshome, T. Characterization, and Classification of Soils of Aba-Midan Sub Watershed in Bambasi Wereda, West Ethiopia. Int. J. Sci. Res. Publ. 2016, 6, 390–399. [Google Scholar]
- Kelly, R.; Pineda, J.; Bates, L.; Suwal, L.; Fitzallen, A. Site Characterization for the Ballina Field Testing Facility. Geotechnique 2016, 68, 1–22. [Google Scholar]
- Shakoor, A. Characterization of Soils. In Encyclopedia of Engineering Geology, 1st ed.; Bobrowsky, P.T., Brain, M., Eds.; Springer International Publishing: Berlin, Germany, 2018; pp. 108–113. [Google Scholar]
- Walubita, F.L.; Das, G.; Espinoza, E.; Oh, J.; Scullion, T.; Lee, I.S.; Jose, L.; Garibay; Nazarian, S.; Abdallah, I. Texas Flexible Pavements and Overlays: Year 1 Report-Test Sections, Data Collection, Analyses, and Data Storage System; Texas Transportation Institute, Texas A&M University: College Station, TX, USA, 2012. [Google Scholar]
- ERA. Site Investigation Manual-2013; ERA: Addis Ababa, Ethiopia, 2013. [Google Scholar]
- Jimma-Wikipedia. Available online: https://en.wikipedia.org/wiki/Jimma (accessed on 21 January 2020).
- Abdela, N.; Deressa, B.F.; Hassan, A.; Teshome, E. Prevalence of Indigestible Foreign Bodies in the Rumen and Reticulum of Sheep Slaughtered at Jimma Municipal Abattoir, Southwestern Ethiopia. GJMR 2017, 17, 27–34. [Google Scholar]
- Seifu, Y. A Historical Survey of Jimma Town (1936–1974). Master’s Thesis, Addis Ababa University, Addis Ababa, Ethiopia, 2002. [Google Scholar]
- Haro, W.; Besufikad, A.; Bulto, D.; Edris, M. Geology, Geochemistry, and Gravity Survey of Jima area; Geological Survey of Ethiopia: Addis Ababa, Ethiopia, 2012; pp. 1–72. [Google Scholar]
- ASTM D4643-00. Standard Test Method for Determination of Water (Moisture) Content of Soil by the Microwave Oven Heating. In Annual Book of ASTM Standards; ASTM International: West Conshohocken, PA, USA, 2000. [Google Scholar]
- ASTM D854-02. Standard Test Methods for Specific Gravity of Soil Solids by Water Pycnometer. In Annual Book of ASTM Standards; ASTM International: West Conshohocken, PA, USA, 2002. [Google Scholar]
- ASTM D422-98. Standard Test Method for Particle-Size Analysis of Soils. In Annual Book of ASTM Standards; ASTM International: West Conshohocken, PA, USA, 1998. [Google Scholar]
- ASTM D4318-00. Standard Test Methods for Liquid Limit, Plastic Limit, and Plasticity Index of Soils. In Annual Book of ASTM Standards; ASTM International: West Conshohocken, PA, USA, 2000. [Google Scholar]
- ASTM D698-00a. Standard Test Methods for Laboratory Compaction Characteristics of Soil Using Standard Effort. In Annual Book of ASTM Standards; ASTM International: West Conshohocken, PA, USA, 2000. [Google Scholar]
- AASHTO T 193-93. Standard Method of Test for California Bearing Ratio. In Standard Specifications for Transportation Materials and Methods of Sampling and Testing; AASHTO: Washington, DC, USA, 1993; pp. 373–378. [Google Scholar]
- ASTM D2166-00. Standard Test Method for Unconfined Compressive Strength of Cohesive Soil. In Annual Book of ASTM Standards; ASTM International: West Conshohocken, PA, USA, 2000. [Google Scholar]
- ASTM D2850-99. Standard Test Method for Unconsolidated-Undrained Triaxial Compression Test on Cohesive Soils. In Annual Book of ASTM Standards; ASTM International: West Conshohocken, PA, USA, 1999. [Google Scholar]
- Harris, W.; White, G.N. X-ray Diffraction Techniques for Soil Mineral Identification. In Methods of Soil Analysis. Part 5. Mineralogical Methods; SSSA: Madison, WI, USA, 2008; pp. 81–115. [Google Scholar]
- Moreno-Maroto, J.M.; Alonso-azcárate, J. Applied Clay Science What is clay? A new definition of “clay” based on plasticity and its impact on the most widespread soil classification systems. Appl. Clay Sci. 2018, 161, 57–63. [Google Scholar] [CrossRef]
- ERA. Pavement Design Manual Volume 1: Flexible Pavements; ERA: Addis Ababa, Ethiopia, 2013. [Google Scholar]
- AASHTO. Soils and Stabilization. Standard Specifications for Transportation Materials and Methods of Sampling and Testing: Part 1A Specifications, 26th ed.; AASHTO: Washington, DC, USA, 2006. [Google Scholar]
- Jain, V.; Dixit, M. Correlation of Plasticity Index and Compression Index of Soil. IJIET 2015, 5, 263–270. [Google Scholar]
- 2007 MnDOT Pavement Design Manual. Available online: http://www.dot.state.mn.us/materials/pvmtdesign/docs/2007manual/Chapter_3-2.pdf (accessed on 22 January 2020).
- Schaefer, R.V.; White, J.D.; Ceylan, H.; Stevens, J.L. Design Guide for Improved Quality of Roadway Subgrades and Subbases. 2008. Available online: https://lib.dr.iastate.edu/cgi/viewcontent.cgi?referer=&httpsredir=1&article=1051&context=intrans_reports (accessed on 21 February 2020).


© 2020 by the authors. Licensee MDPI, Basel, Switzerland. This article is an open access article distributed under the terms and conditions of the Creative Commons Attribution (CC BY) license (http://creativecommons.org/licenses/by/4.0/).