Article

Neogene Tree Trunk Fossils from the Meshgin Shahr Area, Northwest Iran

by
George E. Mustoe
1,*,
Nasrollah Abbassi
2,
Afsaneh Hosseini
3 and
Yousef Mahdizadeh
4
1
Geology Department, Western Washington University, Bellingham, WA 98225, USA
2
Department of Geology, Faculty of Science, University of Zanjan, Zanjan, Iran
3
Department of Paleontology, Museum of Natural History and Genetic Resources, Pardisan Natural Park, Department of Environment of Iran, Tehran, Iran
4
Department of Environment of Iran, Administration of Ardabil Province, Be’sat Administrative Town, Ardabil, Iran
*
Author to whom correspondence should be addressed.
Geosciences 2020, 10(8), 283; https://doi.org/10.3390/geosciences10080283
Submission received: 4 July 2020 / Revised: 18 July 2020 / Accepted: 20 July 2020 / Published: 23 July 2020

Abstract

:
In 2016, an extensive fossil forest was discovered near Meshgin Shahr, northwest Iran. Silicified tree trunks occur in Miocene fluvial sediments and at multiple stratigraphic levels within a 27-m thick sequence of Pleistocene volcaniclastics. The Miocene trunks likely represent stream transport. Pleistocene examples originated during repeated eruptive events when volcaniclastic sediments buried a standing forest. The site, informally named Meshgin Shahr Fossil Forest, was registered in 2017 as a national natural monument by the Iranian Cultural, Handicraft and Tourism Organization. To date, 16 fossilized trunks have been found, all but one of them representing gymnosperms. The ancient coniferous forest was very different from modern forests in Iran and adjacent Azerbaijan, a result of climatic changes that were principally caused by the demise of the Paratethys Sea and by rain shadow effects caused by the uplift of the Alborz and Zagros mountain ranges. X-ray diffraction patterns reveal that woods from the fossil forest contain three types of silica: opal-CT, pure quartz, and a mixture of opal-CT and quartz. In addition, optical photomicrographs show the abundant presence of amorphous opal-A. Mineralogic variations occur among different fossil trees and within a single trunk. These silica polymorphs resulted from a combination of processes: silica minerals precipitated in multiple episodes under differing geochemical conditions and the diagenetic transformation of an opaline parent material.

1. Introduction

In 2016, silicified tree trunks were discovered exposed on the ground surface in a remote location in the Ardabil province, northwest Iran. The site is located 100 km west of Ardabil, near the town of Sheikh Mohammadlu, as shown in Figure 1. The site, informally named in this report as Meshgin Shahr Fossil Forest, was registered in 2017 as a national natural monument by Iranian Cultural, Handicraft and Tourism Organization. This report describes the results of a study sponsored by the Department of Paleontology, Museum of Natural History and Genetic Resources in Tehran. The goals were to evaluate the age and stratigraphic position of the fossil site, to identify the tree genera that are represented, and to determine the processes that caused the wood to become mineralized.

1.1. Site Description

The fossil logs are exposed on the surface of weathered sediment that forms the desert floor. The majority of the specimens occur in Quaternary volcaniclastic sediments, but fossil logs also occur in underlying Miocene fluvial sediments. Nearby hills are composed of more durable extrusive rocks that form a protective capping layer, as shown in Figure 2. Stratigraphy is shown in Figure 3.
Field investigations conducted in 2019 included geologic mapping and detailed surveying of the fossil trunks. Sixteen fossil trees were discovered, with 31 samples collected from the central, middle, and outer zones of each trunk. Twenty-six specimens were chosen for detailed study, as shown in Table 1. In addition, two specimens were collected from the sedimentary strata for palynologic analysis. The geographic distribution of fossil logs is shown in Figure 4.

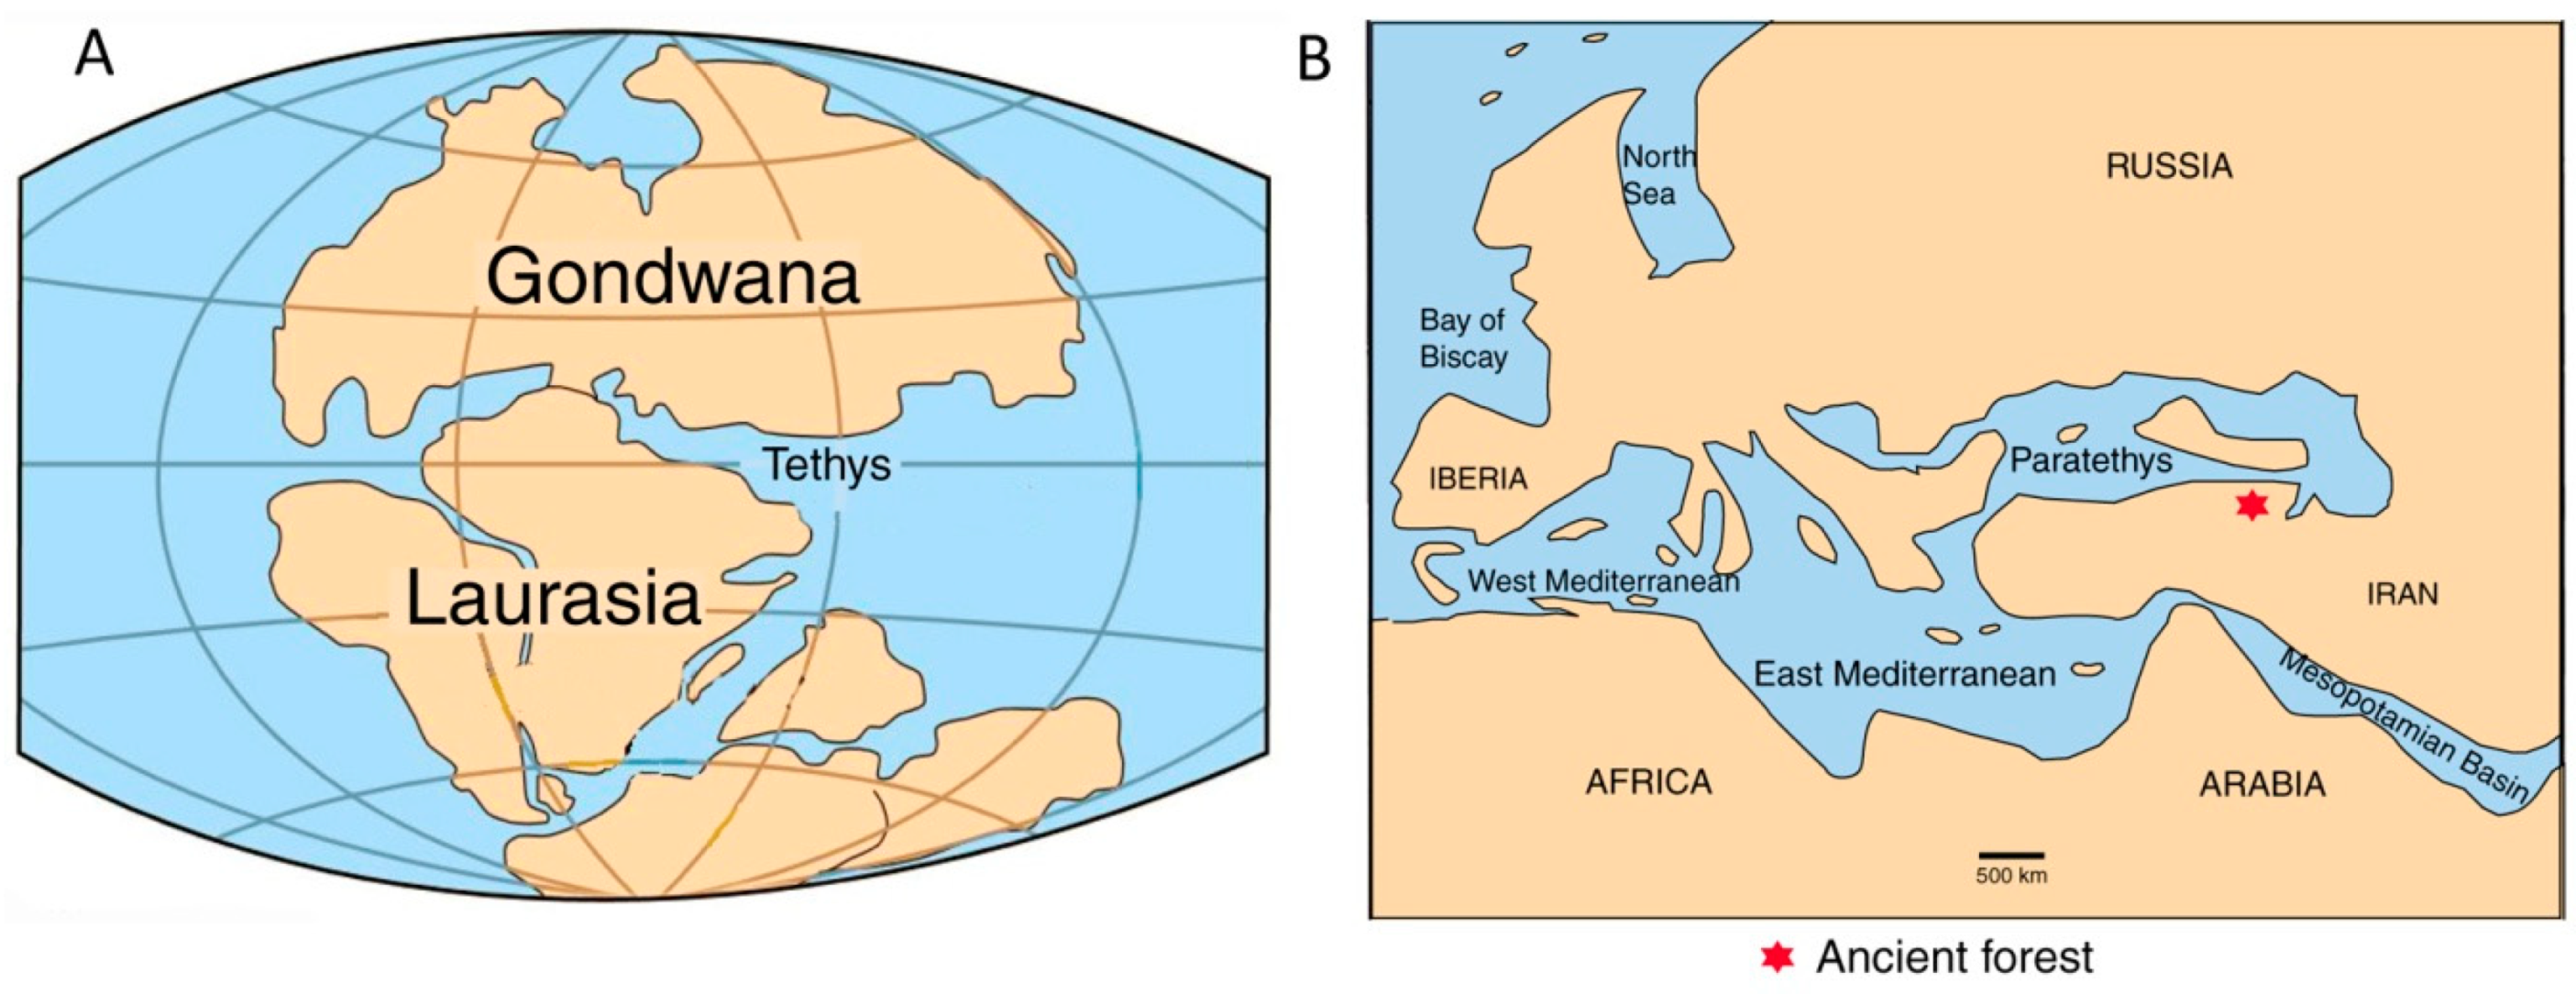
1.2. Geologic Setting and Paleoclimate

One of the major events in the Mesozoic history of the Middle East was the appearance of the Tethys Sea, which separated the supercontinents Laurasia and Panegea [1]. The Tethys closed during the early Cenozoic when continental fragments (Africa and Arabia) converged with Eurasia. The term “Paratethys” describes a string of epicontinental basins that became separated from the main Tethys in the early Oligocene by the uplift of the Alpine–Caucasian mountain chain, as shown in Figure 5 [2,3,4].
The Cenozoic paleogeography was in a state of flux, with episodes when the Paratethys and the Mediterranean Sea were connected, alternating with periods of separation. Variations in global sea level combined with tectonic and orogenic events to produce regional climatic effects. The Paratethys epicontinental sea had a strong effect on Eurasian climate because it was a major source of atmospheric water vapor, affecting precipitation patterns. In addition, the high heat capacity of the water reduced the seasonal temperature variation. Shrinkage of the Paratethys in the Late Miocene caused the climate of Eurasia to shift from oceanic to continental, with colder winters and increased seasonality. The climate of the Arabian Peninsula became drier, and a subtropical desert developed in North Africa [5]. This climatic history provides a framework for understanding the environmental conditions that affected the Meshgin Shahr Fossil Forest. Fossil logs in Miocene strata came from a time when the Paratethys was experiencing fluctuations in connectedness with the Mediterranean, so the geographic conditions were variable. The most likely scenario is that these logs were transported from lowland forests that grew on the low elevation floodplain, becoming buried in fluvial sediments deposited by rivers that flowed into the Eastern Paratethys basin to form large deltas.
The majority of the fossil logs were observed in Pleistocene volcaniclastic strata that were formed under plate tectonic conditions that were similar to the modern era, but at a time of episodic volcanic eruptions and in a paleoclimate that was cooler and wetter than the current climate. The Paratethys had receded, leaving the Black Sea, Caspian Sea, and Aral Sea as landlocked relicts. Major climatic shifts accompanied the cyclic pattern of glacial and interglacial events. In addition, global sea levels fluctuated as the result of freezing and thawing of major ice sheets. At the peak of the last glaciations 21,000–22,000 years ago, when sea level was 120 m lower than at present, the Pesian Gulf was a waterless basin [6]. In northern and western Iran, the climate alternated from dry, cold glacial events to warm, moist interglacial episodes [7]. Fossil logs in Pleistocene strata at Meshgin Shahr Fossil Forest presumably came from a forest that flourished during an interglacial episode. By the onset of the Holocene, the region was becoming increasingly arid, with temperate forests replaced by steppe vegetation [8,9,10,11].

1.3. Regional Geology

The Meshgin Shahr Fossil Forest is located in a region that has been described both as the Alborz–Azarbaijan geological zone [12] and the Urumieh–DokhtarMagmatic Belt [13]. This area is in the magmatic arc zone of Arabia-Eurasia collision belt [14,15]. The zone includes numerous small-scale magmatic belts that range in age from Cretaceous to Quaternary [16,17,18,19]. The tree fossils are located in the Tarom–Sabalan–Arasbaran (TSA) zone, bounded by the Aras, Astara, and Tabriz faults.
Igneous components of the TSA zone include Late Cretaceous–Paleogene submarine volcanogenic rocks of intermediate-acidic composition and Cenozoic pyroclastic rocks with calc-alkaline and potassium-rich alkaline compositions [18,20]. These Cenozoic rocks were produced in two phases: (1) Eocene trachybasalts and trachyandesitic basalt, which are overlain by Eocene flysch deposits, and (2) Late Miocene–Quaternary basic to intermediate volcanic rocks. With the exception of two logs found in Miocene sediments, the fossil wood described in this report occurs in Pliocene–Pleistocene tuffaceous beds. These beds are overlain by volcaniclastic conglomerates, ignimbrite, and olivine–pyroxene basalt that erupted from a volcano close to the fossil forest area, as shown in Figure 6.
Four rock units are exposed in the 20 hectares of Meshgin Shahr Fossil Forest. In ascending stratigraphic order these are:
  • Sedimentary rocks: Early Miocene strata outcrop in a small area in the south of the study area. These sediments are the oldest rock units in the studied area and include 30 m of polymictic well-rounded conglomerate, green to gray sandstone with tree trunk fossils, sandy marl and claystone with leaf fossils and gypsum veins.
  • Light-colored porphyritic dacitic tuff containing 14 known in situ tree trunk fossils. Plagioclase, biotite and hornblende are main minerals and are 1–1.5 mm in size with ~3.5 mm lithic particles.
  • Dark ignimbrite tuffites containing ~4 mm phenocrysts of plagioclase, biotite, hornblende, quartz, clinopyroxene and lithic particles. This unit contains no fossil wood.
  • Basalt porphyry containing ~2 mm clinopyroxene phenocrysts.

1.4. Age of Fossil Wood

The Meshgin Shahr Fossil Forest consists of two elements: trees that lived during the Early Miocene during a time of volcanic quiescence and a forest that flourished during the volcanically active Pleistocene. Preservation of the fossil-bearing strata is related to protection provided by erosion-resistant capping layers of ignimbrite and basalt deposited during the Pleistocene.
The age of the sedimentary strata is considered to be Early Miocene, based on stratigraphic correlation and palynology. The sediments lithologically resemble the Ziveh Formation in the Moghan area in the northern part of the TSA. These sediments are interpreted to have originated as fluvially-dominated delta deposits [22]. As discussed later, diverse palynomorphs in two samples collected from marls within this rock unit are consistent with a Miocene age.
Radiometric dating provides constraints on the age of the logs that are preserved in Pleistocene volcaniclastic deposits. This volcanism was associated with Mt. Sabalan (4820 m altitude), the largest volcano in northwest Iran. Sabalan eruptions began in the Miocene, but the major volcanic events occurred from the Pliocene to Quaternary. Early eruptions produced calc-alkaline and calc-alkaline to shoshonitic lavas, transitioning to sodic-alkaline lavas in the late Miocene [23,24]. Protracted eruptive activity took place between 5.6 and 1.4 Ma, as evidenced by K–Ar dating, producing volcanic phases that are known as Paleo-Sabalan and Neo-Sabalan [25,26,27].The Neo-Sabalan rocks have dacitic compositions with phenocrysts of plagioclase +amphibole ± alkali-feldspar ± quartz. These dacitic strata contain the majority of the known fossil logs.
The ages of the log-bearing strata are estimated from high spatial resolution and sensitivity U–Pb geochronology using Secondary Ionization Mass Spectrometry, which yielded zircon ages from 545 to 149 ka for Neo-Sabalan strata (all ages are averages of multiple determinations per sample). U–Th zircon geochronology for selected Neo-Sabalan rocks agrees with the U–Pb ages, with the youngest zircon rims dating to ca. 110 ka [27].

2. Methods

Petrographic thin sections were prepared for all fossil trees. All specimens were deposited in the Natural History and Genetic Resources Museum, Pardisan Natural Park, Department of Environment of Iran, Tehran, Iran, with numbers MMTT-437-456.
Mineralogic studies were made using 25 specimens, representing 12 fossil trees, as shown in Table 1. Specimen densities were measured using a Mettler analytical balance (Metler-Toldedo LLC, Columbus, OH, USA), equipped with a hydrostatic weighing device [28]. X-ray diffraction patterns were obtained with a Rigaku Geigerflex diffractometer using a Cu target X-ray tube to provide Ni-filtered Kα radiation. SEM images were made using a Tescan Vega3 SEM, using fractured specimens mounted on 1 cm aluminum stubs using epoxy adhesive, sputter-coated with PD to provide electrical continuity. Major element compositions were determined for SEM samples using an Oxford energy dispersive XRF spectrometer. Optical photomicrographs were made using a Zeiss petrographic microscope equipped (Carl Zeiss Microscopy, White Plains, NY, USA) with a 5-megapixel digital camera). All mineralogic data in this report were obtained using laboratory facilities at Western Washington University, Bellingham, WA, USA. Palynology preparation followed the methods of [29,30].

3. Results

3.1. Palynology of Miocene Sediments

The fluvial sediments at Meshgin Shahr Fossil Forest were found to contain an abundance of well-preserved palynomorphs. Pollen and spores comprise at least 40 morphotypes; selected examples are shown in Figure 7. These microfossils are worthy of detailed study. For the purposes of this report, two characteristics are important: the palynomorphs are consistent with the Miocene age suggested by lithostratigraphy and botanical diversity is evidence of a complex plant community containing angiosperms, gymnosperms and ferns. The fossil woods provide evidence of trees, but the palynomorphs also record the existence of shrubs and herbaceous plants.

3.2. Taxonomy of Fossil Wood

Identification of silicified woods in the Meshgin Shahr Fossil Forest is difficult for several reasons. One difficulty is that the tissues in many specimens have been compressed or distorted after burial, obscuring cellular detail. In addition, all but one of the trunks represent gymnosperms, and these are challenging to identify at the genus level.
Gymnosperm woods can be readily discerned from angiosperms because of several characteristics: the absence of conductive vessels, the lack of fibers, and the presence of bordered pits. Resin ducts are commonly present and vary in size and abundance among various taxa. The most reliable form of identification for genera comes from the morphology of cross-field pits, which are the apertures that occur on areas of contact between horizontal ray cells and adjacent vertical tracheids. Although cross-field pits show some degree of intergradation, they can be divided into several categories that reflect taxonomy at the genus level [31]. The difficulty comes from the scarcity of ray cells in most gymnosperms. In approximately 50 thin sections prepared from the Meshgin Shahr Fossil Forest, only a few slides revealed cross-field pits. We had hoped to prepare additional slides to provide taxonomic clarity, but the closure of university research labs because of the Covid-19 pandemic has precluded that possibility. Detailed taxonomic analysis is a future goal. Meanwhile, the general anatomical features provide information for understanding the ancient forest. For specimens in which the wood was not degraded prior to fossilization or distorted during early diagenesis, the anatomical preservation of the fossil wood is fairly good, as shown in Figure 8 and Figure 9.
Only one fossil trunk (Trunk 10, represented by sample T-19) is an angiosperm, as shown in Figure 9. This ring-porous wood exhibits a combination of anatomical features that includes vessels with both simple and scalariform perforation plates, and narrow uniseriate rays. The 0.3 m diameter of the fossil log is an indication that it is from a tree rather than a shrub. Families that have these features include the Araliaceae, Euphorbiacea, Rhamnaceae and Sapindacedae. However, as with the gymnosperm woods, the taxonomic assignment of this dicot requires detailed anatomical information that is not presently available. Necessary data include the anatomy of vessel/ray parenchyma pits, type of parenchyma distribution and ray cellular composition.
To summarize, Miocene strata at Meshgin Shahr Fossil Forest preserve diverse palynomorphs, but the two silicified trunks are from gymnosperms. Of the 14 known trunks in Pleistocene beds, 13 are gymnosperms, and 1 is an angiosperm.

3.3. Density Measurements

The measurement of density (specific gravity) provides a simple method for evaluating the mineralogy of silicified wood specimens. Woods mineralized with opal have densities of 1.9–2.1 g/cm3, compared to 2.3–2.6 g/cm3 for woods mineralized with chalcedony or quartz [28]. Densities of specimens from 12 trees from the Meshgin Shahr Fossil Forest show wide variation, as shown in Table 1. Densities of some specimens indicate an opal composition (T-2, T-4, T-8, T-11, T-14, T-19, T-20, T-25), but other specimens have higher densities that are indicative of quartz or chalcedony (T-5, T-6, T-10, T-12, T-17, and T-18). Many specimens have densities in the range between 2.1 and 2.3 g/cm3. These intermediate densities may be the result of wood that is not completely mineralized, with void spaces that reduce the apparent density. Another possibility is that the wood contains a mixture of opal and quartz/chalcedony. Evidence from XRD patterns and SEM and optical microscopy support the latter hypothesis.

3.4. X-ray Diffraction

X-ray diffraction patterns are useful for the identification of minerals present in fossil wood, with certain limitations. One of these is the inability to discriminate between quartz and chalcedony, which produce similar diffraction patterns. Opal-CT is readily discernible, evidenced by diffuse peaks characteristic of cristobalite/tridymite. However, amorphous opal-A is not recognizable in XRD patterns. This imposes a serious limitation for opalized wood. If a specimen consists of pure opal-A, no diffraction peaks would be evident. However, the presence of small amounts of any crystallized mineral would produce diffraction peaks, introducing analytical confusion. For example, a specimen that contains mostly opal-A, and a small amount of opal-CT, would produce a pattern that would likely be interpreted as representing an opal-CT composition. Similarly, opal-A wood that contains a small quartz-filled fracture would produce a pattern that would appear to indicate a quartz composition. Although opal-A is not recognizable in XRD patterns, optical and SEM microscopy indicates this amorphous mineral is an important constituent of many Meshgin Shahr Fossil Forest specimens.
Specimens from the fossil forest are characterized by three XRD patterns that represent opal-CT, pure quartz, and a mixture of opal-CT and quartz, as shown in Figure 10. These patterns are valuable for two reasons. First, they indicate that the mineralogy of the silicified wood is variable, both among different fossil trees and within a single trunk. Second, the XRD patterns confirm that silica minerals are the primary agents of petrifaction.

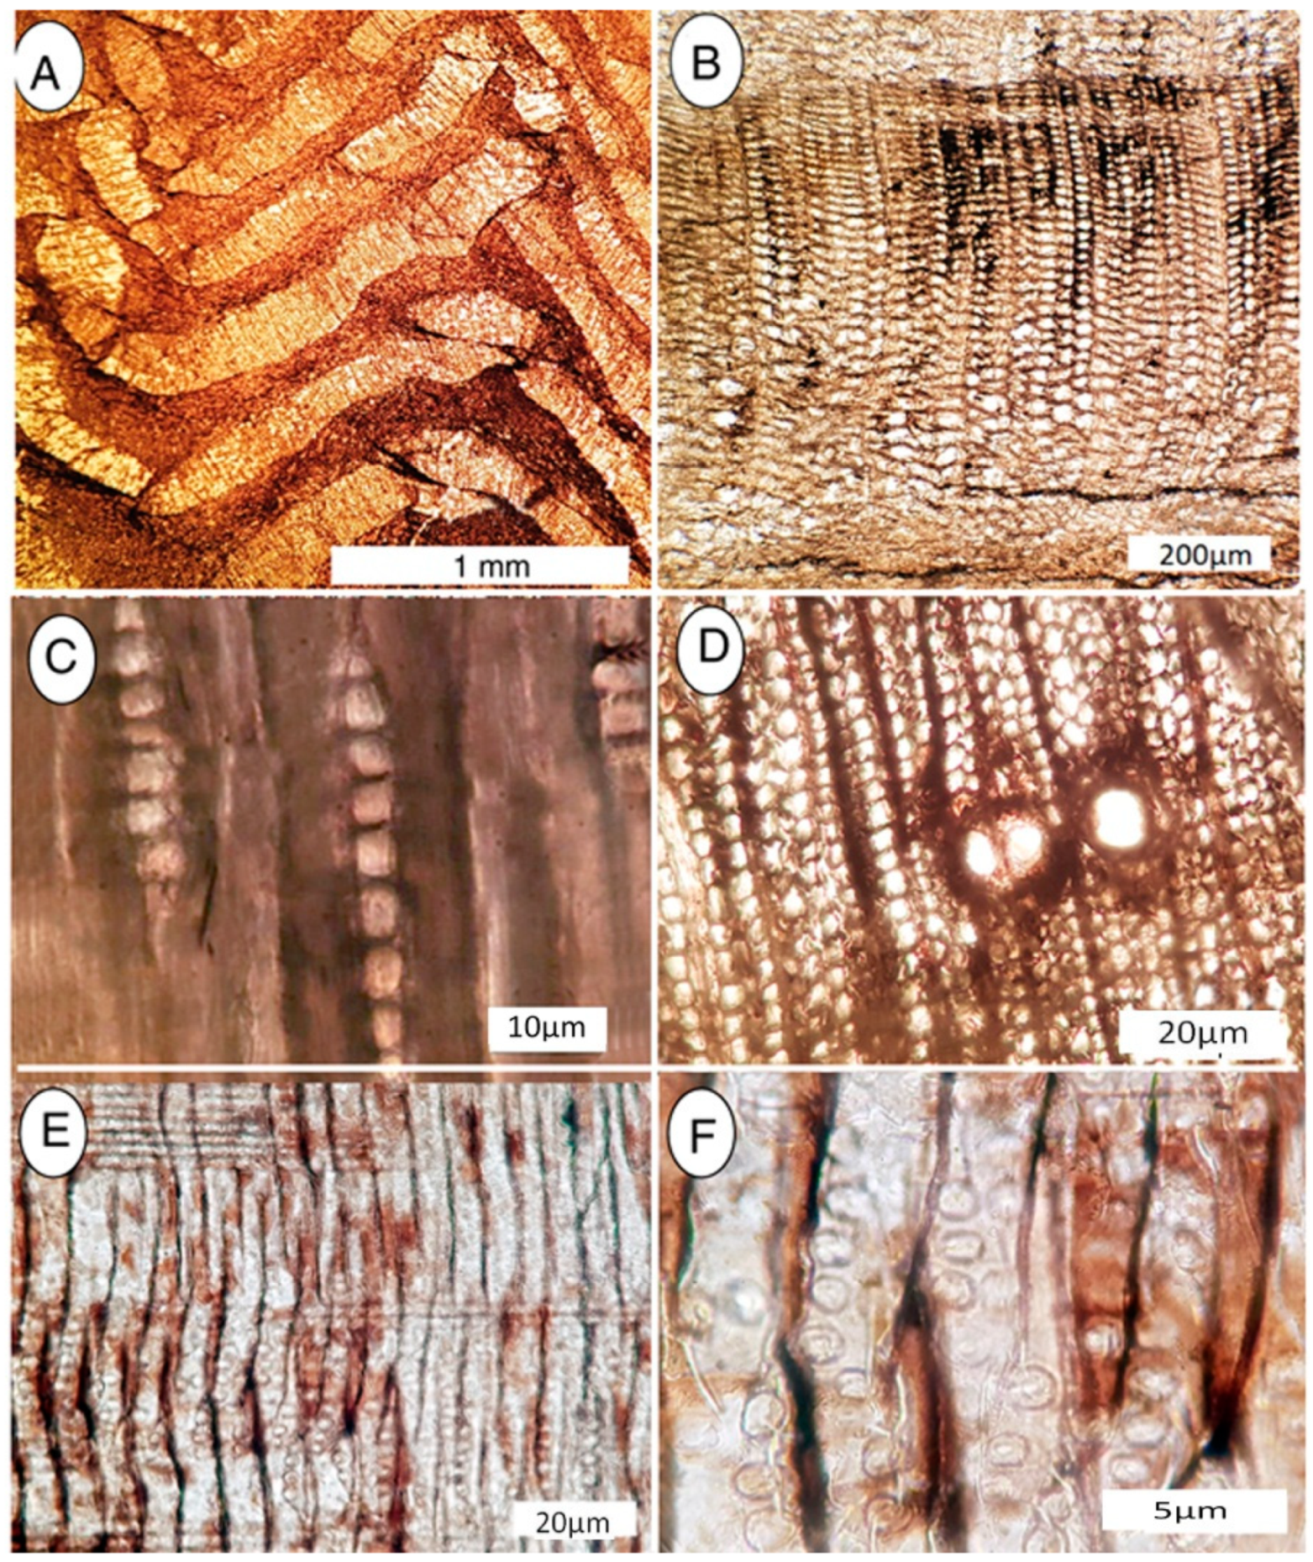
3.5. Optical Microscopy

Magnified images obtained from 30µm thick sections provide much information about the mineral composition and fossilization process for the fossil wood. One of the most important assets is that, unlike XRD, polarized light microscopy can show the presence of opal-A. The amorphous nature of this material causes opal-A to be isotropic, showing a black field of view under crossed-polar illumination. In contrast, weakly-crystalline opal-CT shows low birefringence, in contrast to the brighter birefringence of quartz and chalcedony. Figure 11 shows plain light/polarized light pairs for two specimens that appear to consist of opal-A. A third pair shows opal-A mineralized wood from sample T-19 (trunk 10), showing excellent anatomical preservation for this angiosperm.
Figure 12 shows specimens mineralized with opal-CT, and with quartz. These transverse views show cellular architecture. Cell walls may owe their dark brown color to relict organic matter.
Optical photomicrographs show that fossil wood specimens have experienced multiple episodes of mineralization. Episodic mineralization is supported by several structural characteristics: (A) cell lumina that contain different mineralogy from cell walls; (B) intercellular spaces and larger voids that contain minerals different from the cell lumen; (C) fractures that contain late-stage mineral precipitates. Figure 13 shows several examples of these characteristics.

3.6. Evidence from Polished Slabs

When sawn surfaces are polished, megascopic features are evident. These images and provide a “big picture” view of structural characteristics. These polished surfaces reveal the deformation of grain patterns, the presence of decayed areas and open or mineralized fractures, and color variations, as shown in Figure 14.

3.7. Scanning Electron Microscopy

SEM images provide supporting evidence for the presence of opal-A as a major constituent in many samples and confirms opal-CT as a component, as shown in Figure 15.
Opal-A in the Meshgin Shahr Fossil Forest woods does not show the obvious spherical structure that has been reported for this silica polymorph in some geologically young specimens, as shown in Figure 16A,B. In some samples, opal-A appears as a coalescence of microspheres, as shown in Figure 16C,D. In the Meshgin Shahr specimens, isotropic opal typically has homogeneous texture and vitreous luster, as shown in Figure 17A, but at high magnification, some specimens show granular textures that are suggestive of relict microspheres, as shown in Figure 17B.
Opal-CT is readily identifiable in XRD patterns of opalized wood from the Shahr Fossil Forest, and the characteristic crystalline form is observable in SEM images, as shown in Figure 18, and in optical photomicrographs, as shown in Figure 13C,D. Lepispheres typically occur along the margins of open voids, where the opal-CT has space to develop this morphology. These hemispherical structures are similar to features described from Sinter Island, Taupo Volcanic Field, New Zealand, which are interpreted as representing the early stage of transition of opal-A to opal-CT [32].
Fibrous chalcedony is visible in some SEM images, for example, as shown in Figure 19C,D, and crystalline quartz is identifiable in optical photomicrographs, as shown in Figure 13A,B, and SEM photos, as shown in Figure 19A,B. However, for many specimens that show chalcedony/quartz peaks in XRD patterns, or which have density values greater than 3.2 g/cm3, the form of the silica cannot be determined with certainty.

3.8. Wood Color and Porosity

Most samples are brown in color on freshly exposed surfaces, much lighter on weathered exteriors. This natural bleaching suggests that wood color may be caused by the presence of relict carbon. SEM/EDS analyses show that carbon is present in varying amounts, generally rather low but probably sufficient to be a significant pigment, as shown in Figure 20. Porosity was not evaluated in detail, but during specimen preparation the absorption of water into the end grain of fossil wood was a noticeable characteristic, presumably caused by the incomplete mineralization of intercellular spaces. This interpretation is consistent with SEM observations, where topographic cell structure is visible only when spaces between cells remain open.

3.9. Minor Accessory Minerals

Most specimens contain silica minerals as the only observable constituent, but in a few specimens high magnification reveals additional minerals in small amounts. These include gypsum and calcium phosphate (apatite or francolite). These minerals typically occur in cell lumen in opalized wood, where they provide evidence of multiple episodes of mineralization during diagenesis, as shown in Figure 21.

4. Discussion

Fossil wood occurs at other sites in Iran, and the main importance of the Meshgin Shahr Fossil Forest is the abundance of large well-preserved logs. The only strata that have previously been reported to preserve intact tree trunks are coal-bearing beds in the Upper Triassic to Lower Jurassic (Norian–Batjocian) Shemshank Group in the Alborz Mountains of central Iran. These Mesozoic fossil trees have been identified as the form genera Prototaxoxylon, Metataxodioxylon, Xenoxylon, Protopinoxylon and Protosciadopitys [33,34,35]. The Meshgin Shahr Fossil Forest represents a much younger age and very different geologic setting. The woods preserved in Pleistocene presumably represent extant species, though perhaps not taxa that still survive in the region.

4.1. Paleoecology, Paleogeography and Paleoclimate

Miocene Trunk 1 is from a conifer, but diverse palynomorphs suggest the existence of a mixed conifer/deciduous forest. The abundance of fern spores suggests this was perhaps a successional flora, where fern glades were interspersed with forest trees. Fossil pollen is not preserved in the Pleistocene volcaniclastic sediments, but the abundance of fossil wood provides evidence of the paleocology. With only one dicot specimen and 13 gymnosperms, the ancient forest was presumably predominately coniferous. The presence of well-developed annual rings indicates a seasonal climate. The dominance of conifers contrasts to modern temperate forests in northern Iran and adjacent Azerbaijan, where angiosperms predominate, with conifers comprising a minor element.
In view of the young geologic age of the volcaniclastic strata at Meshgin Shahr Fossil Forest, the difference between the ancient forest and the modern treeless desert is the result of environmental change rather than botanical evolution. The dominant cause of botanical change was climate change that occurred at global and regional level. The cycle of glacial and interglacial episodes was linked to astronomical cycles (Milankovich cycles) that had worldwide effects. At a regional level, latitude plays an important role. In winter, large barometric pressure differences between equatorial and polar latitudes enhance circumpolar vortices and equatorial high-pressure cells. The result is westerly wind that increases precipitation in the middle latitudes. In summer, these patterns are reduced, causing a decline in precipitation [7]. It is, therefore, no surprise that fossil woods at Meshgin Shahr Fossil Forest show prominent earlywood/latewood rings. The question is why this Pleistocene coniferous forest disappeared. Eruptive events produced pyroclastic flows that may have decimated local forests, but the occurrence of fossil trunks at multiple stratigraphic levels is evidence of botanical recovery. Therefore, volcanism alone cannot be invoked as a source of forest extinction. This transition cannot be explained by plate tectonic motion because the continental position has not significantly changed since the mid-Pleistocene. Part of the explanation may be glacial fluctuations. The Meshgin Shahr forest presumably developed during the moist mild-temperature climate of an interglacial episode; the cool, dry conditions of a subsequent glacial phase may have created an unfavorable environment. The final disappearance of the coniferous forest was probably the result of increased aridity that resulted from orographic change. At present, about 75% of the total land area of Iran has arid or semi-arid climate with annual precipitation rates of ~350 mm to less than 50 mm. This aridity is caused by intense solar radiation and the transport of dry air masses by north-westerly to north-easterly winds. These effects are enhanced by the Alborz and Zagros mountain ranges, which prevent moisture-laden air masses from reaching the Iranian plateau. Conditions tend to be milder in northwest Iran because of the proximity of the Caspian Sea, but the present aridity of the Meshgin Shahr Fossil Forest area is ample evidence that the environment has greatly changed from that of the mid-Pleistocene. Modern forests exist in areas of northern Iran and adjacent Azerbaijan, but the botanical composition of these plant communities is very different from the ancient forests. The extant forests sometimes contain a few conifers, but the dominant components are angiosperms, particularly Fagus (Beech), Carpinus (Hornbeam), Fraxinus (Ash), Quercus (Oak)and a host of other broadleaved trees [36,37].
What happened to descendants of the Pleistocene conifers at Meshgin Shahr? The present lack of detailed identifications is a hindrance for interpretation, but the general characteristics of the Meshgin Shahr fossil woods are reminiscent of the genera Pinus, Picea and Juniperus. The present ranges of extant members in the Middle East are geographically and ecologically diverse.
The only native species of Pinus is P. eldarica (Afghan Pine), also knows a P. brutia var. eldarica (Turkish Pine). This tree is presently native to Armenia, Azerbaijan, Georgia, northern Iraq, and Turkey, where it grows from sea level to 1200 m, attaining heights of 20–35 m [38].
The region’s extant Picea is P. orientalis (Oriental Spruce = Caucasian spruce), ranging to the Caucasus Mountains of Russia, Georgia, Azerbijanm, Armenia and northeast Turkey. The Caucasian Spruce can also be found in Northern Iran, though its numbers have decreased due to deforestation. The tree is a large coniferous evergreen tree, typically growing to 30–45 m and with a trunk diameter of up to 1.5 m; much larger individuals are known. The dominant habitat is on moist, shaded slopes at elevations of 1000–2000 m [39].
The situation with Juniperus is more complex, because four species are known from Iran and neighboring countries, as well as a relative, Cupressus sempervirens (Mediterranean Cypress). These small coniferous evergreen trees and shrubs typically have wide geographic distribution. Indeed, J. communis has the largest geographical range of any woody plant, with a circumpolar distribution throughout the cool temperate Northern Hemisphere from the Arctic south in mountains to around 30°N latitude in North America, Europe and Asia. Relict populations can be found in the Atlas Mountains of Africa [40].
In summary, the conifer-dominated Pleistocene forests typified by Meshgin Shahr have disappeared from the region, but individual members are represented by extant genera that persist in disparate environments.

4.2. Fossilization Process: Source of Silica

Although silica is the most abundant constituent of the Earth’s crust, most silicate minerals have low solubility under near-surface conditions. Dissolved silica, necessary for the silicification of wood has two main sources: volcanic glass and feldspar. Volcanic glass has high solubility compared to crystalline silicate minerals, and many of the world’s fossil forests represent trees that were buried by volcanic ash [41,42]. Silica released from glassy matrix in basalt or other extrusive rocks may also result in wood petrifaction [43,44]. In sedimentary environments, the breakdown of feldspar can be an important source of dissolved silica [45].
At Meshgin Shahr Fossil Forest, silicified tree trunks are preserved within a 68 m thick stratigraphic succession where lithic tuffite comprises the upper 40 m. Eleven of the twelve tree trunks studied in this report came from this volcaniclastic zone, the exception being a single specimen from the underlying silty sandstone. The felsic tuffaceous strata are the likely source for dissolved silica in local groundwater. The matrix for lithic tuffite is primarily composed of felsic volcanic glass; phenocrysts include abundant plagioclase crystals, as shown in Figure 22.

4.3. Mineralization Sequence

Mineralization sequence is not easy to interpret for the Meshgin Shahr fossil wood. One of the striking characteristics of silicified wood in the fossil forest is the presence of amorphous opal (opal-A) as a major component of many fossil tree trunks. Although amorphous hydrous silica is a common initial precipitate during silicification, opal-A is rarely observed in fossil wood. One explanation is the rapid rate of transformation of opal-A to opal-CT. Most opalized wood consists of opal-CT [46,47]. Opal-A mineralization of fossil wood is restricted to geologically young specimens, the most common examples being modern woods exposed to silica-rich hotspring water (e.g., [48]). Older examples include Miocene woods from northern Nevada, USA [49]. The presence of opal-A in the Meshgin Shahr Fossil Forest is consistent with the young Pliocene/Quaternary age. However, the digenetic evolution of the silicified wood is not fully clear.
The strongest evidence for the presence of opal-A comes from polarized light views of petrographic thin sections, where the isotropic optical properties of opalized woods are consistent with an opal-A composition, as shown in Figure 13. However, XRD patterns of the opaline specimens all show the presence of opal-CT, even in samples where the mineral was not detected by optical microscopy. A possible explanation is that opal-A is in the process of undergoing a solid-state transformation to opal-CT, a reaction that has not proceeded to a point where cristobalite/tridymite lattices are large enough to be microscopically visible. The transformation of opal-A to opal-CT is likely to occur during the aging of silicified wood, based on evidence from diagenesis of siliceous biogenic sediments [50,51,52,53,54,55,56,57] and siliceous hot spring sinters [58,59,60,61,62].
Quartz-mineralized specimens probably represent two very different mechanisms. For some samples, SEM images show quartz-mineralized wood tissue that is similar in morphology to specimens that consist primarily of opal-A, as shown in Figure 15. This morphology resembles the microspherical structure of opal-A as an early phase in the precipitation of silica in modern hot springs [31]. These similarities support the widely accepted hypothesis that amorphous opal can transform to crystalline forms of silica. However, this hypothesis assumes that opal-CT is an intermediate phase between opal-A and chalcedony/quartz. However, opal-CT, chalcedony, and quartz appear to have also developed as direct precipitates during multiple episodes when fractures and other open spaces were mineralized by elements carried by groundwater.
Research from other regions provides abundant examples of petrified wood that was resulted from multiple episodes of mineral deposition [49,63,64,65,66,67,68,69]. At Meshgin Shahr Fossil Forest, mineral features suggest that the following processes were involved in wood petrifaction:
Step 1—Initial silicification: Experimental studies microscopic examination of silicified wood suggest that the silicification of wood typically begins with the precipitation of amorphous silica in the cell wall, caused by the chemical affinity of cellulose and lignin for silica delivered by the penetration of groundwater [70]. This process is commonly described as “organic templating”. This initial silicification may leave larger spaces open. These open areas may include tracheid cell interiors (lumen), spaces between cells (intracellular spaces), conductive vessels, and voids created by decay or insect damage.
Step 2—Later silicification: Subsequent mineralization episodes may result when minerals are precipitated within spaces left vacant during initial cell wall mineralization. For silica, the polymorph that is precipitated depends on chemical and physical factors. For example, high dissolved Si levels favor the rapid precipitation of amorphous silica (opal), while dilute Si solutions allow the gradual development of well-ordered lattices (chalcedony/quartz).
Step 3—Fracture filling: Wood that has been partially mineralized is likely to become brittle, and post-burial physical stresses may produce open fractures. Fracturing may have been caused by shrinkage from loss of moisture, or by tectonic or structural forces that disrupted the semi-fossilized wood. At Meshgin Shahr Fossil Forest, many tree trunks show evidence of fracturing, visible in the field, as shown in Figure 13, and in collected specimens. Although some fractures remain unmineralized, commonly, these voids became filled with crystalline quartz, as shown in Figure 13A,B, and in some samples opal-CT is present as an initial layer, as shown in Figure 13C, or as an interlayering with chalcedony/quartz, as shown in Figure 13D.
Step 4—Precipitation of non-silica minerals: The 25 specimens examined for this study contain silica minerals as the major cause of petrifaction, but in a few samples SEM images reveal the presence of other minerals, as shown in Figure 20. In specimen 9 (outer zone of trunk 9), blocky microcrystals of calcium phosphate fill some cell lumina. In Specimen 25 (outer zone of log 12), lumina contain gypsum crystals. In both specimens, the presence of these minerals is evidence that cell interiors (lumen) remained open after the cell walls had been mineralized with opal. Calcium phosphate has previously been reported as a major constituent in fossil woods that range in age from Carboniferous to Holocene (summarized by [69]), and as a minor constituent of Eocene carbonized wood in Eocene wood from California, USA [70]. The precipitation of calcium phosphate is favored by the presence of dissolved Ca and P, and low pH that favors the precipitation of Ca5(PO4)3. Silica precipitation requires higher pH. Gypsum is not well-known as a component of fossil wood. The presence of this mineral at Meshgin Shahr probably represents a time when groundwater contained dissolved sulfate, causing Ca to be precipitated as CaSO4 rather than as CaCO3 or Ca5(PO4)3. These variations are evidence that groundwater conditions changed during successive episodes of mineral deposition.
Step 5—Diagenetic transformation: The final mineral composition of the fossil wood was presumably affected by silica transformations that included the conversion of opal-A to opal-CT, and the transformation of opal-CT to chalcedony/quartz.

4.4. Stratigraphic Considerations

The Meshgin Shahr Fossil Forest preserves ancient trees than occur at multiple levels over approximately 50 m of stratigraphic section. These petrified trees show a range of mineral compositions, but these variations do not appear to be related to stratigraphic position. Density values, as shown in Table 1, show that opalized woods occur at all stratigraphic levels within the tuffaceous sediment. Quartz-mineralized wood is typically present as zones within logs that also contain opal. For example, in trunk 7, the central zone (specimen T-11) has a density of 2.07 g/cm3, typical of opal, but the outer zone contains material having a density of 2.56 g/cm3 (specimen T-12), representing pure quartz. A second sample from the outer zone (Specimen T-13) has an intermediate density of 2.23 g/cm3. Trunk 4 shows a reverse trend, with quartz-density wood in the central zone (specimen T-5), and lower density wood in the outer zone (T-7). These phenomena suggest that silica mineralization varied significantly within individual logs, regardless of their stratigraphic position. The driving forces for controlling mineral precipitations were probably changes in groundwater composition during diagenesis and changes in physical conditions (pH, eH, temperature) that affected both the precipitation of new minerals and phase changes within existing minerals.

4.5. Summary

A reconstruction of the geologic history of Meshgin Shahr Fossil Forest is shown in Figure 23. The site preserves silicified tree trunks that date from two environments. Miocene fluvial strata contain diverse palynomorphs, and at least two conifer trunks. Abundant fossil logs occur at multiple levels in Pleistocene volcaniclastics that were produced by episodic eruptions of Mt. Sabalan. Our research provides a first look at the geology of the site, and a detailed consideration of the mineralogic processes that were responsible for wood silicification. In addition, we have made speculative interpretations regarding paleoecology and paleoclimate. Hopefully, future investigations will provide detailed information on the paleobotanical characteristics of this important fossil site.

Author Contributions

N.A. directed this study, conducted the field investigations, performed the initial microscopy of palynomorphs and fossil woods, and submitted the original research report. G.E.M. studied the mineralogy of fossil wood and wrote the first draft of this manuscript. N.A. and G.E.M. prepared the final version. A.H. organized specimens in the Museum of Natural History and Genetic Resources of Iran (MMTT), and she was supervisor of the original research project. Y.M. organized field studies, including providing a vehicle and dormitory, and assisted with field sampling. All authors have read and agreed to the published version of the manuscript.

Funding

Research by Abbassi was supported by the Department of Environment, Ardabil, Iran, and the Museum of Natural History and Genetic Resources of Iran (MMTT) in Tehran, Iran. Mustoe received no external funding.

Acknowledgments

We thank the MMTT chairman, Mohammad Medadi and Zahra Orak, the vice manager of the MMTT Department of Paleontology, and the manager and personnel of the department. We also thank Javad Rabbani (University of Zanjan, Iran), Keith Richards (Amsterdam University, The Netherlands), Johannnes Martin Bouchal (Natural History Museum of Sweden) and Estella Leopold (University of Washington, USA) for their help with palynology. Theodore Dillhoff (Evolving Earth Foundation, USA), Elisabeth Wheeler (North Carolina State University, USA), Nareerat Boonchai (Florida State University, USA) and Marc Phillipe (University of Lyon, France) provided helpful advice regarding wood taxonomy. Two anonymous peer reviewers provided constructive suggestions for improving the manuscript.

Conflicts of Interest

The authors declare no conflicts of interest.

References

  1. Kollmann, H.A. Tethys—The Evolution of an Idea. In New Aspects on Tethyan Cretaceous Fossil Assemblages; Kollmann, H.A., Zapfe, H., Eds.; Springer: Berlin, Germany, 1992; pp. 9–14. ISBN 978-0387865553. [Google Scholar]
  2. Rögl, F. Mediterraneas and Paratethys facts and hypotheses of an Oligocene to Miocene paleogeography (short review). Geol. Carpathica 1999, 50, 339–349. [Google Scholar]
  3. Steininger, F.F.; Wessley, G. From the Tethys Ocean to the Parathethys Sea: Oligocene to Neogene stratigraphy, paleogeography, and paleobiology of the circum Mediterranean region and the Oligocene to Neogene basin evolution of Austria. Mitt. Österreichischen Geol. Ges. 1999, 92, 95–116. [Google Scholar]
  4. Popov, S.V.; Rögl, F.; Rozanov, A.Y.; Steininger, F.F.; Scherba, I.G.; Kovac, M. Lithological-paleogeographic maps of Paratethys. 10 maps late Eocene to Pliocene. Cour. Forsch. Senckenberg 2004, 250, 1–46. [Google Scholar]
  5. Abrantes, F.; Voelker, A.; Sierro, F.; Naughton, F.; Rodrigues, T.; Cacho, I.; Aristegui, D.; Brayshaw, D.; Cicre, M.-A.; Batista, L. Paleoclimate variability in the mediterranean region. In The Climate of the Mediterranean; Lionello, P., Ed.; Elsevier: Amsterdam, The Netherlands, 2012; pp. 1–86. ISBN 9780124160422. [Google Scholar]
  6. Uchupi, E.; Swift, S.A.; Ross, D.A. Late Quaternary stratigraphy, paleoclimate, and neotectonism of the Persian (Arabian) Gulf region. Mar. Geol. 1999, 160, 1–23. [Google Scholar] [CrossRef]
  7. Kehl, M. Quaternary climate change in Iran-the state of knowledge. Erdkunde 2009, 63, 1–17. [Google Scholar] [CrossRef]
  8. El-Moslimany, A.P. The late Pleistocene climates of the Lake Zeribar region (Kurdistan, western Iran) deduced from the ecology and pollen production of nonarboreal vegetation. Vegetatio 1987, 72, 131–139. [Google Scholar]
  9. Van Zeist, W. Late Quaternary vegetation history of western Iran. Rev. Paleobot. Palynol. 1967, 2, 301–311. [Google Scholar] [CrossRef]
  10. Van Zeist, W.; Bottema, S. Palynological investigations of western Iran. Palaeohistoria 1977, 19, 19–85. [Google Scholar]
  11. Jones, M.; Djamali, M.; Stevens, L.; Heyvaert, V.; Askari, H.; Noorallahi, D.; Weeks, L. Mid Holocene environmental and climatic change in Iran. In Ancient Iran and Its Neighbors: Local Development and Long-Range Interactions in the Fourth Milenium, B.C.; Petrie, C.A., Ed.; Oxbow Books: Barnsley, UK, 2013; pp. 26–35. [Google Scholar]
  12. Nabavi, M.H.A. An Introduction to Geology of Iran (in Persian); Geologic Survey of Iran: Tehran, Iran, 1976; 109p. [Google Scholar]
  13. Stöcklin, J. Structural history and tectonics of Iran: A review. AAPG Bull. 1968, 52, 1229–1258. [Google Scholar]
  14. Amidi, S.M.; Emami, M.H.; Michel, R. Alkaline character of Eocene volcanism in the middle part of Central Iran and its geodynamic situation. Geol. Rundsch. 1984, 73, 917–932. [Google Scholar] [CrossRef]
  15. Mohajjel, M.; Fergusson, C.L. Dextral transpression in Late Cretaceous continental collision, Sanandaj–Sirjanzone, westernIran. J. Struct. Geol. 2000, 22, 1125–1139. [Google Scholar] [CrossRef]
  16. Berberian, F.; Berberian, M. Tectono-plutonic episodes in Iran. Zagros Hindu Kush Himalaya Geodyn. Evol. 1981, 3, 5–32. [Google Scholar]
  17. Allen, M.B.; Vincent, S.J.; Alsop, G.I.; Ismail-zadeh, A.; Flecker, R. Late Cenozoic deformation in the South Caspian region: Effects of a rigid basement block within a collision zone. Tectonophysics 2003, 366, 223–239. [Google Scholar] [CrossRef]
  18. Azizi, H.; Moinevaziri, H. Review of the tectonic setting of Cretaceous to Quaternary volcanism in northwestern Iran. J. Geodyn. 2009, 47, 167–179. [Google Scholar] [CrossRef]
  19. Amraee, A.; Zareisahamieh, R.; Moayyed, M.; Ahmadikhalaji, A.; Azimzadeh, A.; Santos, J.F. Peshtasar basalts: An example of post-collision basalts in sedimentary basin of Moghan, NW Iran. J. Earth Syst. Sci. 2019, 128, 63. [Google Scholar] [CrossRef] [Green Version]
  20. Vincent, S.J.; Allen, M.B.; Ismail-Zadeh, A.D.; Flecker, R.; Foland, K.A.; Simmons, M.D. Insights from the Talysh of Azerbaijan into the Paleogene evolution of the South Caspian region. Geol. Soc. Am. Bull. 2005, 117, 1513–1533. [Google Scholar] [CrossRef]
  21. Babakhani, A.; Hosseinkhan, N.; Amidi, M. Geological Map of Lahrud Quadrangle, Geological Map of Iran Series 1:100000, No. 5567; Geological Survey of Iran: Tehran, Iran, 1999. [Google Scholar]
  22. Amini, A. Oligo-Miocene fluvial-dominated deltas on the shelf of the South Caspian Sea (Parathethys). Facies 2006, 52, 579–597. [Google Scholar] [CrossRef]
  23. Didon, J.; Gemain, Y.M. Le Sabalan, Volcan Plio-Quaternaire de l’Azerbaidjan Oriental (Iran): Étude Géologique et Pétrographique de L’édifice et de Son Environnement Régional; Universite Scientifique et Médicale de Grenoble: Grenoble, France, 1976. [Google Scholar]
  24. Aghazadeh, M.; Castro, A.; Badrzadeh, Z.; Vogt, K. Post-collisional polycyclicplutonism from the Zagros hinterland: The Shaivar Dagh plutonic complex, Alborzbelt, Iran. Geol. Mag. 2011, 148, 980–1008. [Google Scholar] [CrossRef] [Green Version]
  25. Mousavi, S.Z.; Darvishzadeh, A.; Ghalamghash, J.; Abedini, M.V. Volcanology and geochronology of Sabalan volcano, the highest stratovolcano in Azerbaijan region, NWIran. Nautilus 2014, 128, 85–98. [Google Scholar]
  26. Shiran, H.S.; Moghadam, H.S. Geochemistry and petrogenesis of the Sabalan Plio-Quaternary volcanic rocks: Implication for post-collision almagmatism. Iran Soc. Crystallogr. Miner. 2014, 22, 57–68. [Google Scholar]
  27. Ghalamghash, J.; Mousavi, S.; Hassanzadeh, J.; Schmitt, A. Geology, zircon geochronology, and petrogenesis of Sabalanvolcano (northwestern Iran). J. Volcanol. Geotherm. Res. 2016, 327, 192–207. [Google Scholar] [CrossRef] [Green Version]
  28. Mustoe, G.E. Density and loss on ignition as indicators o fthe fossilization of silicified wood. IAWA J. 2016, 37, 98–111. [Google Scholar] [CrossRef]
  29. Grey, K. A Modified Palynological Preparation Technique for the Extraction of Large Neoproterozoic Actinomorhacritarchs and Other Insoluble Microfossils Record 199/10; Geological Survey of Western Australia, Department of Minerals and Energy: Perth, Australia, 1999. [Google Scholar]
  30. Riding, J.B.; Kyffin-Hughes, J.I.; Owens, B. An effective palynological preparation procedure using hydrogen peroxide. Palynology 2007, 31, 19–36. [Google Scholar] [CrossRef]
  31. Kukacha, F. Identification of coniferous woods. TAPPI 1960, 43, 887–896. [Google Scholar]
  32. Lynne, B.Y.; Campbell, K.A.; James, B.J.; Browne, P.R.L.; Moore, J. Tracking crystallinity insiliceous hot-spring deposits. Am. J. Sci. 2007, 307, 612–641. [Google Scholar] [CrossRef]
  33. Fakhr, M.S.; Marguerier, J. Prototaxoxylon feriziense n. sp., boisfossile du Jurassique moyen del’ Iran. In Contribution à L’étude de la Florerhéto-Liassique de la Formation de Shemshak de l’Elbourz (Iran); Fakhr, M.S., Ed.; Bibliothèque Nat. Paris Mém. Sci. 5: Paris, France, 1977; pp. 146–150. [Google Scholar]
  34. Nadjafi, A. Contribution à la Connaissance de la Flore Ligneuse du Jurassique D’iran. Ph.D. Thesis, Pierre and Marie Curie University, Paris, France, 1982. [Google Scholar]
  35. Poole, I.; Ataabadi, M.M. Conifer woods of the middle Jurassic Hojedk formation (Kerman basin) Centra lIran. IAWA J. 2005, 26, 489–505. [Google Scholar] [CrossRef]
  36. Schönbeck-Temesy, E. Solanaceae. In Flora Iranica: Flora des Iranischen Hochlandes und der Umrahmenden Gebirge; Persien, Afghanistan, Teile von West-Pakistan, Nord-Iraq, Azerbaidjan, Turkmenistan; Rechinger, K.H., Ed.; Akademische Druck-u. Verlagsanstalt: Graz, Austria, 1972; Volume 100, pp. 1–102. [Google Scholar]
  37. Hasanov, Z.M.; Ibrahimov, Z.A.; Nabiyev, V.R. Beech forests of Ajerbaijan: The modern condition, age structure, and regeneration. Ann. Agrar. Sci. 2017, 15, 453–457. [Google Scholar] [CrossRef] [Green Version]
  38. Phillips, G.C.; Gladfelter, H.J. Eldarica Pine, Afghan Pine (Pinus eldarica Medw.). In Trees III. Biotechnology in Agriculture and Forestry; Bajaj, Y.P.S., Ed.; Springer: Berlin, Germany, 1991; Volume 16, pp. 269–287. ISBN 978-3-642-08093-7. [Google Scholar]
  39. Farjon, A.; Filer, D. An Atlas of the World’s Conifers; Brill: Leiden, The Netherlands, 2013; ISBN 978-90-040211803. [Google Scholar]
  40. Adams, R.P. Junipers of the World: The Genus Juniperus; Trafford: Victoria, BC, Canada, 2004; ISBN 1-4120-4250-X. [Google Scholar]
  41. Murata, K.J. Volcanic ash as a source of silica for the silicification of wood. Am. J. Sci. 1940, 238, 586–596. [Google Scholar] [CrossRef]
  42. Ballhaus, C.; Gee, C.T.; Bockrath, C.; Greef, K.; Mansfeldt, T.; Rhede, D. The silicification of trees in volcanic ash—An experimental study. Geochim. Cosmochim. Acta 2012, 84, 62–74. [Google Scholar] [CrossRef]
  43. Tolen, T.L.; Reidel, S.P.; Fecht, K.R. The unusual occurrence of fossil logs within a middle Miocene flood-basalt pillow lavac omplex—An examination of geologic events and processes that created the “Vantage Forest” of central Washington State (abstract). Eos Trans. Am. Geophys. Union 1991, 72, 602. [Google Scholar]
  44. Orsen, M. Ginkgo Petrified Forest; Ginkgo Gem Shop: Vantage, WA, USA, 1998; 26p. [Google Scholar]
  45. Matysová, P.; Rössler, R.; Götze, J.; Leichmann, J.; Forbes, G.; Taylor, E.L.; Sakala, J.; Grygar, T. Alluvial and volcanic pathways to silicified plant stems (Upper Carboniferous-Triassic) and their taphonomic and palaeoenvironmental meaning. Palaeogeogr. Palaeoclimatol. Palaeoecol. 2010, 292, 127–143. [Google Scholar] [CrossRef]
  46. Mitchell, R.S.; Tufts, S. Wood opal—A tryidymite-like material. Am. Mineral. 1973, 58, 717–720. [Google Scholar]
  47. Scurfield, G.; Segnit, E.R. Petrifaction of wood by silica minerals. Sediment. Geol. 1984, 39, 149–167. [Google Scholar] [CrossRef]
  48. Hellawell, J.; Ballhaus, C.; Gee, C.T.; Mustoe, G.E.; Nagel, T.J.; Wirth, R.; Rethemeyer, J.; Tomaschek, T.; Geisler, T.; Greef, K.; et al. Incipient silicification of recent conifer wood at a Yellowstone hotspring. Geochim. Cosmochim. Acta 2015, 149, 79–87. [Google Scholar] [CrossRef]
  49. Mustoe, G.E. Late Tertiary petrified wood from Nevada, USA: Evidence of multiple silicification pathways. Geosciences 2015, 5, 286–309. [Google Scholar] [CrossRef] [Green Version]
  50. Ernst, W.G.; Calvert, S.E. An experimental study of the recrystallization of porcellanite and its bearing on the origin of some bedded cherts. Am. J. Sci. 1969, 267, 114–133. [Google Scholar]
  51. Mizutani, S. Silica in the early stages of diagenesis. Sedimentology 1970, 15, 419–436. [Google Scholar] [CrossRef]
  52. Mizutani, S. Progressive ordering of cristobalite in early stages of diagenesis. Contrib. Mineral. Petrol. 1977, 61, 129–140. [Google Scholar] [CrossRef]
  53. Murata, K.J.; Nakata, J.K. Cristobalitic stage in the diagenesis of diatomaceous shale. Science 1974, 184, 567–568. [Google Scholar] [CrossRef]
  54. Kastner, M.; Keene, J.B.; Goeskes, J.M. Diagenesis of siliceous oozes. 1. Chemical controls and the rate of opal-A to opal-CT transformation—An experimental study. Geochem. Cosmochem. Acta 1977, 41, 1041–1059. [Google Scholar] [CrossRef]
  55. Iijama, A.; Tada, R. Silica diagenesis of Neogene diatomaceous and volcaniclastic sediments in northern Japan. Sedimentology 1981, 28, 185–200. [Google Scholar] [CrossRef]
  56. Williams, L.A.; Crerar, D.A. Silica diagenesis. II. General mechanisms. J. Sediment. Petrol. 1985, 55, 312–321. [Google Scholar]
  57. Williams, L.A.; Parks, G.A.; Crerar, D.A. Silica diagenesis. I. Solubility controls. J. Sediment. Petrol. 1985, 55, 301–311. [Google Scholar]
  58. White, D.E.; Thompson, G.A.; Sandburg, C.H. Rocks, Structure, and History of Steamboat Springs Thermal Area, Washoe County, Nevada; USA Geological Survey Professional Paper 458-B; USA Government Printing Office: Washington, DC, USA, 1964; 63p. [Google Scholar]
  59. White, D.E.; Heopolous, C.; Fournier, R.O. Gold and Other Minor Elements Associated with Hot Springs and Geysers of Yellowstone Park, Wyoming, Supplemented with Data from StEamboat Springs, Nevada; USA Geological Survey Bulletin 2001; USA Government Printing Office: Washington, DC, USA, 1992; 19p. [Google Scholar]
  60. Herdianita, N.R.; Browne, P.R.L.; Rodkers, K.A. Mineralogical and textural changes accompanying aging of silica sinter. Miner. Depos. 2000, 35, 48–62. [Google Scholar] [CrossRef]
  61. Smith, B.Y.; Campbell, K.A.; Rodgers, K.A.; Browne, P.R.L. Morphological changes accompanying opal-A to opal-CT silica phase transitions in silicasinters from Orakei Korako and TeKopia, TaupoVolcanic Zone. Geol. Soc. Am. Abstr. Programs 2001, 33, 384–385. [Google Scholar]
  62. Guidry, S.A.; Chafetz, H.S. Depositional facies and diagenetic alteration in a siliceous hotspring accumulation: Examples from Yellowstone National Park, USA. J. Sediment. Res. 2003, 73, 806–823. [Google Scholar] [CrossRef]
  63. Mustoe, G.E. Mineralogy and geochemistry of late Eocene silicified wood from Florissant Fossil Beds National Monument, Colorado. In Paleontology of the Upper Eocene Florissant Formation, Colorado; Geological Society of America Specia lPaper 435; Meyer, H.W., Smith, D.M., Eds.; Geological Society of America: Boulder, CO, USA, 2008; pp. 127–140. [Google Scholar]
  64. Saminpanya, S.; Sutherland, F.L. Silica phase-transformations during diagenesis within petrified woods found in fluviald eposits from Thailand-Myanmar. Sediment. Geol. 2013, 290, 15–26. [Google Scholar] [CrossRef]
  65. Viney, M.; Deitrich, D.; Mustoe, G.; Link, P.; Lampke, T.; Götze, J.; Röβler, R. Multi-stage silicification of Pliocene wood: Re-examination of an 1895 discovery from Idaho, USA. Geosciences 2016, 6, 21. [Google Scholar] [CrossRef] [Green Version]
  66. Mustoe, G.E. Wood petrifaction: A new view of permineralization and replacement. Geosciences 2017, 7, 119. [Google Scholar] [CrossRef] [Green Version]
  67. Mustoe, G.E.; Viney, M. Mineralogy of Paleocene petrified wood from Cherokee Ranch Fossil Forest, centra lColorado, USA. Geosciences 2017, 7, 23. [Google Scholar] [CrossRef] [Green Version]
  68. Mustoe, G.E.; Viney, M.; Mills, J. Mineralogy of Eocene fossil wood from the “Blue Forest” locality, southwestern Wyoming, USA. Geosciences 2019, 9, 35. [Google Scholar] [CrossRef] [Green Version]
  69. Viney, M.; Mustoe, G.E.; Dillhoff, T.A.; Link, P. The Bruneau Wood pile: A Miocene phosphatized wood locality in southwestern Idaho, USA. Geosciences 2017, 7, 82. [Google Scholar] [CrossRef] [Green Version]
  70. Leo, R.F.; Barghoorn, S. Silicification of wood. Bot. Mus. Leafl. Harv. Univ. 1976, 25, 1–47. [Google Scholar]
Figure 1. Location map of tree trunk fossil site in the northwest Ardabil, NW.
Geosciences 10 00283 g001
Figure 2. Outcrops of sedimentary and volcanic units in the study area. (A,B) General views of fossil site, showing dark-colored capping layer (1) and light-colored tuffite-containing fossil wood (2). (C) Fossil trunk 4, sample #T-5.
Geosciences 10 00283 g002
Figure 3. Stratigraphic column showing position of individual fossil logs.
Geosciences 10 00283 g003
Figure 4. Geographic distribution of fossil logs. (Left) Satellite map; (Right) geologic map. Faults are shown by red lines.
Geosciences 10 00283 g004
Figure 5. Paleogeographic setting of the Meshgin Shahr fossil forest. (A) During much of the Mesozoic, the Tethys seaway was located in the rift zone between Laurasia and Gondwana. (B) Early Cenozoic closure of the Tethys was followed by the development of the Paratethys. Generalized map from Late Miocene, 8.5–7.0 Ma, adapted from [4].
Geosciences 10 00283 g005
Figure 6. Geology map of fossil forest area includes Eocene–Quaternary rock units. Modified from [21].
Geosciences 10 00283 g006
Figure 7. Selected palynomorphs from Miocene marl at Meshgin Shahr site. Spores: (A) Unidentified fern spore; (B) Lycopodiumsporites; (C) Cyathidites; (D) Polypodiaceosporites; (E) Verruciatosporites; (F) Pteris sp. Angiosperm pollen: (G) Malvaceae; (H) Pterocarya; (I) Caryapollenites; (J) Graminidites. Gymnosperm pollen: (K) Pinuspollenites; (L) Abietinaepollenites; (M) Cedripollenites; (N) Podocarpites; (O) Araucariacites.
Geosciences 10 00283 g007
Figure 8. Anatomical characteristics of gymnosperm wood from Meshgin Shahr Fossil Forest. (A)Transverse view, Trunk 8, showing distortion and compression of annual growth rings. (B) Transverse view, Trunk 4, displaying gradual transition between earlywood and latewood. (C) Tangential view, Trunk 12, uniseriate ray cells seen in cross section. (D) Transverse view, Trunk 12, showing resin canals. (E) Radial view, Trunk 7, with fusiform tracheids and horizontal ray cells. (F) Radial view, Trunk 7, showing bordered pits typical of conifers.
Geosciences 10 00283 g008
Figure 9. Anatomical features of angiosperm wood, trunk T-10. (A) Ring porous structure as seen in transverse view. (B) Transverse view showing branch attachment. (C) Radial view. Vessels segmented by tyloses can be seen in profile view (arrow), with horizontal rays. (D) Tangential view showing rays in cross section. (E) Tangential view of epithelial cells (parenchyma cells) surrounding a pit. (F) Paranchyma cells adjacent to vessel. (G) Tangential view of vessel showing scalariform perforation plate (arrow).
Geosciences 10 00283 g009
Figure 10. X-ray diffraction patterns for three typical specimens: T-3 (trunk 3), T-5 (trunk 4), T-20 (trunk 11). Optical microscope images of specimens T-3 and T-20 show amorphous opal-A as the predominant constituent, but X-ray patterns only show peaks for minor crystalline component opal-CT and quartz.
Geosciences 10 00283 g010
Figure 11. Optical photomicrographs of specimens that contain opal-A as the primary constituent. For photo pairs (A,B) and (C,D), the photo on the left is an illuminated with ordinary transmitted light and the right photo shows transmitted light with crossed polarizers. (A,B): Specimen T-2 (trunk 2), transverse view showing opal-A with small amounts of birefringent quartz filling voids. (C,D): T-3 (trunk 3), longitudinal view, showing isotropic opal-A as the only visible component. (E,F): Specimen T-19, showing transverse views under ordinary illumination. Image (E) shows three pairs of latewood/earlywood annual rings, and abundant vessels that are evidence that the wood is an angiosperm. At higher magnification, image (F) shows that some vessels are partitioned by tyloses, which are present in heartwood rather than sapwood. This feature is consistent with the position of this sample in the fossil trunk (e.g., it was collected from a middle position rather than the outer zone). Under polarized light, specimen T-19 is isotropic, producing a black field of view similar to photo (D).
Geosciences 10 00283 g011
Figure 12. Transverse views of fossil wood showing ordinary transmitted light images on the left and polarized light images on the right. (A) Specimen T-1 (trunk 1). Birefringent opal-CT fills cell lumen. (B) Specimen T-12 (trunk 7) is similar in appearance to T-1, but in this specimen cell, lumina contains only quartz. The opal-CT and quartz compositions are consistent with specimen densities (e.g., 2.56 g/cm3 for T-12, compared to 2.17 g/cm3 for T-1).Opal-CT and quartz identifications are also supported by XRD patterns.
Geosciences 10 00283 g012
Figure 13. Evidence for multiple phases of mineralization. (A) Polarized light view of specimen T-10 (trunk 6), showing quartz-filled fracture in quartz-mineralized wood. (B) Specimen T-7 (trunk 4) contains quartz-filled fractures in quartz-mineralized wood. The cross-cutting relationships among the quartz veins are evidence that fracturing and fracture filling occurred as several episodes. (C) Specimen T-2 (trunk 2) is opalized wood (density 2.03 g/cm3) that contains a void space having a peripheral layer of botryoidal opal-CT with quartz crystals filling the interior zone. (D) Specimen T-9 (log 5) has intermediate opal/quartz density of 2.30 g/cm3, consistent with optical photomicrographs that show isotropic opalized wood containing a zone filled with layers of opal-CT and microcrystalline quartz. For photo pairs (C,D), the image on the left is ordinary transmitted light; the right image is polarized light.
Geosciences 10 00283 g013
Figure 14. Specimen 25 (log 12). Density of 1.99 g/cm3 indicates opal composition. (A,B): Exterior surface shows a network of quartz-filled fractures. (C,D): polished interior surface shows large void spaces that contain white opaque silica, presumed to be opal-CT. The light color of the exterior relative to the dark brown color of the interior suggests the presence of relict organic matter that became bleached from exposure to weathering.
Geosciences 10 00283 g014
Figure 15. SEM evidence of opal phases. (A) Specimen T-2 (trunk 2), oblique longitudinal view showing cells mineralized with vitreous opal. (B) Specimen T-16 (trunk 8). Longitudinal view shows cells that have been mineralized with hydrous opal that contains prominent shrinkage cracks. (C) Specimen T-2 (trunk 2), radial orientation showing bordered pits (arrows). For specimens A–C, silicification is in the form of opal-A. (D) Specimen T-1 (log 1), longitudinal view shows cells mineralized with vitreous opal that contains shrinkage cracks, with exterior surfaces covered by crinkly microcrystals of opal-CT.
Geosciences 10 00283 g015
Figure 16. Neogene fossil wood showing opal-A microspheres. (A) Miocene, Virgin Valley northern Nevada, USA. (B) Pliocene, Hazen, central Nevada, USA. (C,D) Bordered pits in Pinus contorta, showing coalescence of opal-A microspheres, from modern hot springs at Yellowstone National Park, Wyoming, USA.
Geosciences 10 00283 g016
Figure 17. (A) Opal-A, Meshgin Shahr specimen T-2 (trunk 2). (B) Presumed relict opal-A texture in quartz-mineralized wood, specimen T-12 (trunk 7).
Geosciences 10 00283 g017
Figure 18. Opal-CT lepispheres on walls of open spaces in specimens from the Meshgin Shahr Fossil Forest. (A) Specimen T-2 (trunk2). (B) Specimen T-3 (trunk 3 outer zone). (C) Specimen T-4 (trunk 3 middle zone).
Geosciences 10 00283 g018
Figure 19. Microscrystalline quartz and fibrous chalcedony is present in some specimens, as indicated by SEM images. (A) Specimen T-16 (trunk 8) consists of fractured opal surrounded by microcrystalline quartz. This mixed composition is consistent with the intermediate opal/quartz density of 2.35 g/cm3. (B) Specimen 9 (trunk 5). Subhedral quartz crystals developed on fracture surface in opalized wood, explaining the intermediate opal/quartz density of 2.30 g/cm3. (C) Specimen T-12 (trunk 7). Chalcedony zones in quartz-mineralized wood (density 2.58 g/cm3). (D) Specimen T-6 (trunk 4). High-magnification view of chalcedony in wood having an intermediate opal/quartz density of 2.43 g/cm3.
Geosciences 10 00283 g019
Figure 20. SEM/EDS spectra typically show silicon and oxygen as the major constituents, with a small peak representing relict carbon. The Pd peak is a spectral artifact caused by sputter-coating specimens with this metal to provide electrical conductivity.
Geosciences 10 00283 g020
Figure 21. Accessory minerals in opalized wood. (A) Specimen T-25 (trunk 12). Cell walls are mineralized with opal, lumen contain crystalline gypsum. (B) Specimen T-9 (trunk 5). Opalized wood with lumen filled with blocky crystals of calcium phosphate (apatite or francolite).
Geosciences 10 00283 g021
Figure 22. Lithic tuffite. (A). Sample S8, from approx. 37 m stratigraphic level. (B). Magnified image showing quartz, feldspar, and pyroxene phenocrysts in tuffaceous matrix. (C). Sample S6, from 31 m stratigraphic level. Plagioclase phenocrysts in tuffaceous matrix. Left photo: ordinary transmitted light. Right photo: transmitted polarized light. The glassy tephra that comprises the matrix is isotropic.
Geosciences 10 00283 g022
Figure 23. (A) Miocene floodplain forest. (B) By the middle Pleistocene, tilted sediments were eroded to produce a new land surface where forests flourished. (C) Episodic eruptions of Mt. Sabalam produced pyroclastic flows that buried local forests. (D) Later, deposition of basalt and ignimbrite provided a capping layer. (E) Uplift and erosion combined to expose the Meshgin Shahr Fossil Forest.
Geosciences 10 00283 g023
Table 1. Location and Description of Fossil Tree Trunks.
TrunkAgeDiameter
(m)
Length
(m)
Distance above Basal ContactSampleSample Position in TrunkDensity
(g/cm3)
0Miocene0.6015T-26outer-
1Miocene0.4015T-1outer2.17
2Pleistocene0.33131T-2outer2.03
3Pleistocene0.45131.3T-3outer2.18
T-4middle2.03
4Pleistocene1.2133T-5center2.58
T-6middle2.43
T-7outer2.29
5Pleistocene12.1T-8center2.09
T-9outer2.30
6Pleistocene1.14T-10outer2.42
7Pleistocene0.6–0.251038T-11center2.07
T-12outer2.56
T-13outer2.23
T-14outer2.07
8 Pleistocene1.2142T-15center2.31
T-16middle2.35
T-17outer2.47
9Pleistocene0.30.548T-18outer2.44
10Pleistocene0.30.3T-19middle2.07
11 Pleistocene1.4158T-20center1.98
T-21middle2.31
T-22outer2.28
12Pleistocene0.851T-23center2.32
T-24middle2.23
T-25outer1.99
13Pleistocene0.71T-27outer-
T-28middle-
T-29center-
14Pleistocene0.83.162T-30outer-
15Pleistocene0.60.558T-31outer-

