Article

Influence of Degree of Saturation (DOS) on Dynamic Behavior of Unbound Granular Materials

School of Engineering and Built Environment, Griffith University, Southport, QLD 4222, Australia
*
Author to whom correspondence should be addressed.
Geosciences 2021, 11(2), 89; https://doi.org/10.3390/geosciences11020089
Submission received: 31 December 2020 / Revised: 5 February 2021 / Accepted: 11 February 2021 / Published: 15 February 2021
(This article belongs to the Special Issue Soil-Structure Interaction)

Abstract

:
The extensive application of natural unbound granular materials (UGMs) motivates studies into the mechanical properties of alternatives such as processed crushed rocks employed commonly as base or subbase layers. The rutting and settlement generated in base and subbase layers is widely restricted in many specifications and standards. In this research, the dynamic behavior including the resilient modulus ( M r ) and the plastic strain ( ε p ) of the crushed rocks collected from Queensland in Australia will be tested by a series of repeated load triaxial test (RLT) tests to investigate the behavior of UGMs under the fluctuation of the degree of saturation (DOS) (59%–100%). In particular, the RLT specimens were prepared in the laboratory through proper gradation under optimum moisture content (OMC) and 100% standard proctor maximum dry unit weight. Results from the RLT tests showed that UGM specimens soaked at higher DOS generated lower resilient modulus and weaker resistance to heavy traffic volumes with significant accumulation of plastic strain. The M r and ε p of the tested aggregates under different cyclic deviator stresses of 425 kPa and 625 kPa approximately linearly decreased and approximately linearly increased as the DOS increased with a certain number of cycles up to 50,000, respectively.

1. Introduction

Unbound granular pavement materials (UGMs), which mainly comprise rocks, gravels, and manufactured crushed rock, are generally heavily compacted in pavement structural systems as base and subbase materials to distribute the traffic loads from the surface layer above to the subgrade layer [1,2]. Natural crushed rock is the most widely applied product in pavement materials due to the mature craft of breaking the mining rocks down to reach the proper size by crushers [3,4].
Flexible pavement is a complex structure constructed with the main purpose of supporting traffic loading. Typically, pavements classified into rigid and flexible pavements are complicated structures that are constituted of several layers such as structural surface layer (asphalt surface concrete surface), base course, subbase course, and subgrade soil [5]. For the differences between flexible and rigid pavement components, in rigid pavements with the concrete surface layer, the base layer is applied to level and structurally strengthen week subgrade [6]. Moreover, for flexible pavements with an asphalt surface layer, the base and subbase layers are structural components that should provide enough strength to decrease the stress to levels that can be supported by the subgrade [6]. In particular, the function of the subbase is to support the above base layer adequately and distribute the transferred load to the subgrade layer with the facilitated drainage path [5]. In the meantime, a separation between the surface layer and subgrade is provided by the subbase layer to avoid the subgrade fines being pumped to the surface layer through the joints during the traffic loading [6].
Between November and April each year, tropical cyclones with large amounts of concentrated rainfall assault Australia and induce flooding and waterlogging to infrastructure and road closure [7,8]. The Queensland Tropical Cyclone Warning Center is impacted by five tropical cyclones on average, with 207 detected cyclones affecting the east coast since 1885 [9]. In some tropical areas such as the southeast Queensland region, a significant strength loss and even premature failure of pavements exposed to extreme moisture infiltration and increase in base saturation may be induced with sudden rainfall [7]. Sultana et al. [10] reported that most areas in eastern Australia encountered a considerable wet weather period from August to December of 2010. During the final week of December 2010 to January 2011, widespread flooding and waterlogging of roads were recorded with three-quarters of the Queensland state declared a disaster zone [10]. Roads encountered asset damage when Queensland experienced extreme flooding in January 2011 with rainfalls between 600 and 100 mm recorded in the southeast Queensland area during December 2010 and January 2011 [10]. Moreover, in March 2017, a recent tropical cyclone, Debbie, which was the strongest tropical cyclone in the Queensland region since 2015, brought 747 mm rainfall within two days and induced significant damage in pavements due to flooding and waterlogging [7,9]. Due to the potential disruption of service and extra maintenance cost, this issue and related vulnerability evaluations are remarkable in construction design and construction policy [2,6].
The significant function of pavements as part of the transportation system is to support a high amount of passenger travel without extreme maintenance requirements. Under the seasonal cycles of wet and dry periods, the formation of severe pavement cracks is potentially caused by significant stress concentration in the base, subbase, and subgrade soil [10,11]. According to the research of Sultana et al. [12] using the falling weight deflectometer (FWD) and surface condition data, a comparison of structural and functional performance was developed of the before and after flood data on flooded and non-flooded sections of the tested pavements. The results of this research showed that loss of structural strength with an accelerated deterioration rate of the flood-affected pavements was encountered. After a period of traffic loading imposed on the saturated pavement, a loss in the subgrade CBR (California bearing ratio) up to 67% and structural number up to 50% was detected by the long-term monitoring of pavements before and after the flooding event [10].
Ahmed et al. [13] modified the standard pavement maintenance policy and developed a deformation prediction model applying topographical surveying and moisture sensor monitoring concerning the rainfall at any time of the year in Texas, USA. Pavement engineers need to study the changes in the dynamic responses of materials in fluctuating moisture conditions to predict the long-term deformation and corresponding deterioration for pavement design and management. However, Sultana et al. [11,12] pointed out that most of the available pavement deterioration models considered the pavements under a normal climatic condition such as average rainfall and design traffic. Based on the gathered historical data and continually monitored data, Sultana et al. [11,12] developed new deterioration models including rutting, roughness, and structural strength to describe the rapid deterioration generated in the partially or fully saturated pavement sections subject to extreme weather events such as flooding and extreme rainfall in the southeast Queensland region. The research was conducted to investigate whether the pavement response or deterioration prediction after extreme weather could provide engineering knowledge for strategic plans such as the timing of the duration of the road closures and re-openings after a waterlogging event [11,14].
However, after the flood water receded and dried out, Sultana et al. [10] also found that further reduction of the structural strength and unexpected rehabilitation effectiveness could be caused by underlying problems with ongoing strength loss of the base, subbase, and subgrade layers after the post-flooding rehabilitation works. Therefore, the deterioration pattern of the mechanical properties of the base and subbase materials under the partially or fully saturated situations should be further investigated to provide evidence for the rehabilitation strategy.

1.1. Moisture-Damage Mechanisms in Unbound Granular Pavement Materials (UGMs)

Two main environmental factors are regarded to affect pavement performance and pavement structure design: temperature and rainfall. As mentioned by the standards including American Association of State Highway and Transportation Officials (AASHTO) [15] and Austroads [16], the design of roads is according to the moisture and temperature reflecting the historical climate of the location. The variations in the rainfall, temperature, and evaporation situations can change the moisture balance in the pavement foundations and further affect the reduction of the structural strength of the roads [17]. Since investigations into the mechanism of road distress related to moisture variation and the influence of rainfall in the prediction of pavement remaining life are important for the management of both the maintenance and rehabilitation of the pavements. Moreover, as for the description by AASHTO [15], variations in moisture content over time in the unbound base and subbase layers are also related to water infiltration through the cracks of the top asphalt concrete layers during raining, melting of ice, capillary action, and water table changes seasonally [18]. Consequently, induced higher moisture influences the resilient modulus of the unbound granular base and subbase layers, which further leads to premature failure in roads and decreases service life [18].
Road foundations are generally constructed above the water table since the pavement layers are under an unsaturated condition [19]. As the base and subbase layers are compacted close to the maximum dry density as determined in a standard proctor test, considerable variations in the degree of saturation (DOS) can be achieved by small fluctuations in moisture content [19]. Meanwhile, the load-bearing mechanism of the UGMs mainly depends on the adequate contact stresses and interparticle friction between aggregates under draining conditions. The extra moisture infiltration could undermine the bonding in the aggregate skeleton and consequently induce the losses in strength and stiffness in the UGMS layers under repeated traffic loading [5]. Dense graded base and subbase layer materials show a high dry density that coincides with defective permeability and weak draining conditions because of the low void ratio [5]. When water fills all the voids during a relative non-draining condition, this scenario results in the neutralization of the particle contact pressures and yields a decrease in material strength because of the cumulative excess pore water pressure in the voids of the aggregates, especially with the association of heavy traffic load [20]. According to the regulations of Austroads [21], the low resistance to both resilient and permanent deformations under dynamic load is also caused by the increased pore water pressure at a high DOS. On the other hand, the permanent deformation in the base and subbase layers is generated slowly when the DOS is low because the main function of the water in voids is acting as a lubricating agent in the skeleton to shift the particles into the most effective packing [21]. Consequently, the pavement deterioration is accelerated by the diminutions of effective stress, bearing capacity, and deformation resistance of base or subbase layers [20]. Moreover, poor load spread competence of the base and subbase layers can be triggered by the loss of stiffness due to the softening effect of extreme water content [19]. The induced stress concentration may cause an excessive permanent deformation in the beneath layers such as the lower subbase or subgrade [19].
To eliminate the influence of excess moisture from pavement layers on their mechanical response as far as possible, some preventive techniques can be used to restrict the water entrance such as setting barriers and enhancing drainage systems [22].

1.2. Optimum Moisture Content and the Degree of Saturation (DOS)

Water content or moisture content is the parameter that indicates the quantity of water contained in the void of porous materials such as soils, rock, ceramics, and wood on a gravimetric or volumetric basis. This property is applied in a wide range of scientific and technical fields. The quality of moisture, defined as the optimum moisture content (OMC) within the UGMs, corresponds to the maximum dry density (MDD) that the UGMs, which the materials can achieve when a standard compaction process is applied [21]. To control the moisture content during the construction of the pavement base and subbase layers, the raw material is prepared below the OMC to achieve the OMC by adjustments such as in situ spraying of additional moisture and assorted moisture maintenance measures [15]. If the moisture content of UGMs is over the OMC due to rainfall and inapposite on site operation with wave shape after compaction, the partially compacted layers should be harrowed, and wait until the OMC is dried back by solar heating, air drying, and evaporation [21]. A well restricted UGM compaction with optimum density can ensure a designed strength and resistance ability to settlement and volume change [21].
In soil mechanics and petroleum engineering, the term degree of saturation, S, is applied to indicate the saturation condition. To determine the DOS for moisture management during compaction, the moisture content measured by further drying and compacted dry density needs to be determined [23]. The DOS can be calculated by Equation (1) as follows:
S =   w ρ w ρ d × 1 ρ st
where
S = degree of saturation (%);
w = moisture content of sample (%);
ρ w = water density (t/m3)taken as 1.000 t/m3;
ρ d = compacted dry density of sample (t/m3) and
ρ st = apparent particle density (t/m3).

1.3. Traffic Loading Response and Repeated Load Triaxial Test

Initially, the flexible pavement design program was empirical and tended to determine the thickness of the considered material layers that could provide sufficient strength to support upper structural loading and protect the weaker subgrade soils below. The adopted failure criterion of the design was the subgrade shear failure mode and the experience from previous pavement construction projects. In the early 1960s, the trend of flexible pavement design shifted from empirical methods to a combined mechanistic–empirical method [24,25], which is more reasonable because an empirical model is supplemented with the theory of mechanics and the observed performance of the pavement structure in the design and analysis procedures [5]. For the details of the adopted mechanistic approach, the pavement response parameters including stresses, strains, and deformations were taken into account to estimate the influences of traffic loading and environmental factors.
As far as the main failure criteria used in the mechanistic–empirical (M–E) method, two main criteria of flexible pavement design are introduced here. The first failure criterion is the restricted vertical compressive strain on the surface of the subgrade soil layer to eliminate permanent deformation, which is claimed and recommended by [26]. After this, the second criterion is the restricted horizontal tensile strain at the bottom of the asphalt concrete layer and cemented base layer to avoid the potential of fatigue cracking, which was developed by [27]. However, the base and subbase layers are designed as ideal materials without any deterioration according to the most recent flexible pavement structural design guide in Australia [28]. UGMs are sensitive to permanent deformation (PD) and cause deterioration such as rutting under long-term transport loads [29]. Meanwhile, Austroads [28] reported that no appropriate understanding is available to describe the PD and resilient modulus of UGMs in flexible pavements in Australia. Therefore, the traffic loading response of UGMs is essential for the performance and reliability of the pavement structure.
As a universal technique to simulate the dynamic response of pavement materials in the laboratory environment, the repeated load triaxial test (RLT) is commonly suggested to evaluate the pavement material behavior under specific traffic loading magnitude and frequency, which are stipulated by standards such as Standards Australia and Austroads [1,2]. Compared with other testing techniques such as the California bearing ratio (CBR), unconfined compression strength, and triaxial shear strength, RLT could observe the dynamic response of materials under a relatively low repeated loading level under a simulated stress state [30]. Lekarp et al. [31,32] and Castelli [33] presented the dynamic behavior of UGMs and subgrade soils under the repeated wheel loads of RLT test equipment. Under the repeated wheel loads, the UGMs showed a complex nonlinear behavior (time-dependent elastoplastic response) that has been studied by many researchers through experiments [5,19]. A theoretical assumption of the response of a characteristic pavement element under cyclic loading separated the strain response into a resilient strain (recoverable deformation) and plastic strain (permanent deformation) components according to whether the component of strain can recover during the unloading process, as shown in Figure 1. Under repeated loading conditions, the strain response is generally assumed where the resilient strain is mainly elastic and the plastic strain is defined by the accumulation of the plastic strain under cyclic loading [34]. With the increase in the number of cycles, the plastic strain induced by each load application decreases, and the plastic component of strain tends to accumulate continuously [31,34]. The accumulation characteristics of plastic strain are commonly logarithmic with an increasing number of cycles [35]. Therefore, it leads to the potential rutting phenomenon, which affects the pavement structure and traffic conditions, as discussed above [31,32]. The residual performance of the pavement materials is the key parameter that is useful to define the residual performance capacity of the pavement under the imposed long-term traffic loads [33]. Under a large number of cycles, the tested specimen would present degradation phenomena with a sudden decrease in its mechanical characteristics and large strain level [33].
As suggested by the AASHTO and Austroads design guide [37,38], the plastic strain ( ε p ) the resilient modulus ( M r ), notably the M r of the base and subbase layers, has been extensively applied as a structural input parameter for pavement engineering through M–E design methods. As shown in Figure 1, the plastic strain ( ε p ) can be calculated as a difference between the total strain ( ε T ) in one cycle to the resilient strain ( ε r ) in one cycle. The cyclic deviator stress ( σ d ) can be calculated as a difference between dynamic axial compressive stress ( σ 1 ) to radial confining stress ( σ 3 ). As presented in Equation (2), the parameter of resilient modulus, M r , is defined as the ratio of the magnitude of the cyclic deviator stress, σ d to the axial resilient strain, and ε r in the RLT test [39]. The values of M r and ε p are usually tested by applying the repeated load triaxial test (RLT), which is the most direct test to simulate the field traffic loads [37,38].
M r   =   σ d ε r =   σ 1 σ 3 ε r
where
M r = resilient modulus (MPa);
σ d = cyclic deviator stress (kPa);
σ 1 = dynamic axial compressive stress (kPa);
σ 3 = radial confining stress (kPa); and
ε r = axial resilient strain.
Some of the traditional design methods treat the resilient modulus as a constant parameter (linear stress–strain behavior), while other researchers believe it to be a function of the dynamic stress conditions and materials related factors [37,38]. Theoretically, M r is stress-dependent, consequently, it means that M r is associated with tire loads, load duration, frequency of loading, and load sequence subjected by the granular base and subbase materials [35,37]. Typically, a greater degradation is observed when a higher frequency of loading is applied under long-term cyclic loading [35]. The material affecting factors of UGMs include material density, particle gradation, aggregate type, and DOS [19].

1.4. Effect of DOS on the Dynamic Response of UGMs

According to previous research by experiment investigation, the resilient modulus and plastic strain accumulation of UGMs are significantly affected by the DOS. The resilient modulus ( M r ) of pavement materials has been investigated as a sensitive function of the post-construction moisture content. Commonly, the value of M r and the stiffness of pavement materials reduce when the higher moisture content is achieved [40,41,42]. Based on this, Heydinger [43] reported that the moisture content of the tested material was the basic variable to predict the seasonal variation of the resilient modulus of pavement materials. The M r of all the loading sequences decreased with the increase in moisture content, while the sample compacted and soaked before the test showed critical lower values of M r [5]. However, in practice, Uzan [44] stated that the pavement materials represented an increase in moisture content up to 30% higher than the plastic limit or the equilibrium moisture content of the soils during the initial five years of pavement service life. It can be summarized from previous studies that there is no agreement about the effect of DOS on the M r of UGMs under repeated loads.
As mentioned by Theyse [45], who conducted a series of RLT tests in the University of California’s pavement research center, a significant effect of DOS variation on the plastic strain accumulation of the UGMs, and the variation range can be up to 30% to 100%. Guo et al. [46] reported that there was a positive relationship between the plastic strain and the confining pressure using the specimens prepared under OMC because the existence of the particle skeleton was more critical under low confining pressure. Using the UGM specimens with moisture contents below OMC, Arulrajah et al. [47,48,49] and Soliman [50] pointed out that the resilient modulus and the resistance of the plastic strain of UGMs under repeated loads declined with the increase in DOS. Zhalehjoo et al. [51] and Cerni et al. [52] also illustrated that the resilient modulus of UGMs declined with the increase in DOS under varied bulk stresses. Austroads [53,54] describes that the growth of traffic loading and the prediction of extreme weather should be the main requirement of the quality and strength characteristics of UGMs. However, only very few studies have been conducted to investigate the effect of moisture condition changing over OMC on the plastic strain under repeated traffic loads using base or subbase UGMs with various DOS.
Moreover, the research related to the ratcheting effect on the plastic strain of partially saturated UGMs is also limited. The gradual accumulation of plastic strain in UGMs subjected to repeated loading has been described as ratcheting in soil mechanics [55]. Garcia-Rojo et al. [56] and Sun et al. [57] pointed out that the triaxial specimens under OMC were initially unstable with plastic strain accumulated linearly with the increase in the number of cycles under large deviator stress and large load frequency. The influence of varied moisture content on the plastic strain of partially saturated UGMs needs to be further investigated under a large number of cycles.

1.5. Identification of Problems and Objectives

It can be seen from the discussion above that there is no agreement about the effect of DOS and in particular, the extra moisture than OMC on the resilient modulus and plastic strain of UGMs under repeated traffic loads. Therefore, this research focused on the extra moisture effect on the dynamic behavior of Class 3 subbase crushed rock under repeated loading. The specimens compacted on OMC were further treated and tested by the RLT test under different DOS to simulate the dynamic response of the subbase layer with moisture infiltration. The main objective of this research was to investigate the response and performance reduction of UGMs with extra water infiltration after being compacted (aggregates are standardly compacted to maximum dry density) as a method to design a porous UGM layer under water-induced damage. Consequently, the deterioration pattern of partially saturated UGMs observed in this research may be used for regional pavement management such as the temporary traffic control after flooding in Australia.

2. Experimental Investigation

To conduct a series of RLT tests, crushed rock subbase materials were collected from a pavement construction material stockyard in Australia. After that, the grading requirement and material classification were determined by sieve analysis. The compaction test was conducted to identify the maximum dry density (MDD) and corresponding optimum moisture content (OMC) for the specimen preparation. Based on this, the samples were compacted under MDD and OMC and were further soaked and dried to achieve the gradual increased setting of DOS. Then, repeated load triaxial (RLT) tests were operated to measure the dynamic response of the specimens under different stress levels. The DOS of the tested RLT specimens extracted from the triaxial cell after loading can be evaluated using Equation (1).

2.1. Material and Specimen Preparation

The particle size distribution of the tested UGMs met the grading requirements for Class 3 at 40 mm used as a subbase material according to the Austroads design guide [21]. Limestone rock is the origin of the crushed Class 3, which was collected from a pavement construction material stockyard in Queensland, Australia, and delivered in plastic boxes. It can be clearly distinguished in Figure 2 that the particle size distribution of the tested specimens is a dense-graded material and fits inside the Austroads specification limitation envelope of Class 3: upper and lower limits.
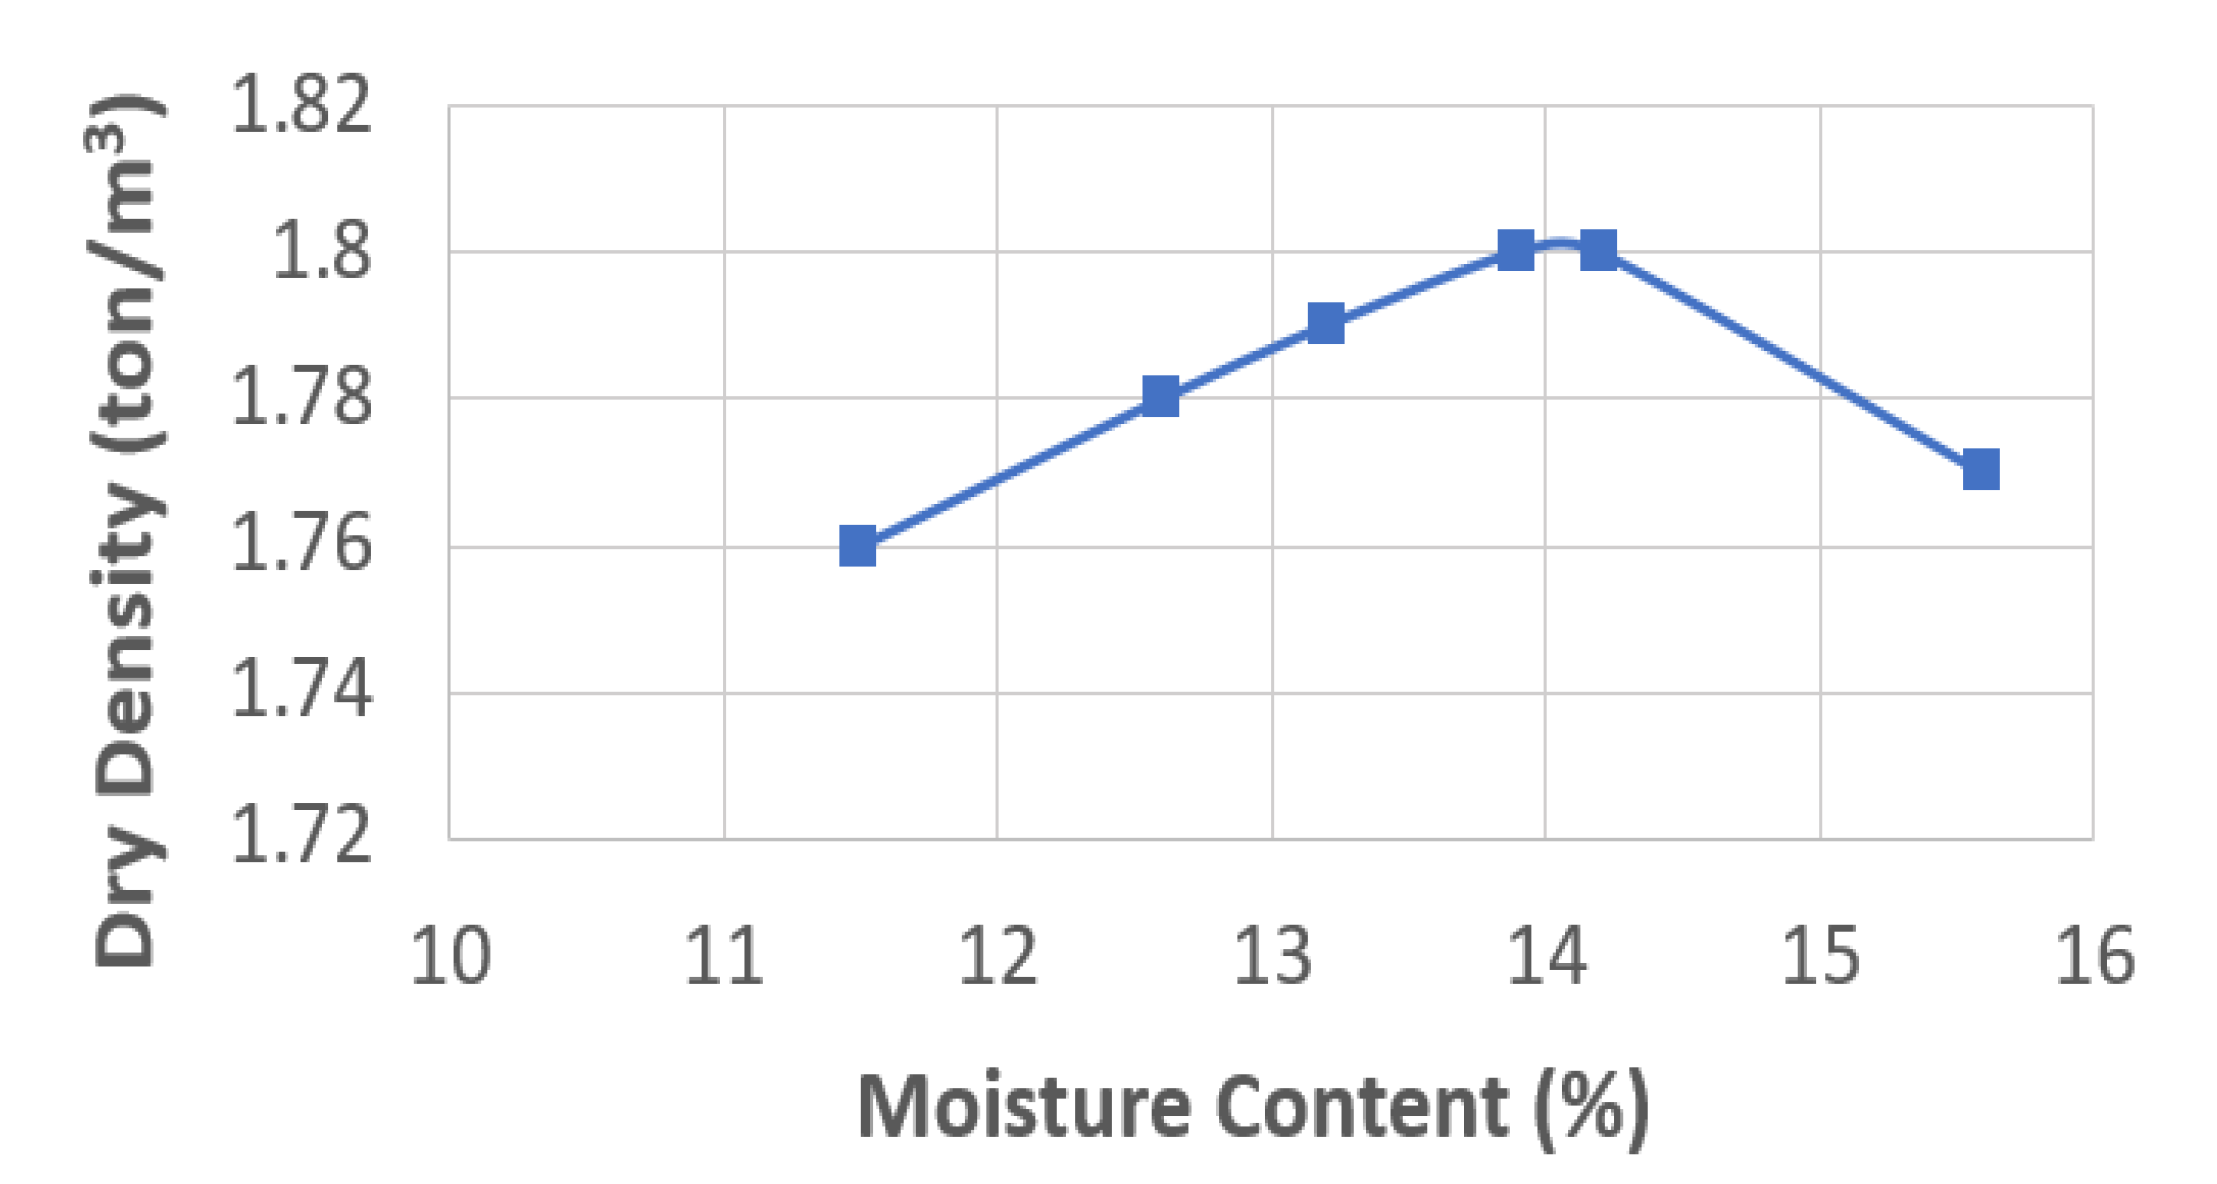
In the laboratory, the compaction test was conducted to determine the sample at the maximum dry density and compact the sample at optimum moisture content by six split cylindrical molds according to OMC and MDD. Figure 3 presents the test results of the compaction test of the used aggregates. The dry density of the specimens increased correspondingly with the increase in aggregate moisture content until the OMC at 13.9% was achieved with the MDD at 1.80 ton/m3
Furthermore, each specimen of the RLT tests was compacted into three layers using a standard compaction effect with 25 blows per layer. According to the specifications in AS 1289.6.8.1 (1995) [1] and Austroads, AG-PT/T053 [2], the maximum particle size of the triaxial specimens was restricted to not exceeding 19 mm for the RLT equipment. The aggregate material passing the 19 mm sieve was compacted to the 100% standard proctor maximum dry unit weight utilizing dynamic compaction at different degrees of saturation (DOS) levels. The triaxial specimen size was trimmed to a 200 mm high and 100 mm diameter. To eliminate the membrane penetration, double membranes (0.3 mm thickness for each) were applied for the RLT samples with a bottom fine porous stone (80 kPa). The triaxial cell contained a bronze bushing without an O-ring. The specimens of this project were prepared with a latex membrane in an AS modified split mold placed directly on the bottom plate of the triaxial cell. The specimen preparation procedure was used in accordance with Standards Australia [1] and Austroads [2].

2.2. Testing Equipment

The UTM-5P (Universal Testing Machine-5 kN, Pneumatic), coupled with recent developments in pneumatic control valves and digital control technology, is one smart equipment of Universal Testing Machines on the RLT test using cylindrical specimens. A range of transducers, sample loading jigs, actuator motor, feed-back controlled pneumatic, application computer control system, and internal and external displacement transducer of this system can be applied for different standards, general-purpose, and user-programmable tests. A constant confining stress was adopted for the sample using water in the triaxial cell. Furthermore, the axial deformation of the specimen was measured by three linear variable displacement transducers (LVDT) assembled internally and externally to the cell. The internal LVDTs had an accuracy of ±0.005 mm, while the external LVDTs had an accuracy of ±0.0015 mm. The RLT testing equipment can test the samples compacted at different DOS and corresponding densities under varied axial and radial stresses, which were developed to reflect the different elements in the road base or subbase in terms of different stress levels.

2.3. Testing Sequences

A rectangular waveform of 0.33 Hz was applied to impose the deviator stress on samples under undrained conditions. To simulate the condition of the road pavement affected by flooding in Australia [7,8,9,10,11,12], the partially saturated UGM specimens were tested under a water-logging situation. Due to the stiffness loss in the saturated upper layers such as the base layer when an extreme water-logging event occurred, a condition about the induced stress concentration in lower pavement layers should be considered. Therefore, high confinement and high deviator stresses need to be selected for the partially saturated UGM specimens, which were prepared in the laboratory to represent the upper subbase layer or the lower base layer with the potential extreme stress condition due to the weakening of upper layers. The suggested range of contact stress (p) was from 550 to 750 kPa in AS 1289.6.8.1 [1]. Meanwhile, the ratios of σ 1 / p and σ 3 / σ 1 of the plastic strain test were recommended as 0.94–1.00 and 0.167–0.300 in AS 1289.6.8.1 [1], respectively. In this case, the ratios of σ 1 / p and σ 3 / σ 1 were determined as 1.00 and 0.167 with a constant cell pressure of 125 kPa. According to Standards Australia AS 1289.6.8.1 [1], the resilient modulus and the plastic strain tests of the constant DOS were conducted under a constant cell pressure of 125 kPa and the pulsating deviator stresses ( σ 1   σ 3 of 425 kPa and 625 kPa, which were selected to simulate the light and heavy traffic loading conditions with the σ 1 equal to 550 kPa and 750 kPa for this project, respectively. The plastic strain test recording was corrected at 100 cycles to eliminate compliance effects.
Repeated deviator stress, static confining stress, targeted DOS, treating type. and actual tested DOS of the RLT testing program is presented in Table 1. The experimental stop conditions of each RLT test were that the number of cycles of 100,000 was involved or the plastic strain of one test achieved 8%, which was pre-set as the failure situation [1,2].

3. Results and Discussion

3.1. RLT Test Results with Different Applied Deviator Stresses

The test result related to the resilient modulus of tested aggregates under an applied deviator stress of 425 kPa is illustrated in Figure 4a. The specimen with 100% of the DOS was prepared to investigate the dynamic behavior of the granular material under the saturated condition. For all the prepared water contents from 59% to 100%, the resilient modulus of the specimens showed a stable trend with the increase in the number of cycles. Moreover, for all number of cycles, the corresponding resilient modulus decreased with the increase in the DOS of specimens. Particularly for the DOS of 100%, the sample presented a sudden failure after the number of cycles of 5000.
The test result of the plastic strain of the tested aggregates under an applied vertical stress of 550 kPa is presented in Figure 4b. For the extreme moisture condition with a DOS of 100%, compared to other degrees of saturation, the highest plastic strain was recorded as approximately 8.7% before the sudden failure at 50,000 cycles. Meanwhile, the tested aggregates with a DOS of 59% had the lowest plastic strain percentage of approximately 0.8% after 100,000 cycles. Furthermore, the plastic strain ε p at DOS of 71%, 80%, and 95% were approximately 1.1%, 1.9%, and 7.9% with the number of cycles up to 100,000, respectively.
Generally, it was observed that the specimen with high moisture content generated a large plastic strain with a higher increase rate when the number of cycles increased. Moreover, if the DOS of the granular samples was lower than a specific value (80%), there was no significant plastic strain observed under the applied deviator stress of 425 kPa.
Due to the increase in the applied vertical stress, relatively lower degrees of saturation (69% to 74%) of the samples were prepared to avoid the failure induced by the extreme deformation after a larger number of cycles. The result of the resilient modulus of the tested aggregates under the applied deviator stress of 625 kPa is illustrated in Figure 5a. From this figure, the range of the resilient modulus under all degrees of saturation increased with the rise in the applied vertical load. Compared to the trend of resilient modulus with the increase in the number of cycles obtained from the samples under low-stress level, the results under the applied deviator stress of 625 kPa presented a relatively obvious reduction trend after 10,000 number of cycles. Similarly, it was observed that the value of the resilient modulus of the tested aggregates reduced with the increase in the DOS for all number of cycles.
The test result related to the observed accumulation trend of plastic strain with the increase in the number of cycles is stated in Figure 5b. The plastic strain ε p at a DOS of 59%, 69%, and 74% were approximately 0.9%, 1.8%, and 2.1%, respectively, with the number of cycles of 50,000. Compared to the result related to the low-stress level, the plastic strains for the tested aggregates at a deviator stress of 625 kPa seemed to be higher, depending on the number of cycles. This means that this comparison was not observable with a low number of load cycles, whereas this comparison tended to be significant with the increase in the number of cycles.

3.2. The Comparison between Different Deviator Stresses at Similar DOS

To analyze the effect of the DOS on the resilient modulus and the plastic strain accumulation, Figure 6a–d provides more detailed comparisons of the results corresponding to vertical repeated deviator stresses of 425 kPa and 625 kPa under similar DOS. As shown in Figure 6a, under a similar DOS of around 70%, the sample imposed a deviator stress of 425 kPa accumulated a larger plastic strain than the specimen under the deviator stress of 625 kPa before 50,000 cycles. However, with the increase in the number of cycles, the rate of the plastic strain accumulation increased significantly for the sample under a high-stress level.
As for the effect of the applied vertical stress on the resilient modulus, Figure 6b illustrates the comparison of the variation of resilient modulus tested under different applied axial deviator stresses. With the enhancement of the applied vertical stress or the deviator stress, the resilient modulus of the aggregates increased from 270 MPa to 350 MPa at approximately 100 cycles. This means that the effect of the deviator stress on the resilient modulus is significant. The effect of the deviator stress on the resilient modulus for unbound granular materials is supported in the literature [5,6].
Similarly, the RLT test results of the samples with the DOS at 59% are compared in Figure 6c,d for the discussion related to the influence of the vertical stress on the accumulation of plastic strain and the resilient modulus. From Figure 6c, the values of the accumulated plastic strains of the samples applied axial deviator stresses of 425 kPa and 625 kPa gradually increased to approximately 0.6% before10,000 cycles. After that, the plastic strain induced by the 425 kPa vertical loading gradually accumulated to around 0.7% at 100,000 cycles. However, the plastic strain of the sample imposed a high-level vertical loading, indicating a significant increase trend to approximately 1.6% after 50,000 cycles. This was consistent with a result under around 70% DOS. Therefore, the influence of applied vertical loading on the accumulation of plastic strain is critical after a larger number of cycles.
As far as the influence of the applied vertical loading on the resilient modulus under 59% DOS, Figure 6d presents a similar result to that under 70% DOS. With the enhancement of the applied vertical stress, the resilient modulus increased from 310 MPa to 360 MPa approximately. Similar to the result under around 70% DOS, under the vertical deviator stress of 625 kPa, there was a sudden decrease in the resilient modulus of the test after 10,000 cycles. This means that a larger number of cycles tended to induce a sudden degradation of the resilient modulus of the granular materials imposed by the large vertical stress. Due to extreme water infiltration, the subbase materials with high DOS would show weaker resistance to the degradation of the resilient modulus and plastic strain, especially under a higher loading level and larger loading repetitions. Therefore, a limitation of traffic volume or road closure should be adopted when the roads suffer waterlogging or flooding during extreme weather events.

3.3. Resilient Modulus and Plastic Strain with Certain Number of Cycles under Varied DOS

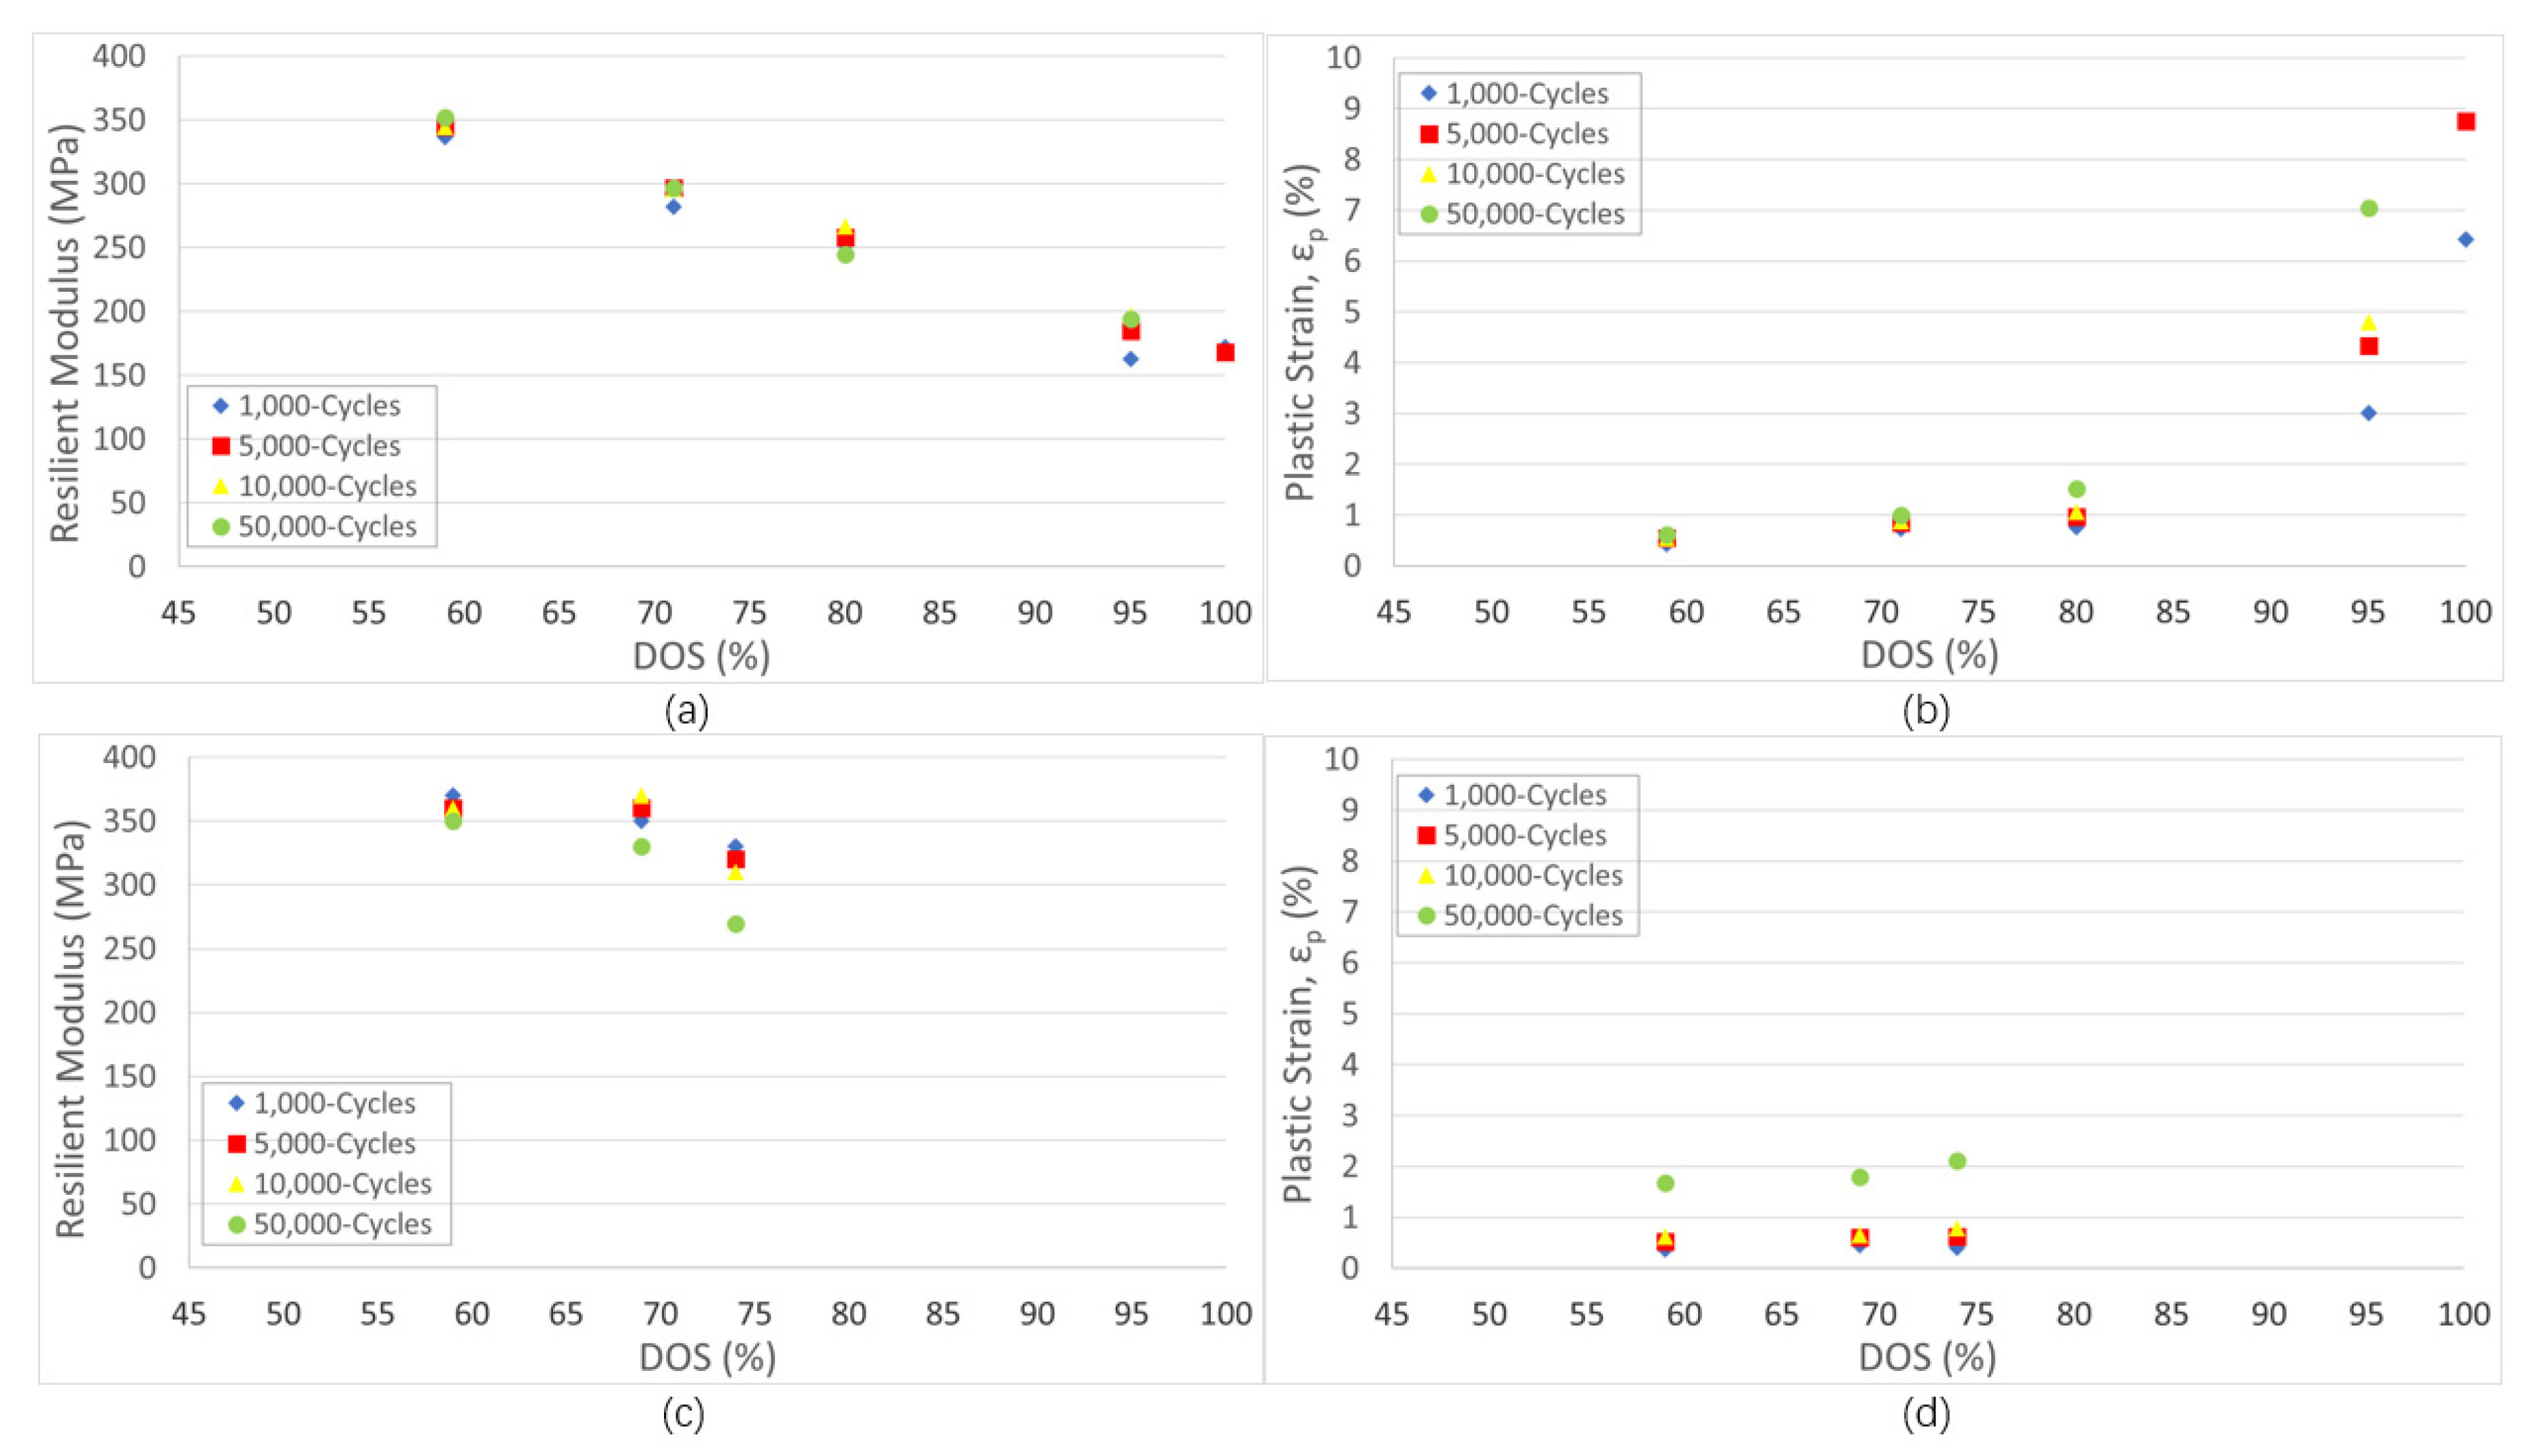
The RLT tests under different degrees of saturation were applied to determine the deformation and the resilient modulus curves for a range of stress conditions and moisture conditions to investigate the rutting of the pavement. As described in Figure 7a, the resilient modulus of the tested aggregates applied a cyclic deviator stress of 425 kPa approximately linearly decreased as the DOS increased from 59% to 100% with a certain number of cycles up to 50,000. The resilient modulus of the tested aggregates as road subbase materials was impacted by the DOS.
As presented in Figure 7b, for a certain number of cycles, the accumulated plastic strain of the tested aggregates adopting a cyclic deviator stress of 425 kPa increased approximately linearly as the DOS increased from 59% to 80%. After that, the plastic strain increases significantly as the sample tends to be fully saturated. Moreover, with a high number of load cycles, the plastic strain exhibited was observable, especially for the DOS of 95% and 100%.
Similarly, as illustrated in Figure 7c, for a certain number of cycles up to 50,000, the resilient modulus of the tested aggregates adopting a vertical deviator stress of 625 kPa also approximately linearly reduced with the increase in DOS from 69% to 74%. As indicated in Figure 7d, with a certain number of cycles, an approximately positively linear relationship was observed between the plastic strain and the DOS of the specimens imposed a vertical deviator stress of 625 kPa. The relatively linear response illustrates the onset of moisture sensitivity with the increase of plastic strain.

4. Conclusions

Based on the RLT tests conducted on the specimens with various DOS and different deviator stress levels, the conclusions that were obtained from the repeated load triaxial tests are as follows:
(i)
The resilient modulus of tested UGMs that had both 425 and 625 kPa deviator stresses applied illustrated a decreasing trend in the increase in the DOS. After that, the accumulated plastic strain of the tested aggregates of both the 425 and 625 kPa deviator stresses applied presented an increasing trend with the increase in the DOS. This type of behavior was reported previously by Arulrajah et al. [47,48] and Soliman and Shalaby [50]. With regard to the sensitivity to the moisture of the tested UGMs, Arulrajah et al. [47,48] claimed that there were higher limits of plastic strain and lower limits of resilient modulus, especially at higher DOS. This phenomenon was also observed in this research. The resilient modulus declined and the plastic strain at certain loading cycles increased with the rise in DOS at an increasing rate. When the DOS was over 75%, the plastic strain of the tested subbase UGMs showed a particularly higher sensitivity to moisture.
(ii)
With the increase in the applied deviator stress, the resilient modulus of the tested aggregates under around 60% and 70% degrees of saturation presented an increasing tendency. The increasing trend of resilient modulus with a larger deviator stress of UGMs was studied by Craciun [19] and Arulrajah et al. [49].
(iii)
With the increase in the applied vertical cyclic stress, the accumulated plastic strain of the aggregates under 60% and 70% degrees of saturation increased significantly after a large number of cycles of 20,000.
(iv)
The resilient modulus of the specimens, which were applied a larger vertical cyclic load, reduced more distinctly after the number of cycles increased to 10,000.
(v)
The resilient modulus of the tested aggregates applied different cyclic deviator stresses of 425 kPa and 625 kPa approximately linearly decreased as the DOS increased with a certain number of cycles up to 50,000. For a certain number of cycles, the accumulated plastic strain of the tested aggregates increased approximately linearly as the DOS increased from 59% to 80%. After that, the plastic strain increased significantly as the sample tended to be fully saturated. At a higher DOS level, the resistance to the plastic strain of tested UGMs was found to decline beyond the accepted limit. The results of the repeated load triaxial tests could indicate that the tested subbase UGMs at a DOS of around 75% is a feasible subbase material when the pavements encounter extreme moisture infiltration. The results of the study by Atherulrajah et al. [48,49] for UGMs showed a similar picture. They found that moisture contents in the range of 65–90% were the optimum moisture content of pavement subbase UGMs.
This paper suggests that Class 3 subbase UGMs could provide relatively sufficient resilient modulus and plastic strain resistance to low traffic volumes before the DOS increase to a critical level, which was around 75% in this research.

5. Further Research

The recommendations for further investigations are included in this research, focusing on the extension of this study to carry out tests with more series of applied stresses of the granular material for the development of empirical equations. Moreover, the recording of the pore pressure for saturated samples should be performed to study the relationship between the accumulation of pore pressure and the changing of the resilient modulus and the plastic strain.

Author Contributions

Data curation, J.S.; Formal analysis, J.S.; Funding acquisition, E.O.; Investigation, J.S.; Methodology, J.S.; Project administration, E.O. and D.E.-L.O.; Resources, E.O. and D.E.-L.O.; Software, J.S.; Supervision, E.O.; Validation, J.S.; Visualization, J.S.; Writing—original draft, J.S.; Writing—review & editing, E.O. and D.E.-L.O. All authors have read and agreed to the published version of the manuscript.

Funding

This research received no external funding.

Conflicts of Interest

The authors declare no conflict of interest.

References

  1. Australian Standard, Soil Strength and Consolidation Tests: Determination of the Resilient Modulus and Permanent Deformation of Granular Unbound Pavement Materials, 1289.6.8.1. Standards Australia, Sydney, Australia. 1995. Available online: https://trid.trb.org/view/1203019 (accessed on 14 February 2021).
  2. Austroads, Austroads Repeated Load Triaxial Test Method: Determination of Permanent Deformation and Resilient Modulus Characteristics of Unbound Granular Materials Under Drained Conditions, AG-PT/T053. Austroads Publication. 2007. Available online: https://austroads.com.au/publications/pavement/agpt-t053-07 (accessed on 14 February 2021).
  3. Huang, Y. Pavement Analysis and Design; Pearson Prentice Hall: Upper Saddle River, NJ, USA, 2004. [Google Scholar]
  4. USGS. Mineral Yearbook; United State Geological Services: New York, NY, USA, 2000.
  5. Nguyen, B. Resilient Behavior of Fine-Grained and Granular Materials for the Design of Flexible Pavements. Ph.D. thesis, RMIT University, Melbourne, Australia, 2016. [Google Scholar]
  6. Werkmeister, S.; Dawson, A.; Wellner, F. Pavement design model for unbound granular materials. J. Transp. Eng. 2004, 130, 665–674. [Google Scholar] [CrossRef]
  7. Cogan, J.; Gratchev, I.; Wang, G. Rainfall-induced shallow landslides caused by ex-Tropical Cyclone Debbie, 31st March 2017. Landslides 2018, 15, 1215–1221. [Google Scholar] [CrossRef]
  8. Podlaha, A.; Bowen, S.; Darbinyan, C.; Lörinc, M. Global Catastrophe Recap-April 2017 (PDF). Aon Benfield Analytics. 2017. Available online: http://thoughtleadership.aonbenfield.com/Documents/201707-if-1h-global-recap.pdf (accessed on 14 February 2021).
  9. Bureau of Meteorology. Tropical Cyclones in Queensland. Available online: http://www.bom.gov.au/cyclone/about/eastern.shtml#history (accessed on 20 November 2017).
  10. Sultana, M.; Chai, G.; Martin, T.; Chowdhury, S. A study on the flood affected flexible pavements in Australia. In Proceedings of the 9th International Conference on Road and Airfield Pavement Technology, Dalian, China, 9–13 August 2015; pp. 9–13. [Google Scholar]
  11. Sultana, M.; Chowdhury, S.; Chai, G.; Martin, T. Modelling rapid deterioration of flooded pavements. Road Transp. Res. A J. Aust. N. Z. Res. Pract. 2016, 25, 3–14. [Google Scholar]
  12. Sultana, M.; Chai, G.; Chowdhury, S.; Martin, T.; Anissimov, Y.; Rahman, A. Rutting and Roughness of Flood-Affected Pavements: Literature Review and Deterioration Models. J. Infrastruct. Sys. 2018, 24, 04018006. [Google Scholar] [CrossRef]
  13. Ahmed, A.; Hossain, M.; Pandey, P.; Sapkota, A.; Thian, B. Deformation Modeling of Flexible Pavement in Expansive Subgrade in Texas. Geosciences 2019, 9, 446. [Google Scholar] [CrossRef] [Green Version]
  14. Hedayati, M. Rainfall Induced Distress in Low Volume Pavements. Ph.D. Thesis, The University of Texas at Arlington, Arlington, TX, USA, 2014. [Google Scholar]
  15. AASHTO. Guide for Design of Pavement Structures. AASHTO. 1993. Available online: https://habib00ugm.files.wordpress.com/2010/05/aashto1993.pdf (accessed on 14 February 2021).
  16. Austroads, Predicting Structural Deterioration of Pavements at a Network Level–Interim Models, Sydney, NSW, Australia. 2010. Available online: https://austroads.com.au/publications/asset-management/ap-t159-10 (accessed on 14 February 2021).
  17. Papagiannakis, A.T.; Masad, E.A. Pavement Design and Material; John Wiley & Sons: Hoboken, NJ, USA, 2007. [Google Scholar]
  18. Haider, S.; Masud, M. Effect of moisture infiltration on flexible pavement performance using the AASHTOWare Pavement-ME. Advances in Materials and Pavement Prediction. In Proceedings of the International Conference on Advances in Materials and Pavement Performance Prediction (AM3P 2018), Doha, Qatar, 16–18 April 2018. [Google Scholar]
  19. Craciun, O. Matric Suction Response of Unbound Granular Base Materials Subject to Cyclic Loading. Ph.D. Thesis, University of New South Wales, Sydney, Australia, 2009. [Google Scholar]
  20. Rahman, M.; Erlingsson, S. Influence of moisture on Resilient Deformation behaviour of Unbound Granular Materials. In Proceedings of the 12th International Conference on Asphalt Pavements, ISAP 2014, Raleigh, NC, USA, 1–5 June 2014. [Google Scholar]
  21. Austroads, Guide to Pavement Technology Part 4A: Granular Base and Subbase Materials, AGPT04A-08. Austroads Publication. 2008. Available online: https://austroads.com.au/publications/pavement/agpt04a (accessed on 14 February 2021).
  22. Park, S.; Lytton, R.; Benson, F. Characterizing pavement subgrades in Texas. Env. Eng. Geosci. 1999, 3, 353–357. [Google Scholar]
  23. Transport and Main Roads, QLD, Test Method Q146, Degree of Saturation of Soils and Crushed Rock, Materials Testing Manual, Edition 4, Amendment 4. 2017. Available online: https://www.ipweaq.com/MRTS05%20Mod%20-%2031%20October%202017%20final%20version%20style.pdf (accessed on 14 February 2021).
  24. Brown, S. Soil mechanics in pavement engineering. Géotechnique 1996, 46, 383–426. [Google Scholar] [CrossRef] [Green Version]
  25. Mamlouk, M.; Zaniewski, J.; He, W. Analysis and design optimization of flexible pavement. J. Transp. Eng. 2000, 126, 161–167. [Google Scholar] [CrossRef]
  26. Kerkhoven, R.; Dormon, G. Some Considerations on the California Bearing Ratio Method for the Design of Flexible Pavements. Shell Petroleum Company. 1953. Available online: https://www.worldcat.org/title/some-considerations-on-the-california-bearing-ratio-method-for-the-design-of-flexible-pavements/oclc/475100213?referer=di&ht=edition (accessed on 14 February 2021).
  27. Saal, R.; Pell, P. Fatigue of bituminous road mixes. Colloid Polym. Sci. 1960, 171, 61–71. [Google Scholar] [CrossRef]
  28. Austroads. Guide to Pavement Technology Part 2: Pavement Structural Design. Austroads Publication. 2008. Available online: https://austroads.com.au/publications/pavement/agpt02 (accessed on 14 February 2021).
  29. Berthelot, C.; Podborochynski, D.; Marjerison, B. Saskatchewan field case study of triaxial frequency sweep characterization to predict failure of a granular base across increasing fines content and traffic speed applications. J. Transp. Eng. 2009, 135, 907–914. [Google Scholar]
  30. Sorsa, A.; Senadheera, S.; Birru, Y. Engineering Characterization of Subgrade Soils of Jimma Town, Ethiopia, for Roadway Design. Geosciences 2020, 10, 94. [Google Scholar]
  31. Lekarp, F.; Isacsson, U.; Dawson, A. State of the art. I: Resilient response of unbound aggregates. J. Transp. Eng. 2000, 126, 66–75. [Google Scholar] [CrossRef] [Green Version]
  32. Lekarp, F.; Isacsson, U.; Dawson, A. State of the art. II: Permanent strain response of unbound aggregates. J. Trans. Eng. 2000, 126, 76–83. [Google Scholar] [CrossRef] [Green Version]
  33. Castelli, F.; Cavallaro, A.; Grasso, S.; Lentini, V. Undrained Cyclic Laboratory Behavior of Sandy Soils. Geosciences 2019, 9, 512. [Google Scholar]
  34. Huang, H.; Luo, J.; Moaveni, M. Advanced Analytical Tool for Flexible Pavement Design and Evaluation. Airfield and Highway Pavements 2019: Design, Construction, Condition Evaluation, and Management of Pavements; American Society of Civil Engineers: Reston, VA, USA, 2019; pp. 61–71. [Google Scholar]
  35. Kucharczyk, K.; Głuchowski, A.; Miturski, M.; Sas, W. Influence of Load Frequency on Cohesive Soil Respond. Geosciences 2018, 8, 468. [Google Scholar] [CrossRef] [Green Version]
  36. Alnedawi, A.; Nepal, K.; Al-Ameri, R. Mechanistic behavior of open and dense graded unbound granular materials under traffic loads. Int. J. Geomate. 2018, 14, 124–129. [Google Scholar] [CrossRef]
  37. AASHTO. Guide T307: Standard Test Method for Determining the Resilient Modulus of Soil and Aggregate Materials. AASHTO. 2007. Available online: https://global.ihs.com/doc_detail.cfm?document_name=AASHTO%20T%20307&item_s_key=00489204 (accessed on 14 February 2021).
  38. Austroads. Pavement Design-A Guide to the Structural Design of Road Pavements; Austroads Publication: Sydney, Australia, 2012. [Google Scholar]
  39. Seed, H.; Chan, C.; Lee, C. Resilience characteristics of subgrade soils and their relation to fatigue failures in asphalt pavements. In Proceedings of the International Conference on the Structural Design of Asphalt Pavements, Michigan, MI, USA, 20–24 August 1962. [Google Scholar]
  40. Rada, G.; Witczak, M. Comprehensive evaluation of laboratory resilient moduli results for granular material. Transp. Resear. Rec. 1981, 810, 23–33. [Google Scholar]
  41. Wang, M.; Kong, L.; Zhao, C. Dynamic characteristics of lime-treated expansive soil under cyclic loading. J. Rock Mech. Geotech. Eng. 2012, 4, 352–359. [Google Scholar]
  42. Naji, K. Resilient modulus-moisture content relationships for pavement engineering applications. Int. J. Pavement Eng. 2018, 19, 651–660. [Google Scholar] [CrossRef]
  43. Heydinger, A. Evaluation of seasonal effects on subgrade soils. Transp. Resear. Rec. 2003, 1821, 47–55. [Google Scholar] [CrossRef]
  44. Uzan, J. Characterization of granular material. Transp. Resear. Rec. 1985, 1022, 52–59. [Google Scholar]
  45. Theyse, H. Stiffness, Strength, and Performance of Unbound Aggregate Material: Application of South African HVS and Laboratory Results to California Flexible Pavements; Report produced under the auspices of the California Partnered Pavement Research Program for the California Department of Transportation; University of California: Berkeley, CA, USA, 2002. [Google Scholar]
  46. Guo, L.; Wang, J.; Cai, Y. Undrained deformation behavior of saturated soft clay under long-term cyclic loading. Soil Dyn. Earthq. Eng. 2013, 50, 28–37. [Google Scholar] [CrossRef]
  47. Arulrajah, A.; Piratheepan, J.; Aatheesan, T.; Bo, M. Geotechnical properties of recycled crushed brick in pavement applications. J. Mater. Civ. Eng. 2011, 23, 1444–1452. [Google Scholar]
  48. Arulrajah, A.; Piratheepan, J.; Ali, M.; Bo, M. Geotechnical properties of recycled concrete aggregate in pavement sub-base applications. Geotech. Test. J. 2012, 35, 743–751. [Google Scholar] [CrossRef]
  49. Arulrajah, A.; Piratheepan, J.; Disfani, M.; Bo, M. Resilient moduli response of recycled construction and demolition materials in pavement subbase applications. J. Mater. Civ. Eng. 2013, 25, 1920–1928. [Google Scholar] [CrossRef]
  50. Soliman, H.; Shalaby, A. Permanent deformation behavior of unbound granular base materials with varying moisture and fines content. Transport. Geotech. 2015, 4, 1–12. [Google Scholar] [CrossRef]
  51. Zhalehjoo, N.; Tolooiyan, A.; Mackay, R.; Bodin, D. The effect of instrumentation on the determination of the resilient modulus of unbound granular materials using advanced repeated load triaxial testing. Transport. Geotech. 2018, 14, 190–201. [Google Scholar] [CrossRef]
  52. Cerni, G.; Corradini, A.; Pasquini, E.; Cardone, F. Resilient behaviour of unbound granular materials through repeated load triaxial test: Influence of the conditioning stress. Road Mater. Pavement Des. 2015, 16, 70–88. [Google Scholar]
  53. Austroads. Guide to Pavement Technology Part 2: Pavement Structural Design, AGPT02-17. Austroads Publication. 2017. Available online: https://trid.trb.org/view/1498339 (accessed on 14 February 2021).
  54. Austroads. Long-Term Pavement Performance Study-Final Report, AP_T342-19. Austroads Publication. 2019. Available online: https://austroads.com.au/publications/asset-management/ap-t342-19 (accessed on 14 February 2021).
  55. Alonso-Marroquin, F.; Herrmann, H.J. Ratcheting of granular materials. Phys. Rev. Lett. 2004, 92, 054301. [Google Scholar] [CrossRef] [Green Version]
  56. García-Rojo, R.; Herrmann, H.J. Shakedown of unbound granular material. Granul. Matt. 2005, 7, 109–118. [Google Scholar] [CrossRef] [Green Version]
  57. Sun, Q.D.; Indraratna, B.; Nimbalkar, S. Effect of cyclic loading frequency on the permanent deformation and degradation of railway ballast. Géotechnique 2014, 64, 746–751. [Google Scholar] [CrossRef] [Green Version]
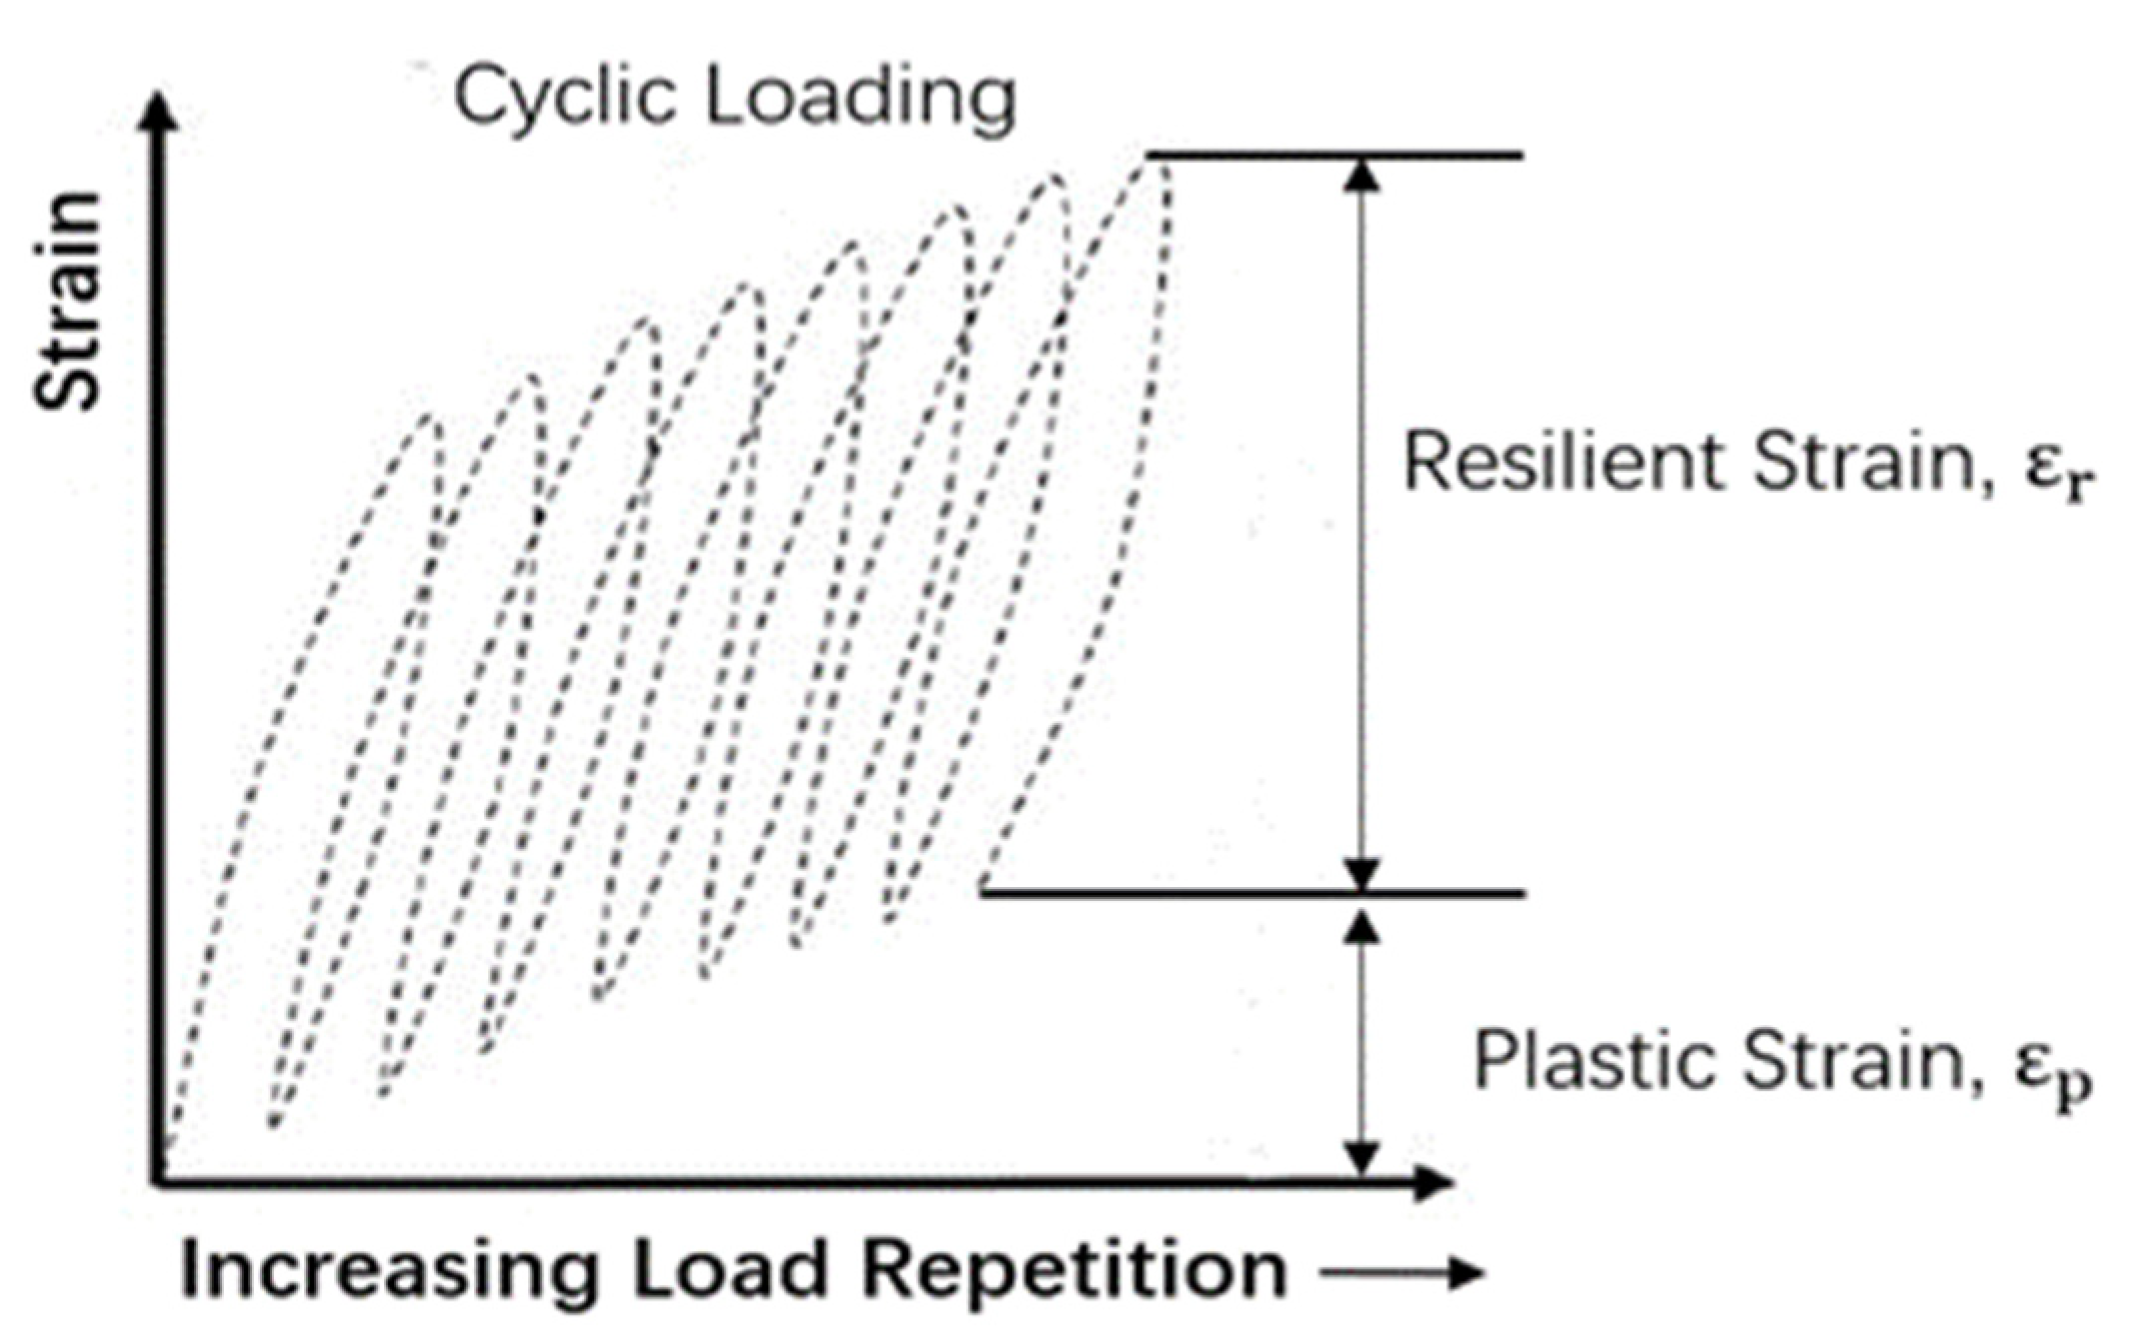
Figure 1. Characteristic stress–strain behavior [36].
Geosciences 11 00089 g001
Figure 2. Particle size distribution of the tested aggregates.
Geosciences 11 00089 g002
Figure 3. Dry density–moisture content relationship.
Geosciences 11 00089 g003
Figure 4. The relationship between dynamic response and the number of cycles with an applied deviator stress of 425 kPa: (a) resilient modulus; (b) plastic strain.
Geosciences 11 00089 g004
Figure 5. The relationship between the dynamic response and the number of cycles with an applied deviator stress of 625 kPa: (a) resilient modulus; (b) plastic strain.
Geosciences 11 00089 g005
Figure 6. The comparison of resilient modulus and plastic strain versus the number of cycles at similar DOS: (a) plastic strain of DOS at around 70%; (b) resilient modulus of DOS at around 70%; (c) plastic strain at DOS around 59%; and (d) resilient modulus at DOS around 59%.
Geosciences 11 00089 g006
Figure 7. The relationship between the repeated load triaxial test (RLT) test results and DOS at a different number of cycles: (a) resilient modulus with applied deviator stress of 425 kPa; (b) plastic deformation with applied deviator stress of 425 kPa; (c) resilient modulus with applied deviator stress of 625 kPa; and (d) plastic deformation with applied deviator stress of 625 kPa.
Geosciences 11 00089 g007
Table 1. Repeated loading triaxial testing program of unbound aggregates.
σ3 (kPa)σd (kPa)Target DOS (%)Treat TypeActual DOS (%)
12542560%–100%OMC59%
Soaking71%
80%
95%
100%
12562560%–75%OMC59%
Soaking69%
74%
Note: σ3: confining stress. σd: deviator stress. DOS: the degree of saturation.
Publisher’s Note: MDPI stays neutral with regard to jurisdictional claims in published maps and institutional affiliations.