Abstract
A numerical characterization of a fractured rock mass and its mechanical behavior using a discontinuum approach was carried out utilizing lattice-spring-based synthetic rock mass (LS-SRM) models. First, LS-SRM models on a laboratory scale were created to reproduce standard rock mechanical tests on Triassic sandstone samples from a quarry in Germany. Subsequently, the intact rock properties were upscaled to an element volume representative for geotechnical applications, recalibrated and combined with a Discrete Fracture Network (DFN) model. The resulting fractured rock mass properties are compared to predictions from empirical relationships based on rock mass classification schemes and the DFN-Oda-Geomechanics approach. Modeling results reveal a significant reduction in the strength of the fractured rock mass compared to the intact rock, showing a high agreement with empirically calculated values. Results for the deformation modulus reveal a significant reduction induced by the fracture network and a good agreement compared to the results obtained by other approaches. It is shown that the LS-SRM allows analyzing the complex mechanical behavior during failure of rock masses, including crack initiation, propagation and coalescence. The resulting rock mass properties are key parameters for a wide range of geotechnical applications and can be used for large-scale numerical modeling as well.
1. Introduction
Fracture networks contribute significantly to the mechanical behavior of naturally fractured rock masses [1,2]. Thus, an adequate characterization is relevant for numerous applications ranging from engineering geological and geotechnical applications such as slope stability and tunneling to the characterization of hydrocarbon and geothermal reservoirs [3,4]. In general, there are various approaches to gaining information about the mechanical characteristics of a rock mass, particularly its deformation modulus, Poisson’s ratio and unconfined compressive strength. Possible options are in situ tests [5], empirical equations based on rock mass classification schemes such as the Rock Mass Rating (RMR) [6], Geological Strength Index (GSI) [7] or the Q-System [8] and numerical simulations based on laboratory experiments and field investigations [9]. However, the use of in situ tests is limited to relatively small rock mass volumes (less than a few m³), associated with high costs and operational difficulties, frequently produces no unequivocal results and is time-consuming [10,11]. The various empirical relationships based on rock mass classification schemes have proven to be a reliable and convenient method for estimating rock mass properties. Nevertheless, it is important to note that the equations in combination with their underlying parameters should be selected with caution and might reach their limits when describing anisotropic rock masses and the spatial variation in rock properties [12,13]. Among the various approaches available to determine the mechanical characteristics of rock masses, numerical simulations represent an interesting option, as they can incorporate complex fracture network geometries and allow analyzing the behavior of intact rock as well as of fractured rock masses [3,9,14]. Numerical approaches to characterize the geomechanics of fractured rock masses can be distinguished into continuum and discontinuum approaches. The preference for selecting a continuum or discontinuum modeling scheme depends mainly on the complexity of the fracture network and on the dimensions of the project studied. Continuum approaches consider the rock mass as a continuous medium with a limited number of discontinuities, whereas discontinuum approaches treat the rock mass as a system of individual components interacting along its boundaries [9,15]. Therefore, an increased amount of work has been conducted in recent times on simulating mechanical behavior using the so-called synthetic rock mass (SRM) approach, representing a discontinuum approach, on intact rock scale [16,17,18], on rock mass scale [19,20], for slope stability applications [21,22,23] and for hydraulic fracturing [24,25].
In this study, we present a numerical characterization of a fractured sedimentary rock mass and its mechanical behavior by means of unconfined and confined compression experiments using a discontinuum approach based on lattice-spring-based SRM (LS-SRM) models. The upscaling results are subsequently compared to empirical relationships based on rock mass classification schemes. Furthermore, the results are compared against a continuum approach, which is referred to as the DFN-Oda-Geomechanics approach in this work. Although a fractured sedimentary rock is considered in this study, the workflow used for the determination of mechanical rock mass properties is equally applicable to all types of fractured rock. The resulting rock mass strength and calculated deformation moduli are key parameters for a wide range for geotechnical applications, but the upscaled properties can also be used for large-scale numerical modeling.
2. Fundamentals
2.1. DFN Modeling
A Discrete Fracture Network (DFN) model can explicitly represent fracture networks in three-dimensional space. The approach allows considering geologically realistic fracture descriptions based on site investigations, providing a deterministic–stochastic representation of a naturally fractured rock mass [26,27,28]. The DFN model can then be used going forward in various applications and workflows from fragmentation to block size analysis, kinematics and stability, as well as feeding rock property descriptions into conventional numerical tools. Necessary to build a DFN model are key parameters such as fracture geometry, including orientation, intensity and size [29,30], as well as the mechanical properties from site investigations. Small- to medium-scale fractures, representing the vast majority in a naturally fractured rock mass, are incorporated by a stochastic approach into the DFN model. Large structures such as fault surfaces, if present, can be defined as deterministic features, honoring their true position. These two approaches can then be combined to create a DFN model of the project domain. Statistical properties of the input parameters can be generated from outcrop data, e.g., manual measurements, Terrestrial Laser Scanning (TLS), Photogrammetry (PGM) or borehole data (cores and image logs).
Following a mandatory calibration stage of the geometrical characteristics of the DFN model, mechanical and hydraulic properties such as cohesion, friction angle, normal and shear stiffness, aperture and permeability are assigned to each discontinuity set. For the rock matrix, the values of Young’s modulus and Poisson’s ratio, as well as porosity and permeability, are required. The hydromechanical properties of fractures and intact rock should be determined as far as possible by standard laboratory work on project-specific samples, backed up by literature data, if necessary. Subsequently, the DFN model is combined with a grid of calculation cells having the same dimensions as the one used for continuum modeling later on.
In this study, the Oda-Geomechanics approach is used to calculate tensors for deformation modulus as well as Poisson’s ratio for each cell as a function of the prevailing fracture network and the superimposed grid. This approach relies on the analytical calculation of a descriptive compliance tensor derived from the fabric tensor defined by the orientation, size and volume density of the fractures [31,32]. The spatial resolution of the tensor depends on the voxel size selected for upscaling and the subsequent numerical simulation, respectively. This approach, based on Oda’s crack tensor theory [32], represents an analytical method that enables the calculation of a descriptive compliance tensor computed by the combination of the fracture compliance tensor with the matrix compliance tensor within a fractured medium [32,33]. Using this DFN-Oda-Geomechanics approach, it is possible to consider the interaction of the prevailing fracture network and the impact on the mechanical properties of the entire rock mass.
2.2. SRM Modeling
The synthetic rock mass (SRM) approach, established by [34], was designed to quantitatively evaluate the impact of fracture networks on mechanical behavior by providing an explicit representation of the internal structure of a fractured rock mass. In general, the SRM modeling approach consists of two components, the intact rock and pre-existing discontinuities. Over the years, several Discrete Element Methods (DEM) such as the bonded particle method (BPM) introduced by [35] or the bonded block model (BBM) in combination with a DFN model have been widely used to investigate the mechanical properties of fractured rock masses [19,36,37,38,39,40]. Using the BPM approach, intact rock is represented in 2D by circular grains or in 3D by spherical grains connected with an assigned bond strength in tension and shear at their contacts [35]. By calibrating the contact properties, it is possible to obtain the desired elastic parameters of the rock. It has been demonstrated that the BPM models can represent the brittle behavior of rocks with a very good accuracy [35,41]. In addition to the intact properties, it is essential to realistically represent the fractures. For this purpose, the smooth joint model (SJM) [42] is used, which addresses the issue that the particle size often does not correspond to the roughness of the fractures and, thus, influences the mechanical properties. In the SJM, regardless of the orientation of the particles, the contacts are oriented perpendicular to the orientation of the fracture, allowing the particles to move smoothly along the fracture surface [41]. The pre-existing discontinuities may be inserted either deterministically or by using a stochastic DFN model, which is usually more feasible due to the large number of discontinuities in rock masses.
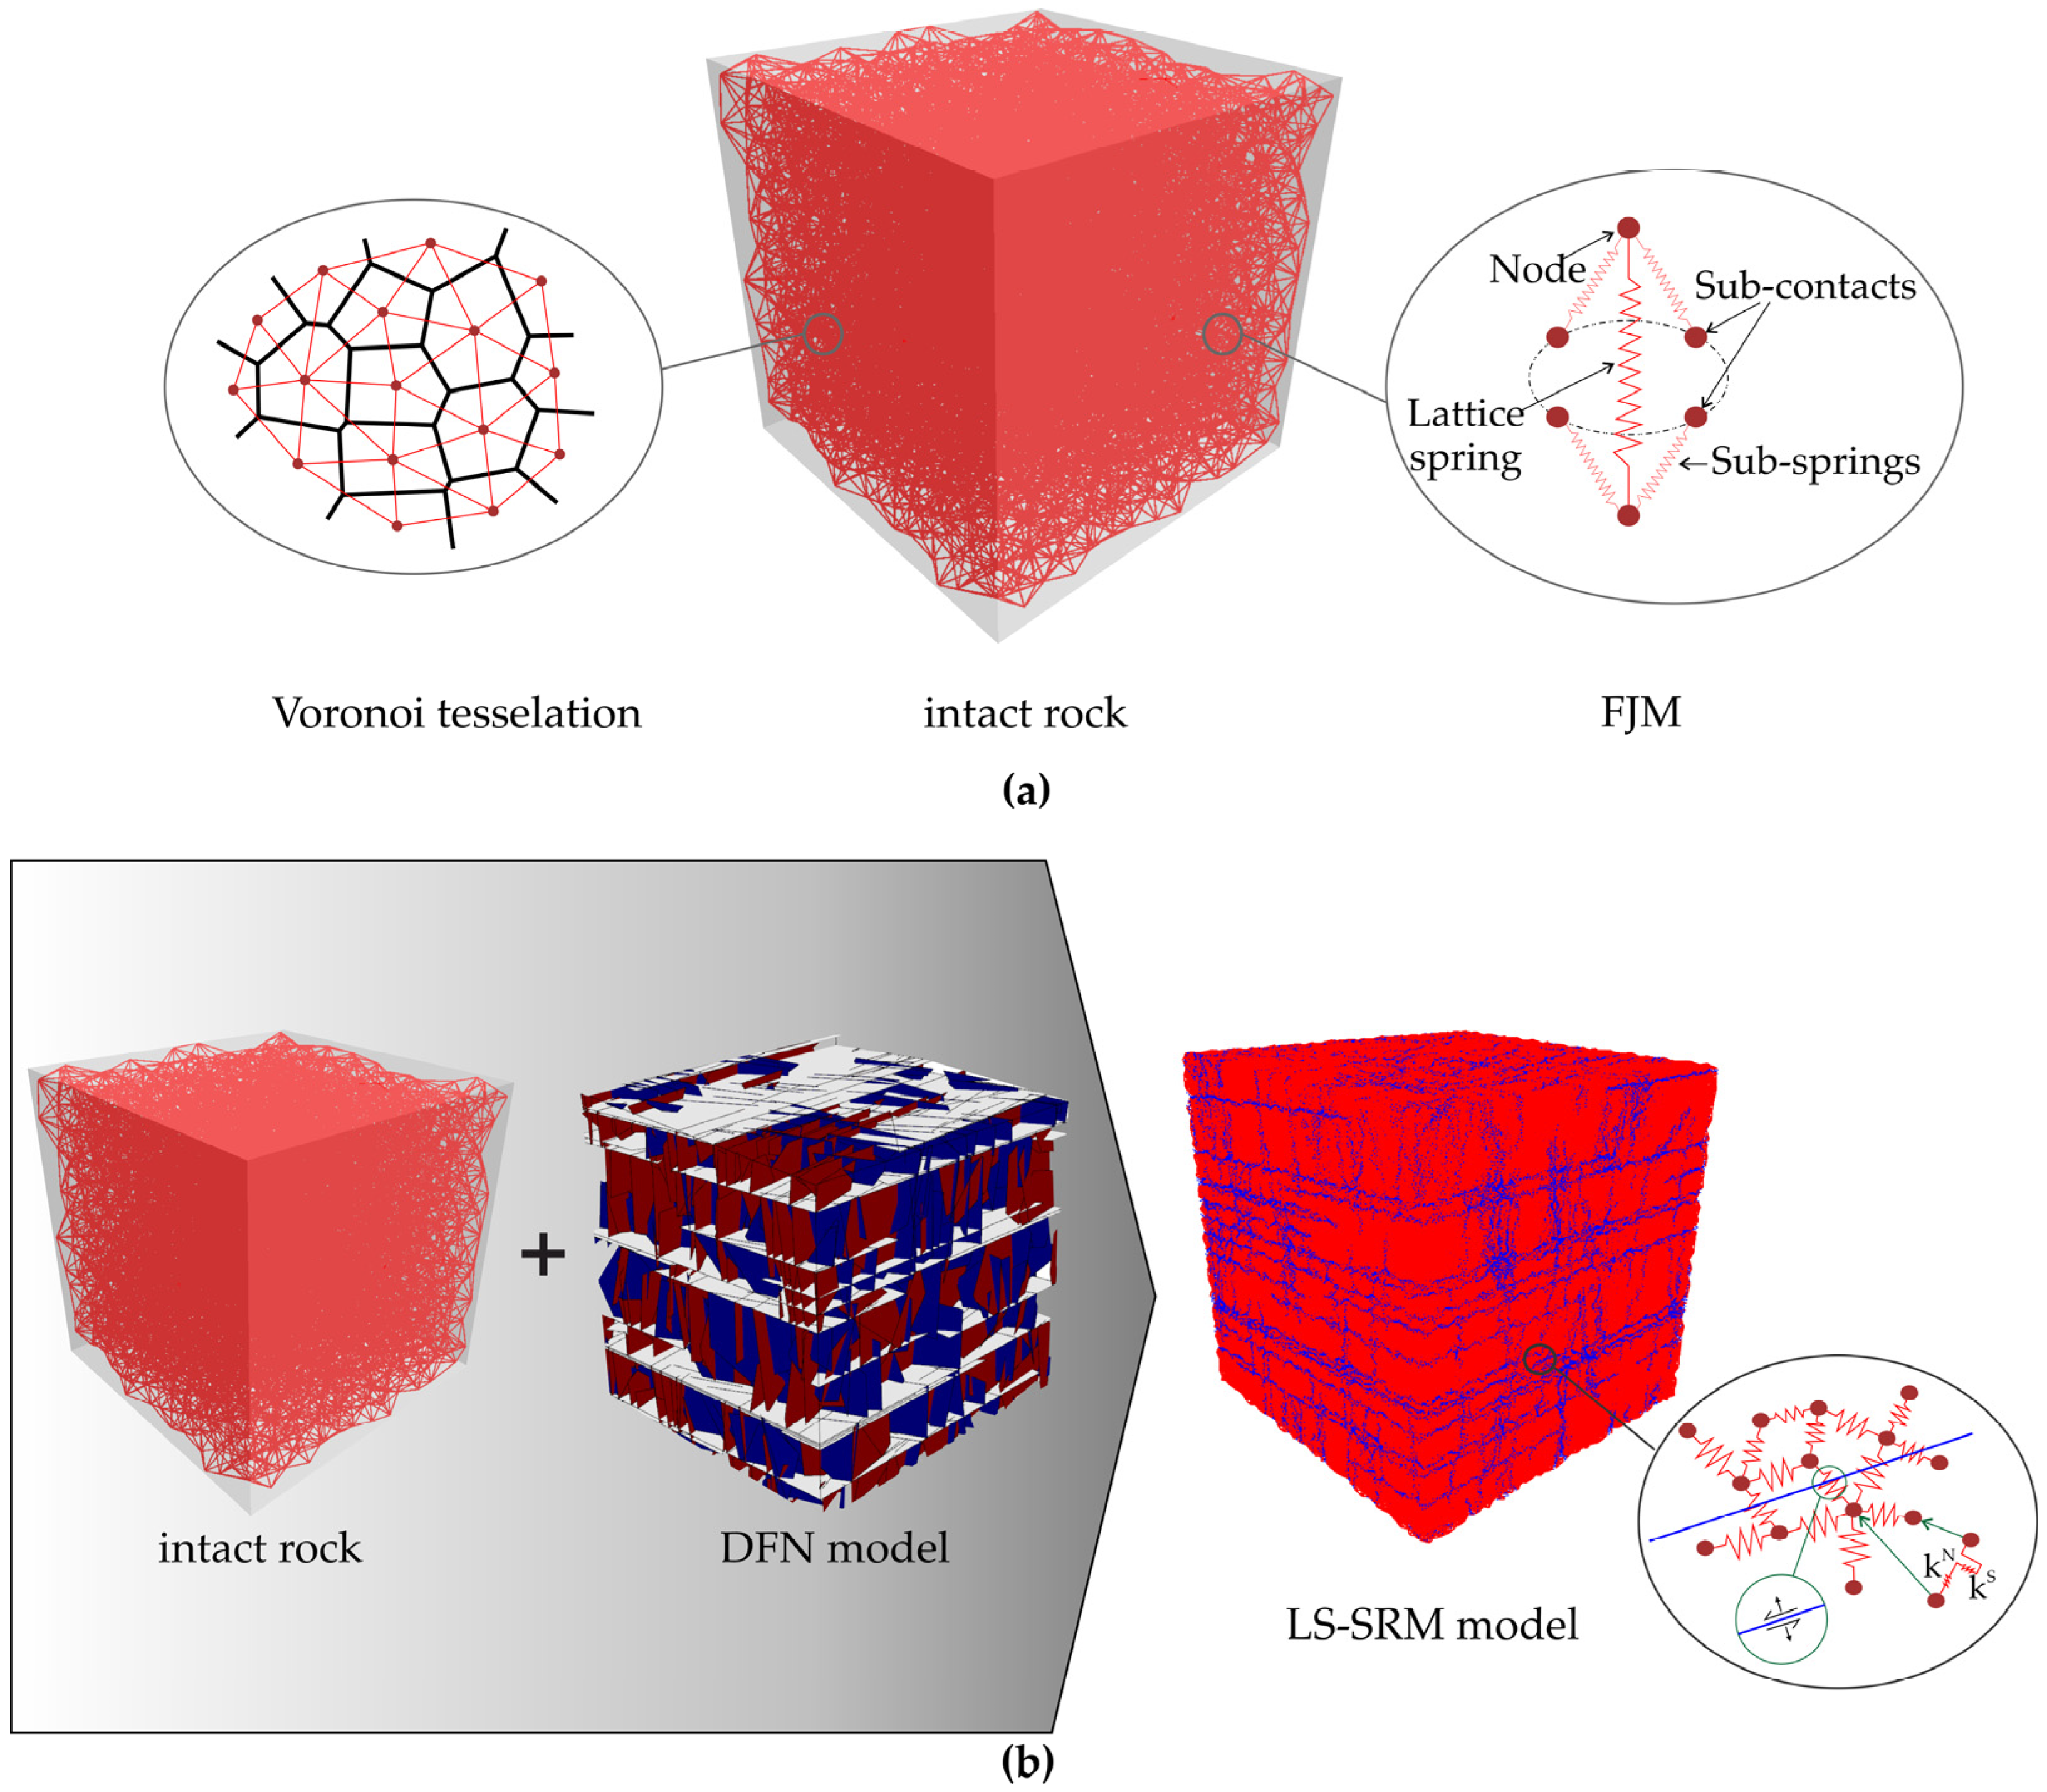
In this study, the LS-SRM approach is utilized as an alternative to the BPM and BBM approaches [43]. For the implementation of the numerical experiments, the software SRMLab from Itasca was chosen, offering some advantages regarding calibration of the model and computational efficiency in comparison to BPM models. Similar to other SRM approaches, the model consists of two components, the intact rock and pre-existing discontinuities. In contrast to BPM or BBM models, the LS-SRM approach considers the intact rock as a random assembly of point mass particles (nodes) interconnected by massless springs in three-dimensional space (Figure 1). Each node is connected by two springs, one representing the normal contact stiffness and the second the shear contact stiffness [43]. The force changes in the springs are calculated by utilizing the relative displacements of the nodes, and the displacement of a lattice node is calculated using Newton’s second law of motion and a linear force–displacement relationship for the springs [43]. Once the applied force exceeds the calibrated spring strength in tension or in shear, the spring breaks and a microcrack develops, which can later coalesce with further cracks, leading to the formation of macroscopic failure planes. This enables the analysis of intact rock fracturing as well as the possibility to investigate the failure behavior of a fractured rock mass [16,21]. For further information regarding the mechanical formulation of the LS-SRM models, the reader is referred to the work of [17,24,43].

Figure 1.
General buildup using the LS-SRM modeling approach. (a) Rock mass model utilizing the lattice-spring-based approach using Voronoi tessellation in combination with the flat joint model (FJM); (b) LS-SRM model showing the coupling of the lattice-spring-based model with the DFN model. Joint springs created by the DFN model are shown in blue.
Using the LS-SRM approach, it is possible to capture the failure behavior of jointed rock masses, including intact rock fracturing as well as opening and sliding along pre-existing fractures [24]. Using SRMLab, it is also possible to incorporate non-planar discontinuities, representing more realistic fracture geometries [17]. Discontinuities in the LS-SRM model are realized as parallel bond contacts or by using the flat joint contact model (FJM), similar to the SJM adopted in the BPM approach. In the FJM formulation, each spring splits into sub-springs, allowing resistance against rotation by means of normal forces in the sub-springs even after the springs are broken [17]. Force–displacement behaviors of a FJM intersection show a fully bonded state to a fully unbonded and frictional state after the contact is broken [41]. If a sub-contact breaks, the flat joint friction angle is activated, the residual flat joint friction angle is assigned to broken sub-contacts, and the peak flat joint friction angle is assigned to the unbroken sub-contacts. The resulting normal and shear forces are calculated according to the normal and shear displacements at the sub-contacts. Breakage, sliding or opening can result at any sub-contact if forces reach the limits of shear and tensile strength. While selecting the FJM, the ratio of KS/KN equals one, and the desired shear strength is assigned using a built-in relation between the assigned ratio of UCSrock and tensile strength ratio as well as a contact shear strength multiplier [17]. Using SRMLab, pre-existing discontinuities can be imported into the lattice structure either deterministically or as smooth joints of a DFN model generated by software packages, e.g., FracMan [44] and MoFrac [45] (Figure 1). When the intact model is merged with the DFN model, not only the geometrical properties of the fractures are transferred to the model. In addition, the previously assigned mechanical properties of the fractures, i.e., cohesion, friction angle, normal and shear stiffness and the aperture, are also transferred to the model. The spatial orientation of the lattice springs passing a potential fracture, generated by the DFN model, is the same as of the particular discontinuity causing these springs to be called jointed springs [43]. The mechanical behavior of the investigated jointed rock mass in the LS-SRM approach is thus characterized by the interaction of the resultant force and displacement of the joint springs and the intact lattice springs.
2.3. Rock Mass Classification Schemes
Various rock mass classification schemes have been proposed for engineering geology and geotechnical applications. These include, among others, the Rock Mass Rating (RMR) [6], the Geological Strength Index (GSI) [7] and the Q-system [8]. The RMR comprises six main indicators: Uniaxial Compressive Strength (UCS) of the intact rock, RQD [46], discontinuity spacing, discontinuity condition, groundwater condition and discontinuity orientation, leading to a rating scheme ranging between 0 (very poor rock) and 100 (very good rock) [47]. Using the GSI, characterization of the rock mass is obtained by an assessment of rock masses in terms of blockiness and surface condition of the discontinuities, represented by joint roughness as well as alteration. It can be determined either descriptively using the GSI chart or empirically [48]. The Q-System represents a quantitative classification scheme using the size of the intact rock blocks, shear strength of discontinuities and the stress conditions [49]. For each classification scheme, several empirical relationships have been published in order to convert the corresponding value to a rock mass deformation modulus or rock mass strength.
3. Materials and Methods
3.1. Workflow
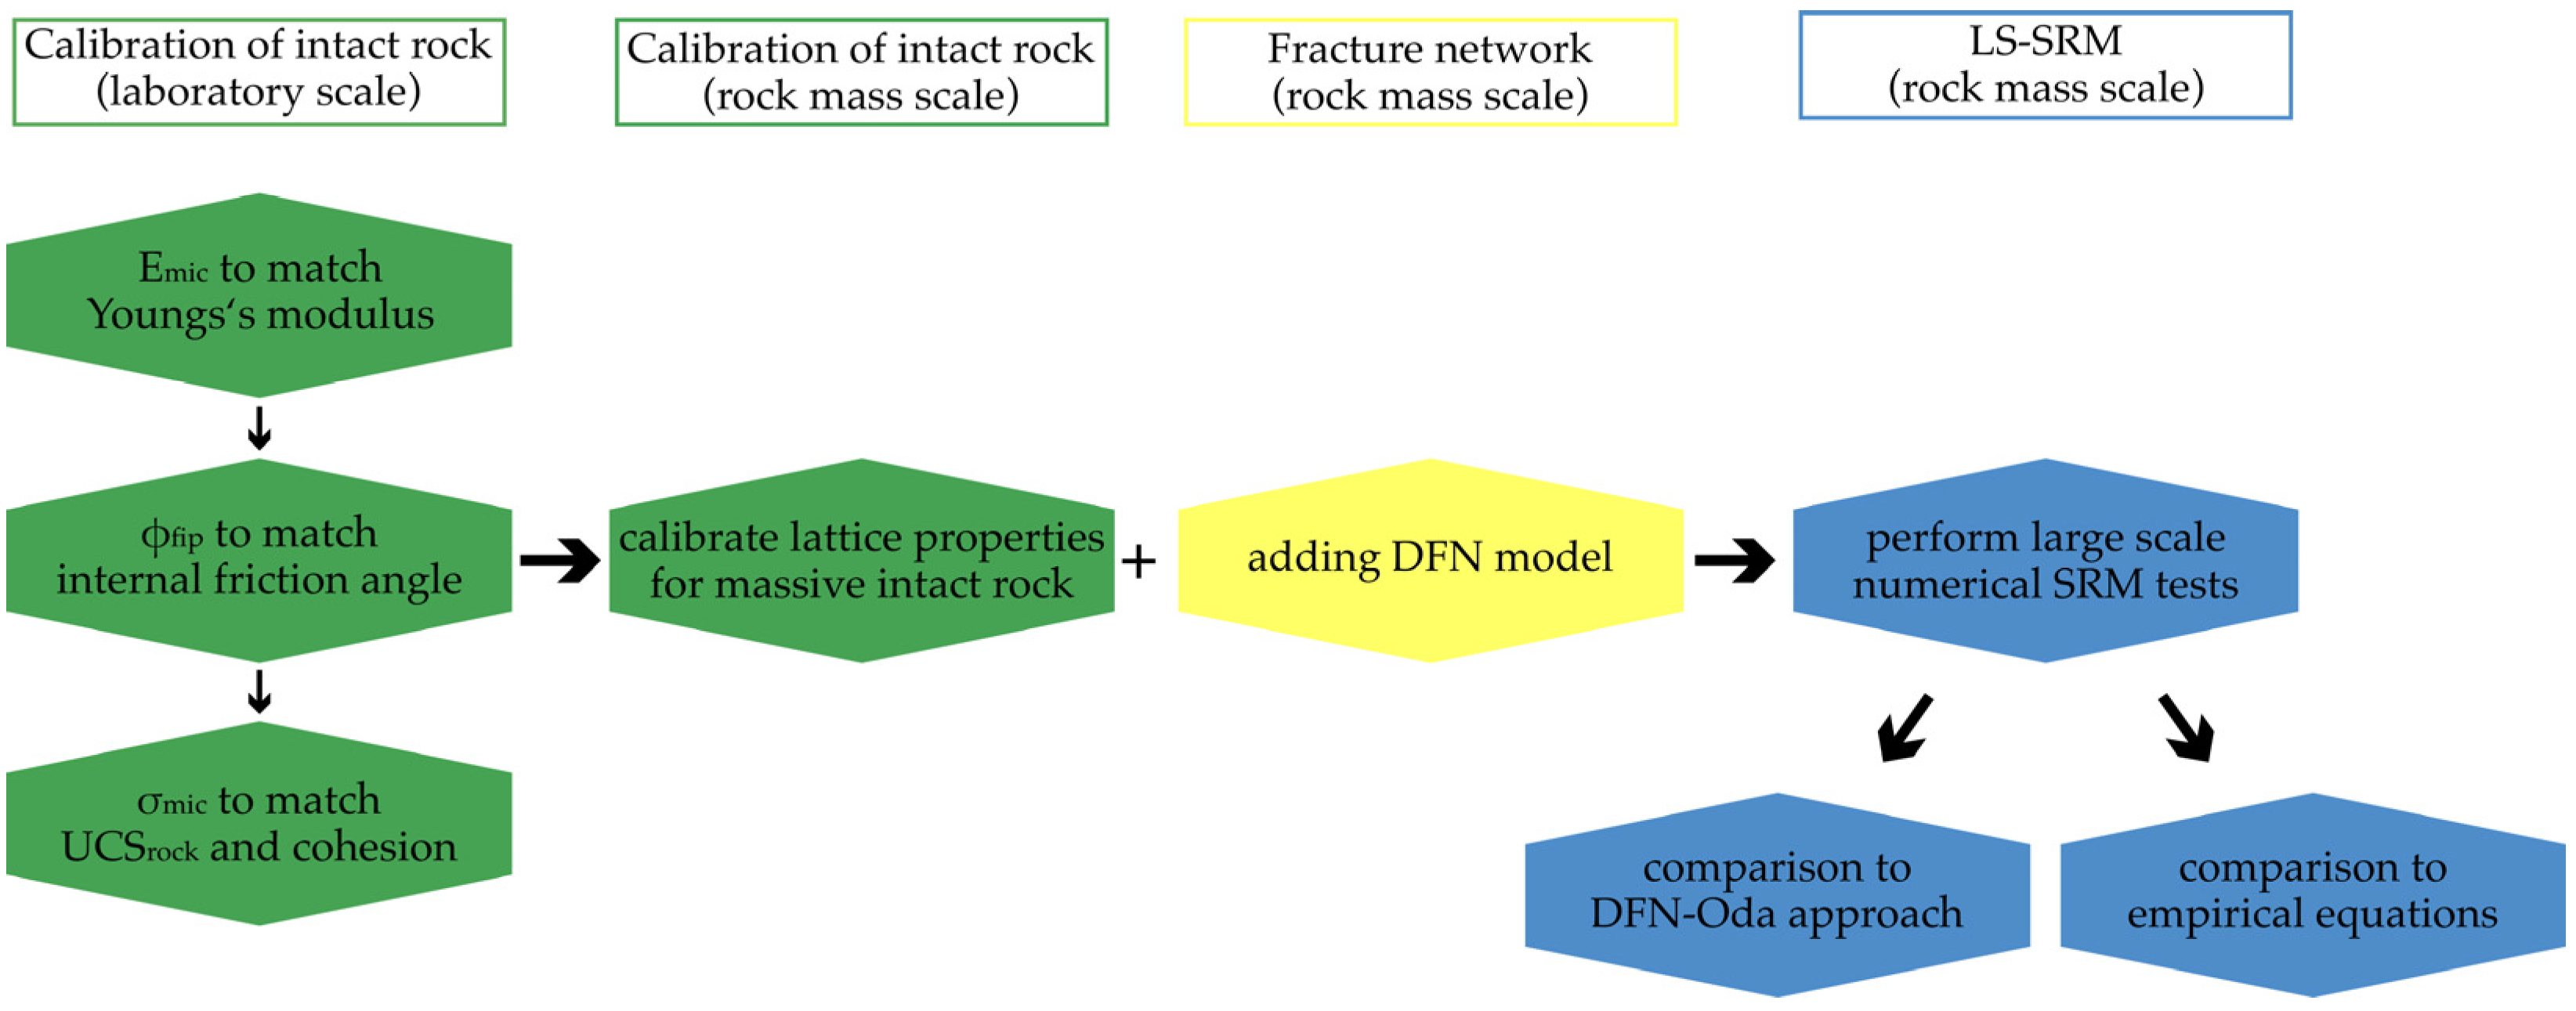
A flowchart describing the various steps to determine rock mass properties based on a LS-SRM approach, including a feasible validation of the results obtained, is shown in Figure 2.
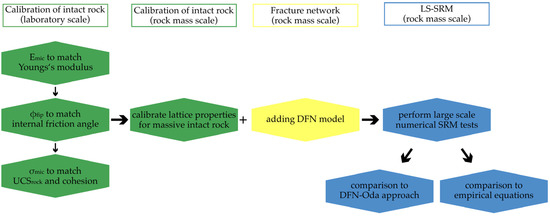
Figure 2.
General workflow for determining fractured rock mass properties using the LS-SRM approach and comparing them with the DFN-Oda-Geomechanics approach and empirical equations based on rock mass classification schemes.
In order to investigate the influence of fracture networks on the rock mass using the LS-SRM approach, it is necessary to calibrate the intact rock in a first step to ensure that the mechanical characteristics of the later models are indeed representative. Initially, a model is created having the same dimensions as the cores tested in the laboratory to determine the input parameters to match the target values, i.e., the lab test results. First, the input parameter Emic is calibrated to match the measured Young’s modulus from the laboratory. Next, ϕfjp is calibrated to fit to the measured internal friction angle. As a last step of the intact rock calibration stage, the input parameter σmic is adjusted to match the UCSrock and the cohesion. Subsequently, larger models representing the rock mass are created, calibrated and combined with the DFN models having dimensions of the project domain, in our case study 50 m × 50 m × 50 m (width × length × height). Using these large-scale models, numerical tests are performed to investigate the impact of the fracture network on the rock mass using the LS-SRM approach. Once the results from the large-scale rock mass models are obtained, a comparison with predictions generated by the DFN-Oda-Geomechanics and empirical approaches is carried out.
3.1.1. Case Study
The quarry providing the input parameters for the numerical modeling is located in Remlingen, southern Germany, near the city of Würzburg (latitude 49.790297°, longitude 9.674520°) (Figure 3). It is stratigraphically associated with the Lower Triassic (Upper Bunter; 244–243 Ma), showing massive sandstone beds separated by weaker horizontal layers that are composed of clay/siltstone deposits up to three cm thick. The outcrop exhibits an orthogonal fracture network characterized by two vertical discontinuity sets (R1 and R2) and one horizontal discontinuity set (R3), i.e., the weaker layer composed of claystone/siltstone, along with an otherwise homogeneous structure [50]. The geometrical characteristics of the predominant fracture network utilized to develop the DFN model (Figure 4) are shown in Table 1. The mechanical properties of the intact rock and the discontinuities are presented in Table 2.
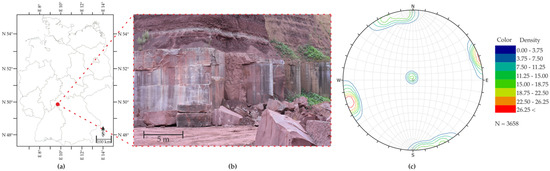
Figure 3.
(a) Location of the Remlingen quarry in southern Germany; (b) Part of the Remlingen sandstone quarry used for the geometrical fracture network analysis and rock mechanical testing; (c) Stereonet (lower hemisphere plot) showing the fracture network orientation of the Remlingen sandstone [50].
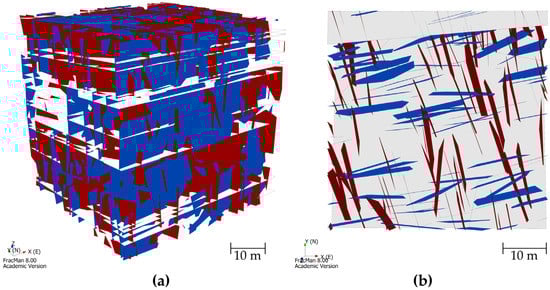
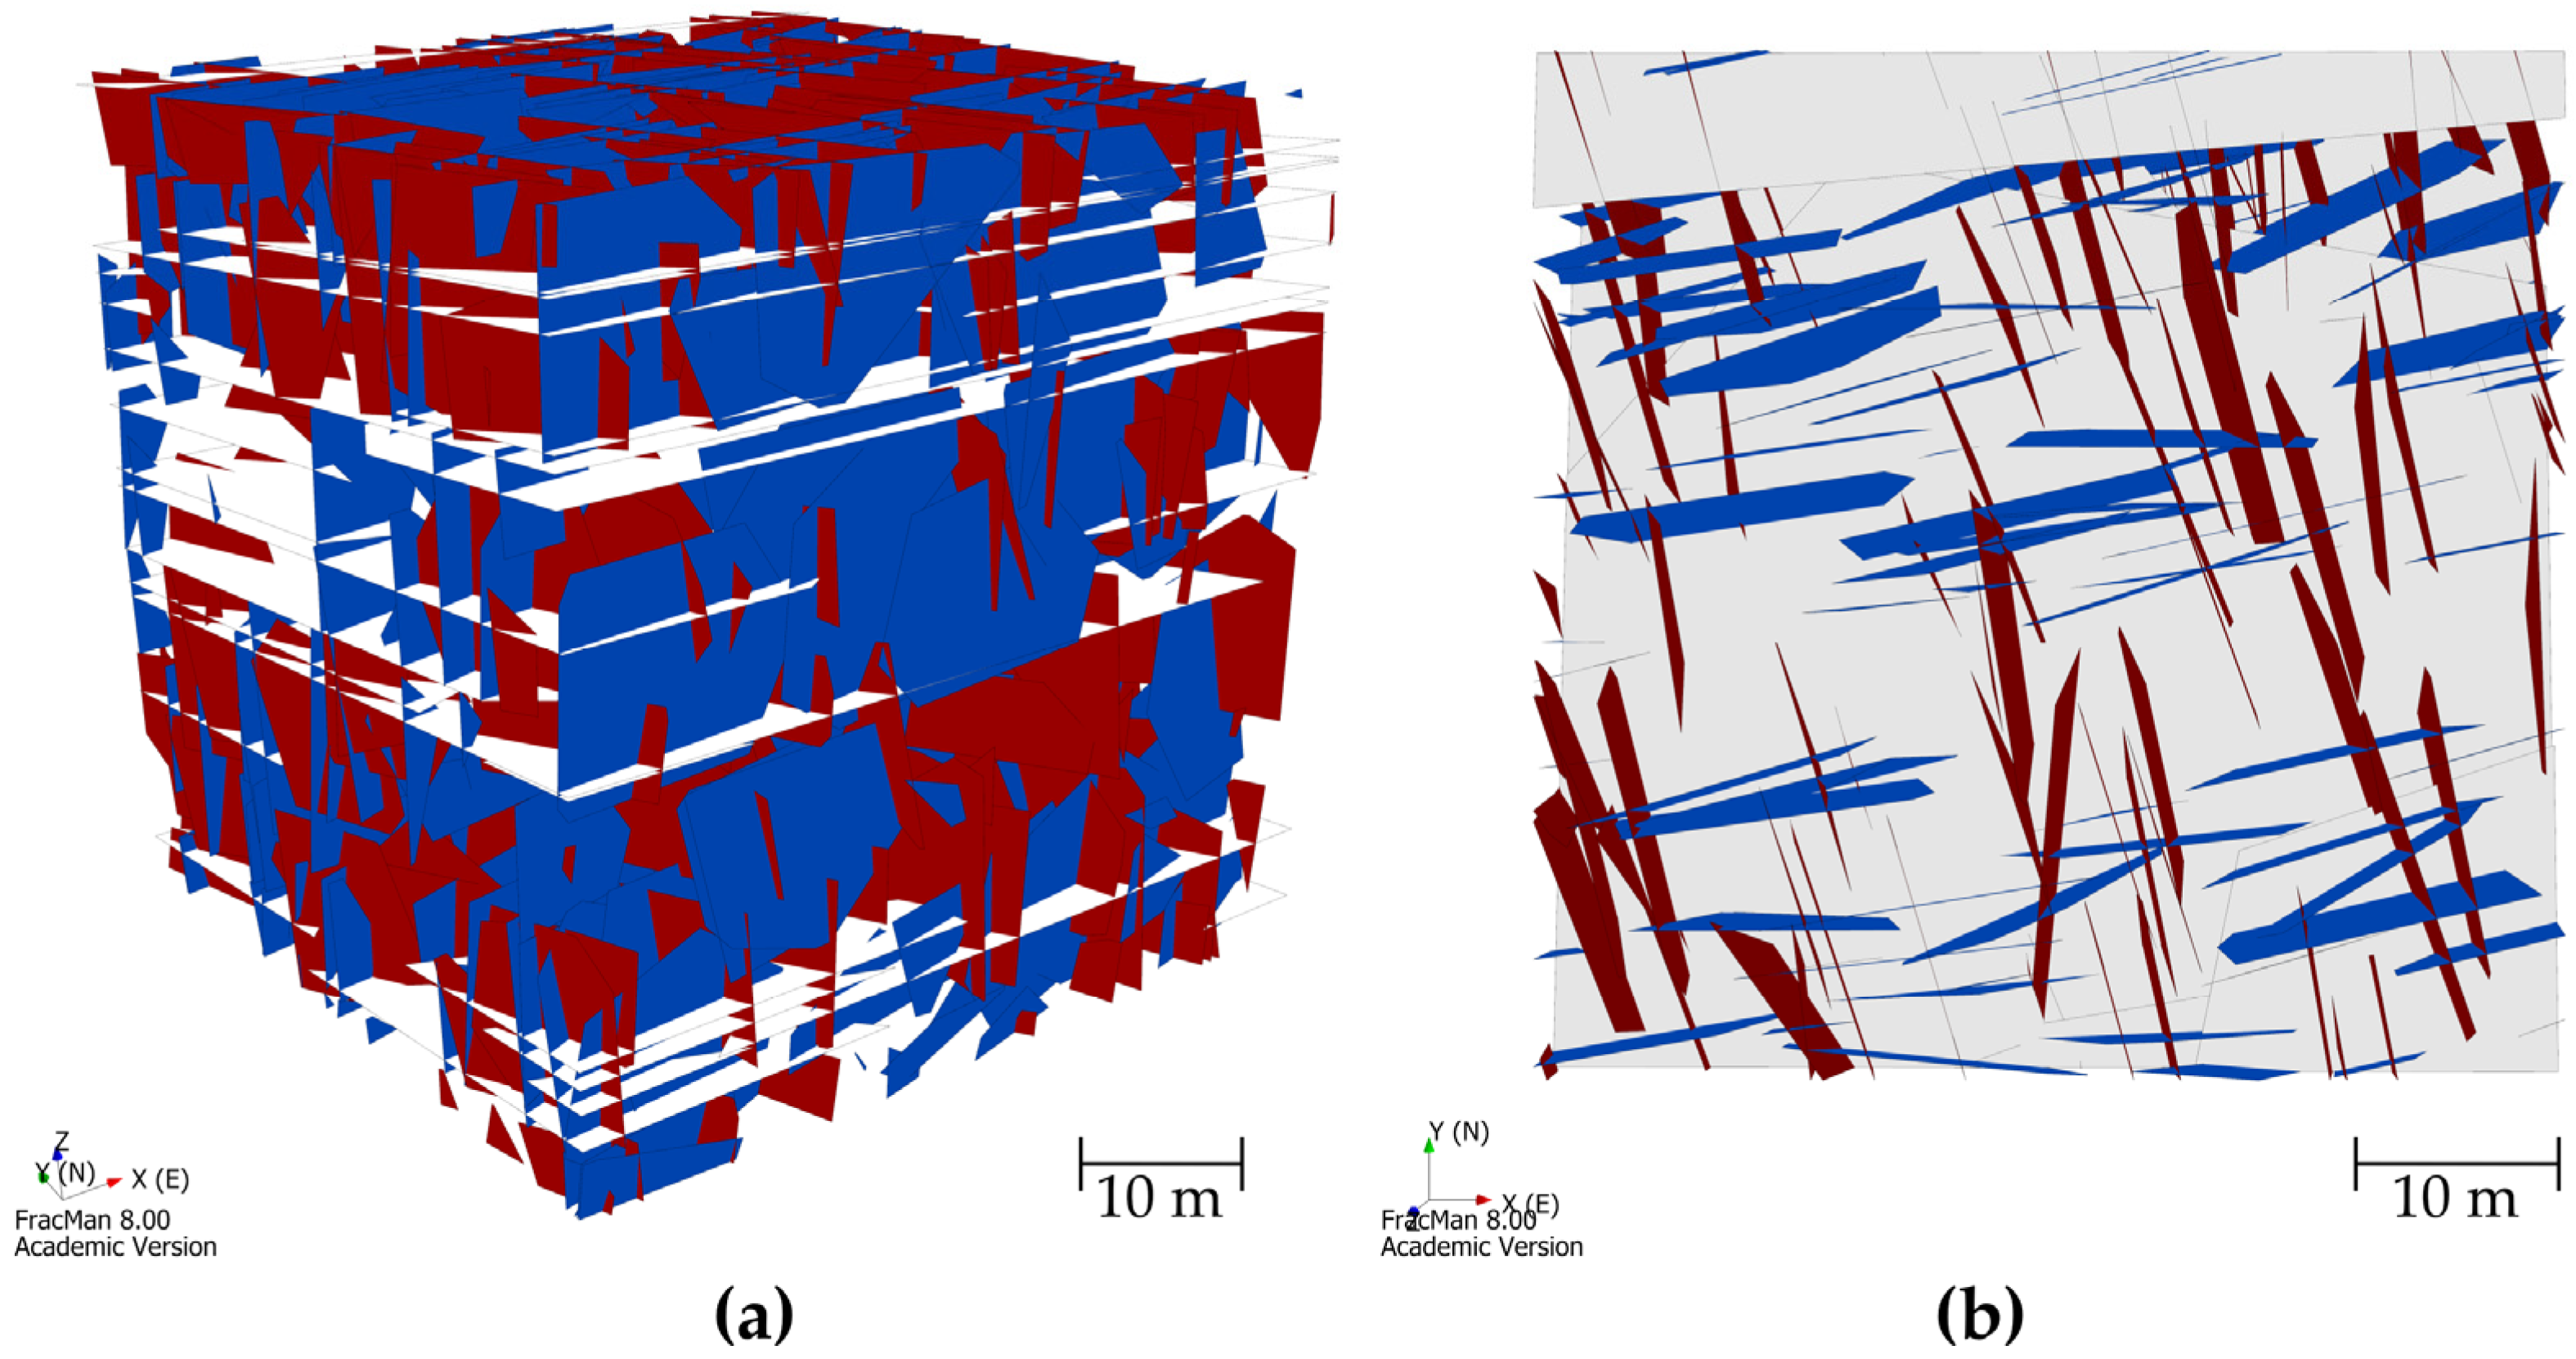
Figure 4.
(a) Stochastic DFN model of Remlingen, including two horizontal discontinuity sets and one vertical discontinuity set; (b) Top view of the DFN model. The edge length of the DFN cube is 50 m, similar to the dimensions of the project domain.

Table 1.
Geometrical properties of the fracture sets from the Remlingen quarry (R1–3) [50]. P10 and P32 represent the number of fractures per unit length and the area of fractures per unit volume, respectively.
Table 2.
Rock mechanical parameters for the Remlingen quarry, including mean and standard deviation [50].
For the softer horizontal discontinuity set (R3), i.e., the weaker layer of clay/siltstone up to 3 cm thick, no laboratory measurements could be performed, since no samples could be taken. The mechanical parameters were adopted from [51]: a residual cohesion of 0.025 MPa, a residual friction angle of 25°, a shear stiffness of 0.015 MPa/mm and a normal stiffness of 1 MPa/mm are applied.
3.1.2. Intact Rock Calibration
The model of the intact rock used to validate the laboratory results is generated with dimensions of 0.055 m × 0.055 m × 0.01 m (width × length × height), thus having similar dimensions to the laboratory samples. Solely the shape of the models differs, as only rectangular models can be generated in SRMLab, whereas cylindrical cores were investigated in the laboratory. A resolution of 2.3 mm using a Voronoi tessellation is chosen in combination with the FJM, resulting in a sample containing 38,000 lattice nodes connected by 192,436 lattice springs and 25 lattices in the shortest dimension. Triaxial tests using various confining pressures are performed to determine the desired input parameter. First, the UCSrock and Young’s modulus are calibrated at zero confining pressure, followed by multiple runs at increasing confining pressures to calibrate the friction angle and cohesion. The vertical and lateral confining pressures are applied simultaneously during the triaxial tests. Measurement points are attached to the synthetic rock to monitor the vertically applied force, vertical and lateral displacements and the number of cracks to evaluate the strength and deformation properties. The calibration of the intact sandstone is straightforward and consists of three main steps. In the first step, the lattice Young’s modulus (Emic) is evaluated to match the intact Young’s modulus. This is followed by adjusting the peak friction angle of the flat joint (ϕfjp) to obtain the desired angle of internal friction. The residual friction angle of flat joint contact (ϕfir) is set to zero. During the third and last step, the lattice compressive strength (σcmic) is adjusted to obtain the required UCSrock and cohesion. Simulations are carried out using the FJM at a constant loading rate of 0.01 m/s. The applied lattice input parameters are shown in Table 3.
Table 3.
Lattice input parameters for intact rock and rock mass calibration.
3.1.3. Rock Mass Calibration
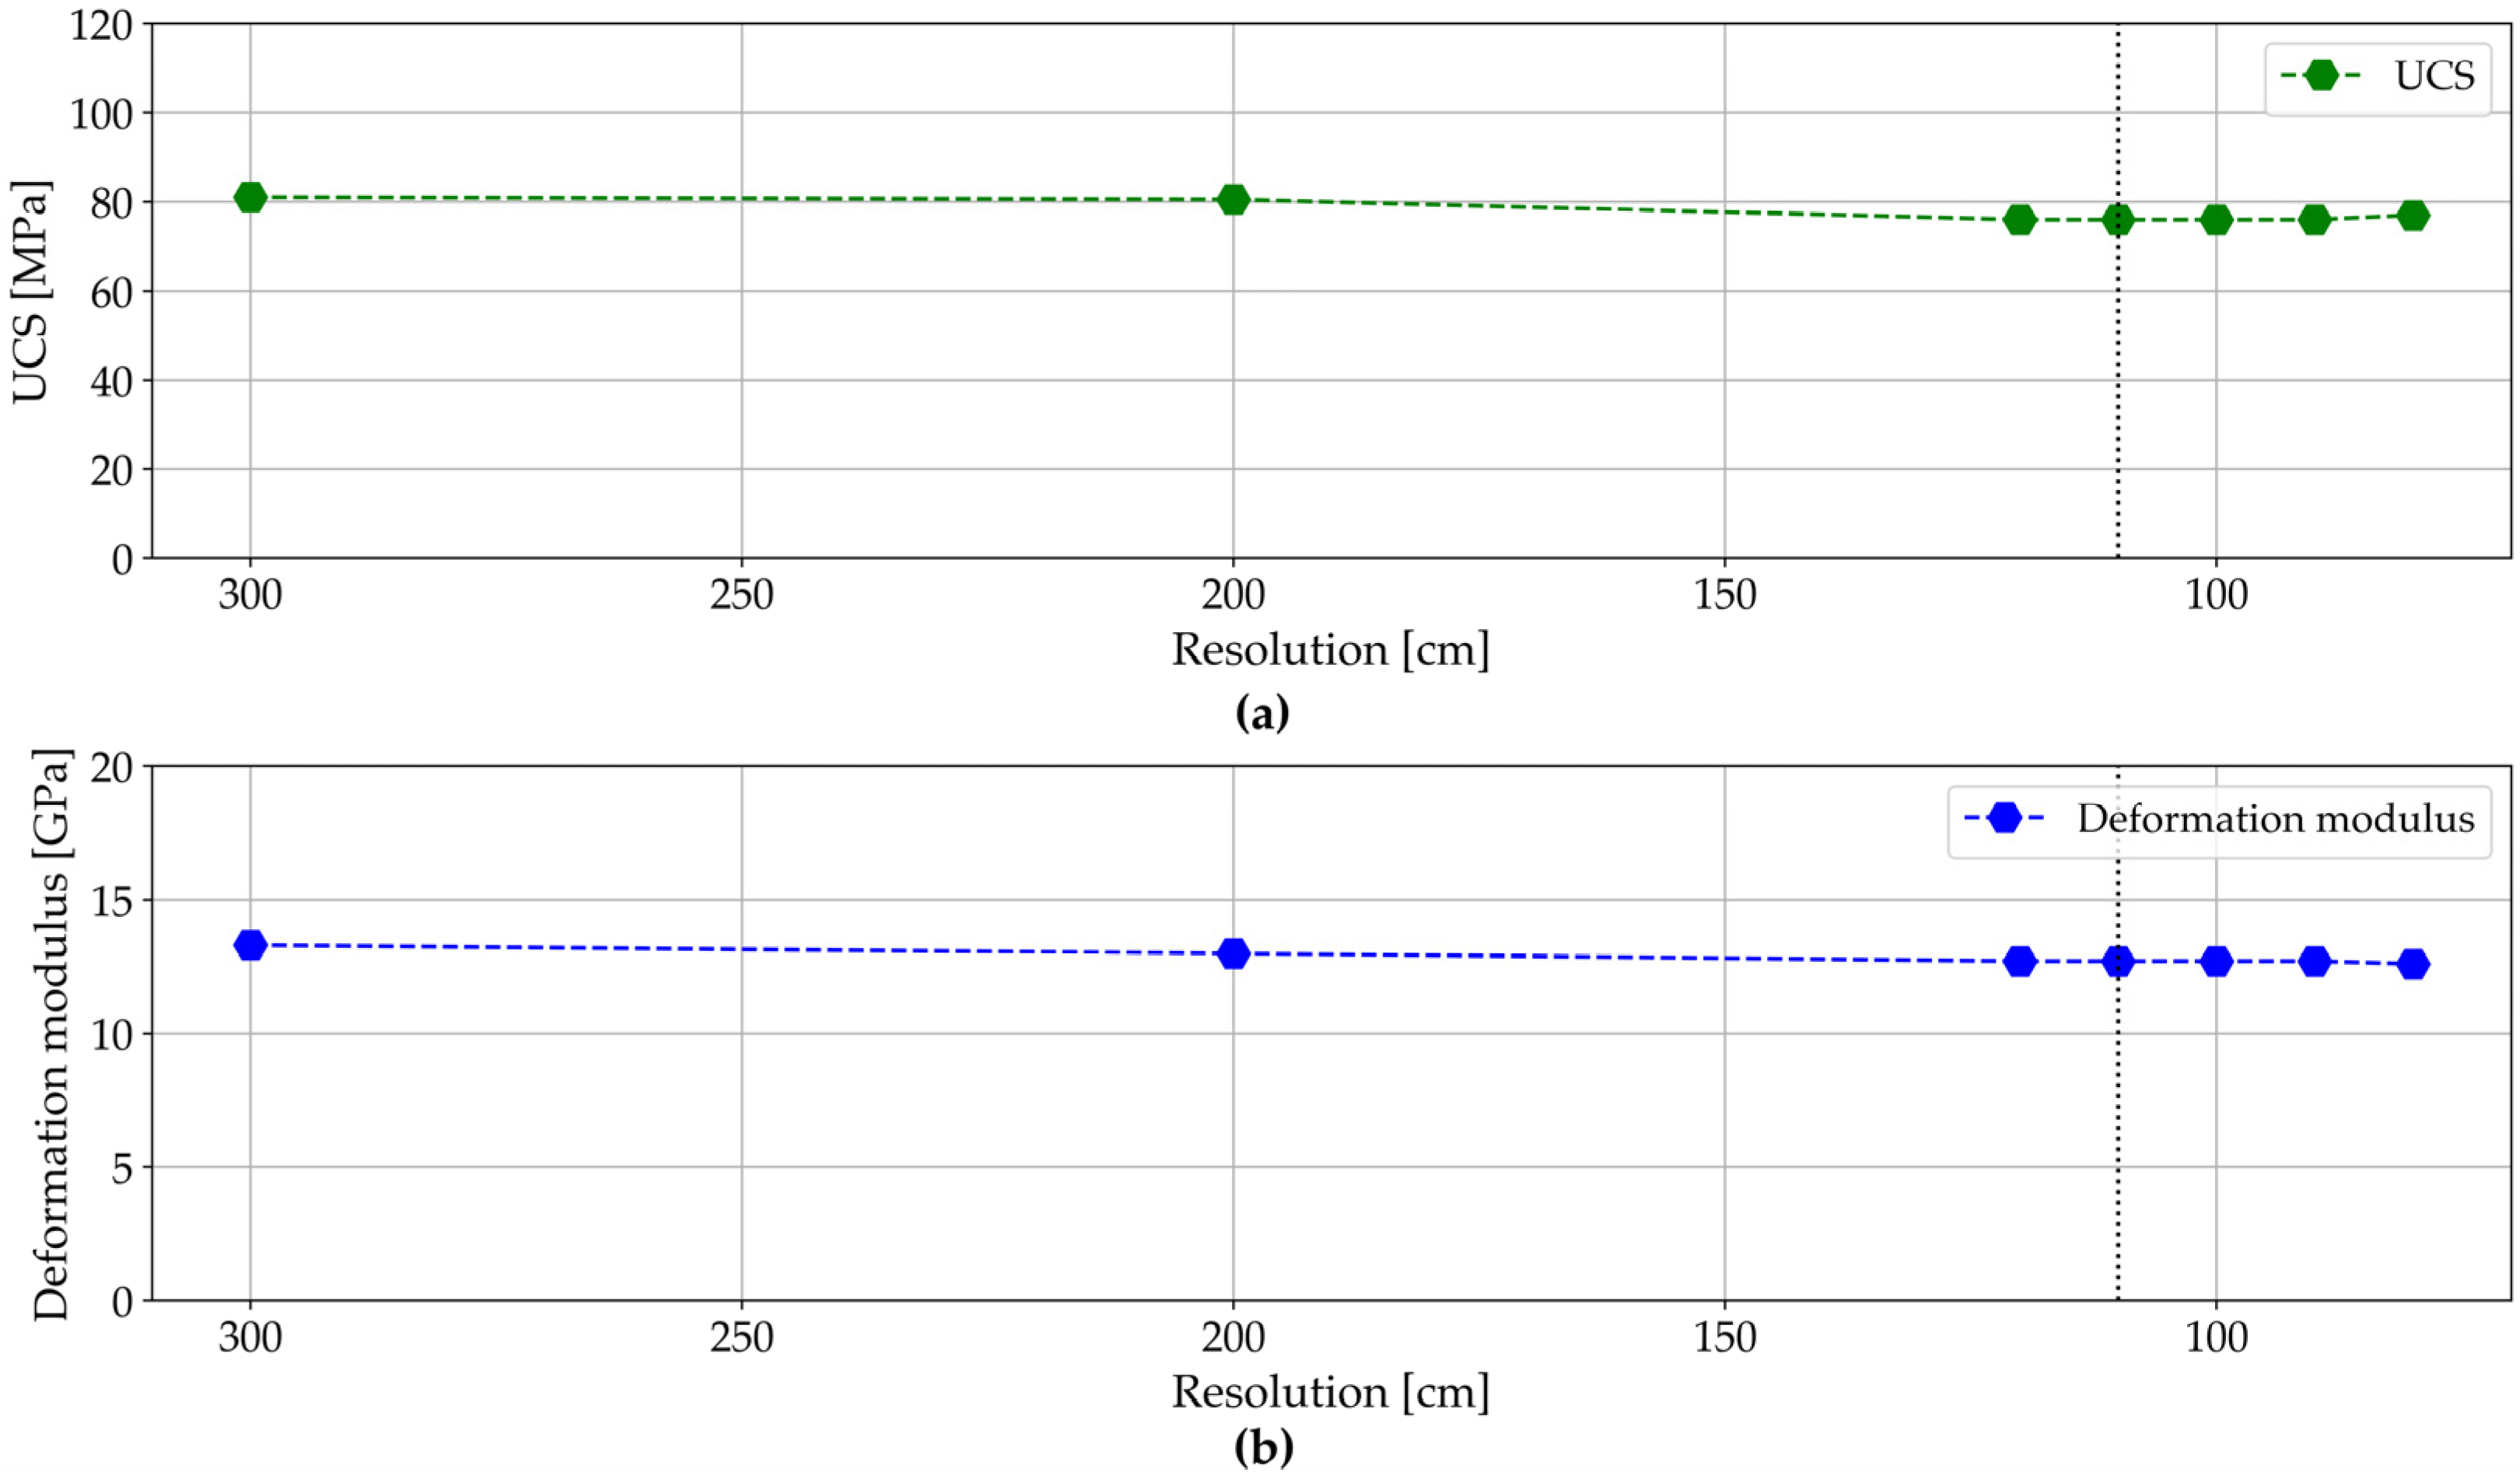
The dimensions of the synthetic rock mass model are selected as 50 m × 50 m × 50 m (width × length × height) to adequately compare it to the results obtained by [50]. Since the dimensions are significantly larger than those of the intact rock at laboratory scale, which potentially has an impact on the mechanical properties, calibration and adjustment of the input parameters for the rock mass scale are required prior to the consideration of fractures. According to [52], the value of the peak in situ strength (UCSmass) of a massive intact rock is about 80% of the UCSrock of the laboratory scale samples. Therefore, the calibration targets for σcmic are set to 80% of the laboratory UCSrock value from Table 2. Since the UCS and the cohesion are controlled by the lattice compressive strength (σcmic) during calibration, the target value of cohesion is also set to 80% of the value measured in the laboratory. Due to computational limitations, the synthetic rock mass model cannot have the same lattice resolution as the laboratory scale model, and therefore, the lattice resolution has to be upscaled as well. Again, a Voronoi-shaped lattice is used, since sensitivity analyses have shown that there is no significant scale effect on the UCSmass and the deformation modulus for massive intact and fractured rocks using a lattice resolution of at least 110 cm (Figure 5). Therefore, a lattice resolution of 110 cm is adopted using the FJM. After the calibration is successfully completed, the intact rock mass model is combined with the DFN model, which was generated based on the geometrical characteristics presented in Table 1. As described in Section 3.1.1, the DFN model, which is merged with the calibrated synthetic rock mass model, contains two vertical discontinuities orientated orthogonal to each other and one weaker horizontal discontinuity. The DFN model has the same dimensions as the SRM model, i.e., 50 m × 50 m × 50 m. The DFN model is generated using the software FracMan 8.0 [44]. Once the SRM and the DFN model are combined, unconfined pressure experiments are performed to obtain the UCSmass and the deformation modulus of the fractured rock mass, respectively. Initially, three experiments are conducted using the same fracture properties considered as most likely according to Table 1 and Table 2 to investigate the potential computed range within the software using the same input parameters. Subsequently, a sensitivity analysis regarding poorly constrained input parameters is carried out, which results in 10 additional models (Table 4). The various model scenarios investigate the impact of fracture intensity, fracture size and fracture stiffness on the rock mass properties derived from the LS-SRM approach. The findings obtained by this sensitivity analysis are then compared to predictions resulting from the DFN-Oda-Geomechanics approach as well as the empirical approaches. By means of this validation, it is possible to assess whether the mechanical properties of the DFN model need to be recalibrated and adjusted in order to match the results and to achieve representative outcomes.
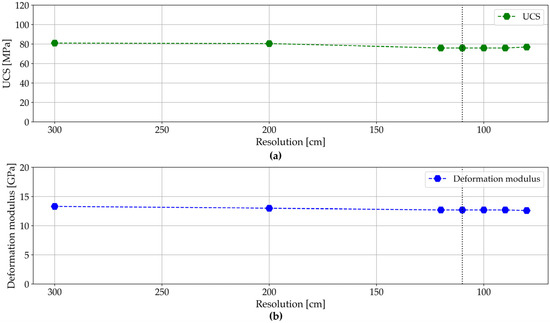
Figure 5.
Sensitivity analysis for (a) the rock mass strength and (b) the deformation modulus depending on the lattice resolution for the Remlingen sandstone. The dotted black line marks the adopted lattice resolution of 110 cm.
Table 4.
Input parameters of the sensitivity analysis for the DFN properties of the LS-SRM rock mass models. Colored boxes indicate which fracture parameter was changed.
4. Results
4.1. Intact Rock Callibration at Laboratory Scale
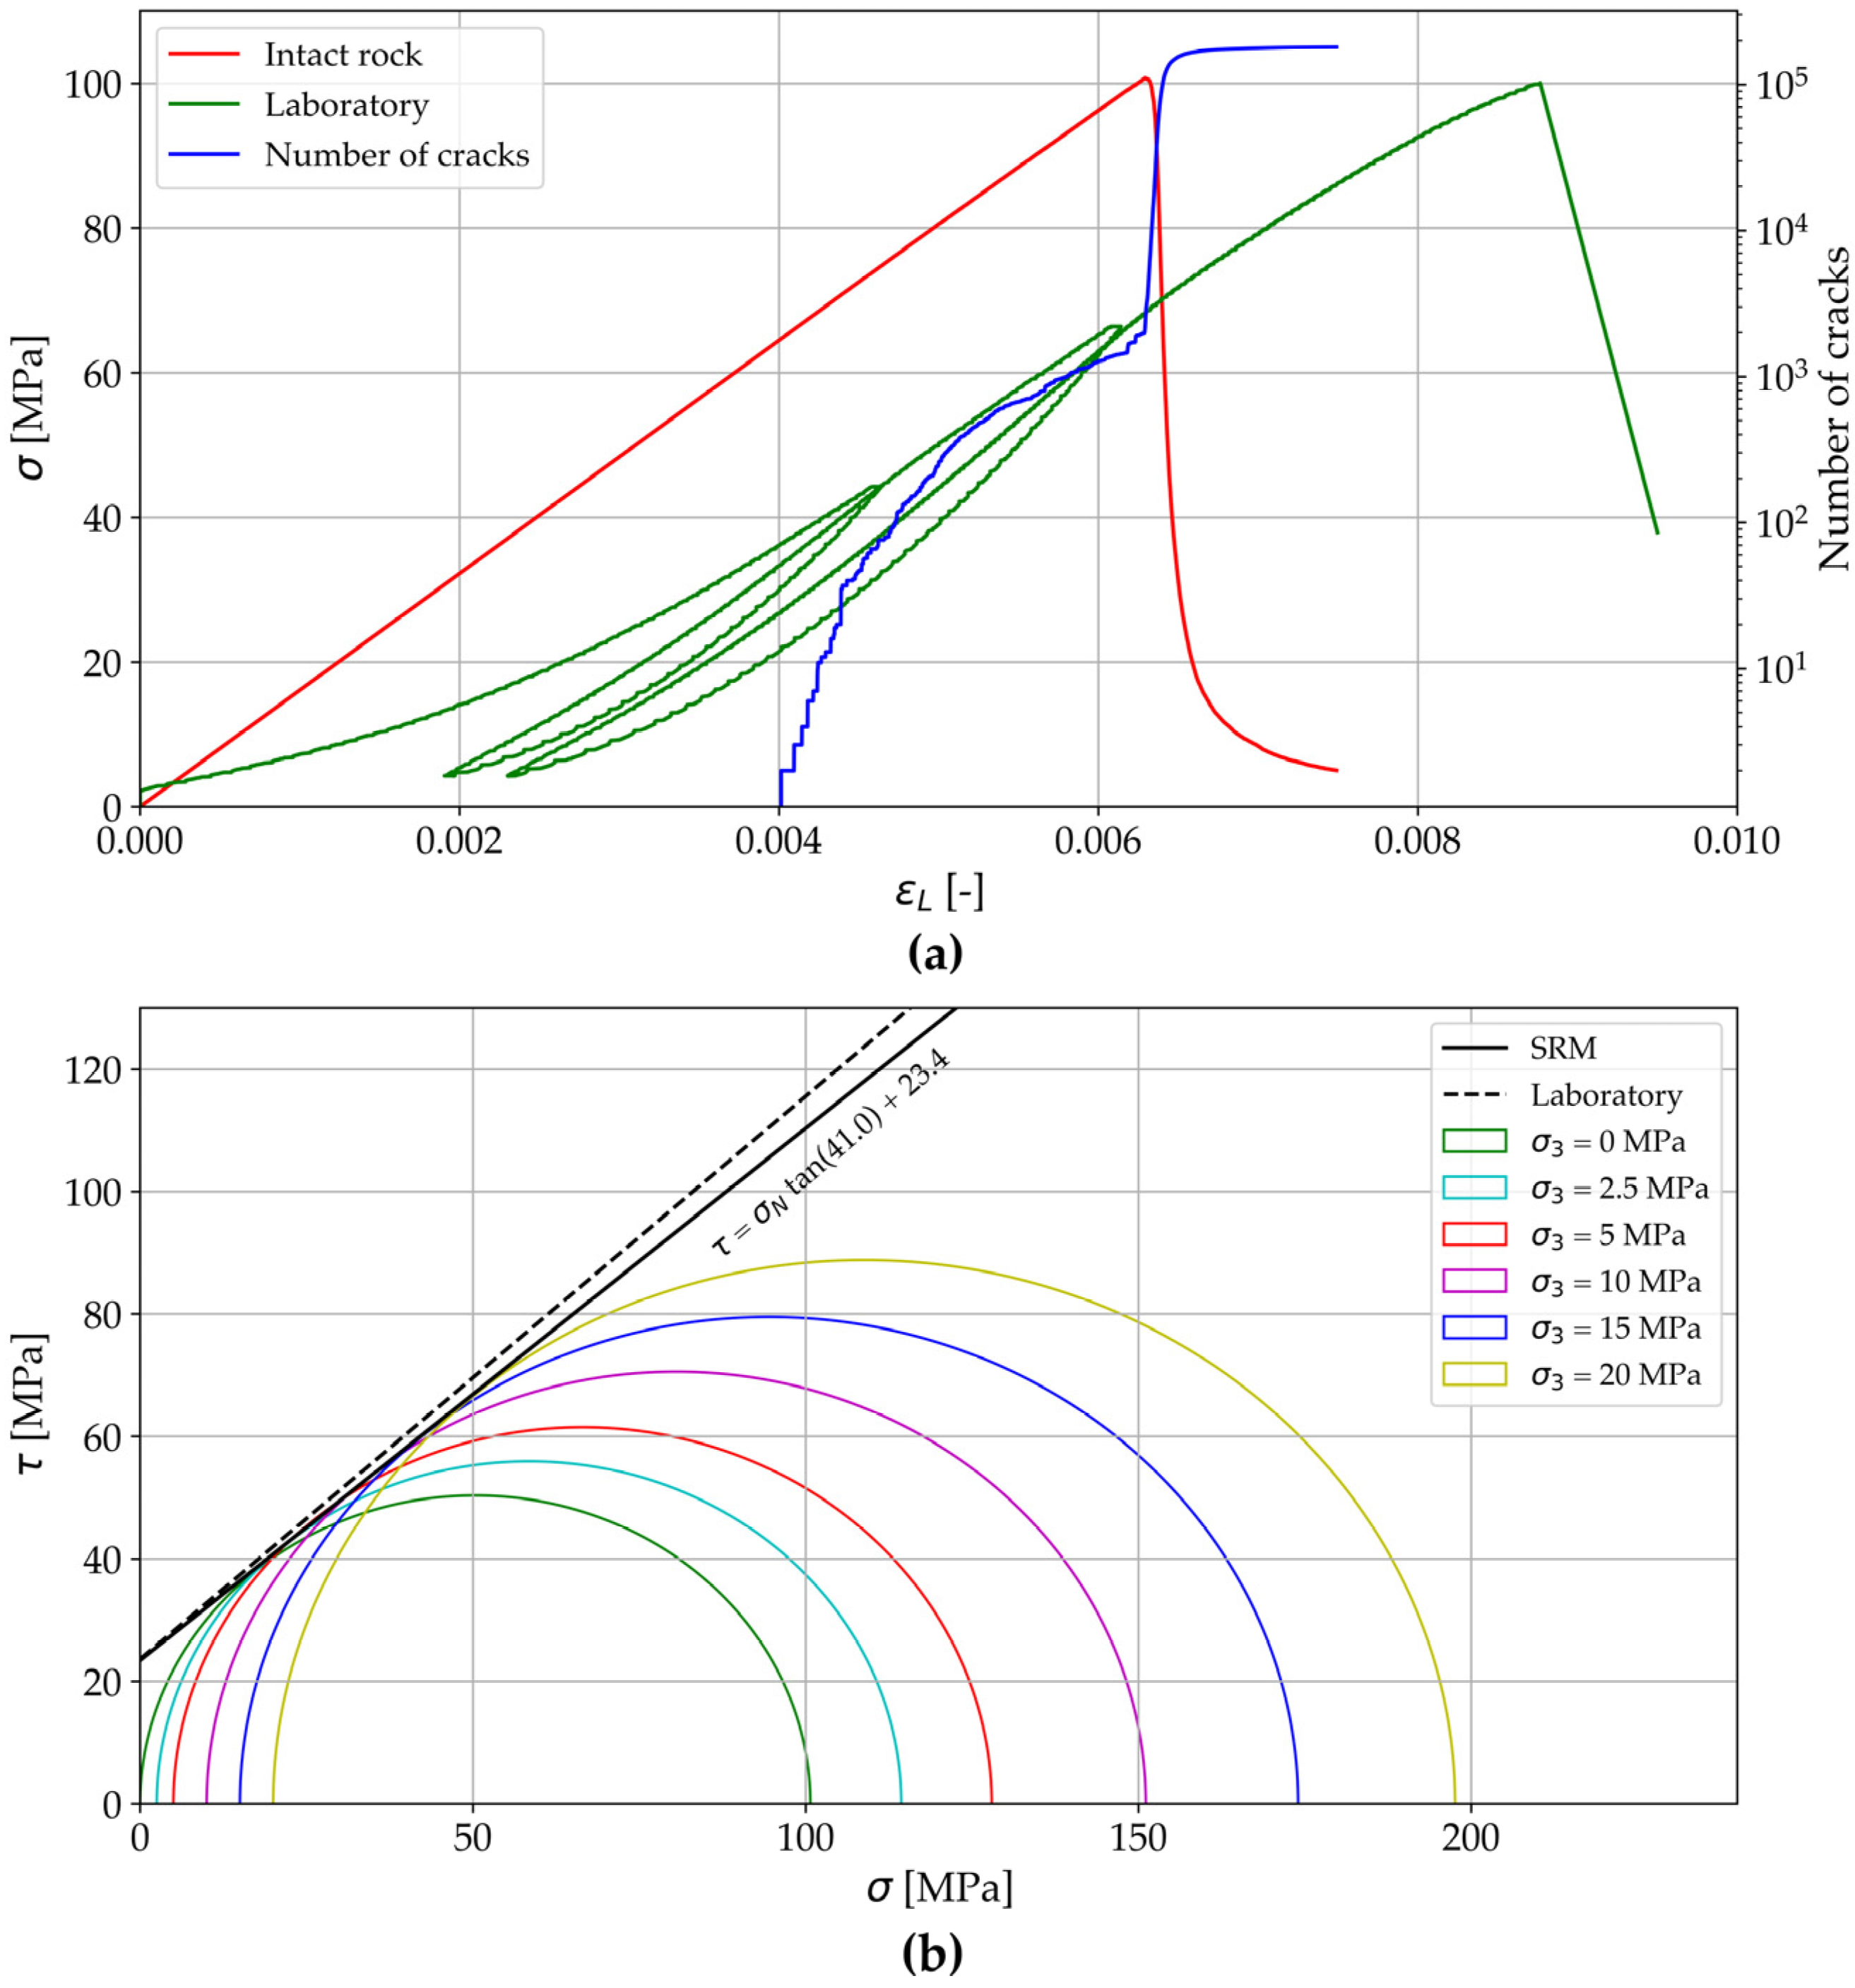
Calibration of intact rock on laboratory scale yields a good agreement with the results obtained by rock mechanical testing as presented in Table 5. In order to determine the UCSrock and Young’s modulus, unconfined compression tests were performed using the input parameters presented in Table 2. As shown in Figure 6, the numerical unconfined compression experiments yield an UCSrock value of 100 MPa and a Young’s modulus of 16 GPa. The stress–strain curves for the intact sandstone in the laboratory test, based on the work of [50], and the numerical model do not coincide due to the initial elastoplastic stage caused by the initial crack closure in the laboratory specimens, which is not accounted for in the SRM models.
Table 5.
Results of the intact rock calibration.
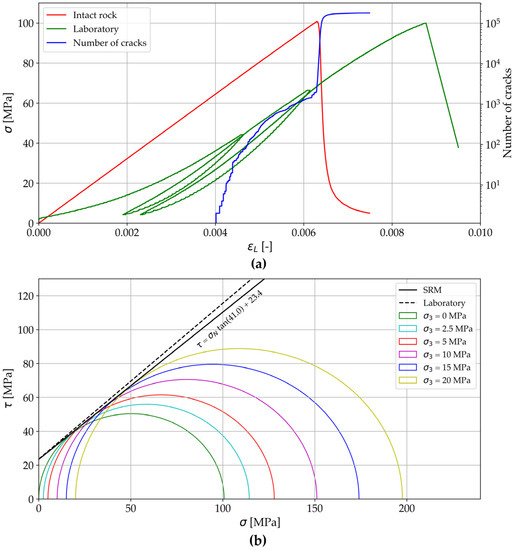
Figure 6.
Results of the intact rock models on laboratory scale. (a) Stress–strain curve for the intact rock measured in the laboratory and the SRM model, including the evolution in the number of cracks; (b) Results of triaxial experiments at various confining pressures.
However, the maximum stress level (=UCSrock) as well as the slope in the elastic part of the curve (=Erock) are very similar. Since the FJM is used, the tensile strength remains unchanged at the input value at 6.5 MPa. In order to determine the cohesion and the angle of internal friction of the intact rock, several tests at increasing confining pressure were performed, as described in Section 3.1.2. The confining pressures applied ranged between 2.5 MPa and 20 MPa, resulting in a cohesion of 23.4 MPa and an angle of internal friction of 41° using the Mohr–Coulomb theory. Again, a good correlation is achieved compared to the results of the triaxial experiments carried out in the laboratory (Figure 6).
4.2. Upscaling
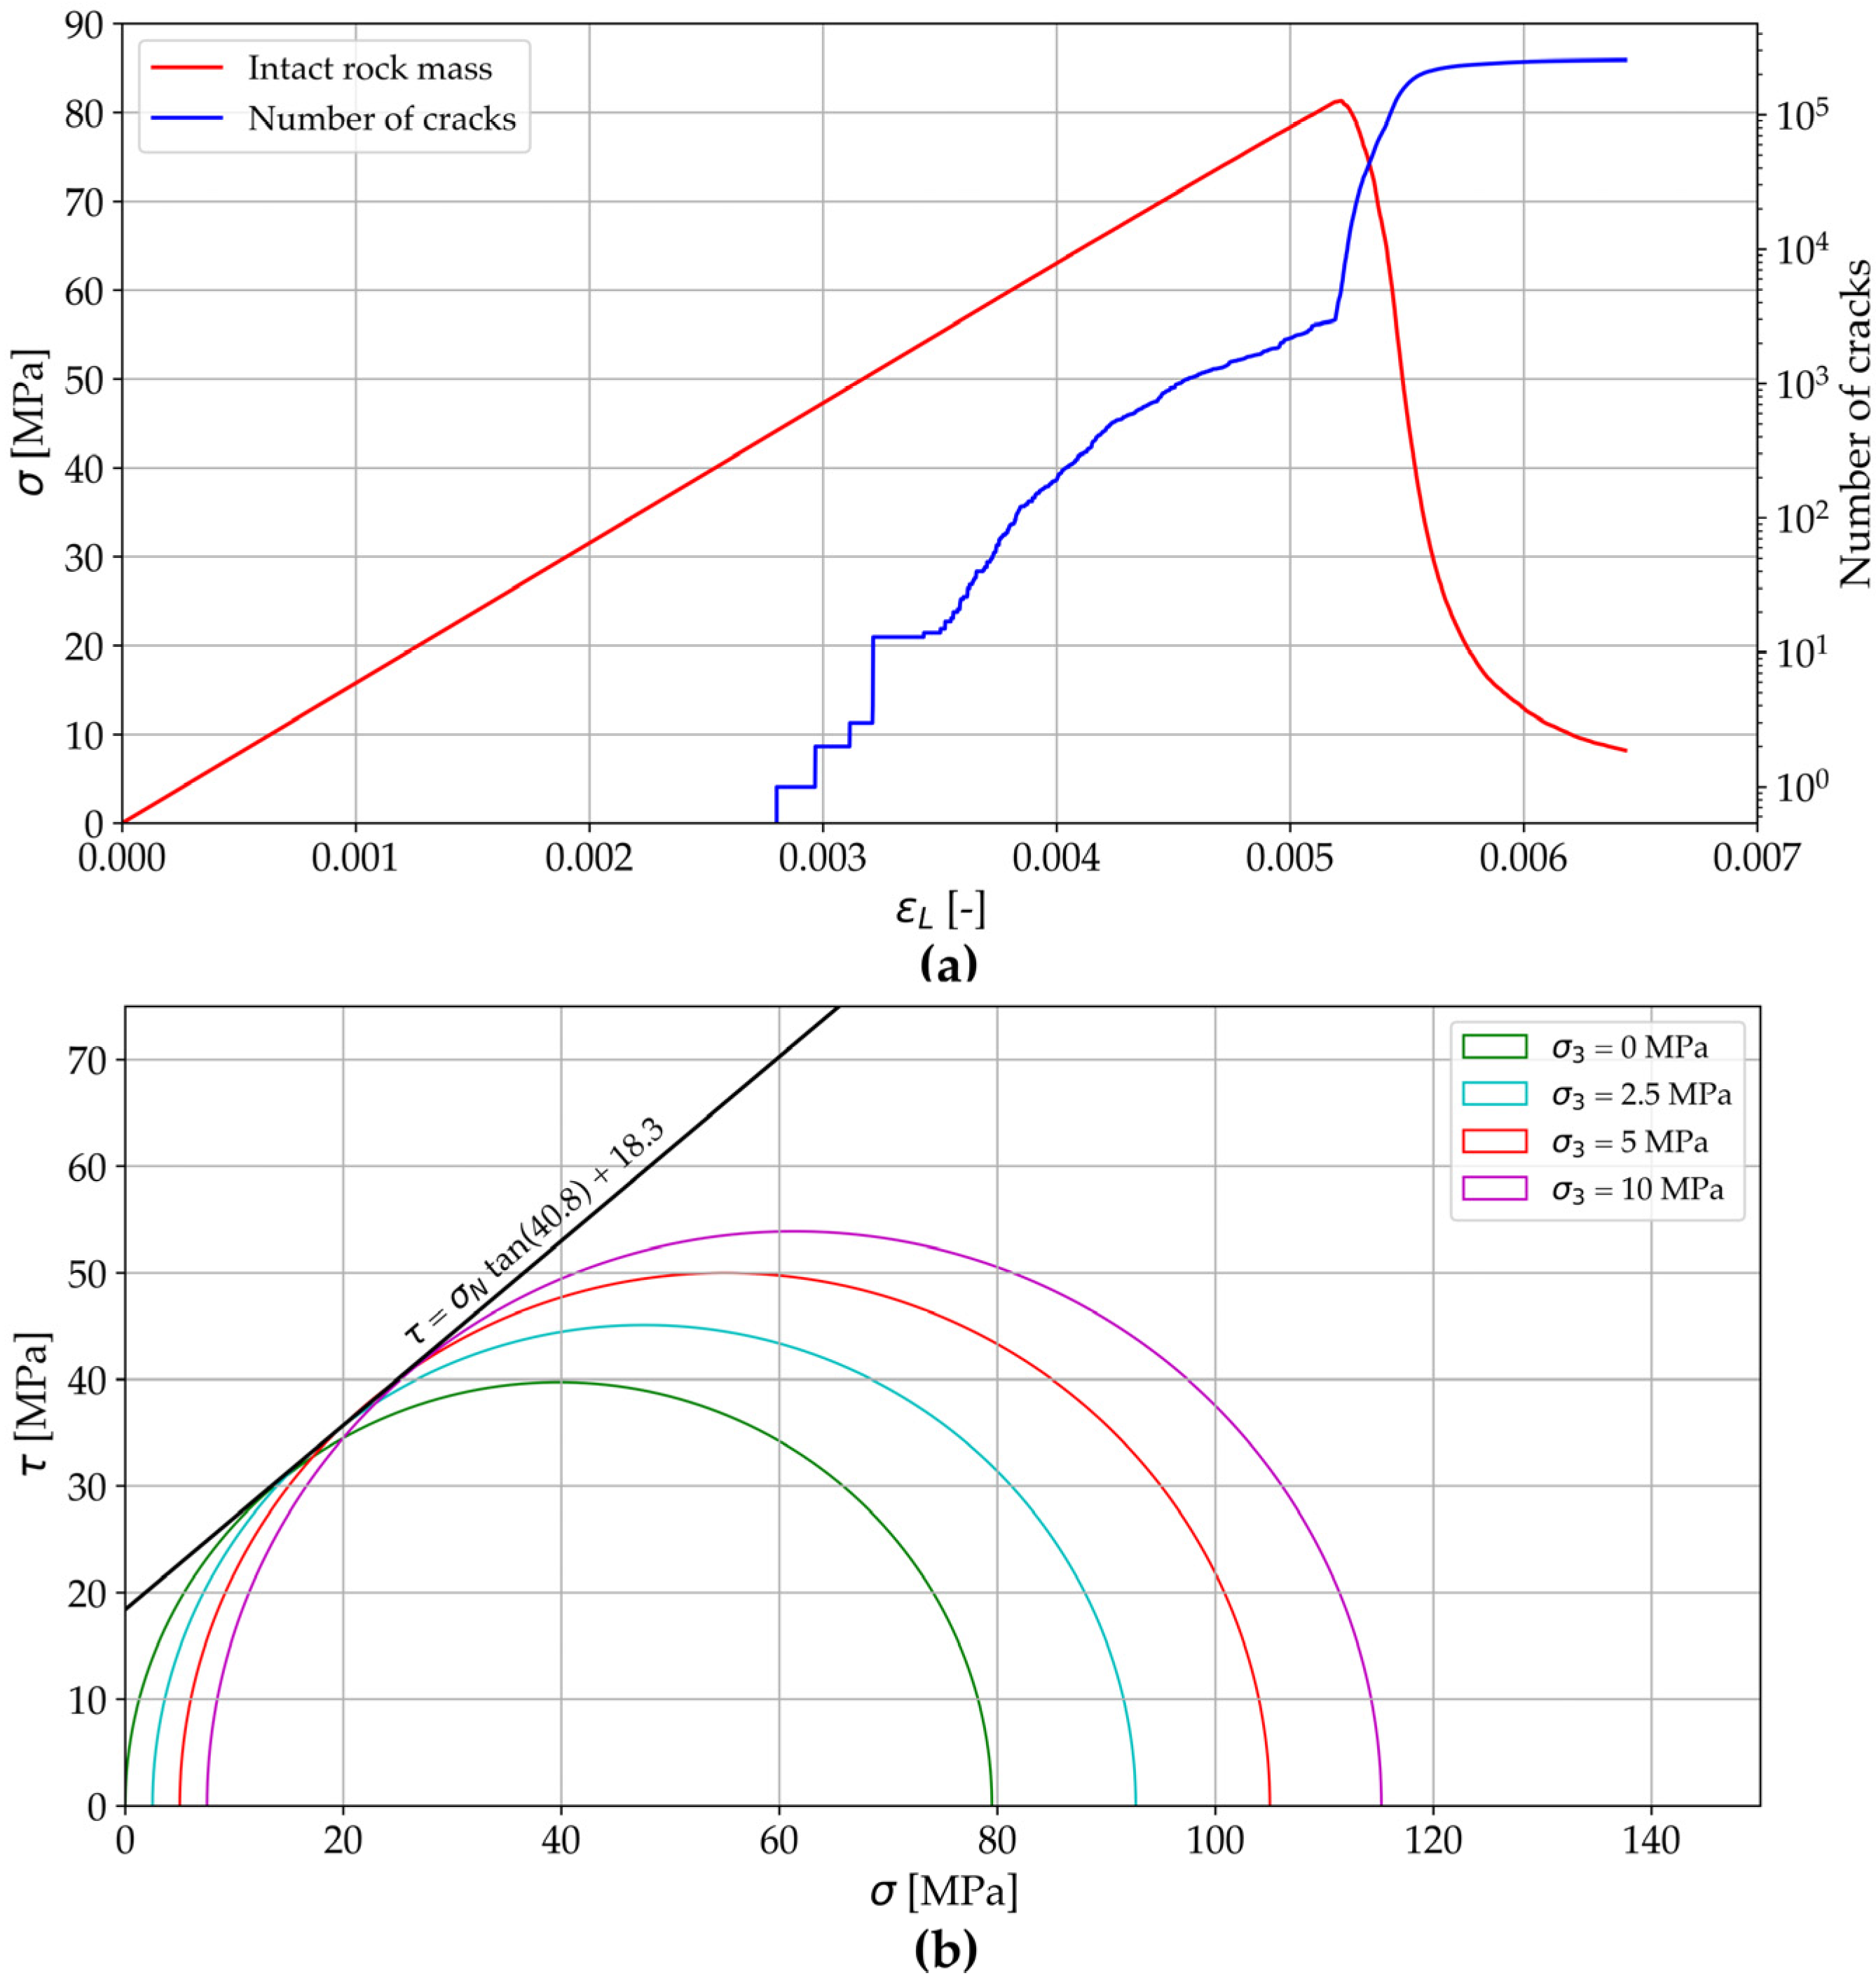
As described in Section 3.1.3, the next step in the SRM workflow is to calibrate the intact rock to the rock mass scale, i.e., a massive cube of 50 m edge length. This was accomplished by slightly adjusting the input parameters (Table 3). Again, unconfined pressure tests were performed to determine the UCSrock and the deformation modulus of the intact rock mass. An UCSrock mass of 80.3 MPa (about 80% of the intact material at laboratory scale) and 16 GPa for the deformation modulus were obtained. The calibration utilized increasing confining pressures from 2.5 to 10 MPa, resulting in a cohesion of 18.3 MPa and a friction angle of 40.8°, which match the target values (Figure 7 and Table 6).
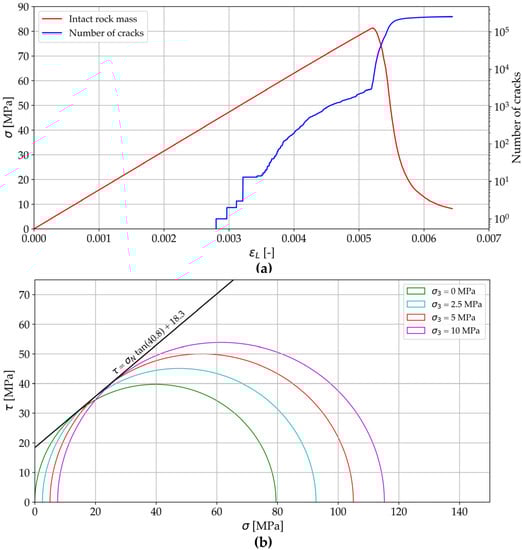
Figure 7.
Results of the intact rock models on rock mass scale, i.e., a massive cube of 50 m edge length. (a) Stress–strain curve for the intact rock, including the evolution of number of cracks; (b) Results of triaxial experiments using various confining pressures.
Table 6.
Results for the intact rock mass calibration.
Considering the modeling results obtained by combining the LS-SRM model with the DFN model, significantly lower values emerge on the one hand, along with a different stress–strain curve pattern, as seen in the previous models of the intact specimens in the laboratory as well as on the rock mass scale (Figure 8). The calculated rock mass strength indicates a reduction of approximately 75% of the fractured rock mass compared to the intact material, with an average value of 23.2 MPa (Table 7). The computed values range from 16 to 31 MPa. A similar picture emerges with respect to the deformation modulus of the fractured rock mass. The calculated deformation modulus, having an average value of 2.9 GPa, is almost 80% lower than the Young’s modulus of the intact rock (Table 7).
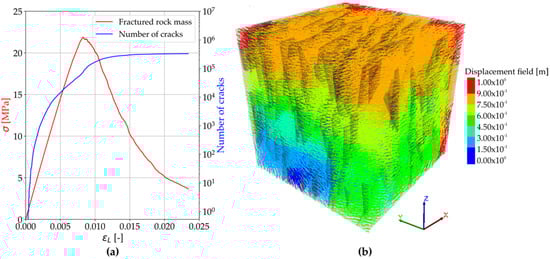
Figure 8.
(a) Stress–strain curve for the fractured rock mass, including the evolution of number of cracks; (b) Displacement field of the calculated model with fracture traces of the incorporated DFN model shown in black.
Table 7.
Results of the rock mass properties using the LS-SRM model in combination with the DFN model.
Results of the sensitivity analysis indicate that the increase or reduction in fracture size, according to Table 4, has no significant impact in the considered case study or on the calculated rock mass parameters. The computed results are only slightly different from those of the standard case. Varying the intensity and the fracture stiffness in the DFN model comparatively affects the rock mass strength and the deformation modulus to a larger extent. Models with low intensity and high fracture stiffness as well as models with high intensity and low fracture stiffness display the greatest influence on the rock mass characteristics. Utilizing these two extreme cases, the calculated rock mass strength ranges from approximately 18 to 31 MPa, while the deformation modulus ranges from 1.3 to 4.5 GPa.
4.3. Comparison with DFN-Oda-Geomechanics Approach and Empirical Relationships
Comparison of rock mass strength. A potential validation of the calculated UCSmass values by the LS-SRM models of the fractured rock mass can be performed by comparison to empirical formulations based on various rock mass classification schemes. For this purpose, five different formulas based on the RMR and the GSI were chosen to cover a wide range of possible empirically calculated outcomes (Table 8). Comparing the UCSmass values calculated using the LS-SRM approach with those derived from the empirical rock classifications, a high degree of agreement is evident. The empirical formulas as well as the LS-SRM approach predict a significant reduction in the rock mass strength (Table 8). The calculated values range from 16 to 47% of the intact rock strength. The calculated UCSmass of 23.2 MPa is therefore perfectly consistent with this range, confirming that the results are reasonable (Figure 9). As mentioned previously, the comparison was further used to determine if the mechanical properties of the DFN model may need to be adjusted. To achieve a better agreement, several models were selected according to the sensitivity analysis showing the greatest impact on the results. Within these models, the fracture normal stiffness and shear stiffness were increased by a factor of three (labeled as LS-SRM adapted). The increase in fracture stiffness has only minor implications for the rock mass strength, resulting in a slightly better fit, as can be seen in Table 8 and Figure 9.
Table 8.
Comparison of the rock mass strength using the LS-SRM approach and empirical equations based on empirical rock mass classification schemes.
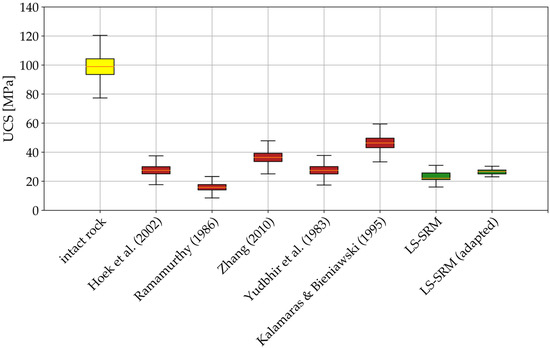
Figure 9.
Comparison of measured intact rock and calculated rock mass strengths using the different upscaling approaches (e.g., [53,54,55,56,57]).
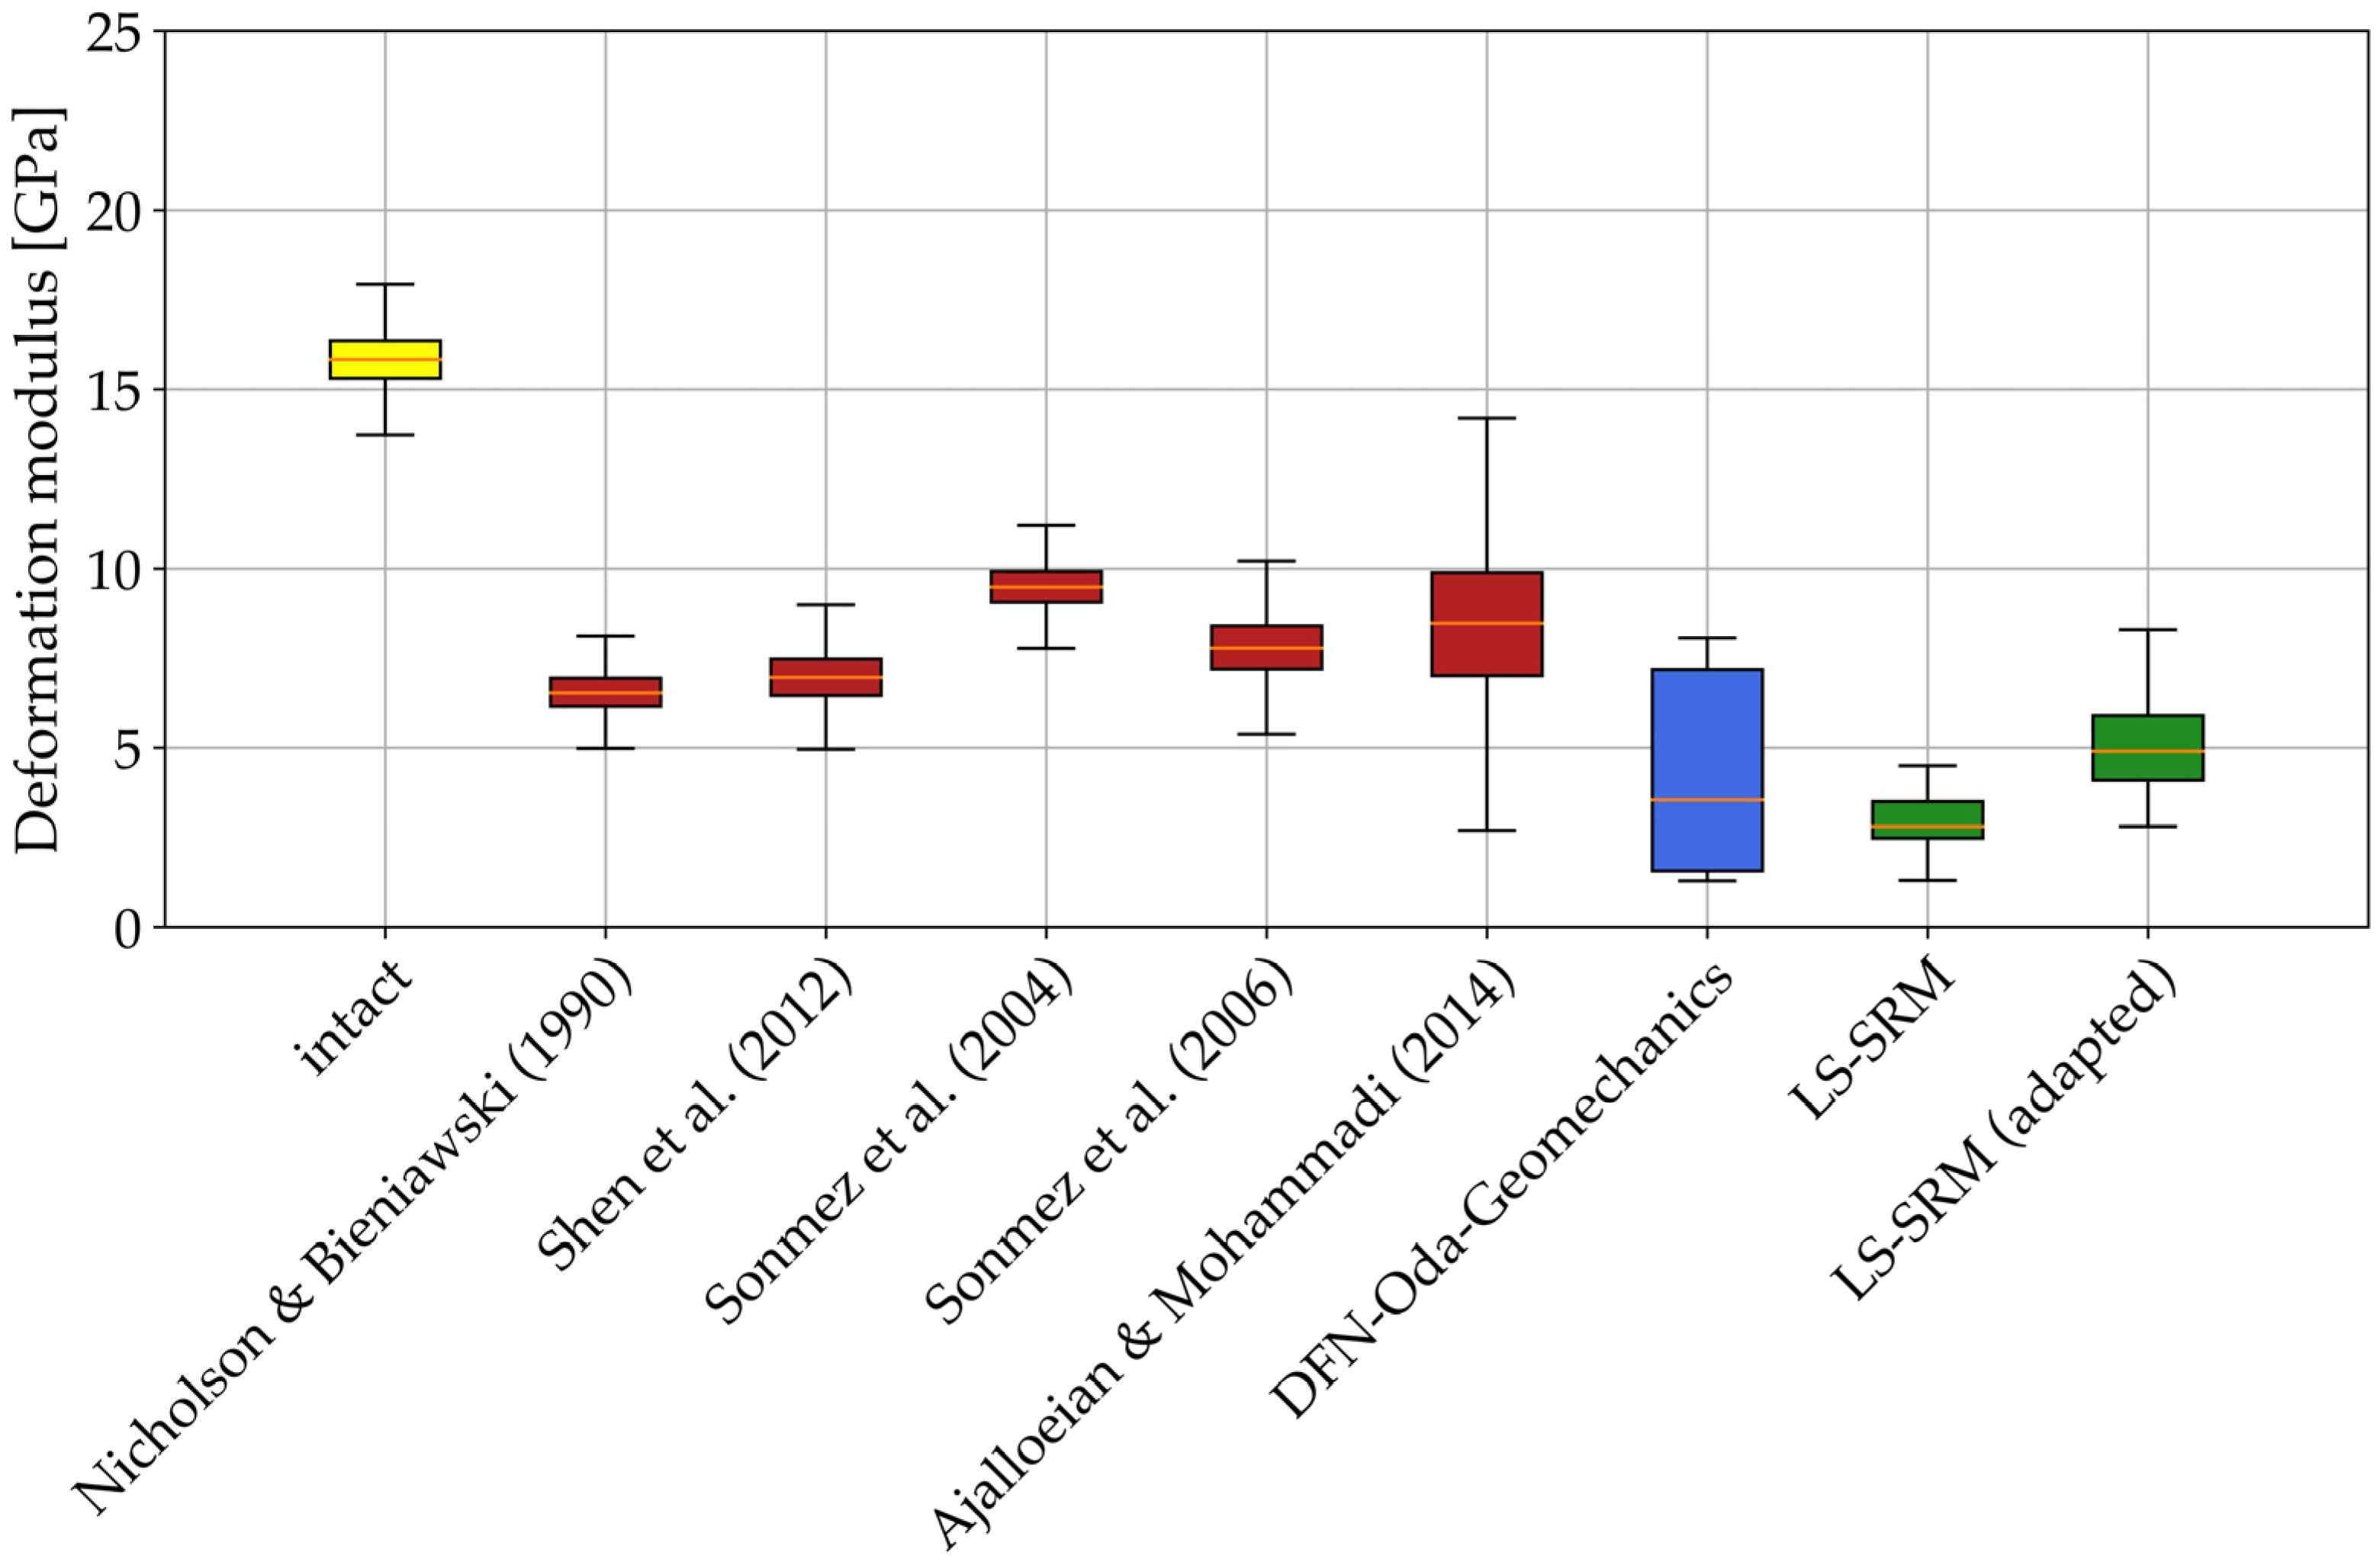
Comparison of deformation modulus. Validation of the calculated values for the deformation modulus by the LS-SRM models of the fractured rock mass can again be achieved by comparing them to predicted outcomes of empirical formulations based on rock mass classifications. In addition, the results are compared with the results of the DFN-Oda-Geomechanics approach. Again, five different formulas based on the RMR, GSI and Q-system were chosen to cover the range of possible empirically calculated outcomes (Table 9). In general, it can be observed that the results of the LS-SRM models are in the lower range compared to the values obtained by the other approaches. The empirical equations estimate an average value for the deformation modulus of about 6 GPa, corresponding to a reduction of about 60% compared to the intact material. In this case, however, the LS-SRM model calculations predict a mean value of 2.9 GPa, which is about half of the empirically calculated value. A better agreement, however, is found by comparing the calculated values with those obtained by the DFN-Oda-Geomechanics approach. The results of the SRM models are in the middle to lower range of the values derived from this upscaling technique (Figure 10). The DFN-Oda-Geomechanics approach shows a larger range, but the average values differ only marginally. The increase in fracture stiffness by a factor of three has a pronounced effect on the deformation modulus predicted by the LS-SRM models. The calculated values consequently also correspond better to the calculated range of outcomes obtained by other approaches applied (Table 9 and Figure 10).
Table 9.
Comparison of the rock mass deformation modulus using the LS-SRM approach, DFN-Oda-Geomechanics approach and empirical equations based on empirical rock mass classification schemes.

Figure 10.
Comparison of calculated deformation moduli using the different upscaling approaches (e.g., [11,50,58,59,60,61]).
5. Discussion
The LS-SRM modeling approach adopted in this study is characterized by a comparatively straightforward and short calibration process for the input parameters as well as computational efficiency. This distinguishes it from other SRM approaches. Moreover, the analysis carried out demonstrates that by using the selected LS-SRM approach, insights about the mechanical properties as well as the fracturing behavior of intact rocks and also fractured rock masses can be obtained and investigated. In the first step of the SRM workflow, the input parameters for the intact rock were calibrated. This can be achieved quickly and efficiently due to the built-in calibration factors. The results obtained from the calibration of the intact rock on laboratory scale indicate that the synthetic rock mass modeling approach is well suited to reproduce previously performed rock mechanical laboratory tests and consequently can be used as a virtual laboratory. By performing unconfined compression experiments, a good fit of the uniaxial compressive strength as well as the intact Young’s modulus with the previously performed laboratory tests of [50] was obtained. Although the calculated values of the intact rock agree with the target values, the stress–strain curves for the intact sandstone in the laboratory test and in the numerical model do not coincide exactly. Firstly, the initial deformation stage is dissimilar, which can be explained by the initial crack closure in the laboratory specimens, a behavior that is not taken into account in the LS-SRM models. However, this does not have an effect on the resulting UCSrock and Young’s modulus. Furthermore, the slight flattening of the stress–strain curve before failure of the specimen, caused by the formation and initial coalescence of microcracks leading to an initial weakening of the rock before the specimen fractures, is not observable. The linear stress–strain response before the peak strength in the model is a consequence of using a lattice based on a Voronoi tessellation. Such a lattice reduces the force–stress dispersion, resulting in spring breakage taking place for a relatively narrow range of stresses [62]. In addition to the unconfined compression experiments, models with various confining pressures were used to calibrate the internal friction angle and the cohesion. Results obtained from the calibration of the intact sandstone show that the LS-SRM approach is well suited to perform numerical laboratory tests and reproduce the rock properties determined in the laboratory.
Based on these findings, the input parameters for the intact massive rock mass were adjusted, whereby the rock mass strength was reduced to 80% of the intact laboratory value, according to [52]. A cell size of 50 × 50 × 50 m3 for the rock mass was adopted in order to allow for a proper comparison to estimate rock mass properties derived from empirical relationships and the DFN-Oda-Geomechanics approach and having the same dimensions as the project domain, i.e., 50 m. These dimensions are assumed to constitute a reasonable volume with respect to geotechnical engineering applications in tunneling and mining as well as fractured rock mass characterization of hydrocarbon and geothermal reservoirs. According to the work of [63], in which attempts were made to define thresholds for the representative elementary volume (REV) size using the equivalent continuum approach, a rock mass can be assumed to be continuous if the ratio of the size of the structure and the mean joint spacing is 10–20. If the treated rock mass satisfies this criterion or exceeds this value, the failure behavior can be modeled by a continuum approach. If the ratio is lower, however, it is more appropriate to employ a discontinuum approach to model the rock mass. Since the ratio in this case study is approximately 9, the choice of a discontinuum approach utilizing LS-SRM models is reasonable. In the next step, the calibrated intact rock mass model was combined with the DFN model and unconfined compression experiments were conducted to derive the strength and the deformation modulus of the fractured rock mass. The results achieved by the numerical simulations of the fractured sandstone underline the weakening effect existing fracture networks have on rock mass properties in terms of strength and elastic parameters. The LS-SRM models of the fractured rock mass predict a compressive strength of approximately 23 MPa, which is a reduction by almost 76% compared to the value of the intact rock. Those values were validated and compared to empirical formulas based on rock mass classification schemes such as the RMR or the GSI, yielding a high level of agreement. The UCSmass values calculated from these empirical relationships predict a strength range from 16 to 46 MPa, which covers the calculated values of the SRM models. Considering the calculated deformation modulus of the SRM models, a similar picture emerges regarding the reduction by the fracture network compared to the intact value. The deformation moduli obtained from the LS-SRM models indicate a value of approximately 3 GPa, representing a significant reduction in comparison to the intact rock showing a Young’s modulus of 15.8 GPa. Such a reduction is in agreement with the work of [64] and [1], which indicated that sandstone and fractured rock masses in general can exhibit a reduction of up to 75% compared to the intact rock. Sensitivity studies on the characteristics of the DFN models, including fracture size, fracture intensity and fracture normal and shear stiffness, significantly influence the upscaled results, leading to a range of 1.4 to 4.5 GPa. This emphasizes the importance of site-specific characterization and stiffness parameters, including corresponding mechanical tests on fractures, to optimize the accuracy of the models and potential resulting predictions.
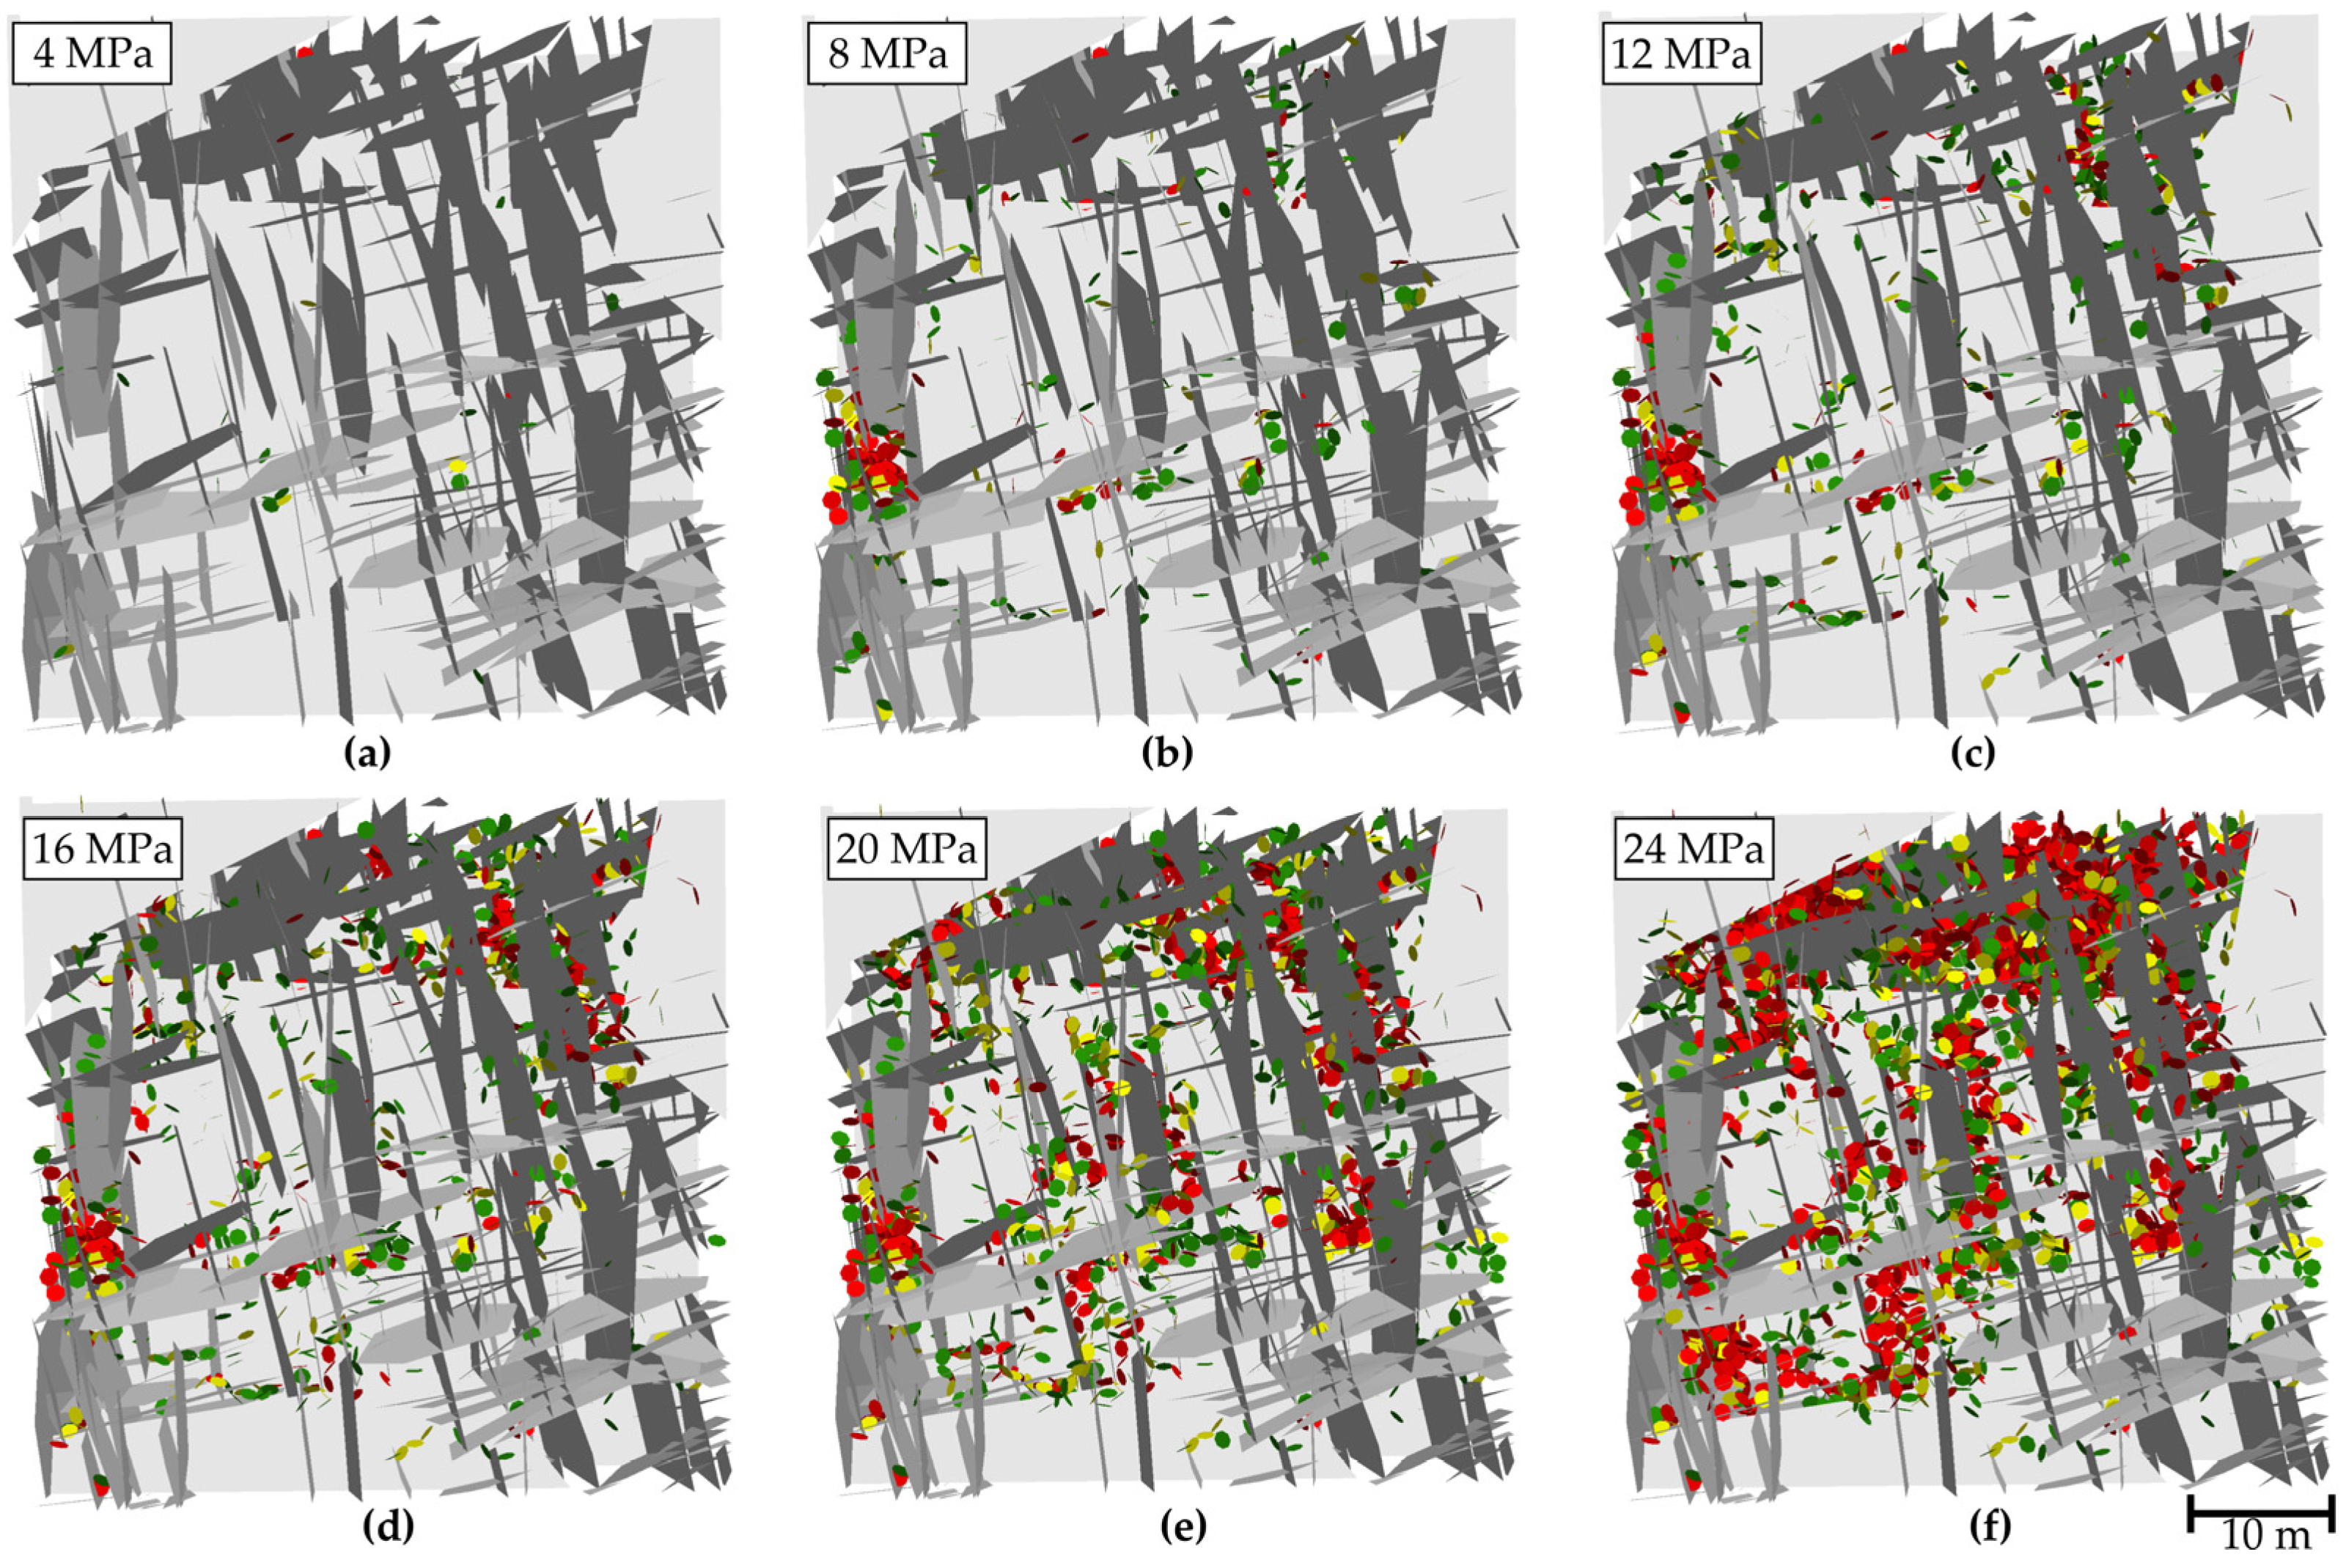
However, by comparing the calculated deformation moduli of the LS-SRM models with the corresponding values of the DFN-Oda-Geomechanics approach and the empirically calculated values, a somewhat larger deviation can be observed. Although the LS-SRM models indicate a good level of agreement with the DFN-Oda-Geomechanics approach in terms of the mean value, the range is reduced, and the values tend to be in the lower part of the range calculated by the continuum approach. In the DFN-Oda-Geomechanics approach, the entire model domain of the DFN model is segmented into a predefined number of grid cells. The equivalent properties such as the deformation modulus are computed with analytical techniques based on the crack tensor theory [31,32]. The crack tensor theory calculates the volumetric average properties of all fractures with respect to their geometrical and mechanical properties, such as orientation, length, aperture or the fracture stiffness of the discontinuities in the respective grid cells. Features or processes such as the formation of new cracks in the intact rock or at existing fractures and their coalescence along a prevailing fracture network are thus not taken into account. In this context, the discontinuum approach of the LS-SRM models offers an advantage, as it allows investigating the potential fracture initiation and propagation within the fractured rock mass. An exemplary sequence of the formation and coalescence of newly formed microcracks, which could ultimately lead to the failure of the rock mass, is shown in Figure 11. It can be observed that at the beginning of the loading stage, isolated microcracks form at the tips of the already existing fractures distributed over the entire model domain (Figure 11a,b). With increasing loading and stress, the amount of microcracks also increases, and the microcracks begin to coalesce at locations with a high fracture density (Figure 11c). If the stress is increased further, the number of microcracks also increases, and microcracks also form in the intact rock, causing more and more fractures to form (Figure 11d,e). Subsequently, as the experiment progresses, more and more microcracks will connect, using the prevailing fracture network as a pathway to form larger fracture planes that will ultimately lead to the failure of the entire rock mass (Figure 11f).
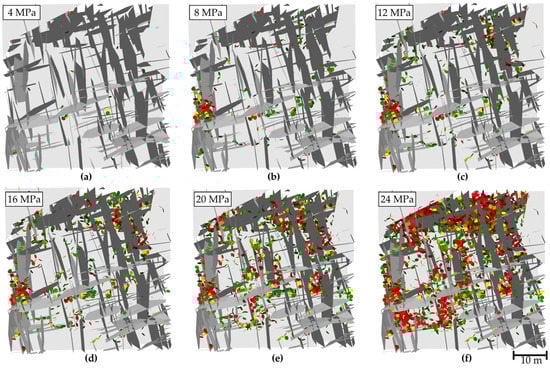
Figure 11.
Exemplary sequence of the formation and coalescence of newly formed microcracks using the LS-SRM models with top view of the fractured rock mass. Predominant fractures, represented by the DFN model, are shown in gray shades. Newly formed microcracks are shown in green (33% broken), yellow (66% broken) and red (100% broken) using the flat joint model.
Results obtained from the calculation of the deformation modulus based on rock mass classification schemes show a range of almost 3 to 14 GPa, with a mean value of 8.6 GPa, thus differing more clearly from the results of the LS-SRM models. The lower values can again potentially be explained by the ability of the LS-SRM models to allow for fracture initiation and fracture propagation. A possible explanation is that fracture initiation in the LS-SRM models of the fractured rock mass occurs significantly earlier compared to the intact rocks, as can be seen in Figure 8 and Figure 11 as well as being described above. In addition, the empirical equations are rather sensitive to the input parameters, adding an additional factor of uncertainty to the results obtained. Nonetheless, results derived from the adapted LS-SRM models with increased fracture stiffness demonstrate that it is mandatory to compare and validate different approaches. These models show that it is potentially necessary to modify the mechanical properties of the fracture network model rather than using the laboratory results directly.
Investigated aspects in this work were, on one hand, the comparison of different approaches to determine the mechanical properties of fractured rock masses and, on the other hand, the investigation of which approach is most suitable to determine potential input parameters for large-scale numerical models. The various empirical calculations based on the rock mass classification schemes have proven their reliability and convenience in estimating the properties of rock masses. They provide plausible results if their uncertainties are taken into account [50,65]. However, they have their limitations if anisotropic rock masses and the spatial variation in rock properties have to be described. Considering the DFN-Oda-Geomechanics approach, these issues can be addressed. Using a superimposed 3D grid, the DFN model can be subdivided into arbitrarily chosen voxel sizes, and by means of the crack tensor theory, spatial variations as well as anisotropic elastic properties of the rock mass can be determined. This is a potentially valuable aspect in the context of a geotechnical project that is not taken into account by the rock mass classification schemes. Moreover, this continuum approach offers the possibility to perform block size analysis, which can be used for further geotechnical engineering applications. However, as previously noted, it cannot address crack initiation, propagation and coalescence. A further interesting benefit of using this approach is that the fracture network geometry used for mechanical analysis can also be used for hydraulic applications if hydraulic properties are assigned to the fractures as well. In this manner, a spatially variable permeability tensor is computed, which can be used for flow simulations of the fractured rock mass. The main difference with and potential advantage of LS-SRM models is the consideration of the intact rock of a fractured rock mass using a discontinuum approach. Utilizing this technique, crack initiation, propagation and coalescence can be considered and investigated depending on the prevailing type of rock and geometrical properties of the fracture network. Furthermore, it is possible to perform confined compression experiments on the fractured rock mass in order to investigate the influence of existing stress conditions on the rock mass strength and elastic properties. The discontinuum approach is therefore, due to its capabilities, well suited to test several realizations of rock mass samples and is potentially better suited to study the mechanical properties more realistically and more closely to the behavior potentially encountered in nature. Furthermore, as shown in the work of [24,25], it is also possible to conduct hydraulic fracturing simulations. However, a possible disadvantage, depending on the computing efficiency, is the computational time of the simulations of the LS-SRM models compared to the DFN-Oda-Geomechanics approach. Depending on the selected resolution and size of the model, it can take several hours or even days for a simulation. It should also be mentioned that neither approach considers time-dependent material behavior, temperature or pore pressure changes, which also influence the mechanical properties of the fractures themselves and the fractured rock mass. Nevertheless, both approaches can be used to upscale rock mass properties to the cell size of reservoir- and regional-scale geomechanical models, which typically is in the range of tens to hundreds of meters, containing a large number of pre-existing discontinuities.
6. Conclusions
The present study describes a numerical characterization of a fractured sedimentary rock mass and its mechanical behavior based on experiments using the discontinuous LS-SRM approach. The workflow has been successfully applied to a sandstone outcrop but is applicable to all types of fractured rock. The required input parameters of the mechanical properties of the intact rock as well as of the geometrical and mechanical properties of the fracture network by means of a DFN model of the study domain were taken from the work of [50]. In a first step, LS-SRM models were created on a laboratory scale to reproduce the laboratory results. Subsequently, the LS-SRM input parameters were upscaled to a massive rock cube with 50 m edge length, thus having the same dimensions as the case study. Finally, the calibrated intact rock mass was combined with the DFN model, forming the fractured rock mass model. Analysis of the LS-SRM models reveals a significant reduction in the strength of the fractured rock mass compared to the intact rock, showing a good agreement with empirically calculated values based on rock mass classification schemes. Results for the deformation modulus also show a significant reduction induced by the fracture network. However, the values are slightly lower in comparison to the predictions of the empirical formulations and the DFN-Oda-Geomechanics continuum approach. This can be explained by the fact that the LS-SRM approach, unlike the other applied approaches, can analyze crack initiation, propagation and coalescence, which will have an impact on the computed properties. The empirical relationships based on rock mass classification schemes have proven to be a reliable and convenient method for estimating rock mass properties. However, they reach their limits if anisotropic rock masses and the spatial variation of rock properties have to be described. Using DFN models, the DFN-Oda-Geomechanics approach offers, in addition to computational efficiency, significantly enhanced possibilities for both mechanical and hydraulic fractured rock mass characterization. A potential disadvantage, however, is the analytical calculation of the elastic parameters, which distinguishes the LS-SRM models. The LS-SRM approach can incorporate available geological and mechanical data into the model and analyze the complex mechanical behavior during failure of rock masses, including crack initiation, propagation and coalescence. However, it is worth mentioning that the computation can be rather time-consuming depending on the selected size of the model domain and the lattice resolution. Nonetheless, the LS-SRM models offer the possibility of an extensive analysis of the deformation of fractured rock masses, specific to the prevailing rock and fracture properties within the project and the surrounding conditions. This may allow predictions to be made that are tailored to the interaction of rock mass and fractures, thus offering interesting possibilities for refined fractured rock mass characterization and the design of geotechnical applications ranging from slope stability to foundations and excavation design.
Author Contributions
Conceptualization, D.G. and A.H.; Methodology, D.G.; Software, D.G.; Validation, D.G.; Formal Analysis, D.G.; Investigation, D.G. and A.H.; Data Curation, D.G.; Writing—Original Draft Preparation, D.G.; Writing—Review and Editing, D.G. and A.H.; Visualization, D.G.; Supervision, A.H.; Project Administration, A.H. All authors have read and agreed to the published version of the manuscript.
Funding
This research was funded by the German Federal Ministry for Economic Affairs and Energy (BMWi), grant number 0324244A.
Data Availability Statement
Data supporting the findings of this study could be available from the authors on request.
Acknowledgments
The authors thank the editor and anonymous reviewers for helpful comments on an earlier version of the manuscript. The authors would like to thank Itasca Consultants GmbH for providing the software SRMLab as well as the help regarding the development of the models used in this work. In addition, the authors would like to thank Golder Associates Inc. for providing their FracMan software on an academic license agreement. Seidenspinner Natursteinwerk GmbH is thanked for providing access to their quarry in Remlingen.
Conflicts of Interest
The authors declare no conflict of interest.
References
- Beiki, M.; Bashari, A.; Majdi, A. Genetic Programming Approach for Estimating the Deformation Modulus of Rock Mass Using Sensitivity Analysis by Neural Network. Int. J. Rock Mech. Min. Sci. 2010, 47, 1091–1103. [Google Scholar] [CrossRef]
- Wittke, W. Rock Mechanics Based on an Anisotropic Jointed Rock Model (AJRM); Ernst: Berlin, Germany, 2014. [Google Scholar]
- Farahmand, K.; Vazaios, I.; Diederichs, M.S.; Vlachopoulos, N. Investigating the Scale-Dependency of the Geometrical and Mechanical Properties of a Moderately Jointed Rock Using a Synthetic Rock Mass (SRM) Approach. Comput. Geotech. 2018, 95, 162–179. [Google Scholar] [CrossRef]
- Keneti, A.; Pouragha, M.; Sainsbury, B.-A. Review of Design Parameters for Discontinuous Numerical Modelling of Excavations in the Hawkesbury Sandstone. Eng. Geol. 2021, 288, 106158. [Google Scholar] [CrossRef]
- Pilgerstorfer, T.; Radončić, N.; Moritz, B.; Goricki, A. Evaluation and Interpretation of Monitoring Data in the Test Adit EKT Paierdorf / Auswertung Und Interpretation Der Messdaten Aus Dem Versuchsstollen EKT Paierdorf. Geomech. Tunnelbau. 2011, 4, 423–434. [Google Scholar] [CrossRef]
- Bieniawski, Z.T. Engineering Classification of Jointed Rock Masses. J. S. Afr. Inst. Civ. Eng. 1973, 15, 335–343. [Google Scholar]
- Hoek, E. Strength of Rock and Rock Masses. ISRM News J. 1994, 4–16. [Google Scholar]
- Barton, N.; Lien, R.; Lunde, J. Engineering Classification of Rock Masses for the Design of Tunnel Support. Rock Mech. 1974, 6, 189–236. [Google Scholar] [CrossRef]
- Jing, L. A Review of Techniques, Advances and Outstanding Issues in Numerical Modelling for Rock Mechanics and Rock Engineering. Int. J. Rock Mech. Min. Sci. 2003, 40, 283–353. [Google Scholar] [CrossRef]
- Hoek, E.; Diederichs, M.S. Empirical Estimation of Rock Mass Modulus. Int. J. Rock Mech. Min. Sci. 2006, 43, 203–215. [Google Scholar] [CrossRef]
- Shen, J.; Karakus, M.; Xu, C. A Comparative Study for Empirical Equations in Estimating Deformation Modulus of Rock Masses. Tunn. Underg. Space Technol. 2012, 32, 245–250. [Google Scholar] [CrossRef]
- Riedmüller, G.; Schubert, W. Critical Comments on Quantitative Rock Mass Classifications. Felsbau 1999, 17, 164–167. [Google Scholar]
- Vibert, C.; Vaskou, P. Use of Rock Mass Classifications for Design: Recommendations and Suggestions. In Proceedings of the 12th ISRM Congress, OnePetro, Beijing, China, 21 October 2011. [Google Scholar]
- Elmo, D.; Moffitt, K.; Carvalho, J. Synthetic Rock Mass Modelling: Experience Gained and Lessons Learned. In Proceedings of the 50th US Rock Mechanics/Geomechanics Symposium, OnePetro, Houston, TX, USA, 26–29 June 2016. [Google Scholar]
- Scheldt, T. Comparison of Continuous and Discontinuous Modelling for Computational Rock Mechanics. Ph.D. Thesis, Norwegian University of Science and Technology, Trondheim, Norway, 2002. [Google Scholar]
- Bastola, S.; Cai, M. Simulation of Stress–Strain Relations of Zhenping Marble Using Lattice-Spring-Based Synthetic Rock Mass Models. In Proceedings of the 52nd US Rock Mechanics/Geomechanics Symposium, Seattle, WA, USA, 17–20 June 2018. [Google Scholar]
- Bastola, S.; Cai, M. Investigation of Mechanical Properties and Crack Propagation in Pre-Cracked Marbles Using Lattice-Spring-Based Synthetic Rock Mass (LS-SRM) Modeling Approach. Comput. Geotech. 2019, 110, 28–43. [Google Scholar] [CrossRef]
- Bastola, S.; Cai, M. Investigation of Mechanical Properties of Jointed Granite under Compression Using Lattice-Spring-Based Synthetic Rock Mass Modeling Approach. Int. J. Rock Mech. Min. Sci. 2020, 126, 104191. [Google Scholar] [CrossRef]
- Ivars, D.M.; Pierce, M.E.; Darcel, C.; Reyes-Montes, J.; Potyondy, D.O.; Paul Young, R.; Cundall, P.A. The Synthetic Rock Mass Approach for Jointed Rock Mass Modelling. Int. J. Rock Mech. Min. Sci. 2011, 48, 219–244. [Google Scholar] [CrossRef]
- Vazaios, I.; Farahmand, K.; Vlachopoulos, N.; Diederichs, M.S. Effects of Confinement on Rock Mass Modulus: A Synthetic Rock Mass Modelling (SRM) Study. J. Rock Mech. Geotech. Eng. 2018, 10, 436–456. [Google Scholar] [CrossRef]
- Bastola, S.; Cai, M.; Damjanac, B. Slope Stability Assessment of an Open Pit Using Lattice-Spring-Based Synthetic Rock Mass (LS-SRM) Modeling Approach. J. Rock Mech. Geotech. Eng. 2020, 12, 927–942. [Google Scholar] [CrossRef]
- Bastola, S. Study of Mechanical Properties of Jointed Rock Mass Using Lattice-Spring-Based Synthetic Rock Mass (Ls-Srm) Modeling Approach. Ph.D. Thesis, Laurentian University, Sudbury, ON, Canada, 2019. [Google Scholar]
- Cundall, P.A.; Damjanac, B.; Varun, V. Considerations on Slope Stability in a Jointed Rock Mass. In Proceedings of the 50th U.S. Rock Mechanics/Geomechanics Symposium, Houston, TX, USA, 26–29 June2016. [Google Scholar]
- Damjanac, B.; Cundall, P. Application of Distinct Element Methods to Simulation of Hydraulic Fracturing in Naturally Fractured Reservoirs. Comput. Geotech. 2016, 71, 283–294. [Google Scholar] [CrossRef]
- Damjanac, B.; Detournay, C.; Cundall, P.A. Application of Particle and Lattice Codes to Simulation of Hydraulic Fracturing. Comp. Part Mech. 2016, 3, 249–261. [Google Scholar] [CrossRef]
- Berkowitz, B. Characterizing Flow and Transport in Fractured Geological Media: A Review. Adv. Water Resour. 2002, 25, 861–884. [Google Scholar] [CrossRef]
- Elmo, D.; Stead, D. An Integrated Numerical Modelling–Discrete Fracture Network Approach Applied to the Characterisation of Rock Mass Strength of Naturally Fractured Pillars. Rock Mech. Rock Eng. 2010, 43, 3–19. [Google Scholar] [CrossRef]
- Lei, Q.; Latham, J.-P.; Tsang, C.-F. The Use of Discrete Fracture Networks for Modelling Coupled Geomechanical and Hydrological Behaviour of Fractured Rocks. Comput. Geotech. 2017, 85, 151–176. [Google Scholar] [CrossRef]
- Bisdom, K.; Gauthier, B.D.M.; Bertotti, G.; Hardebol, N.J. Calibrating Discrete Fracture-Network Models with a Carbonate Three-Dimensional Outcrop Fracture Network: Implications for Naturally Fractured Reservoir Modeling. AAPG Bull. 2014, 98, 1351–1376. [Google Scholar] [CrossRef]
- Miyoshi, T.; Elmo, D.; Rogers, S. Influence of Data Analysis When Exploiting DFN Model Representation in the Application of Rock Mass Classification Systems. J. Rock Mech. Geotech. Eng. 2018, 10, 1046–1062. [Google Scholar] [CrossRef]
- Oda, M.; Suzuki, K.; Maeshibu, T. Elastic Compliance for Rock-like Materials with Random Cracks. Soils Found. 1984, 24, 27–40. [Google Scholar] [CrossRef]
- Oda, M. An Equivalent Continuum Model for Coupled Stress and Fluid Flow Analysis in Jointed Rock Masses. Water Resour. Res. 1986, 22, 1845–1856. [Google Scholar] [CrossRef]
- Rutqvist, J.; Leung, C.; Hoch, A.; Wang, Y.; Wang, Z. Linked Multicontinuum and Crack Tensor Approach for Modeling of Coupled Geomechanics, Fluid Flow and Transport in Fractured Rock. J. Rock Mech. Geotech. Eng. 2013, 5, 18–31. [Google Scholar] [CrossRef]
- Pierce, M.; Cundall, P.; Potyondy, D.; Ivars, D. A Synthetic Rock Mass Model for Jointed Rock. In Proceedings of the Rock Mechanics: Meeting Society’s Challenges and Demands, Vancouver, BC, Canada, 27–31 May 2007; pp. 341–349. [Google Scholar]
- Potyondy, D.O.; Cundall, P.A. A Bonded-Particle Model for Rock. Int. J. Rock Mech. Min. Sci. 2004, 41, 1329–1364. [Google Scholar] [CrossRef]
- Esmaieli, K.; Hadjigeorgiou, J.; Grenon, M. Estimating Geometrical and Mechanical REV Based on Synthetic Rock Mass Models at Brunswick Mine. Int. J. Rock Mech. Min. Sci. 2010, 47, 915–926. [Google Scholar] [CrossRef]
- Scholtès, L.; Donzé, F.-V. Modelling Progressive Failure in Fractured Rock Masses Using a 3D Discrete Element Method. Int. J. Rock Mech. Min. Sci. 2012, 52, 18–30. [Google Scholar] [CrossRef]
- Farahmand, K.; Vazaios, I.; Diederichs, M.S.; Vlachopoulos, N. Generation of a Synthetic Rock Mass (SRM) Model for Simulation of Strength of Crystalline Rock Using a Hybrid DFN-DEM Approach. In Proceedings of the ISRM Regional Symposium-EUROCK 2015, Salzburg, Austria, 7–10 October 2015. [Google Scholar]
- Kulatilake, P.H.S.W.; Shu, B. Prediction of Rock Mass Deformations in Three Dimensions for a Part of an Open Pit Mine and Comparison with Field Deformation Monitoring Data. Geotech. Geol. Eng. 2015, 33, 1551–1568. [Google Scholar] [CrossRef]
- Turichshev, A.; Hadjigeorgiou, J. Development of Synthetic Rock Mass Bonded Block Models to Simulate the Behaviour of Intact Veined Rock. Geotech. Geol. Eng. 2017, 35, 313–335. [Google Scholar] [CrossRef]
- Potyondy, D.O. The Bonded-Particle Model as a Tool for Rock Mechanics Research and Application: Current Trends and Future Directions. Geosyst. Eng. 2015, 18, 1–28. [Google Scholar] [CrossRef]
- Ivars, D.M.; Potyondy, D.O.; Pierce, M.; Cundall, P.A. The Smooth-Joint Contact Model. In Proceedings of the WCCM8-ECCOMAS 2008, Venice, Italy, 30 June–4 July 2008. [Google Scholar]
- Cundall, P.A. Lattice Method for Modeling Brittle, Jointed Rock. In Proceedings of the Continuum and Distinct Element Numerical Modeling in Geomechanics, Melbourne, Australia, 14–16 February 2011. [Google Scholar]
- Golder Associates Ltd. FracMan8. 2021. Available online: https://www.golder.com/fracman/ (accessed on 21 August 2022).
- Mirarco MoFrac. 2022. Available online: https://mofrac.com (accessed on 21 August 2022).
- Deere, D.U. Technical Description of Rock Cores for Engineering Purposes. Rock Mech. Eng. Geol. 1964, 1, 17–22. [Google Scholar]
- Bieniawski, Z.T. Engineering Rock Mass Classifications; Wiley: New York, NY, USA, 1989. [Google Scholar]
- Hoek, E.; Carter, T.G.; Diederichs, M.S. Quantification of the Geological Strength Index Chart. In Proceedings of the 47th US Rock Mechanics/Geomechanics Symposium, San Francisco, CA, USA, 23–26 June 2013. [Google Scholar]
- Barton, N. Some New Q-Value Correlations to Assist in Site Characterisation and Tunnel Design. Int. J. Rock Mech. Min. Sci. 2002, 39, 185–216. [Google Scholar] [CrossRef]
- Gottron, D.; Henk, A. Upscaling of Fractured Rock Mass Properties—An Example Comparing Discrete Fracture Network (DFN) Modeling and Empirical Relations Based on Engineering Rock Mass Classifications. Eng. Geol. 2021, 294, 106382. [Google Scholar] [CrossRef]
- Ernst, C.; Hecht, T.; Witt, K.J. In-Situ-Bestimmung von Effektiven Scherparametern in Rutschgefährdeten Schichten Im Oberen Buntsandstein. Geotechnik 2016, 39, 110–118. [Google Scholar] [CrossRef]
- Cai, M.; Kaiser, P.K. In-Situ Rock Spalling Strength near Excavation Boundaries. Rock Mech. Rock Eng. 2014, 47, 659–675. [Google Scholar] [CrossRef]
- Hoek, E.; Carranza-Torres, C.; Corkum, B. Hoek-Brown Failure Criterion-2002 Edition. Proc. NARMS-Tac 2002, 1, 267–273. [Google Scholar]
- Ramamurthy, T. Stability of Rock Mass—8th IGS Annual Lecture. Indian Geotech. J. 1986, 16, 1–74. [Google Scholar]
- Zhang, L. Estimating the Strength of Jointed Rock Masses. Rock Mech. Rock Eng. 2010, 43, 391–402. [Google Scholar] [CrossRef]
- Yudbhir, Y.; Lemanza, W.; Prinzl, F. An Empirical Failure Criterion for Rock Masses. In Proceedings of the 5th ISRM Congress, Melbourne, Australia, 10–15 April 1983; pp. B1–B8. [Google Scholar]
- Kalamaras, G.S.; Bieniawski, Z.T. A Rock Mass Strength Concept for Coal Seams Incorporating the Effect of Time. In Proceedings of the 8th ISRM Congress, Tokyo, Japan, 25–30 September 1995. [Google Scholar]
- Nicholson, G.A.; Bieniawski, Z.T. A Nonlinear Deformation Modulus Based on Rock Mass Classification. Int. J. Min. Geol. Eng. 1990, 8, 181–202. [Google Scholar] [CrossRef]
- Sonmez, H.; Gokceoglu, C.; Nefeslioglu, H.A.; Kayabasi, A. Estimation of Rock Modulus: For Intact Rocks with an Artificial Neural Network and for Rock Masses with a New Empirical Equation. Int. J. Rock Mech. Min. Sci. 2006, 43, 224–235. [Google Scholar] [CrossRef]
- Sonmez, H.; Gokceoglu, C.; Ulusay, R. Indirect Determination of the Modulus of Deformation of Rock Masses Based on the GSI System. Int. J. Rock Mech. Min. Sci. 2004, 41, 849–857. [Google Scholar] [CrossRef]
- Ajalloeian, R.; Mohammadi, M. Estimation of Limestone Rock Mass Deformation Modulus Using Empirical Equations. Bull Eng. Geol. Environ. 2014, 73, 541–550. [Google Scholar] [CrossRef]
- Itasca Consultants GmbH; (Gelsenkirchen, Germany). Personal Communication, 2022.
- Sari, M. Determination of representative elementary volume (REV) for jointed rock masses exhibiting scale-dependent behavior: A numerical investigation. J. Geoengin. 2021, 12, 34. [Google Scholar] [CrossRef]
- Pollard, D.D.; Fletcher, R.C. Fundamentals of Structural Geology; Cambridge University Press: Cambridge, UK; New York, NY, USA, 2005. [Google Scholar]
- Sari, M.; Karpuz, C.; Ayday, C. Estimating Rock Mass Properties Using Monte Carlo Simulation: Ankara Andesites. Comput. Geosci. 2010, 36, 959–969. [Google Scholar] [CrossRef]


Publisher’s Note: MDPI stays neutral with regard to jurisdictional claims in published maps and institutional affiliations. |
© 2022 by the authors. Licensee MDPI, Basel, Switzerland. This article is an open access article distributed under the terms and conditions of the Creative Commons Attribution (CC BY) license (https://creativecommons.org/licenses/by/4.0/).