Abstract
A flood protection dike blends seamlessly with natural surroundings. These dikes stand as vital shields, mitigating the catastrophic effects of floods and preserving both communities and ecosystems. Their design not only aids in controlling water flow but also ensures minimal disruption to the local environment and its biodiversity. The present study used a uniform cohesionless sand with d50 = 0.9 mm to investigate the local scour process near a single combined dike (permeable and impermeable), replicating a flooding scenario. The experiments revealed that the maximum scour depth is likely to occur at the upstream edge of the dike, resembling a local scour observed around a scaled-down emerged dike in an open channel. The scour hole downstream of the dike gets shallower as it gets smaller, as do the horseshoe vortices that surround it. Additionally, by combining different pile shapes, the flow surrounding the dike was changed to reduce horseshoe vortices, resulting in scour length and depth reductions of 48% at the nose and 45% and 65% at the upstream and downstream dike–wall junction, respectively. Contrarily, the deposition height downstream of the dike had a reciprocal effect on permeability, which can severely harm the riverbank defense system. The combined dike demonstrates their ability to mitigate scour by reducing the flow swirls formed around the dike. The suggested solutions can slow down the rapid deterioration and shield the dike and other river training infrastructure from scour-caused failures.
1. Introduction
Every year, heavy floods pose significant socio-economic threats, leading to approximately 20,000 fatalities and adversely impacting over 20 million people globally [1]. Recent studies indicate that flood-related losses are expected to increase in the near future. In multiple European nations, major river floods often occur simultaneously with floods in nearby smaller rivers, resulting in substantial damage to properties and human lives [2,3]. South Asian countries frequently experience heavy floods. Pakistan in particular encounters severe flood events on an almost annual basis. Statistical data show that 23 major flood events from 1947 to 2015 in Pakistan resulted in a financial loss of USD 38.165 billion, over 12,000 casualties reported, and an affected land area of 616,598 km2 [4]. In India, extreme flood events, such as those in Uttarakhand in 2013, Chennai in 2015, and Kerala in 2018, have resulted in the deaths of thousands of people [5]. In 2017, a continuous spell of heavy rainfall in Bangladesh affected nearly 38 districts. Similarly, Indonesia remains susceptible to flood damages [6].
Flooding remains the foremost environmental hazard, threatens peoples’ lives, and results in significant economic damages. Due to their natural occurrence, it is impractical and economically unfeasible to eliminate or control floods. Therefore, the objective of flood management is to provide a reasonable degree of protection against flood-related harm while maintaining the environment and considering economic constraints. Structural flood management strategies encompass storage reservoirs, flood embankments, drainage channels, anti-erosion structures, channel improvement measures, and dikes [7]. Dikes, or groynes, are man-made hydraulic structures, typically used to diversify flow away from channel banks, protecting them from erosion [8]. Typically, dikes are made up of vertically built walls that are installed at an angle to the mean flow direction. Their primary function is to protect riverbanks by (i) directly redirecting the flow adjacent to the bank towards the mainstream and (ii) indirectly reducing the flow’s energy [9]. Dikes are the most hydraulically and economically efficient river training structures that can be constructed along channels’ banks to ensure their consistency, ensure a channel’s navigation potential, as well as contribute to the preservation of water quality and the restoration of the aquatic environment.
Local scour, according to fluvial hydraulics, is the process of removing silt from an alluvial channel. This geomorphic process significantly impacts various hydrodynamic structures, ranging from piers and abutments to embankments and waterways. It is acknowledged to be the primary cause of dike failures [10]. There are two main types of local scour: (i) live bed and (ii) clear water scour. In live bed scour conditions, sediment is carried downstream (d/s) side. Conversely, during clear water scour, there is minimal sediment movement across the streambed, except for slight displacement downstream and nearby the scoured structure [11]. Most research efforts have focused on the mechanisms of clear water scouring, as these are more commonly observed. Figure 1 illustrates a recent example of a clear water impermeable dike (IPD) failure that occurred during the 2010 flood in Pakistan, specifically near the Sangarh bridge in Taunsa, Punjab. The current study delves into such failures, which are attributed to clear water dike scour processes that are prevalent globally.
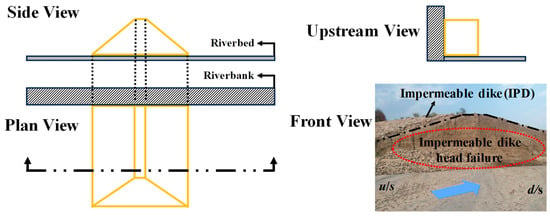
Figure 1.
Definition sketch of impermeable dike (modified from Kuhnle, R., & Alonso, C. [12]) failure due to high scour depth around dike’s head located upstream of the Sanghar Bridge in Taunsa, Pakistan, under non-submerged flood condition. While u/s and d/s stand for upstream and downstream.
Research on dikes in both meandering and straight rivers has been extensive, aiming to discern flow patterns, scour, and deposition in the vicinity of these structures [10,13]. Studies by Zhang et al. [14] and Pandey et al. [15] explored bed surface morphology and grain size distribution around an impermeable rectangular dike. Meanwhile, Zhang and Nakagawa [16] used laboratory experiments to investigate the different flow patterns and bed displacements between permeable and IPD. To estimate whether maximum scour depth under equilibrium conditions increased, we combined laboratory and field investigations with numerical simulations [15,16,17,18,19]. Accurately gauging scour depth () is vital for effective design, ensuring the safe hydraulic operation of dikes, especially during extreme weather. For feasible and efficient designs, the development of scour depth () is also crucial, especially for enabling the productive and safe hydraulic functioning of dikes, particularly in times of severe weather. A hydraulic structure is considered secure if the predicted scour depth is less than the foundation depth, considering a specific safety factor. Otherwise, it could endanger public safety, and it must be enclosed during severe hydrologic conditions [20]. Determining the necessity for repairs may also be made possible by understanding how long equilibrium scour takes to occur. To prevent or reduce severe local scour, two strategies are frequently used: the first is geometrical, i.e., nose shape, and the other is physical, such as permeability [21]. Studies by Iqbal et al. [22], Nayyer et al. [23], and Bahrami-Yarahmadi et al. [24] delved into various dike head shapes (rectangular, triangular, and circular) to minimize local scour around the IPDs. A dike can be designed as a permeable or impermeable structure based on the types of construction material used [25]. Alauddin et al. [26] investigated four different dike structures in the experimental channel, including bandal and modified combined structures. They suggested that an entirely blocked IPD suffers from structural instability, whereas a completely permeable structure cannot deflect the flow properly.
Currently, researchers have started to assess dikes by adding an extra hydraulic structure (permeable and impermeable parts) to protect the impermeable dike. In Table 1, a summary of previous studies related to a permeable dike and impermeable dike combined with circular piles can be observed. However, no research has been conducted on different pile shapes combined with impermeable dikes (IPDs) while maintaining the same dike length (named as combined dike) as a hybrid defense against high flood conditions, which could be an important area of research for high-scour-depth protection methods. To address this gap, experiments were conducted in the rectangular channel using a single dike with varying permeabilities. This study aimed to investigate the scour at critical locations, including the dike head, and its upstream and downstream wall junctions. Three shapes named angled plate footing, delta vane, and streamlined tapered were combined with the piles. The current investigation’s primary goal is to determine the impacts of a single dike by replacing the impermeable part of the dike with the specified number and shapes of piles to exhibit the flow structure, scour, and deposition patterns under a mobile bed condition. This knowledge is crucial for designing dikes capable of withstanding the powerful hydraulic forces associated with floodwater.

Table 1.
Previous studies related to a permeable dike and impermeable dike combined with circular piles.
2. Materials and Methods
2.1. Experimental Setup
2.1.1. Channel Characteristics
A real-scale experiment is the most appropriate way to investigate the scouring phenomenon [32,33]. Despite significant advances in numerical models, experimental research on scour remains the primary research strategy due to its accuracy [34,35]. A 5 m long, 0.7 m wide, and 0.5 m high glass-sided rectangular channel with a bed slope (constant) of 1/500 was utilized in Saitama University Japan. Figure 2a depicts a diagram of the experimental setup indicating all the experimental channel setups, and the scour measurement locations (AA/ and for contours). The channel’s length was categorized into two sections according to the position of the dike model. An electric pump, paired with a discharge meter, regulated the flow through the channel and pipe.
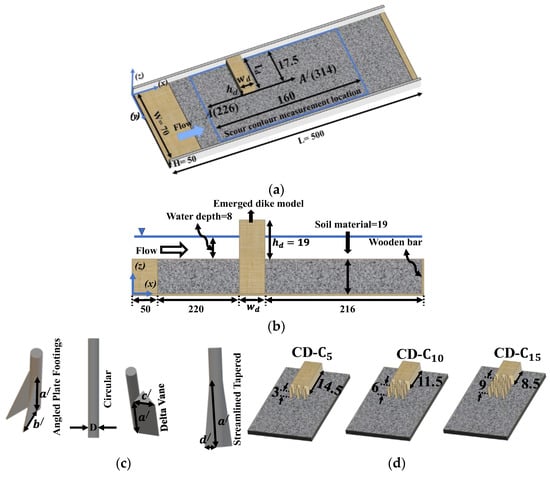
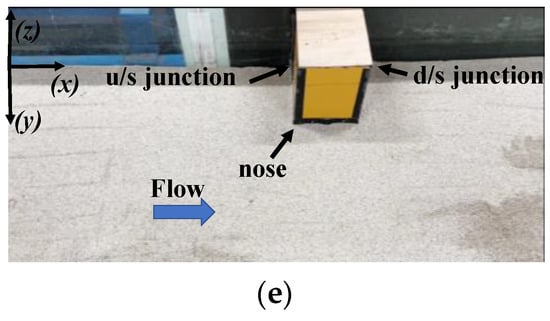
Figure 2.
(a) The experimental setup and scour measurement locations ( and contour plot) from an isometric perspective in which is the dike length, is the dike width, and is the dike height, while W, H, L are representing the channel width, height, and length (b) side view of experimental setup with dike model and movable bed condition (c) characteristics of pile shapes, while a/ = 20 cm, b/ = 2.25 cm, c/ = 2 cm, d/ = 1 cm, and D = 1 cm, (d) top view of combined dikes with pile arrangements (e) scour measurement locations, units are in cm.
2.1.2. Flow Conditions
The Punjab Irrigation Department, Punjab, Pakistan, collected field data for the past 59 years concerning the Froude number for the Taunsa barrage and Jinnah barrage situated on the Indus River [36]. For these experiments, the initial Froude number (Fr = V/(gh)0.5, where V is the depth-averaged velocity (m/s), g is the gravitational acceleration (m/s2), and h is the depth of water) was determined using these data. The calculation was based on the velocity and water depth in the clear channel. The observed Froude number range measured at Taunsa barrage was between 0.10 and 0.59, whereas at Jinnah barrage it ranged from 0.17 to 0.59. In every situation, the flow remained subcritical with Froude numbers below 1. Froude resemblance was used to set the model scale for this physical experiment [37]. To achieve the Froude number, several calibrations were performed in the experimental channel. Thus, an initial Froude number of 0.59 was finalized for the experiments, corresponding to a chosen water depth of h = 8 cm.
2.1.3. Properties of Soil
The movable bed in the experiment was composed of sand particles. The particles had a median grain size denoted as d50 of nearly 0.9 mm. The specific gravity of the sand was measured to be 1.68.
In this study, the scour mechanism’s similarity law with clear water conditions was considered because similitudes are essential and significant when conducting a certain design experiment, specifically for the correspondence of the water–soil bed association. Whenever a ridge exists downward of the scour, a clear water situation occurs; there is no sediment transport in the d/s direction aside from a local dispersion of sediment near and d/s of the scoured structure, it attains the final form, i.e., the developed stage [38,39,40]. Recent studies have also considered scouring under clear water conditions because it is commonly acknowledged that larger scouring occurs under such scenarios [34,41]. As a result, the sand particles decided to focus on the scour mechanism’s similarity law with clear water conditions. In the experimental channel, a sand bed of 2.2 m and 2.16 m at upstream (u/s) and d/s of the dike model, respectively, was established, covering 1/4th of the channel’s width and containing approximately 19 cm depth (Figure 2b). Furthermore, a wooden plate having the same depth as a moveable bed was inserted at the end of the channel (as a support) to prevent the material from being washed out during the experiment.
2.2. Dike Model and Pile Shape Designs
Apart from the Froude resemblance (noted in real floods), other factors, such as dike dimensions and pile diameter, were adapted and downscaled for a more accurate representation as these components are directly affected by the scour action during normal and flood seasons. To account for the possible sidewall effect, previous researchers restricted the length of the dike model to no more than 1/4th of the channel width [42,43]. The dike width was on a 1/30 scale based on the maximum flood level; it remained emerged throughout all the experiments. To make the permeable dike, same height circular cylinders made of wooden material with a 1 cm diameter were used (scale of 1/30) [44]. Furthermore, different pile shapes, such as angled plate footing (APF), delta vane (DV), and streamlined tapered (ST), were bonded with conventional circular piles (Figure 2c). After creating designs for these shapes using AUTO Desk Fusion 360, a 3D printer at Saitama University was used to acquire shapes with the required dimensions. The dimensions for these pile shapes were proposed by Aly et al. [45]. In the APF design, two plates are angled at 30 degrees that face towards the channel’s inlet. Each plate extends 2.25D () from the pier’s outer surface. The dimensions of DV for an apex to the opposing side and the length of that side are 2D (). A spinal rib with a length of 1.5D is additionally placed beneath the vane to provide support. The ST has the following dimensions: the total length and width of a sheath were 1D (), which are provided both upstream and downstream of the pile. Furthermore, the height of all shapes was kept constant, i.e., 20D. To make the permeable dike, different numbers of piles were used, keeping the same pile density as shown in Figure 2d. The piles’ density was calculated [43] using Equation (1),
where D, Sx, and Sy represent pile diameter and horizontal and vertical spacing between the two piles, respectively. Previous studies have emphasized that the λ can be used to represent the pile density for the combined dike. As a result, a pile density of 0.1 for 5 piles, 0.12 for 10 piles, and 0.125 for 15 piles was kept in a staggered arrangement (Figure 2d), which can greatly impact the flow behavior. To prepare the piles in the combined dike models, circular cylinders were drilled into a flat wooden plate and inserted into holes. The plate was subsequently mounted on the channel bed. The distance between each dike model and the experimental channel’s inlet was about 2 m, covering 1/4 of the crosswise channel width.
In this study, given the impact of dike permeability flow structure variation and scour reduction [26], three types of combined dikes were evaluated. By analyzing under the same flow conditions, a deeper understanding of the flow structure and scour behavior was sought. The dike’s arrangements and the distribution of the cases for the current study are detailed in Table 2. Additionally, for comparison purposes, a case with the conventional dike, i.e., IPD, was considered in this study. Consequently, this allowed for a comprehensive exploration of how different dike configurations responded to approaching flood flow conditions.
Table 2.
Hydraulic and geometric conditions.
2.3. Analysis and Scour Measurement
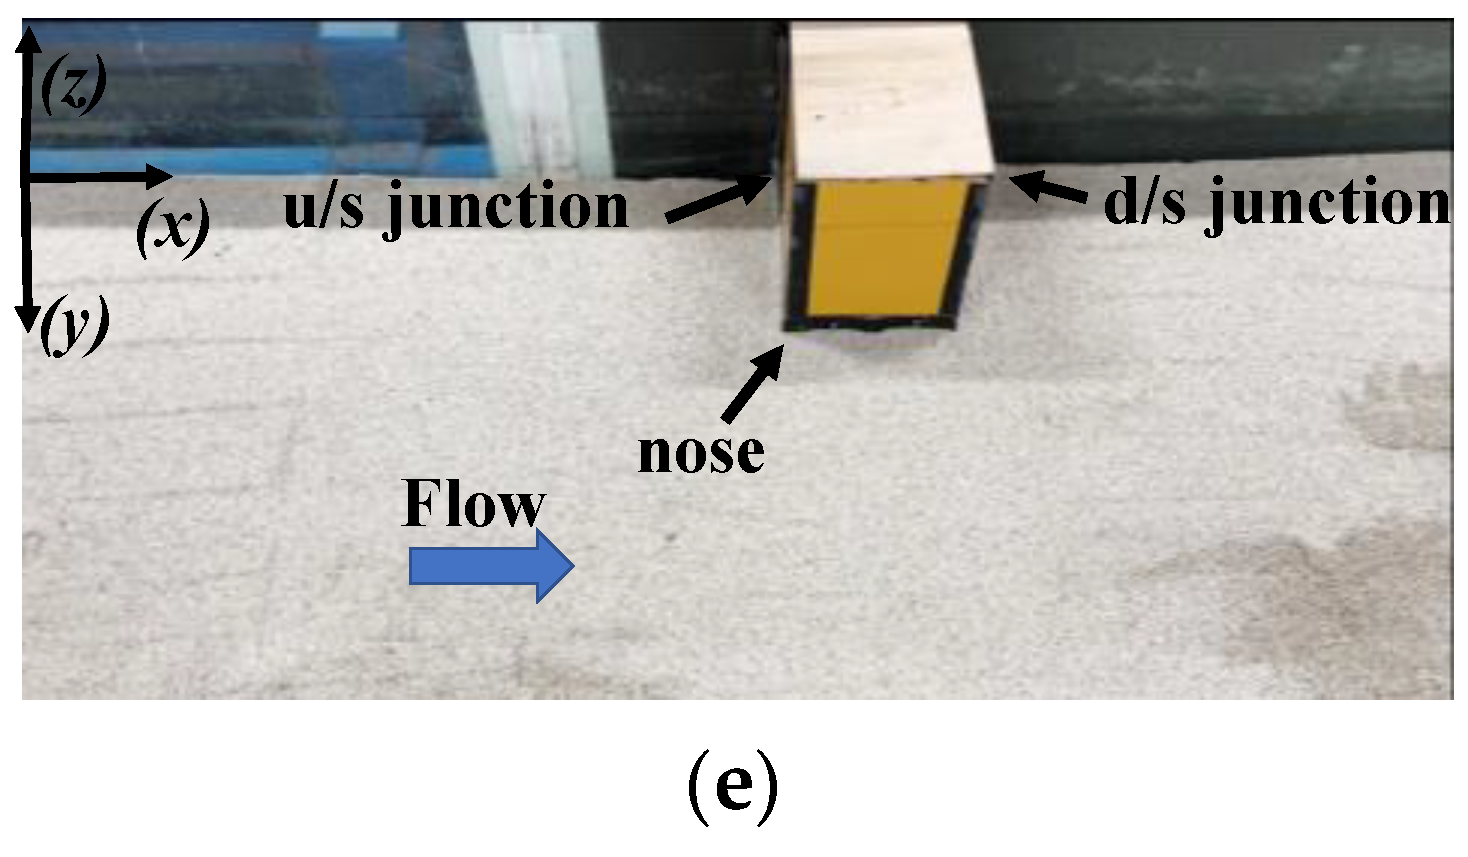
2.3.1. Scour Distribution
As the flow approached the dike model, the areas around it, especially the nose, experienced intense effects, leading to soil erosion and the formation of scour hole. The bed profile was captured before running the flow (Figure 2e) to calculate the distinction between that profile and the one obtained after the flow had crossed through a dike model. Upon concluding each experiment, a Keyence2D LASER terrain displacement gauge (model: LJ-V7300, by Tokyo, Japan) was used to calculate the bed profiles, capturing both scour and deposition characteristics properties. The LJ navigator was utilized for acquiring the scour profile data, which were subsequently processed using FORTRAN to derive the definitive values of the scour depths. This 2D laser displacement gauge was attached to the computer, allowing for the efficient recording and representation of the gathered scour data, ultimately leading to the creation of detailed scouring profiles.
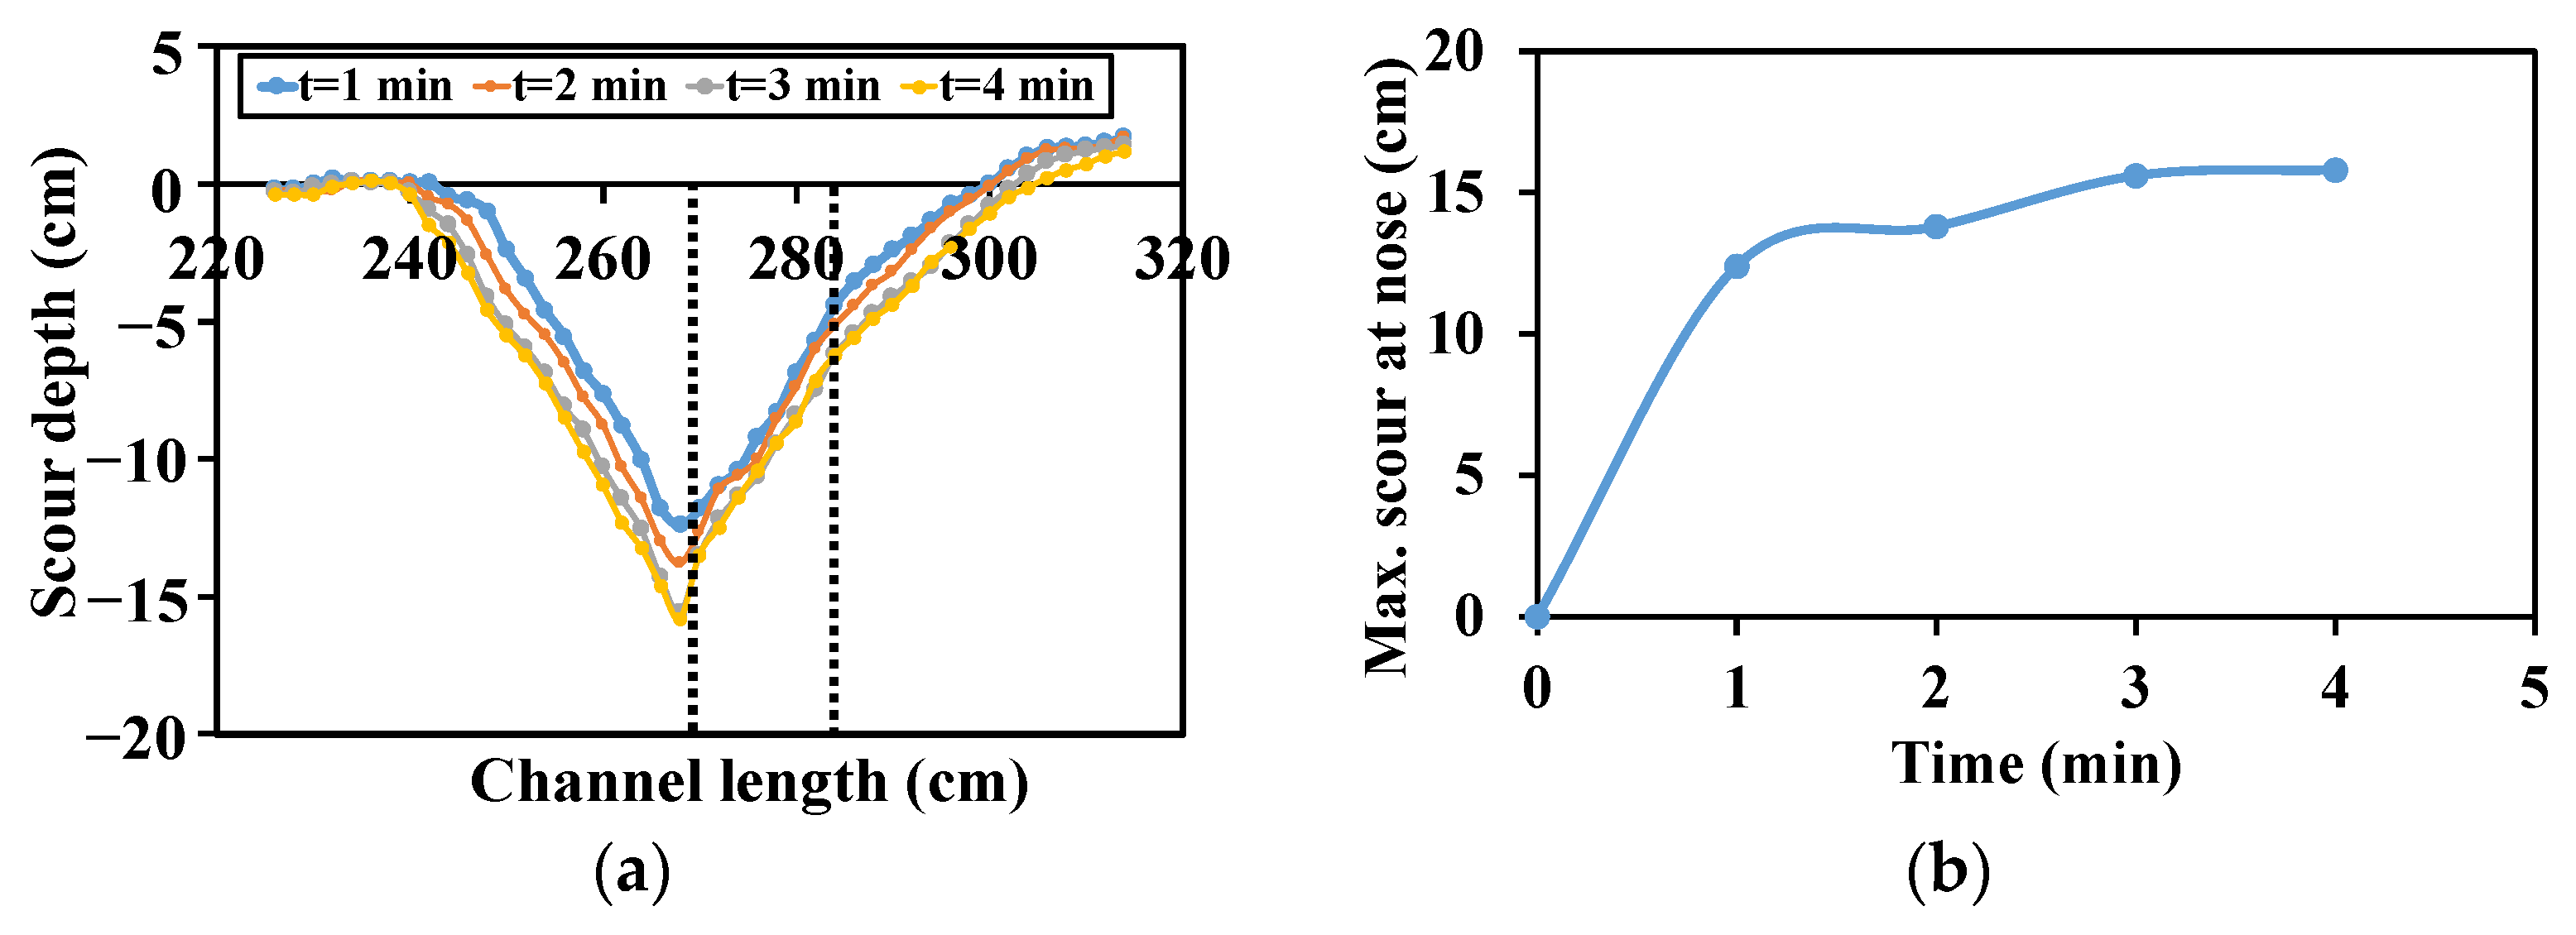
2.3.2. Variation in Scour Depth over Time around an Impermeable Dike
The area around the dike experienced rapid scouring at the start of the flow. This rate of change then slowed over time, with the rate of scouring dimensioning significantly as time passed. As observed in various studies, the evolution of the scour profile and the scoured area is time-dependent [46]. Hence, to make sure of the equilibrium condition in general, a developed stage of scour was expected to be achieved in this study. For the calibrations, four flow durations of 1 min to 4 min (scale model) were considered. Figure 3a,b depict the time-series data of scour evolution versus the defined Froude number, i.e., Fr = 0.59. The scour characteristics in streamwise (Figure 3a) as well as the optimal depth of scour around IPD (Figure 3b) were found to be uniform (developed) after 4 min of flow duration, with no notable variations in the scour properties revealed by data analysis and visualization. Therefore, in subsequent experiments, a 4 min flow duration was chosen.
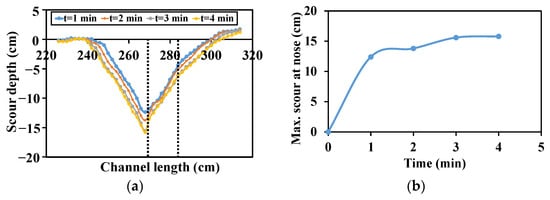
Figure 3.
Time-series data capturing the evolution of scour in relation to the selected Froude number, Fr = 0.59 at the front of dike model (AA/): (a) streamwise scour profile (dotted line represents the location of dike), and (b) maximum values of scour.
3. Results
After the propagation and arrival of the modeled flood flow, the approaching flow was significantly slowed by the dike model, resulting in different flow features for the various dike model layouts. The observed variables must be quantified to evaluate the efficacy of the defense structure. Consequently, an examination of flow structures and bed variations was conducted to simulate the corresponding phenomenon and ascertain the subsequent parameters.
3.1. Flow Structures
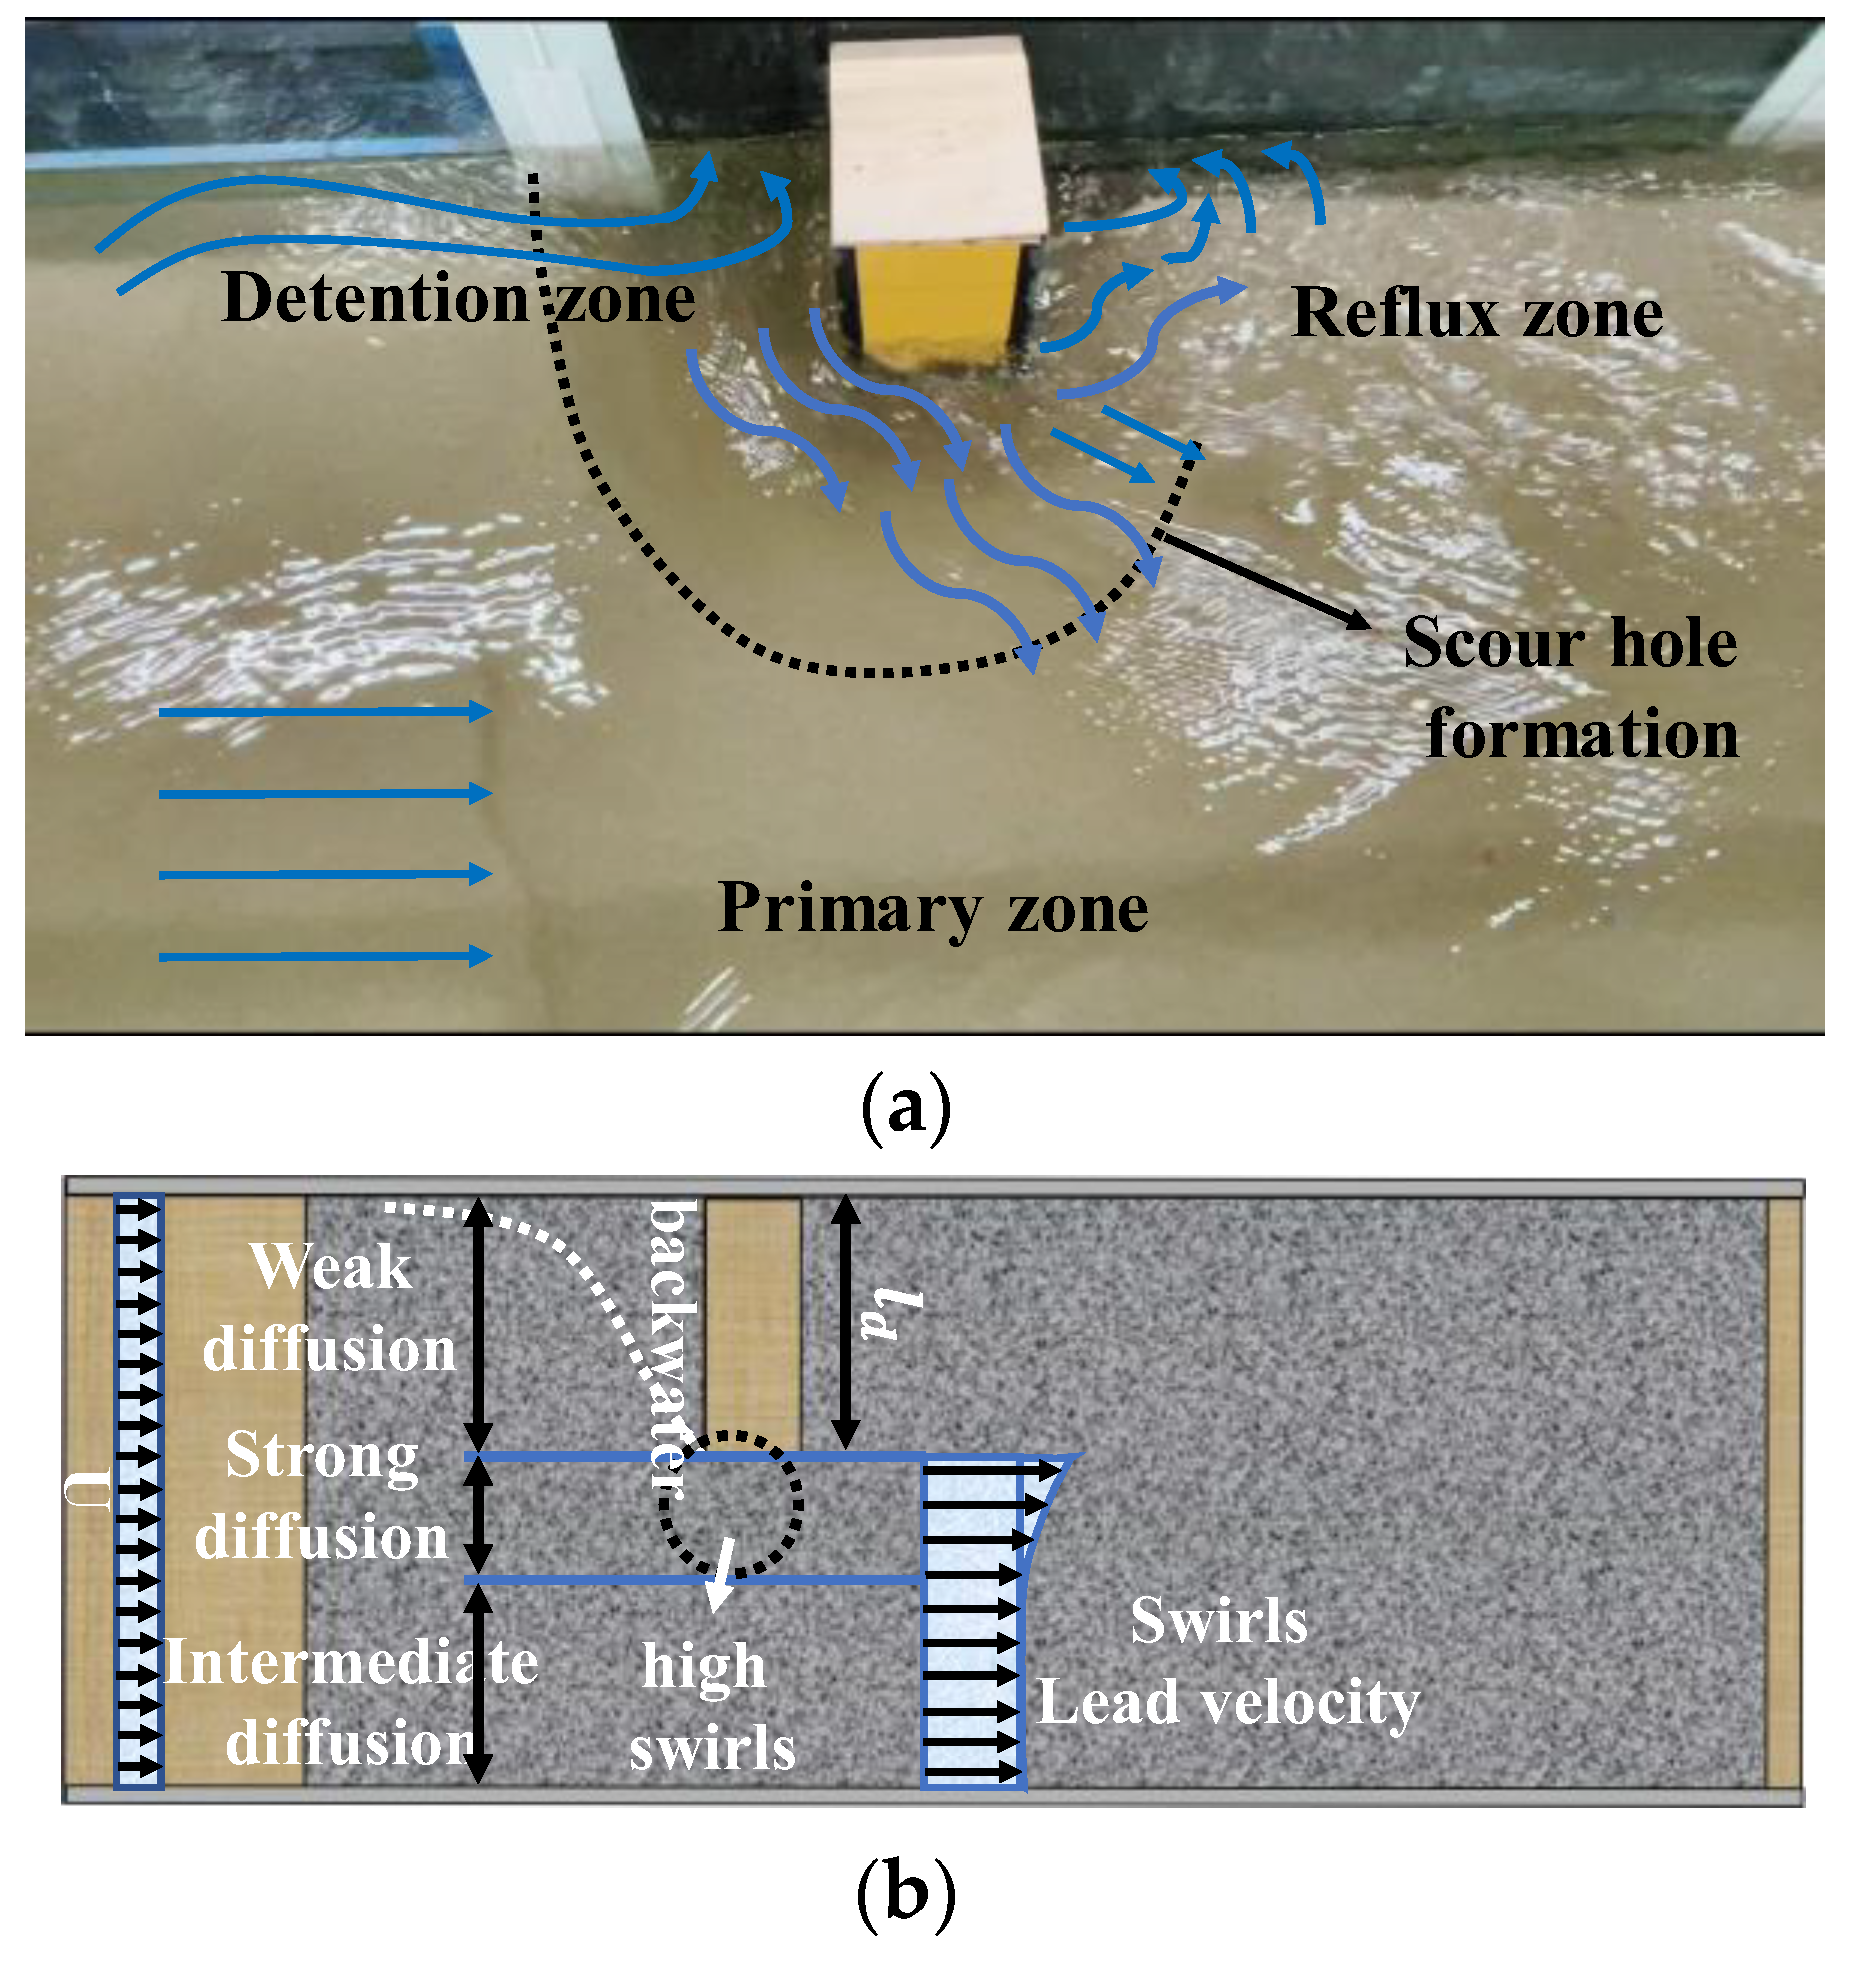
Figure 4a,b depict the formation of various flow zones resulting from the presence of a single dike. Each scenario observed substantial drag at the dike nose, splitting the flow into three distinct zones: primary, detention, and reflux zone, as shown in Figure 4a. The primary, irrotational flow mainly occurs between the dike’s nose and the normal waterway. The flow is obstructed and reflected as detention flow disperses on u/s of the dike, generating a backward, rotational flow. Figure 4a shows how flushing can block u/s water and erode the waterway. The longer the impermeable part, the greater the scour due to the high heightened detention region concentration, especially for IPD and CD combined with five piles [47,48]. Initially, the flow intensely concentrates around the head at the dike’s nose and divides into primary and reflux flows d/s of the dike. As the reflux flow disperses on the dike’s d/s side, water level and pressure in the d/s area drops. Most of the primary flow bypasses the dike head and returns, indicating a rotational flow. Yet, as flow begins to pass through the combine dike, rotational flow in detention and reflux zones transitions into a parallel streamline [8].
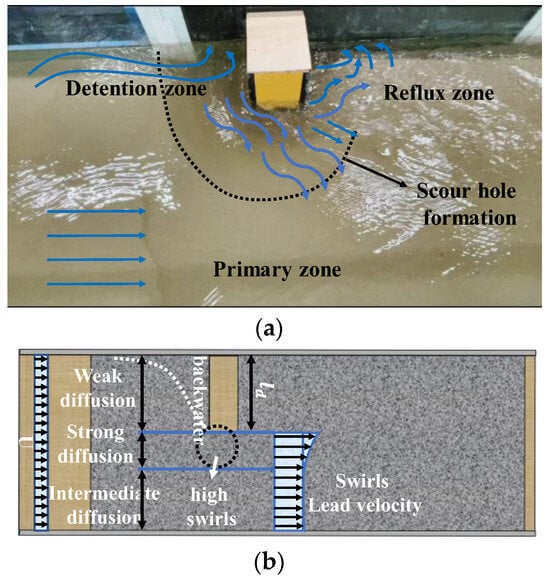
Figure 4.
(a) Flow zones formation in the presence of single dike; (b) location of high swirls formation with different diffusions.
The water flows around the dike’s head, splitting at the u/s side of the breakwater side and the flank of the dike. This separation results in a powerful swirling system above the vertical axis, which then extends into the d/s reflux zone. Owing to the negative pressure at the swirl’s center, sediments from the riverbed are lifted and transported to the d/s reflux zone. This dynamic creates an erosion pit near the dike’s nose, with sediment accumulating in the reflux zone, as illustrated in Figure 8a. High-intensity swirls form around a single dike, causing maximum flow diffusion near the dike’s nose, termed as strong diffusion (Figure 4b). Depending on the dike’s length, weaker diffusion swirls also emerge. As permeability increases from 5 piles to 15 piles, these variations transition to an intermediate state.
Swirls were consistently observed where the flow separated from the dike’s u/s left side. When flow becomes restricted on the u/s of the dike, a high-velocity zone forms in its direction. The bed near the dike’s nose, subjected to wash erosion, was most impacted by these swirls and reflux actions. The bed profile indicated varying degrees of scouring at the u/s and d/s dike junctions. Most notably, significant scouring occurred around the dike’s nose, followed by sediment deposition just behind the dike. The magnitude of these effects was influenced by the dike’s permeability and pile shapes. The d/s area of the dike was likewise affected. To fully grasp the combined dike’s effects, it is crucial to quantify scour characteristics, like scour distributions, and scour hole dimensions, focusing on dike permeability and pile shapes.
3.2. Scour Characteristics
3.2.1. Scour Maps of Impermeable and Combined Dikes
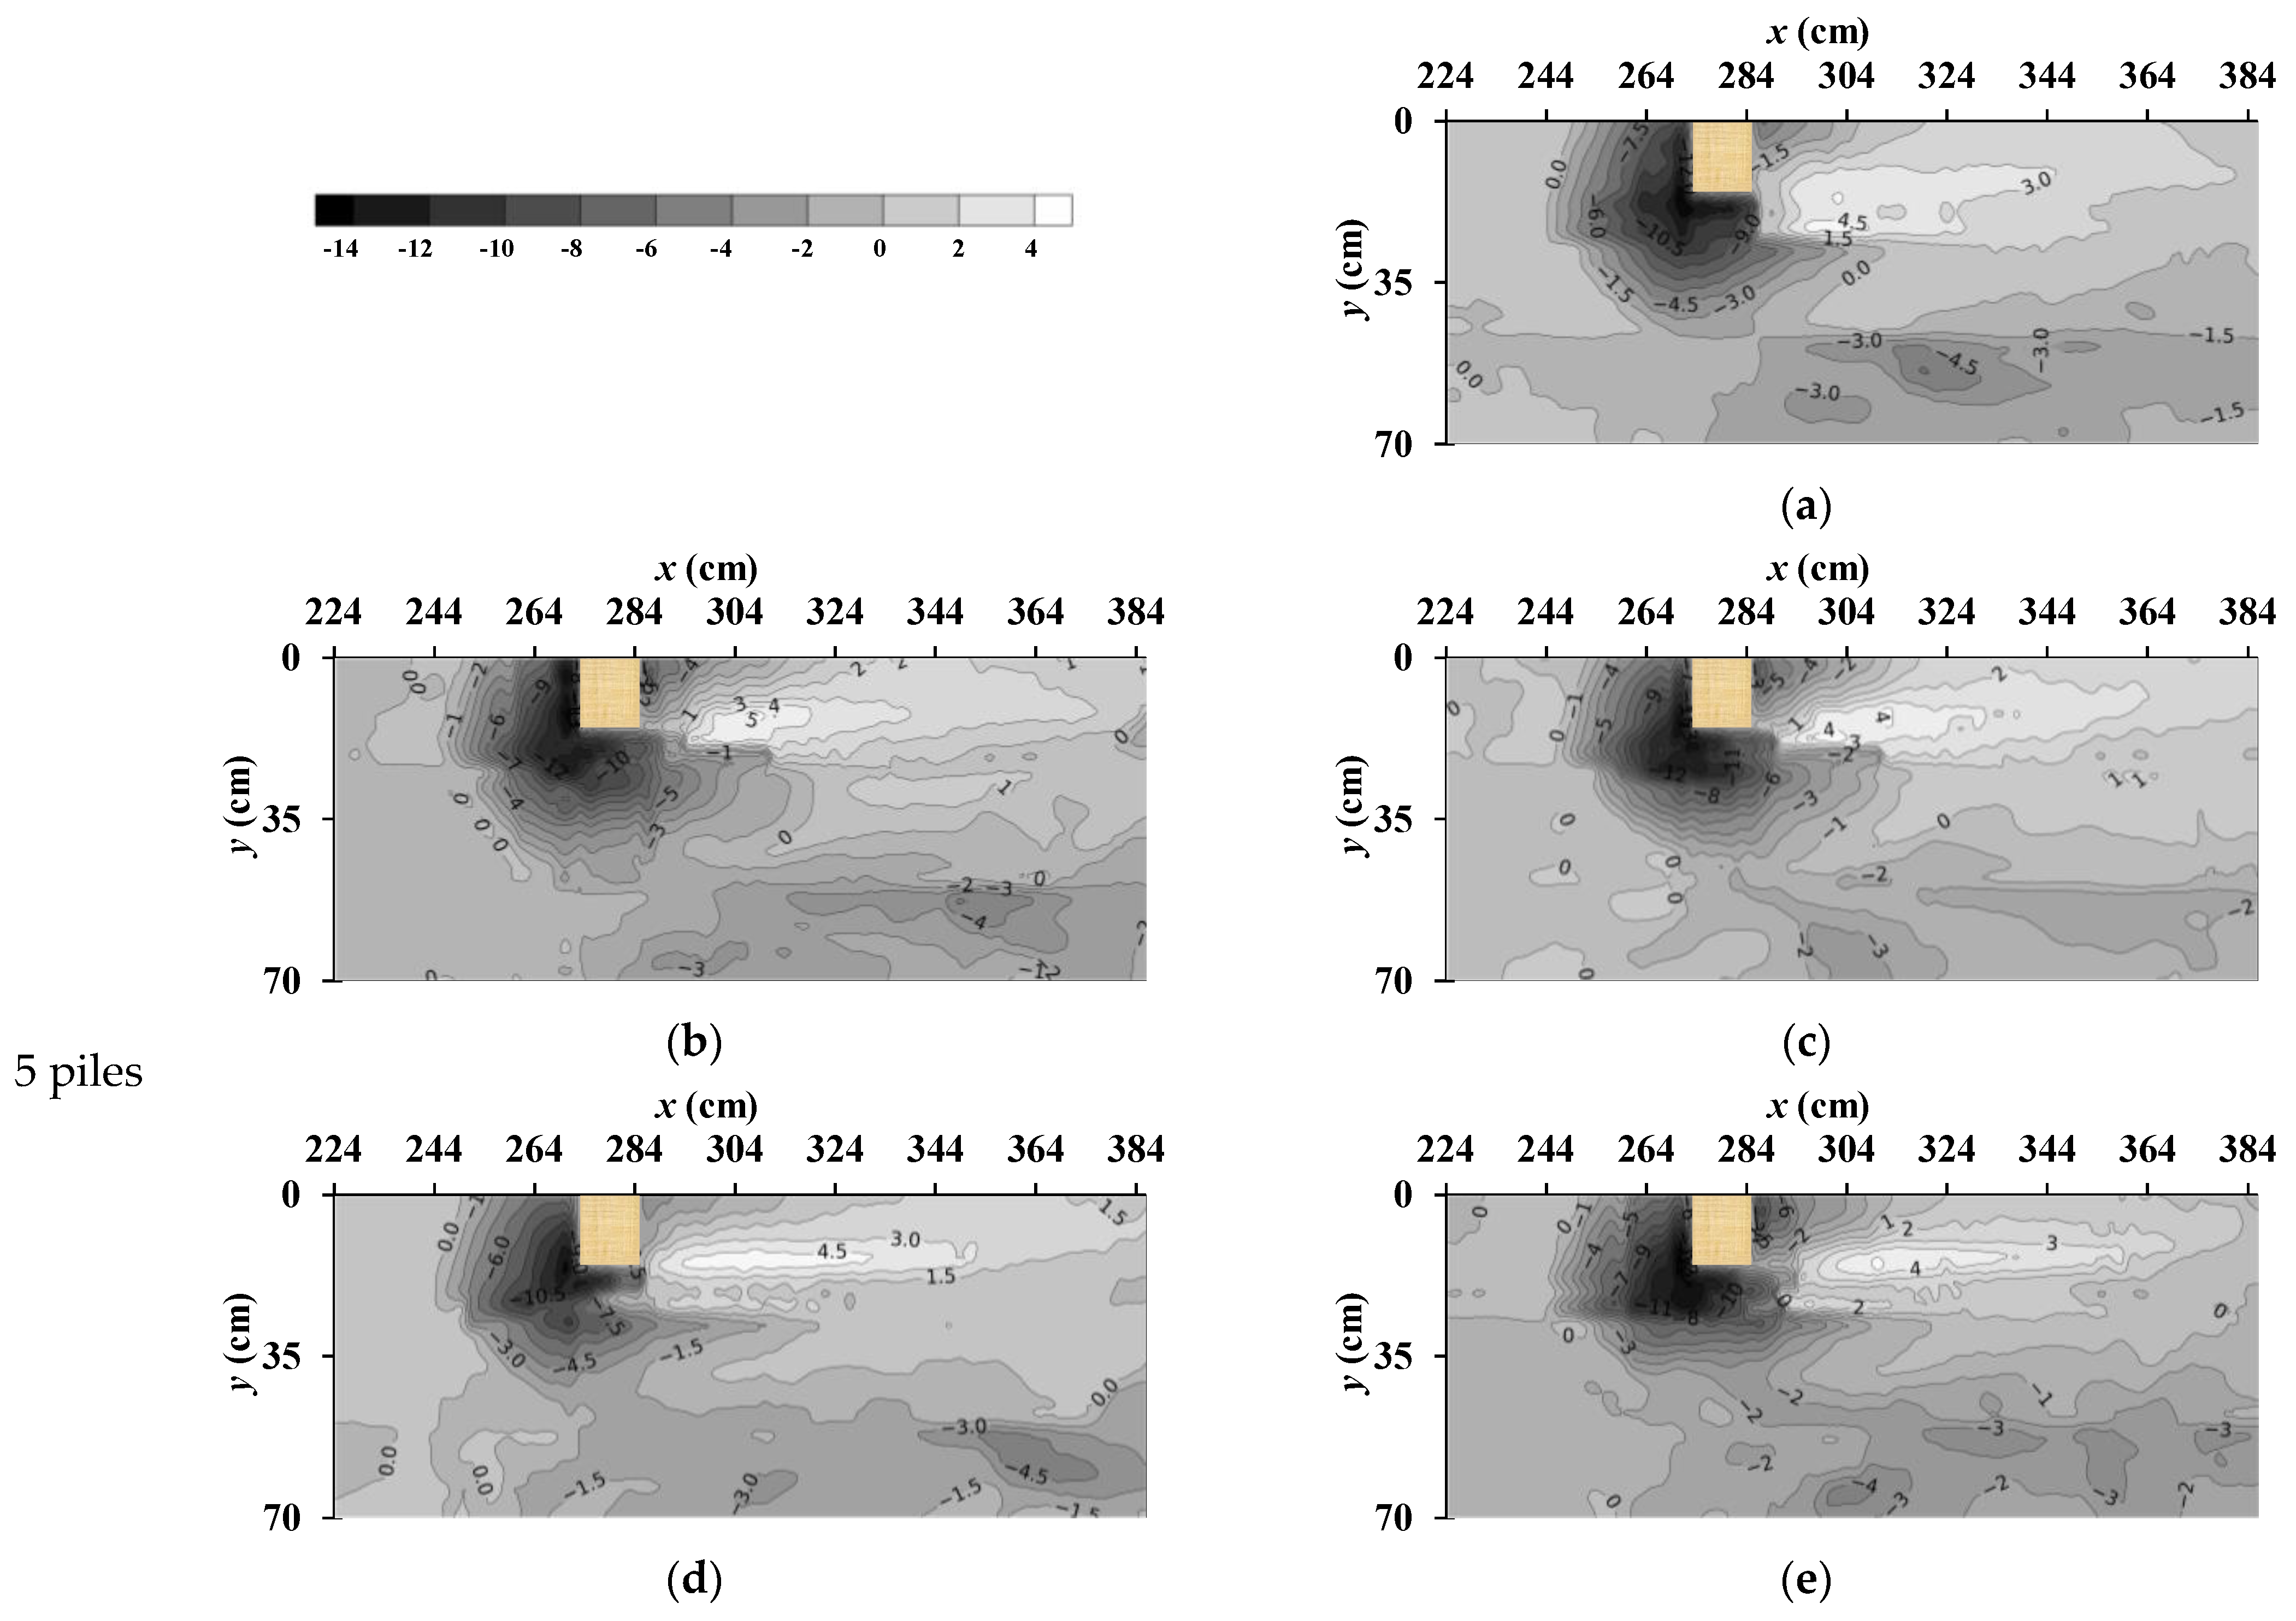
Figure 5 depicts the final scour and deposition contours for the various dike configurations examined. The horizontal axis represents the channel’s length along the flow direction, with the range 47–61 cm indicating the dike’s location. The vertical axis represents the channel’s width. Deposition and scouring are indicated by positive and negative values, respectively. At the dike’s nose, the highest possible scour depth was noted, while deposition was occurring just d/s of the dike. The sediment deposition level relied on the ratio of scour at the dike’s tip [24]. Among the configurations, the IPD case exhibits the highest scour and deposition depth, whereas the presence of various combined dikes with different pile shapes leads to reduced scour and deposition depths. The contour plots in Figure 8 confirm the results of reduced high-energy swirls with increased permeability, specifically for CD-ST15 when compared to other combined dikes. Section 3.1 already explained why the minimum high-energy swirls were generated around combined dikes. These findings are consistent with previous research findings [49,50].
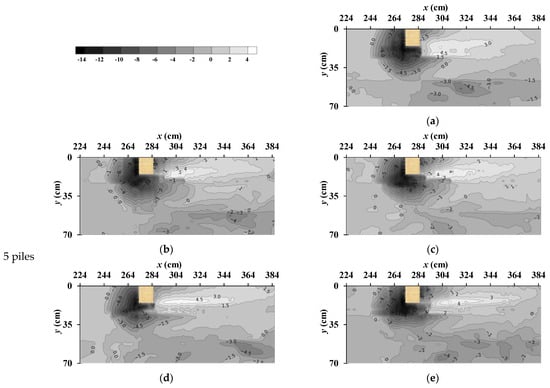
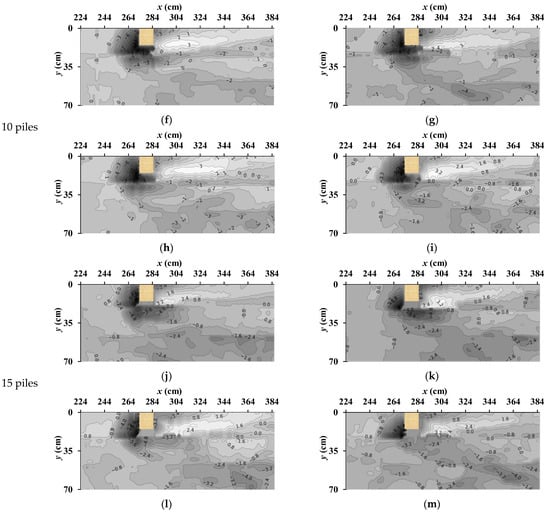
Figure 5.
Scour distribution depicted in contour plot against selected Froude number, i.e., Fr = 0.59 for (a) IPD and each permeability, 5 piles (b–e), 10 piles (f–i), and 15 piles (j–m) combined with APF (b,f,j), C (c,g,k), DV (d,h,l), and ST (e,i,m).
In all cases, it is evident that the region just in front of the dike model, i.e., a 35 cm region in cross streamwise direction (), was more prominent, where greater values of scouring were observed. The bed scour’s spatial distribution reveals that it reaches its maximum (excessive) ranges at the dike nose, and deposition at just d/s of dike occurred in the CD of 5 piles and 10 piles compared to 15 piles. Therefore, during high flood conditions, the excessive scouring at the dike head may lead to dike structure washout (that may additionally result in secondary harm to adjacent bank failure due to erosion) [12].
3.2.2. Maximum Scouring near the Dike Model
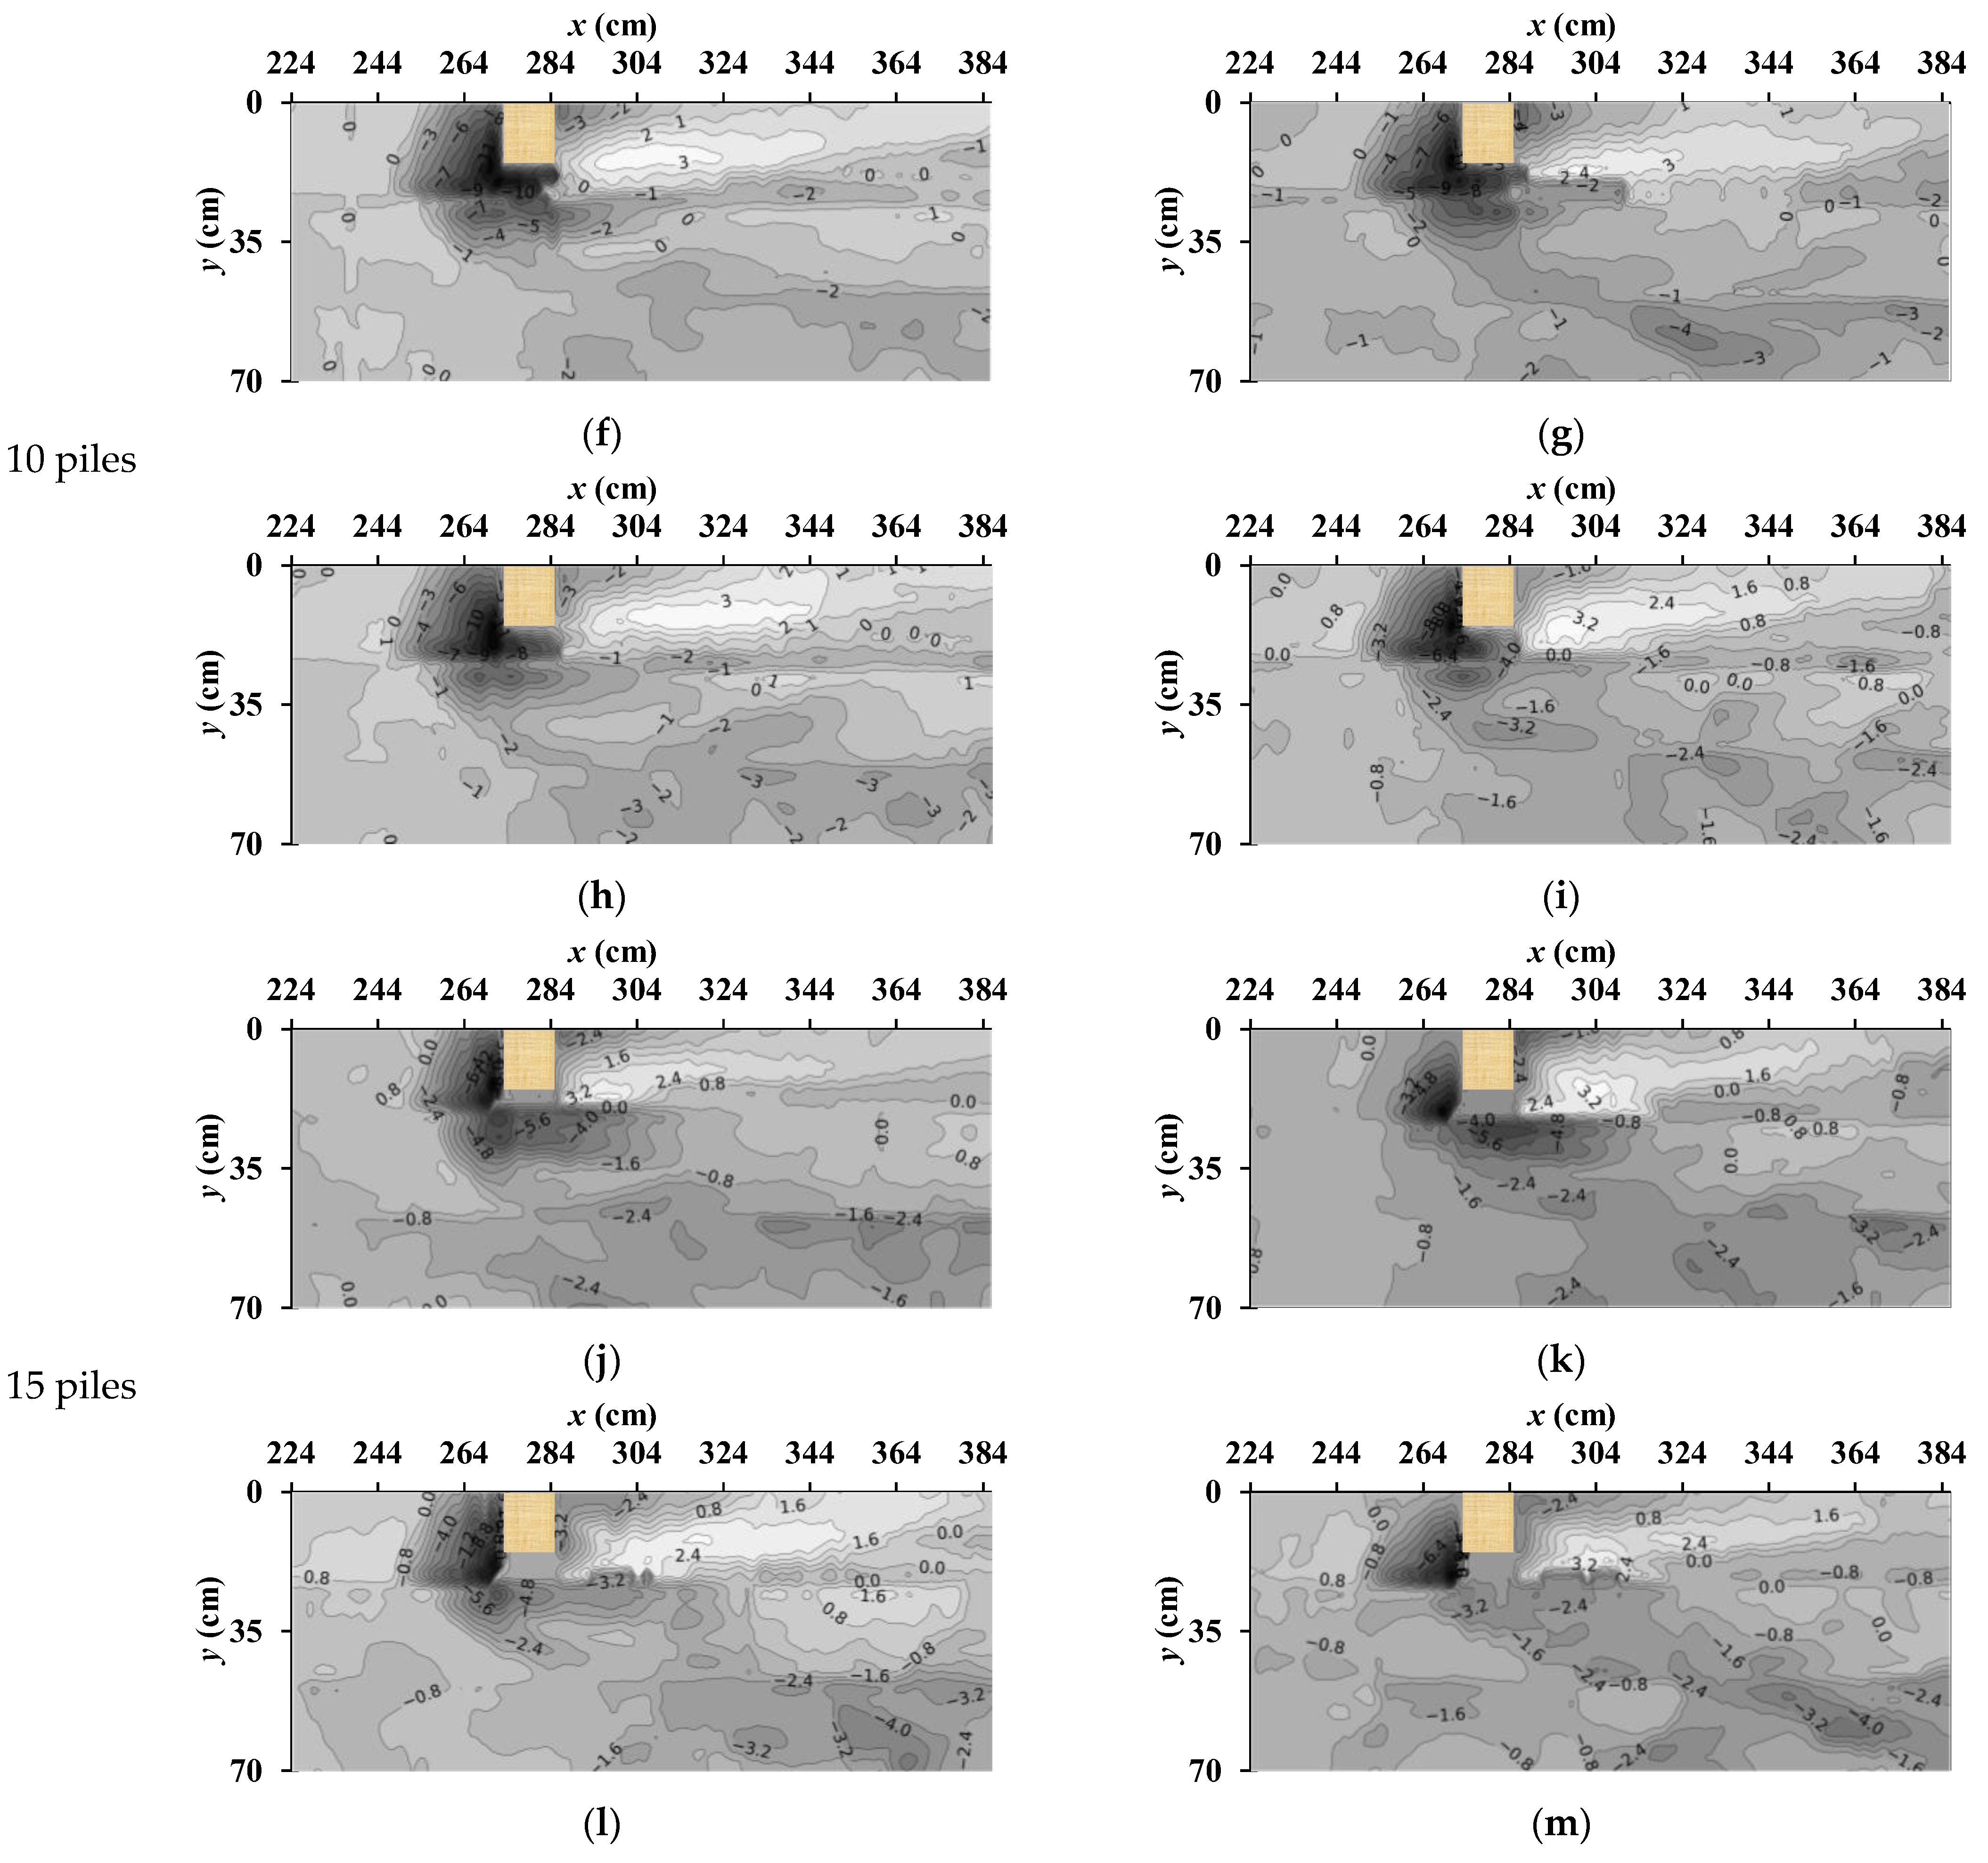
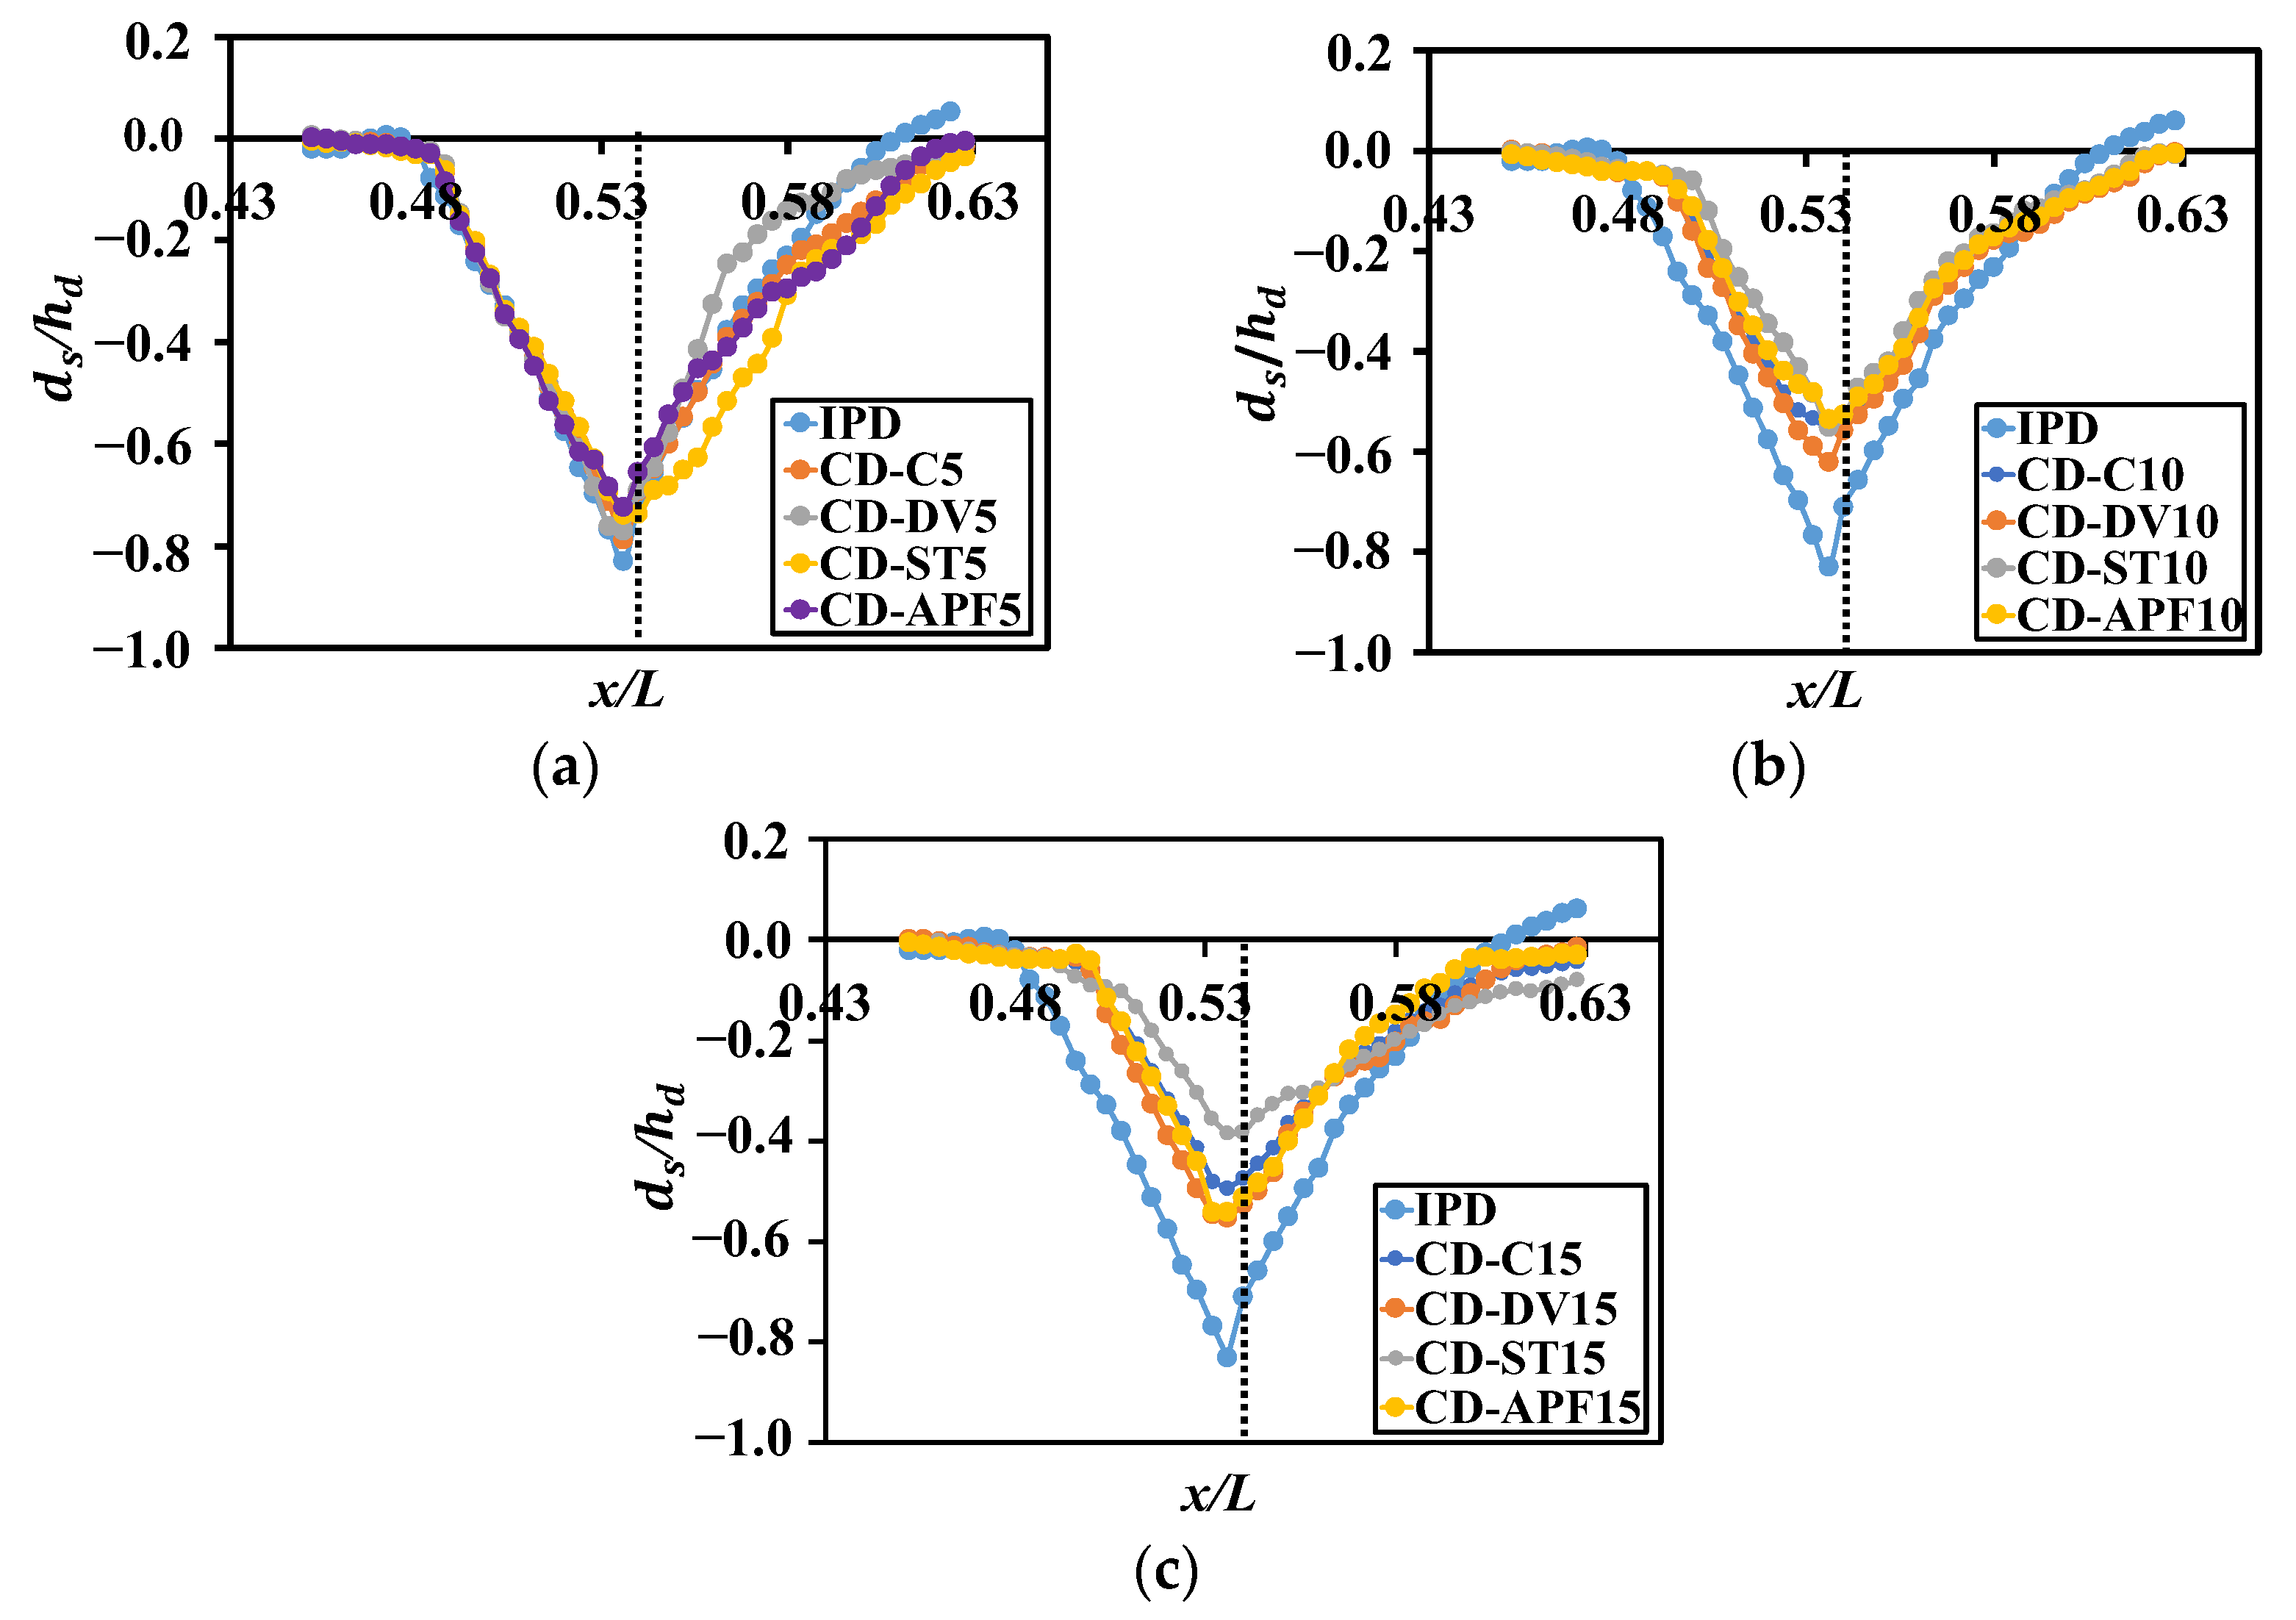
The scour properties were examined to assess the key variables such as maximum scour in front of the dike model. Figure 6a–c depict the scour depth () measurements taken in the streamwise direction through the location (Figure 2a). Maximum scour results for various pile shapes with varying permeability have been plotted against dimensionless and to obtain good knowledge of the interaction between / and permeability and pile shapes, respectively. Furthermore, the x axis was dimensionless relative to the total channel length (L). The highest magnitude of scour was observed for the IPD, CD-DV5, and CD-ST5, the difference in which was observed to be strongly influenced by impermeability and pile shapes. The maximum scour depth offered by IPD decreased with an increasing pile number (10 to 15) because a flow that is approaching has a higher Froude number, meaning that it has an accelerated flow velocity, though this decreases with an increasing pile number. Pile shapes, specifically ST and APF, performed better when combined with 5 piles than the case combined with 15 piles. Among them, the CD-ST15 produced the smallest scour hole depth compared to CD-ST5 and CD-ST10, because the combined dike with 15 piles enables maximum flow passage, while the smallest scour depth is achieved by ST due to geometric parameters. The greater magnitude of scour depth with maximum IPD length (17.5 cm) makes sense because considering flows with relatively high Froude numbers have accelerated flow rates [51], that also intensifies the shear stress trying to act on the bed, leading to the formation of a deep scour hole. This observation is corroborated by recent studies [11,52,53].
Figure 6.
Resulting bed profiles of combined dikes at location AA/ for (a) 5 piles, (b) 10 piles, and (c) 15 piles. The dotted line represents the location of dike’s nose. Where IPD stands for impermeable dike.
3.2.3. Scour Depth at Dike–Wall Junctions
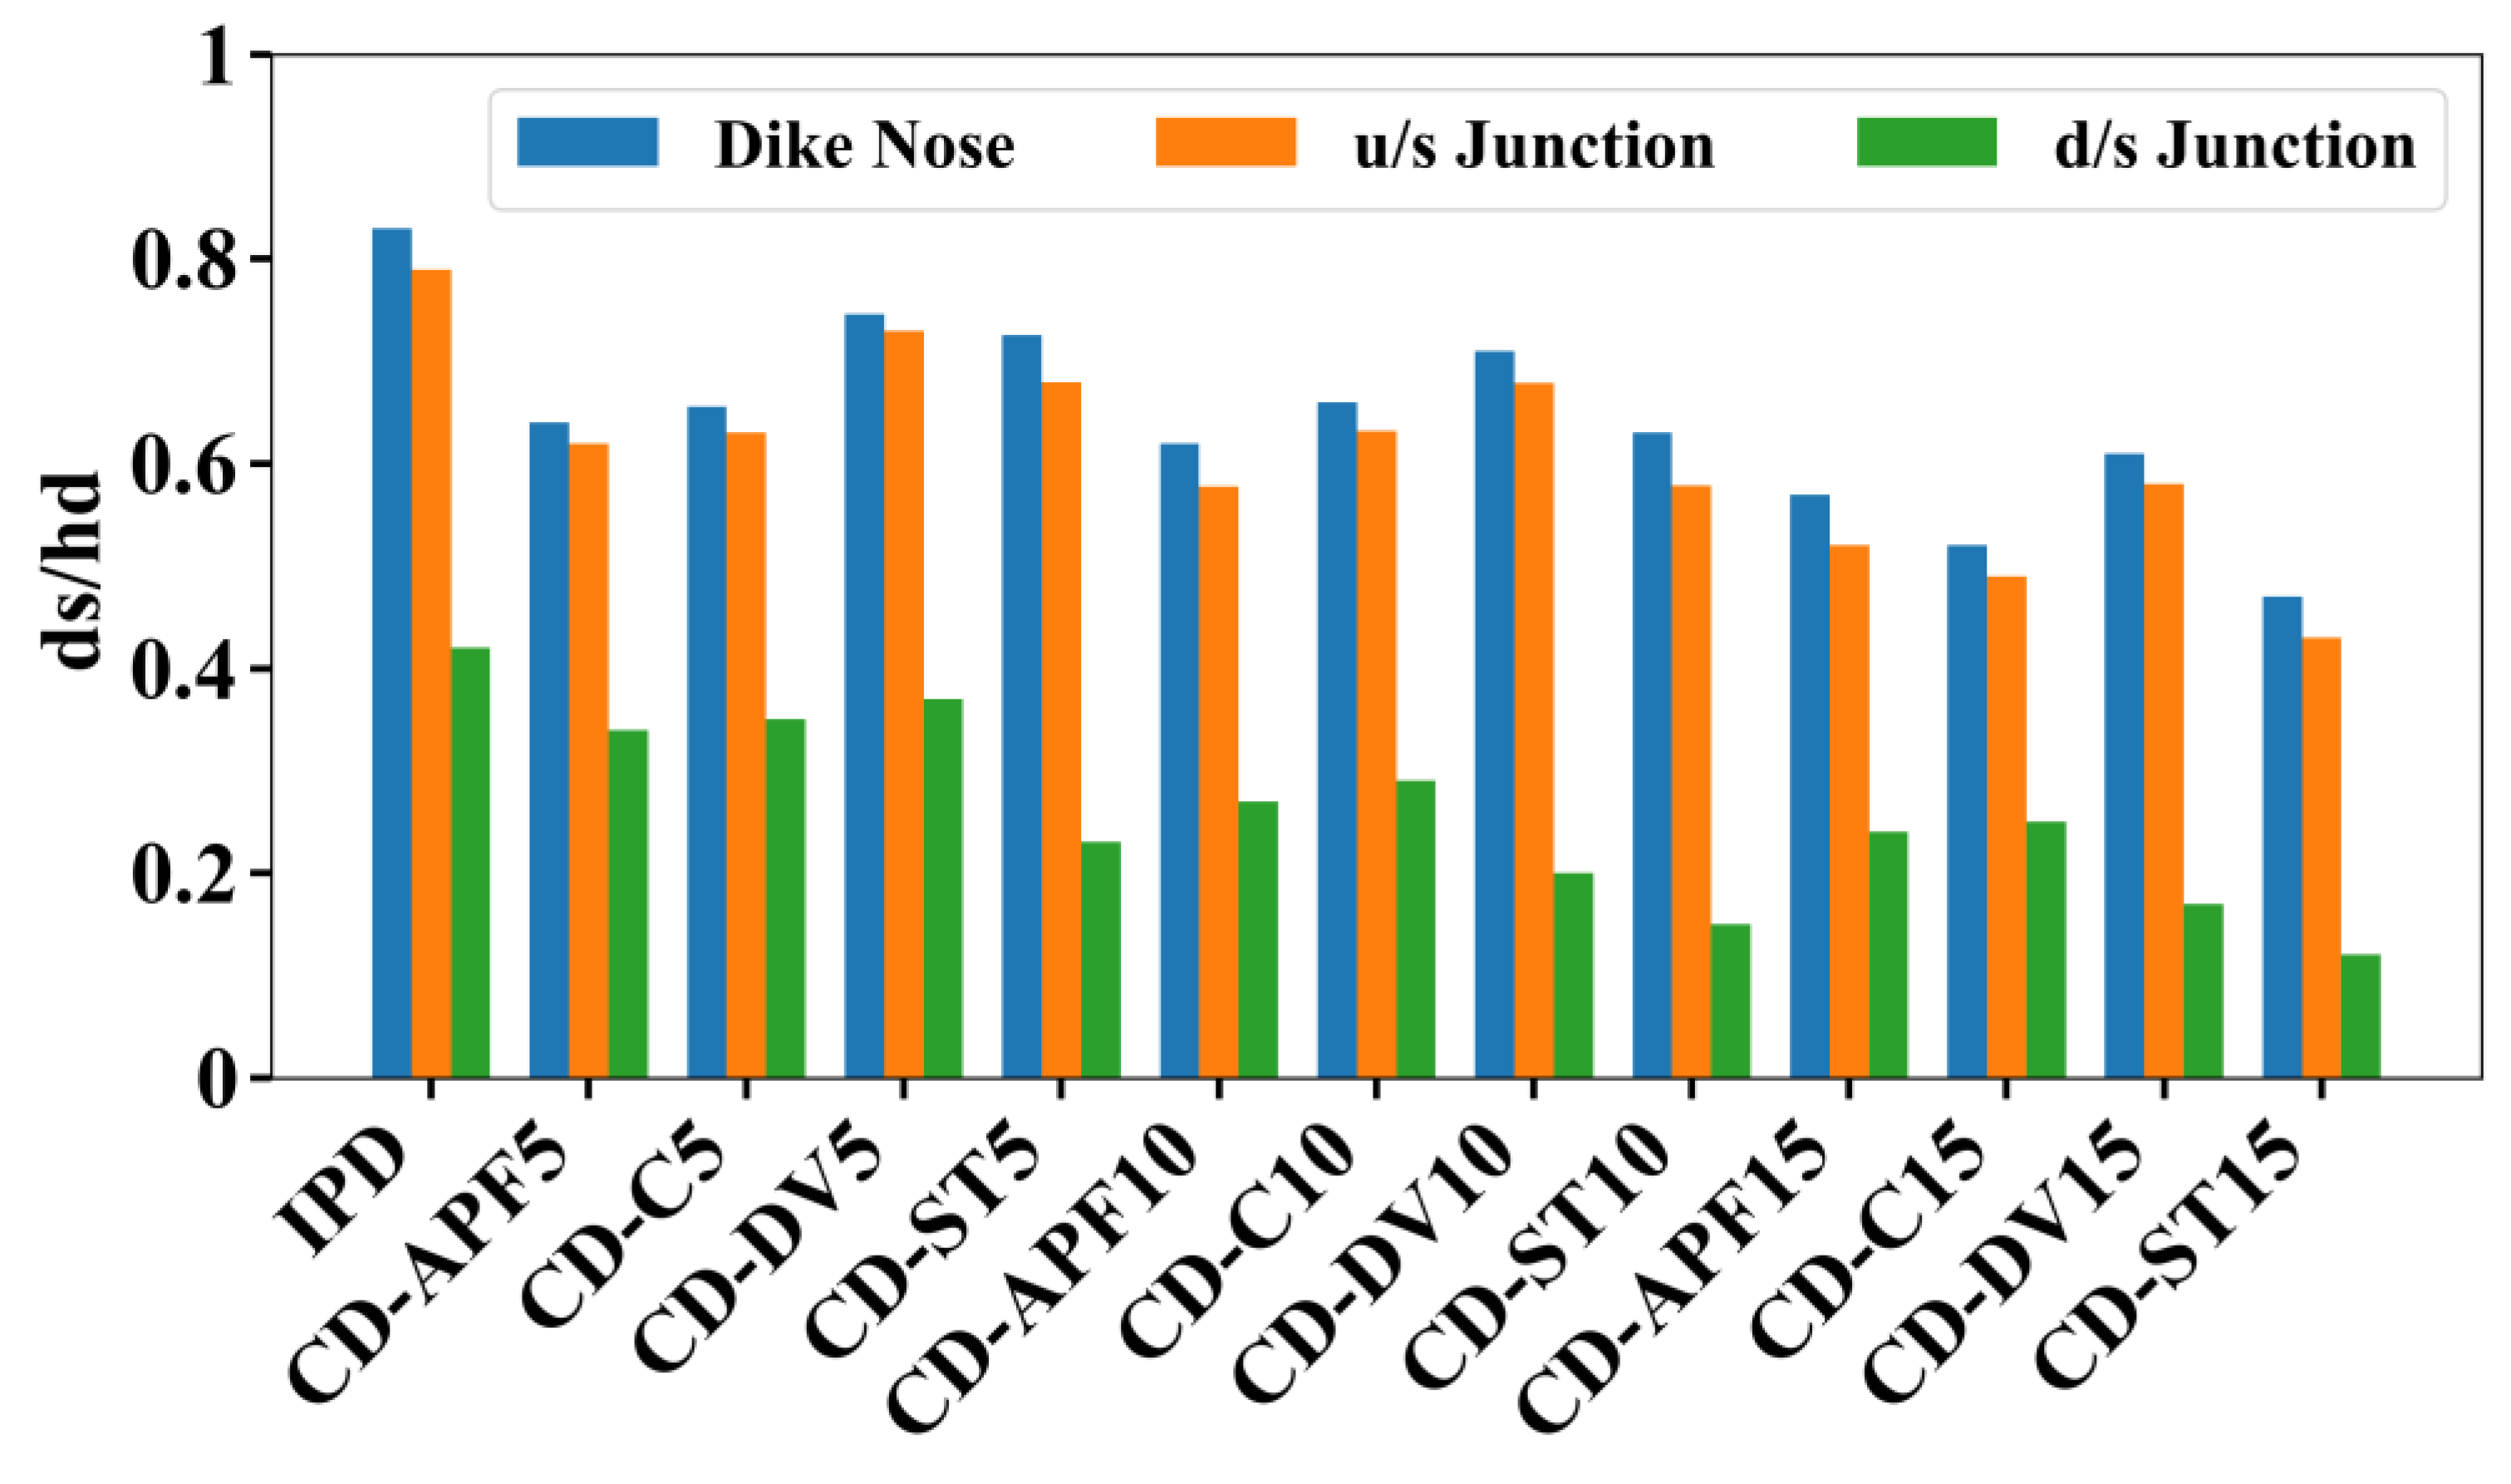
Clearwater scour depths were measured at the dike nose and both u/s and d/s dike–wall junctions using different dike models. Figure 7 depicts an assessment of scour depth variation at the dike’s nose as well as u/s and d/s dike–wall junctions. The vertical axes in this figure represent the nondimensionalized scour depth (, where is scour depth and is dike height) at the nose and u/s and d/s dike–wall junctions against various types of combined dikes. The scour fluctuation at the dike’s nose is consistently higher than at the upstream dike–wall junction, while the scour variation at the upstream dike–wall junction is consistently greater than at the downstream dike–wall junction. When DV was combined with all types of the combined dike, it showed maximum scour depth at both locations, i.e., nose and the u/s dike–wall junction of the dike. The DV exhibits a divergent shape beginning at its nose, as depicted in Figure 2c. As the flow approaches the DV, a pronounced shear layer appears on both sides due to the flow being constricted between the two DV piles. This characteristic leads to an inability to mitigate scouring at specific sites, particularly at the dike nose and the u/s dike–wall junction, while the minimum scour depth at defined locations was generated by ST when combined with 15 piles. Overall, the scour depth variation for different pile shapes was more prominent in 15 piles CD compared to 5 and 10 piles.
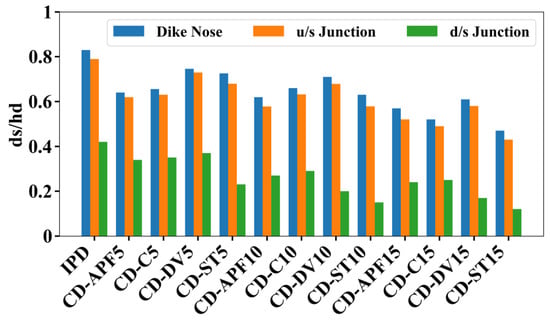
Figure 7.
Maximum dimensionless scour depth at dike’s nose, upstream junction, and downstream junction of combined dike.
The impermeable portion appears to have had a significant impact on the magnitudes of maximum scour depth at the dike’s nose (Table 3). In Table 3, it can be observed that with the increase in permeability from 5 piles to 15 piles, the scour reduction also increased [21,49,54]. However, CD-APF5 and CD-APF10 give a 23% and 26% reduction, respectively, while CD-ST15 gives a maximum (43%) scour reduction compared to the IPD. The geometric parameters of CD-APF5 and CD-APF10 help to trap the sand particles in the u/s direction, which helps to reduce the scour in front of the dike’s nose [39]. At u/s, CD-APF5 and CD-APF10 give reductions in scour depth of 21% and 27%, respectively, while CD-ST15 (45%) and CD-C15 (38%) performed better compared to CD-DV15 and CD-APF15. The geometric parameters of APF and DV combined with 15 piles (minimum IPD length) showed higher turbulence, which ultimately caused higher scour depth compared to CD-C15 and CD-ST15. On the d/s dike–wall junction, scour depth reduction was 46% for CD-DV5 and 19% for CD-APF15, respectively. After increasing the permeability, the reduction was further increased to 64% and 65% for ST and 52% and 54% for DV when combined with 10 and 15 piles, respectively. For any given test case, the scour depth ratio decreased as permeability increased; however, with an increase in the number of piles, specifically 10 piles and 15 piles, the scour depth ratio decreased significantly.
Table 3.
Maximum scour depth reduction.
3.2.4. Scour Hole Dimensions
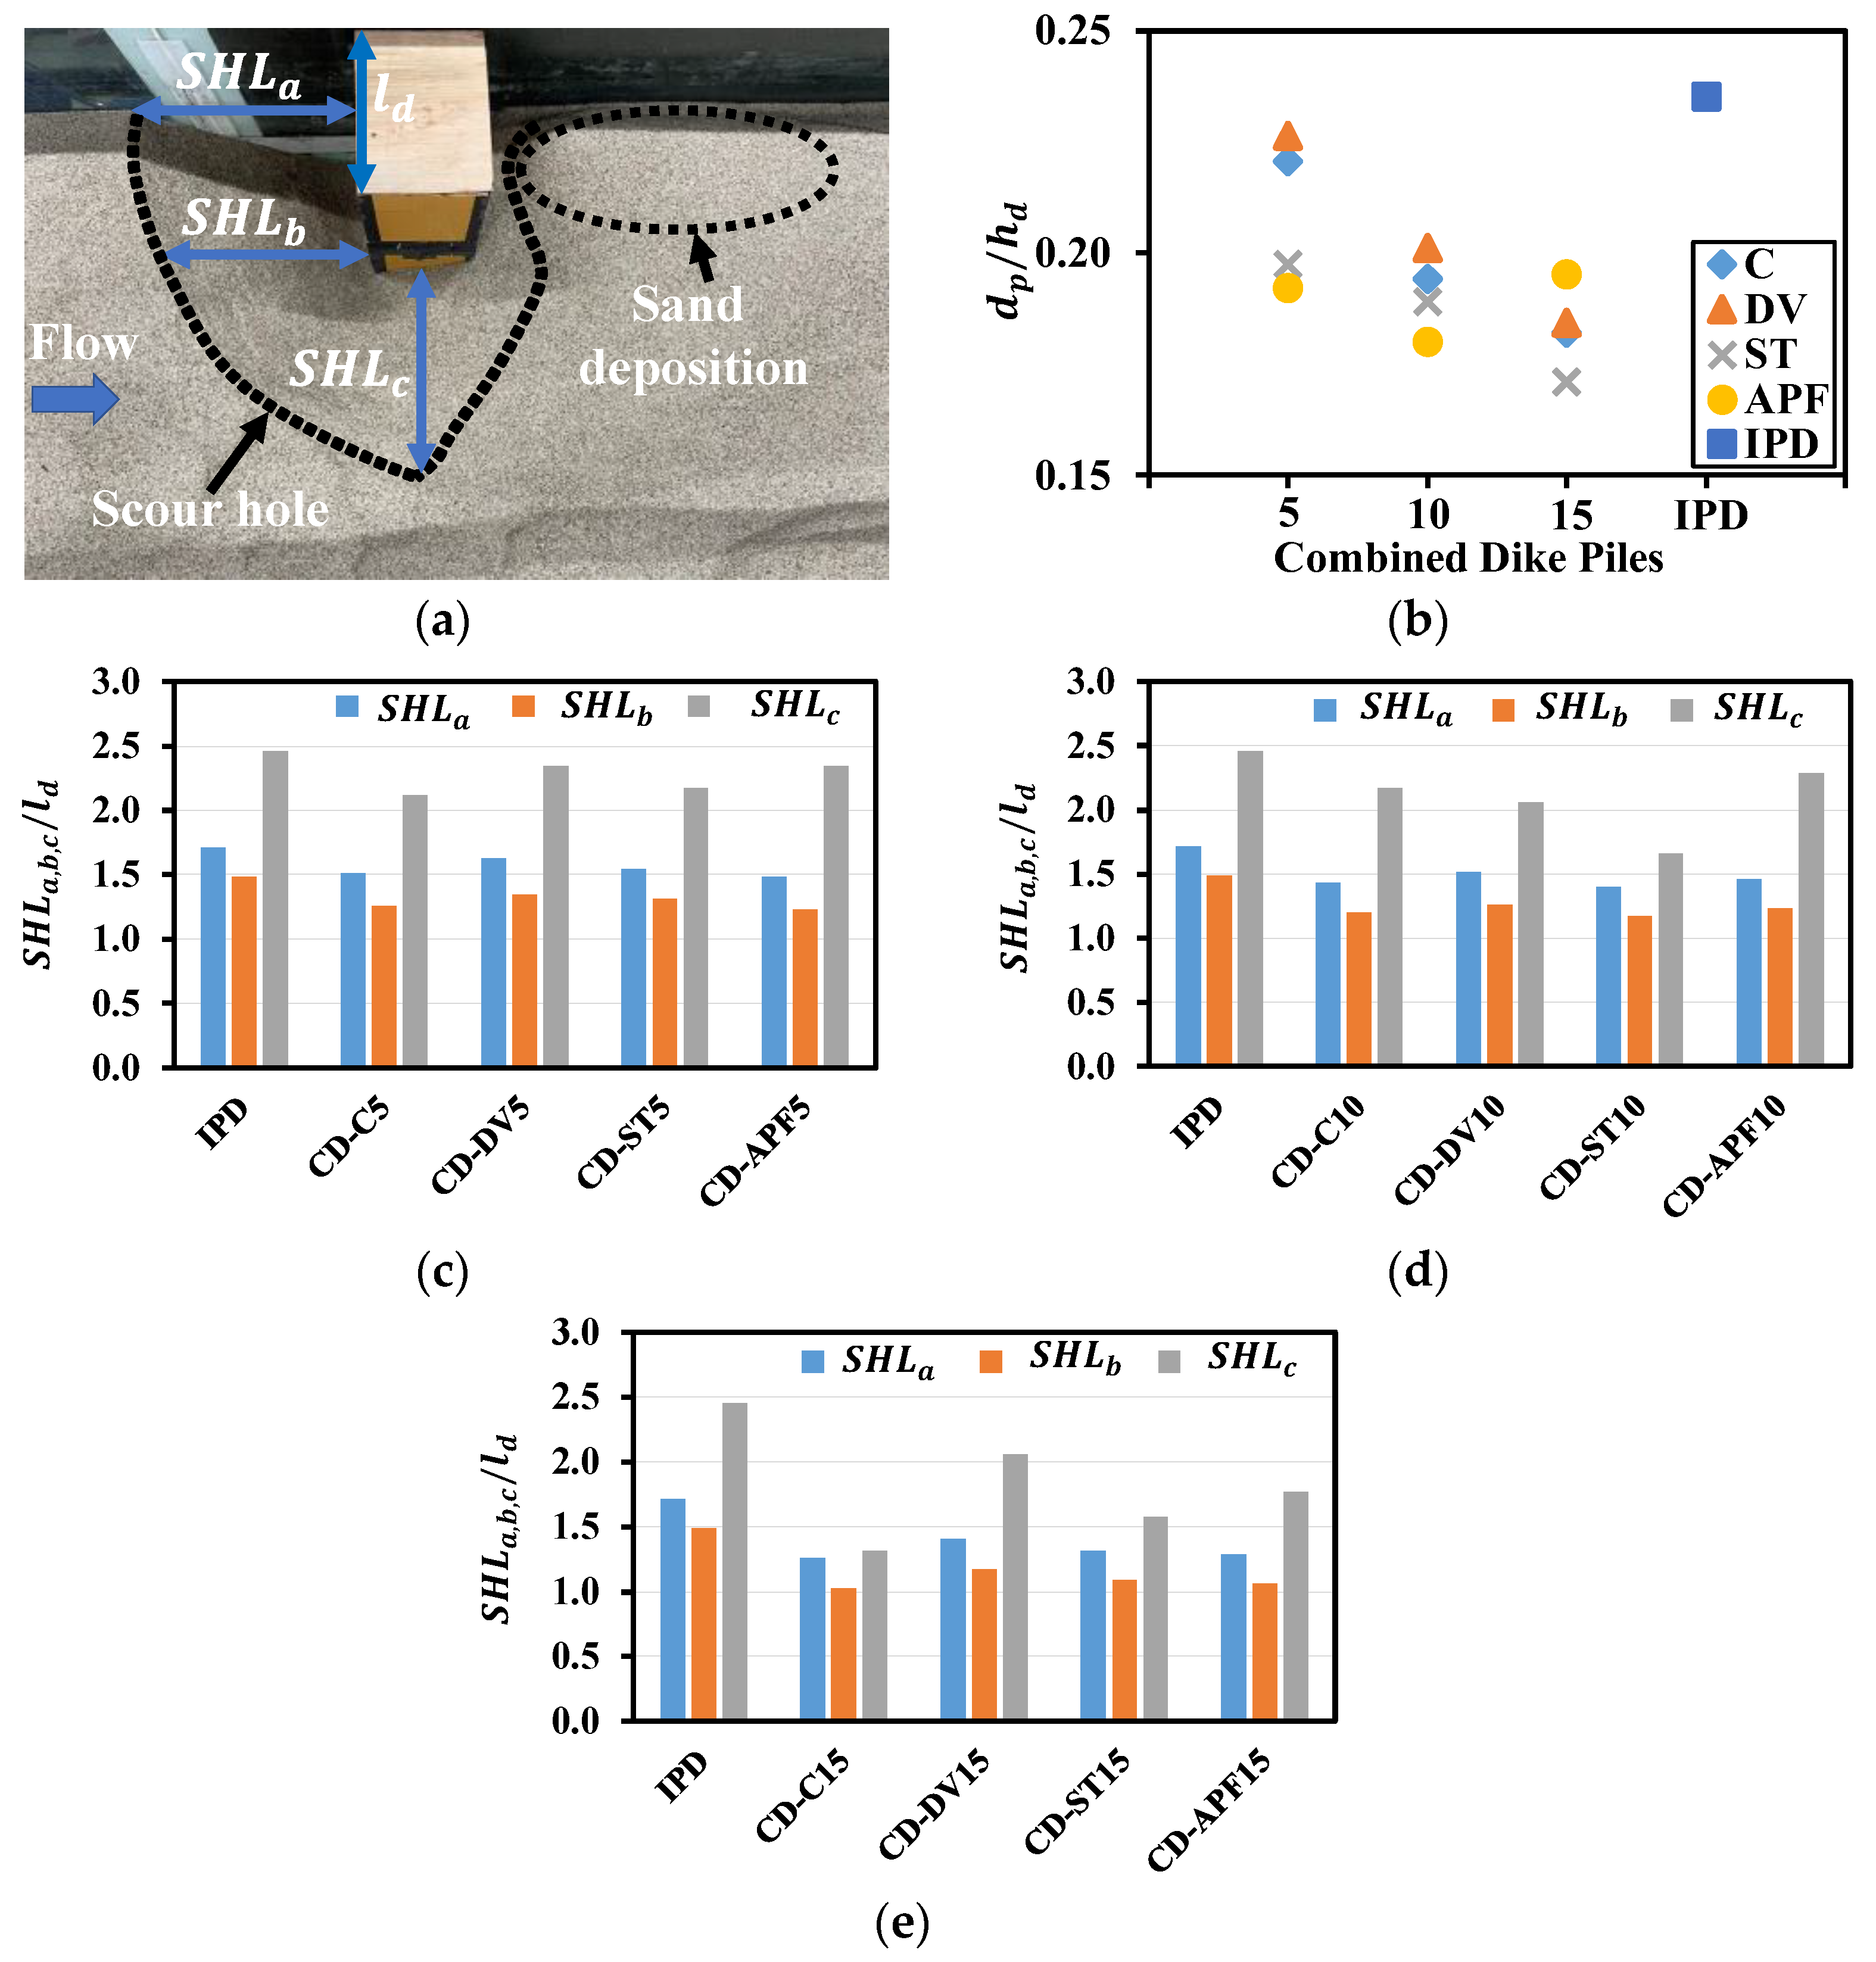
During flooding, water flows with significant energy towards the dike, causing a high scour depth at the nose and the bank adjacent to the dike. To evaluate the changes in the surface area of scour holes, three dimensions (/, /, and /) were established by comparing them to the dimensions of the dike (Figure 8a). The u/s scour hole length that touches the u/s dike-junction wall is represented with “”, while the dimension which touches the dike’s nose is “” and “”, denoting the maximum scour hole length infront of the dike in cross streamwise direction. The maximum scour dimensions (, , and ) were observed for IPD, while it showed minimum dimensions for the 15 piles of CD (Figure 8e).
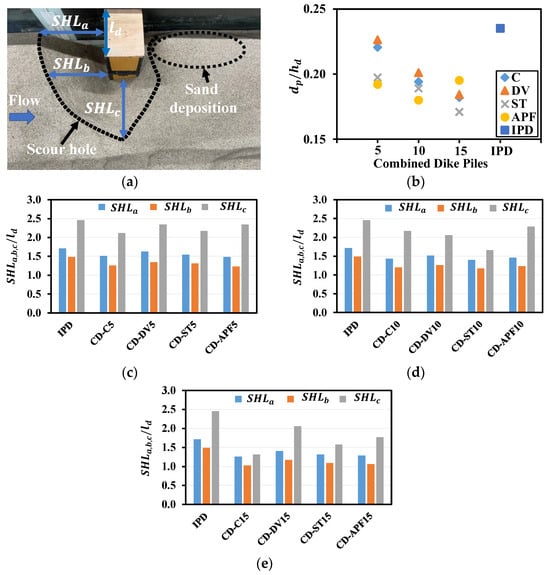
Figure 8.
(a) The dimensions of scour hole lengths, i.e., , , and and sand deposition, dimensionless values of (b) deposition, and scour hole length against each combined dike of (c) 5 piles, (d) 10 piles, and (e) 15 piles.
In each of the dike models, there was a different chance of nearby erosion, as shown in Figure 8c–e. It was supposed that significant bed erosion close to the bank might result in the natural stream’s bank erosion. To capture this phenomenon, was calculated, which showed the highest values for DV among all types of combined dikes. However, , which is a critical scour length, and C and ST had lower values because their flow deflection and resistance were lower when compared to other shapes (DV, APF). The had the highest scour length values compared to”” and “” because it is located where the maximum shear layer is generated after dike deflection. Due to minimum flow deflection, especially with CD-C15, the value of “” was also minimal for CD-ST15.
The formation and development of new riverbanks as well as the stabilization of existing riverbanks are both considered advantages of sediment deposition at the d/s of these structures [55]. However, the reliability and protection of these structures, as well as the riverbank, are seriously threatened by the scouring around flood control structures on riverbanks. The flow profile around such a hydraulic structure suggests that point bars may form at the downstream (d/s) side due to bed and suspended load accumulation. This distribution is influenced by variations in the structural geometry across the channel. Thus, understanding sedimentation associated with combined dikes and its influencing factors is paramount. As previously stated, most of the sediments accumulated longitudinally close to the channel wall. Figure 8b depicts the relationship between the maximum sedimentation height and various combined dikes from various experiments. The vertical axis of this figure represents the nondimensional ratio / (maximum deposition height relative to dike height). The maximum sedimentation height was reduced by 19% and 17% by CD-APF5 and CD-ST5, 24% and 20% by CD-APF10 and CD-ST10, and 28% and 23% by CD-C15 and CD-ST15 compared to the corresponding IPD. Figure 8b also shows that increasing the permeability results in a decrease in the maximum sedimentation height. As a result, CD-DV5 and CD-ST15, respectively, had the lowest and highest sedimentation altitudes.
4. Discussion
Recent studies have investigated different pile configurations paired with dikes as combined protective designs, recommending dikes with piles as the most feasible and appropriate man-made solution for flood disaster mitigation. While impermeable dikes IPDs have experienced failures during previous flood events, either partially or wholly [16], their role in flood prevention remains indispensable. Knowledge of the elements that lead to dike destruction and failure when considering flows may support dike monitoring. The concept of ecosystem-based disaster risk reduction (Eco-DRR) strategies primarily draw inspiration from flood damage prevention or minimization. Hence, a straightforward arrangement of combined pile shapes with IPD maintaining the same dike length was elaborated in the present analysis to control the flow and bolster the resilience of the combined dike defense system.
4.1. Basic Flow Behavior
Pile shapes, when combined with different combined dikes, profoundly influence the flow structures and scour patterns. The CD-ST15 configuration allowed the maximum flow to pass through the piles with a minimal water detention zone, leading to the most significant reduction in scouring. Furthermore, other shapes such as APF, C, and DV were found to be ineffective when combined with 15 piles compared to 5 piles and 10 piles. In CD-, APF5 and CD-APF10 showed better results in terms of swirls elimination, but DV was unable to perform better due to its geometric parameters. Compared to the conventional IPD, the combined dike with ST pile shape showed an enhanced ability to counteract high-energy swirls. Moreover, having a larger number of piles in the combined dike, along with different shapes, led to a marked increase in flow deflection and throughput compared to a fully IPD under the same flow conditions. In essence, this study underscores the importance of pile shapes and permeability in enhancing the protective efficacy of the dike model.
4.2. Scouring Process
Previously, a proposal was made by Sadat and Tominga for the scour reduction efficiency of flood protection pile dike based on two variables: the distance between the pile dike and impermeable dike [56] and the density of piles [28]. In that study, it was observed that increasing the distance between the pile dike and the impermeable dike, as well as raising the density of the pile group, led to a decrease in scour depth under high flood conditions. The scouring process begins when the bed shear stress surpasses the critical shear stress caused by water overflow. The scour around a dike develops over time depending on the substrate condition [57,58]. Scouring around a dike, on the other hand, is dependent on the type of dike (impermeable or permeable), and it eventually reaches an equilibrium state. As a result, in this study, the scour characteristics were considered after scour equilibrium was achieved. The initiated bed shear stress that induces scouring specifically in front of the impermeable or combined dike is determined by the flow pattern, i.e., the hydrodynamic zones induced by the incoming fluid were observed in the current study. Owing to shear failures or flow slides, the scouring process can progressively compromise bed protection, potentially leading to the failure of the hydraulic structure [59].
Zhang et al. [14] and Hakim et al. [60] investigated the scouring phenomenon of a single dike with different permeability, flow rates, and sediment size to predict the scour pattern. It indicated that local scour is highly affected by dike permeability. Later, Sadat and Tominga [57] conducted experiments under clear water conditions to analyze the scouring processes around an IPD by placing a u/s cylindrical dike. Their findings indicated that the scour depth and volume around the conventional dike (IPD) were lower compared to a dike lacking an upstream (u/s) cylindrical dike. Furthermore, they observed that with increasing distance from zero to four times the dike length, the local scour diminished, resulting in noticeable decreases in both the depth and rate of bed erosion. Alauddin et al. [26] used a combined dike, i.e., a single circular pile row combined with a dike to investigate the different flow features to recognize their investigated fluvial responses in the laboratory channel. He made changes in combined dikes (permeable and impermeable) and bandal structures, incorporating some field information. A dike’s performance was confirmed by three key features: structure stability, bank stability, and navigability. Data analysis shows that, when compared to conventional IPD, the combined dikes slow down the flow towards the land and reduce local scour. The bandal-like structures and modified combined dikes also better address two key aspects: erosion and deposition.
According to a recent study by Aly and Dougherty [45], the significant problem of maximum scouring around bridge piers and monopile foundations leads to structural instability and failure, which is not beneficial for the pile’s safety. They focused on various turbulence closures, such as standard k-ω, k-SST, and standard k-ε, to see how well they could predict the bed shear stress around a single pile with combined shapes. Additionally, they made it clear that if the pile is provided in a moveable bed, modified pile shapes rather than the conventional shape (Circular) can reduce bed shear stresses. The current study confirmed these phenomena and contributed to highlighting the effects of different pile shapes when combined with a combined dike. The findings of the current investigation showed that bed material erosion was observed within acceptable limits for a combined dike CD-ST15. The scour phenomenon currently taking place in less permeable combined dikes (CD-C5 and CD-DV5) suffered excessive scouring up to 12–14 cm (after IPD) because of the critical location of the maximum scour hole (in front of the combined/IPD’s nose), while affecting almost the entire u/s zone and head of the dike due to scouring. Furthermore, the maximum scouring depth at the nose, u/s, and d/s dike junctions is a significant issue because the dike may be uprooted and destroyed by excessive scouring caused by enhanced bed shear stress [61], resulting in adjacent bank scouring [1], which will result in a loss on a social, economic, and ecological level and damage the defense system itself as well as pose a significant threat to the d/s residential areas. Additionally, when permeability was considered, the dike with larger IPD parts, i.e., 5 and 10 piles CD, experienced a significant increase in scour at all critical locations (dike’s nose, u/s, and d/s, dike–wall junction). Therefore, an earlier dike failure would lead to its destruction, and a substantial decrease in flow resistance against the approaching current would render this defense system susceptible to devastating flood inundations. Critical locations with minimal permeability would also experience a rather increased rise in scouring. However, the floodwater possesses a diminished ability to fracture the modified piles within the integrated dike system [31].
Thus, it would be preferable to limit the permeability of the dike as well as the best combination of pile shapes to countermeasure the approaching currents flow and increase the social system’s resilience during destructive flood attacks as well as appropriate river management and monitoring.
5. Conclusions
The effectiveness of various pile shapes combined with a single combined dike with constant dike dimensions has been demonstrated under flood water with subcritical flow conditions. The resilience capacity and sensitivity of the combined dike (CD) defense mechanism have been investigated and affiliated with the flow structure and scouring process caused by the effect of the approaching flood current’s high fluid force. This study concludes that dike permeability (5 piles, 10 piles, and 15 piles) when combined with different shapes (angled plate footings, circular, delta vane, streamlined tapered) has significant influences on flood flow structures and scour pattern. Our findings are listed below.
- In CD-ST15 case, streamlined tapered (ST) provides the best results in terms of scour hole lengths (, , ), scour depth reduction at the nose (48%), u/s dike–wall junction (45%), and d/s dike–wall junction (65%). The decreased scour depth and length in the CD-ST15’s front suggest that the streamlined tapered design redirects the flow towards the downstream side, reducing scour at that location. When it comes to deposition on the d/s side, delta vane (CD-DV5) provides the most deposition (4.3 cm) when compared to other shapes.
- Maximum flow concentration was observed in the impermeable dike’s detention and reflux zones, while maximum scour depth was observed between these two zones due to highly concentrated flow at the dike nose. Concentrated flow faded as permeability increased from 5 piles to 15 piles, resulting in scour depth reduction at all three critical locations (dike’s nose, u/s, and d/s dike–wall junction). However, the increase in permeability deposition was reduced to the maximum value (3.3 cm) for CD-ST15.
To reduce excessive scouring, it would be preferable to install combined dikes with different pile shapes rather than conventional dikes (impermeable) to improve the sustainability of the socioeconomic defense mechanism during massive flood attacks and for appropriate riverbank protection, management, and monitoring. This study considered the combined dike with four pile shapes perpendicular to the flow; so, there is still a need for research and important information concerning the impacts of pile density with different flow deflection angles on flood mitigation. Due to the findings of this study, riverbank protection designers and planners will be able to suggest an efficient and practical countermeasure against floods by revealing the impacts of varying pile density on scour features, referring to shear stress allocation.
Author Contributions
Conceptualization, S.I. and N.T.; methodology, S.I.; model preparation, S.I.; investigation, S.I.; data processing and analysis, S.I.; writing—original draft, S.I.; visualization, S.I.; resources, N.T.; writing—review and editing, N.T.; supervision, N.T.; project administration, N.T.; funding acquisition, N.T. All authors have read and agreed to the published version of the manuscript.
Funding
This research received no external funding.
Data Availability Statement
Not applicable.
Acknowledgments
The authors appreciate the support from the Japanese Ministry of Education, Culture, Sports, Science, and Technology (Monbukagakusho–MEXT Scholarship). The authors also acknowledge the anonymous reviewers for their valuable comments to improve this manuscript.
Conflicts of Interest
The authors declare no conflict of interest.
References
- Smith, K. Environmental Hazards: Assessing Risk and Reducing Disaster; Routledge: New York, NY, USA, 2003. [Google Scholar]
- Buijs, J.; Boelens, L.; Bormann, H.; Restemeyer, B.; Terpstra, T.; van der Voorn, T. Adaptive planning for flood resilient areas: Dealing with complexity in decision-making about multilayered flood risk management. In Proceedings of the 16th Meeting: Adaptive Planning for Spatial Transformation, Groningen, The Netherlands, 23–25 May 2018; pp. 23–25. [Google Scholar]
- Igarashi, Y.; Tanaka, N. Effectiveness of a compound defense system of sea embankment and coastal forest against a tsunami. Ocean. Eng. 2018, 151, 246–256. [Google Scholar] [CrossRef]
- Abbas, A.; Amjath-Babu, T.S.; Kächele, H.; Müller, K. Non-structural flood risk mitigation under developing country conditions: An analysis on the determinants of willingness to pay for flood insurance in rural Pakistan. Nat. Hazards 2015, 75, 2119–2135. [Google Scholar] [CrossRef]
- Young, J.C.; Arthur, R.; Spruce, M.; Williams, H.T. Social sensing of flood impacts in India: A case study of Kerala 2018. Int. J. Disaster Risk Reduct. 2022, 74, 102908. [Google Scholar] [CrossRef]
- Carrico, A.R.; Donato, K. Extreme weather and migration: Evidence from Bangladesh. Popul. Environ. 2019, 41, 1–31. [Google Scholar] [CrossRef]
- Puthur, A. Preserving the Environment Due to the Flash Floods in Vellar River at Tv Puthur, Virudhachalam Taluk, Tamil Nadu: A Case Study. Int. J. Struct. Civil Eng. Res. 2013, 2, 2319–6009. [Google Scholar]
- Iqbal, S.; Pasha, G.A.; Ghani, U.; Ullah, M.K.; Ahmed, A. Flow dynamics around permeable spur dike in a rectangular channel. Arab. J. Sci. Eng. 2021, 46, 4999–5011. [Google Scholar] [CrossRef]
- Haider, R.; Qiao, D.; Yan, J.; Ning, D.; Pasha, G.A.; Iqbal, S. Flow characteristics around permeable spur dike with different staggered pores at varying angles. Arab. J. Sci. Eng. 2022, 47, 5219–5236. [Google Scholar] [CrossRef]
- Euler, T.; Herget, J. Controls on local scour and deposition induced by obstacles in fluvial environments. Catena 2012, 91, 35–46. [Google Scholar] [CrossRef]
- Pandey, M.; Valyrakis, M.; Qi, M.; Sharma, A.; Lodhi, A.S. Experimental assessment and prediction of temporal scour depth around a spur dike. Int. J. Sediment Res. 2021, 36, 17–28. [Google Scholar] [CrossRef]
- ddv Kuhnle, R.; Alonso, C. Flow near a model spur dike with a fixed scoured bed. Int. J. Sediment Res. 2013, 28, 349–357. [Google Scholar] [CrossRef]
- Esmaeli, P.; Boudaghpour, S.; Rostami, M.; Mirzaee, M. Experimental investigation of permeability and length of a series of spur dikes effects on the control of bank erosion in the meandering channel. Ain Shams Eng. J. 2022, 13, 101701. [Google Scholar] [CrossRef]
- Zhang, H.; Nakagawa, H.; Mizutani, H. Bed morphology and grain size characteristics around a spur dyke. Int. J. Sediment Res. 2012, 27, 141–157. [Google Scholar] [CrossRef]
- Pandey, M.; Ahmad, Z.; Sharma, P.K. Estimation of maximum scour depth near a spur dike. Can. J. Civ. Eng. 2016, 43, 270–278. [Google Scholar] [CrossRef]
- Zhang, H.; Nakagawa, H. Characteristics of local flow and bed deformation at impermeable and permeable spur dykes. Annu. J. Hydraul. Eng. JSCE 2009, 53, 145–150. [Google Scholar]
- Chen, L.P.; Jiang, J.C. Experiments and numerical simulations on transport of dissolved pollutants around spur dike. Water Sci. Eng. 2010, 3, 341–353. [Google Scholar]
- Evangelista, S. Experiments and numerical simulations of dike erosion due to a wave impact. Water 2015, 7, 5831–5848. [Google Scholar] [CrossRef]
- Zhang, H.; Nakagawa, H.; Kawaike, K.; Baba, Y. Experiment and simulation of turbulent flow in local scour around a spur dyke. Int. J. Sediment Res. 2009, 24, 33–45. [Google Scholar] [CrossRef]
- Guo, J. Pier scour in clear water for sediment mixtures. J. Hydraul. Res. 2012, 50, 18–27. [Google Scholar] [CrossRef]
- Kang, J.; Yeo, H.; Kim, S.; Ji, U. Permeability effects of single groin on flow characteristics. J. Hydraul. Res. 2011, 49, 728–735. [Google Scholar] [CrossRef]
- Iqbal, S.; Pasha, G.A.; Ghani, U.; Ahmed, A.; Farooq, R.; Haider, R. Investigation of Flow Dynamics Around a Combination of Different Head Shapes of Spur Dikes. Teh. Vjesn. 2022, 29, 2111–2120. [Google Scholar]
- Nayyer, S.; Farzin, S.; Karami, H.; Rostami, M. A numerical and experimental investigation of the effects of combination of spur dikes in series on a flow field. J. Braz. Soc. Mech. Sci. Eng. 2019, 41, 256. [Google Scholar] [CrossRef]
- Bahrami-Yarahmadi, M.; Pagliara, S.; Yabarehpour, E.; Najafi, N. Study of Scour and Flow Patterns around Triangular-Shaped Spur Dikes. KSCE J. Civ. Eng. 2020, 24, 3279–3288. [Google Scholar] [CrossRef]
- Brown, S.A. Design of Spur-Type Streambank Stabilization Structures; (No. FHWA/RD-84/101; SCR-371-83-039); Turner-Fairbank Highway Research Center: McLean, VA, USA, 1985. [Google Scholar]
- Alauddin, M.; Tashiro, T.; Tsujimoto, T. Design of groynes modified with both alignment and permeability for lowland river problems. J. Jpn. Soc. Civ. Eng. Ser. A2 (Appl. Mech. (AM)) 2011, 67, I_645–I_652. [Google Scholar] [CrossRef] [PubMed]
- Sadat, S.H.; Tominaga, A. Influence of pile group density on minimizing local scour of a double spur dike group. J. Jpn. Soc. Civ. Eng. Ser. B1 Hydraulic Eng. 2014, 70, I_85–I_90. [Google Scholar] [CrossRef]
- Tominaga, A.; Sadat, S.H. Combination of permeable and impermeable spur dikes to reduce local scour and to create diverse river bed. River Sediment. 2016, 101, 450–456. [Google Scholar]
- Ezzeldin, R.M. Numerical and experimental investigation for the effect of permeability of spur dikes on local scour. J. Hydroinformatics 2019, 21, 335–342. [Google Scholar] [CrossRef]
- Mohammed, A.; Pervin, R.; Hasan, M.Z. Effect of Various Groins in a Series on Channel Bed Morphology: An Experimental Investigation. Stavební Obz. -Civ. Eng. J. 2022, 31, 211–221. [Google Scholar] [CrossRef]
- Iqbal, S.; Tanaka, N. Experimental Study on Flow Characteristics and Energy Reduction around a Hybrid Dike. Int. J. Civ. Eng. 2023, 21, 1045–1059. [Google Scholar] [CrossRef]
- Heller, V. Scale effects in physical hydraulic engineering models. J. Hydraul. Res. 2011, 49, 293–306. [Google Scholar] [CrossRef]
- Rahman, A.; Tanaka, N.; Reheman, N. Experimental study on reduction of scouring and tsunami energy through a defense system consisting a seaward embankment followed by vertically double layered vegetation. Ocean Eng. 2021, 234, 108816. [Google Scholar] [CrossRef]
- Young, D.M.; Testik, F.Y. Onshore scour characteristics around submerged vertical and semicircular breakwaters. Coast Eng. 2009, 56, 868–875. [Google Scholar] [CrossRef]
- Fazeres-Ferradosa, T.; Chambel, J.; Taveira-Pinto, F.; Rosa-Santos, P.; Taveira-Pinto, F.V.C.; Giannini, G.; Haerens, P. Scour Protections for Offshore Foundations of Marine Energy Harvesting Technologies: A Review. J. Mar. Sci. Eng. 2021, 9, 297. [Google Scholar] [CrossRef]
- Ahmed, A.; Ghumman, A.R. Experimental investigation of flood energy dissipation by single and Hybrid Defense System. Water 2019, 11, 1971. [Google Scholar] [CrossRef]
- Pasha, G.A.; Tanaka, N. Undular hydraulic jump formation and energy loss in a flow through emergent vegetation of varying thickness and density. Ocean Eng. 2017, 141, 308–325. [Google Scholar] [CrossRef]
- Welzel, M.; Schendel, A.; Hildebrandt, A.; Schlurmann, T. Scour development around a jacket structure in combined waves and current conditions compared to monopile foundations. Coast. Eng. 2019, 152, 103515. [Google Scholar] [CrossRef]
- Ben Meftah, M.; Mossa, M. Scour holes downstream of bed sills in low-gradient channels. J. Hydraul. Res. 2006, 44, 497–509. [Google Scholar] [CrossRef]
- Chiew, Y.M. Mechanics of local scour around submarine pipelines. J. Hydraul. Eng. 1990, 116, 515–529. [Google Scholar] [CrossRef]
- Ghodsian, M.; Vaghefi, M. Experimental study on scour and flow field in a scour hole around a T-shape spur dike in a 90° Bend. Int. J. Sediment Res. 2009, 24, 145–158. [Google Scholar] [CrossRef]
- Brevis, W.; García-Villalba, M.; Niño, Y. Experimental and large eddy simulation study of the flow developed by a sequence of lateral obstacles. Environ. Fluid Mech. 2014, 14, 873–893. [Google Scholar] [CrossRef]
- Safie, O.; Tominaga, A. Effects of pile density and arrangement on flow characteristics and sediment deposition around a pile-group dike. J. Jpn. Soc. Civ. Eng. Ser. A2 (Appl. Mech. (AM)) 2019, 75, I_487–I_498. [Google Scholar] [CrossRef]
- Poff, M.T.; Stephen, M.F.; Dean, R.G.; Mulcahy, S. Permeable wood groins: Case study on their impact on the coastal system. J. Coast. Res. 2004, 33, 131–144. [Google Scholar]
- Aly, A.M.; Dougherty, E. Bridge pier geometry effects on local scour potential: A comparative study. Ocean. Eng. 2021, 234, 109326. [Google Scholar] [CrossRef]
- Kothyari, U.C.; Ranga Raju, K.G. Scour around spur dikes and bridge abutments. J. Hydraul. Res. 2001, 39, 367–374. [Google Scholar] [CrossRef]
- Fazli, M.; Ghodsian, M.; Neyshabouri, S.A. Scour and flow field around a spur dike in a 90° Bend. Int. J. Sediment Res. 2008, 23, 56–68. [Google Scholar] [CrossRef]
- Osman, M.A.; Saeed, H.N. Local scour depth at the nose of permeable and impermeable spur dykes. Univ. Khartoum Eng. J. 2012, 2. [Google Scholar]
- Li, Y.; Altinakar, M. Effects of a Permeable Hydraulic Flashboard Spur Dike on Scour and Deposition; World Environmental and Water Resources Congress: Henderson, NV, USA, 2016. [Google Scholar]
- Karami, H.; Basser, H.; Ardeshir, A.; Hosseini, S.H. Verification of numerical study of scour around spur dikes using experimental data. Water Environ. J. 2012, 28, 124–134. [Google Scholar] [CrossRef]
- Haider, R.; Qiao, D.; Wang, X.; Yan, J.; Ning, D. Role of grouped piles on flow characteristics around impermeable spur dike. Int. J. Civ. Eng. 2022, 20, 869–883. [Google Scholar] [CrossRef]
- Pandey, M.; Ahmad, Z.; Sharma, P.K. Scour around impermeable spur dikes: A review. ISH J. Hydraul. Eng. 2017, 24, 25–44. [Google Scholar] [CrossRef]
- Karami, H.; Ardeshir, A.; Saneie, M.; Salamatian, S.A. Prediction of time variation of scour depth around spur dikes using neural networks. J. Hydro. 2011, 14, 180–191. [Google Scholar] [CrossRef]
- Safie, O.; Tominaga, A. Flow characteristics around pile-group groynes with different arrangements of piles. In Proceedings of the River Flow 2020: Proceedings of the 10th Conference on Fluvial Hydraulics, Delft, The Netherlands, 7–10 July 2020; pp. 203–211. [Google Scholar] [CrossRef]
- Florsheim, J.L.; Mount, J.F.; Chin, A. Bank Erosion as a Desirable Attribute of Rivers. BioScience 2008, 58, 519–529. [Google Scholar] [CrossRef]
- Sadat, S.H.; Tominaga, A. Optimal distance between pile-group and spur-dike to reduce local scour. J. Jpn. Soc. Civ. Eng. Ser. B1 Hydraulic Eng. 2015, 71, I_187–I_192. [Google Scholar] [CrossRef] [PubMed]
- Anjum, N.; Tanaka, N.; Rahman, M.A. Role of tree crown height for effective mitigation capability of inland coastal forest considering the flow structures and scour phenomena. Ocean. Eng. 2021, 238, 109728. [Google Scholar] [CrossRef]
- Bomers, A.; Aguilar Lopez, J.P.; Warmink, J.J.; Hulscher, S.J. Modelling effects of an asphalt road at a dike crest on dike cover erosion onset during wave overtopping. Nat. Hazards 2018, 93, 1–30. [Google Scholar] [CrossRef]
- Hoffmans, G.J.C.M.; Verheij, H.J. (Eds.) Scour Manual: Current-Related Erosion; CRC Press: Boca Raton, FL, USA, 2021. [Google Scholar]
- Hakim, M.; Yarahmadi, M.B.; Kashefipour, S.M. Use of spur dikes with different permeability levels for protecting bridge abutment against local scour under unsteady flow conditions. Can. J. Civ. Eng. 2022, 49, 1842–1854. [Google Scholar] [CrossRef]
- Ahmed, H.S.; Hasan, M.M.; Tanaka, N. Analysis of flow around impermeable groynes on one side of symmetrical compound channel: An experimental study. Water Sci. Eng. 2010, 3, 56–66. [Google Scholar]


Disclaimer/Publisher’s Note: The statements, opinions and data contained in all publications are solely those of the individual author(s) and contributor(s) and not of MDPI and/or the editor(s). MDPI and/or the editor(s) disclaim responsibility for any injury to people or property resulting from any ideas, methods, instructions or products referred to in the content. |
© 2023 by the authors. Licensee MDPI, Basel, Switzerland. This article is an open access article distributed under the terms and conditions of the Creative Commons Attribution (CC BY) license (https://creativecommons.org/licenses/by/4.0/).