Abstract
Investigating various geophysical parameters from the Earth’s crust to the upper atmosphere is considered a promising approach for predicting earthquakes. Scientists have observed that changes in these parameters can occur days to months before earthquakes. Understanding and studying the impending abnormal phenomena that precede earthquakes is both urgent and challenging. On 5 September 2022, a magnitude 6.8 earthquake occurred in Sichuan, China, at 4:52:18 (Universal Time). The earthquake happened approximately 175 km away from an instrumental array established in 2021 for monitoring vibrations and perturbations in the lithosphere, atmosphere, and ionosphere (MVP-LAI). This array consisted of over 15 instruments that regularly monitor changes in various geophysical parameters from the subsurface up to an altitude of approximately 350 km in the ionosphere. Its purpose was to gain insights into the mechanisms behind the coupling of these different geospheres during natural hazards. The seven geophysical parameters from the MVP-LAI system simultaneously exhibited abnormal behaviors approximately 3 h before the Luding earthquake. These parameters include ground tilts, air pressure, radon concentration, atmospheric vertical electric field, geomagnetic field, wind field, and total electron content. The abnormal increase in radon concentration suggests that the chemical channel could be a promising mechanism for the coupling of geospheres. Furthermore, air pressure, the geomagnetic field, and total electron content exhibited abnormal characteristics with similar frequencies. Horizontal wind experienced temporary cessation or weakening, while vertical wind displayed frequent reversals. These anomalies may be attributed to atmospheric resonance before the earthquake. The results demonstrate that the coupling of geospheres, as indicated by the anomalous phenomena preceding an earthquake, could be influenced by multiple potential mechanisms. The multiple anomalies observed in this study provided approximately 3 h of warning for people to prepare for the seismic event and mitigate hazards.
1. Introduction
Investigations into multiple anomalous phenomena in the lithosphere–atmosphere–ionosphere (LAI) coupling before major earthquakes are considered an important aspect of predicting earthquake occurrences [1,2,3,4,5,6]. While earthquake prediction remains a significant challenge, integrating various geophysical parameters can help us understand the evolution of pre-earthquake anomalous phenomena and uncover the causal mechanisms involved [7]. Typically, the evolution of pre-earthquake anomalous phenomena starts with crustal deformation and seismicity, and culminates in electromagnetic anomalies near the Earth’s surface [7] and total electron contents (TECs) in the ionosphere [8,9,10]. Here, we take the 1999 M7.6 Chi-Chi earthquake and the 2011 M9.0 Tohoku-Oki earthquake as examples to demonstrate the evaluation of pre-earthquake anomalies. Anomalous surface deformation, which triggers unusual changes in groundwater levels [11], can be observed, starting approximately one year before the Chi-Chi earthquake [12]. Groundwater levels in the footwall of the Chelungpu fault began to change accordingly and remained at a low stage for around three months (from five months to two months before the Chi-Chi earthquake). Two months before the Chi-Chi earthquake, groundwater levels significantly increased due to noticeable compression stress loading in the Earth’s crust [12]. Meanwhile, the stress loading in the crust near the epicenter caused variations in the magnetic field’s daily pattern [13], as demonstrated by raw data showing several strong magnetic disturbances [14]. Additionally, a significant decrease in total electron contents (TECs) was observed over a wide area covering the epicenter approximately two to five days before the earthquake [15]. Similarly, researchers such as Chen et al. [16], Han et al. [17], Orihara et al. [18], Varotsos et al. [19], and Sarlis et al. [20] observed abnormal surface movements, changes in groundwater levels, diurnal variations in the geomagnetic field, and unusual seismic activity and slow slips approximately two months before the Tohoku-Oki earthquake, respectively. Abnormal crustal deformation was noted by Chen et al. [16] about 1–1.5 months before the earthquake, along with abnormal changes in the foreshock sequence, slow slip events, and ground motion reported by Kato et al. [21], Ito et al. [22], and Hattori et al. [23], respectively. Moreover, seismo-TEC anomalies were observed four days before the Tohoku-Oki earthquake [24]. Heki [25] found TEC enhancements approximately 40 min before earthquake occurrences. These anomalies in seismo-crustal deformation, groundwater levels, and seismic activity often act as early indicators of major earthquakes. The TEC anomalies typically emerge 2–5 days before the earthquake, surpassing these other anomalies. On the other hand, numerous previous studies have revealed statistical anomalies in the ionosphere within approximately 2 weeks and a few days before the occurrence of earthquakes by utilizing the nighttime fluctuation method and the terminator time method [26,27,28,29,30]. However, it is important to note that most pre-earthquake anomalies span from days [8,9] to months [31,32,33]. Detecting impending anomalies associated with earthquakes remains a significant challenge that requires immediate attention.
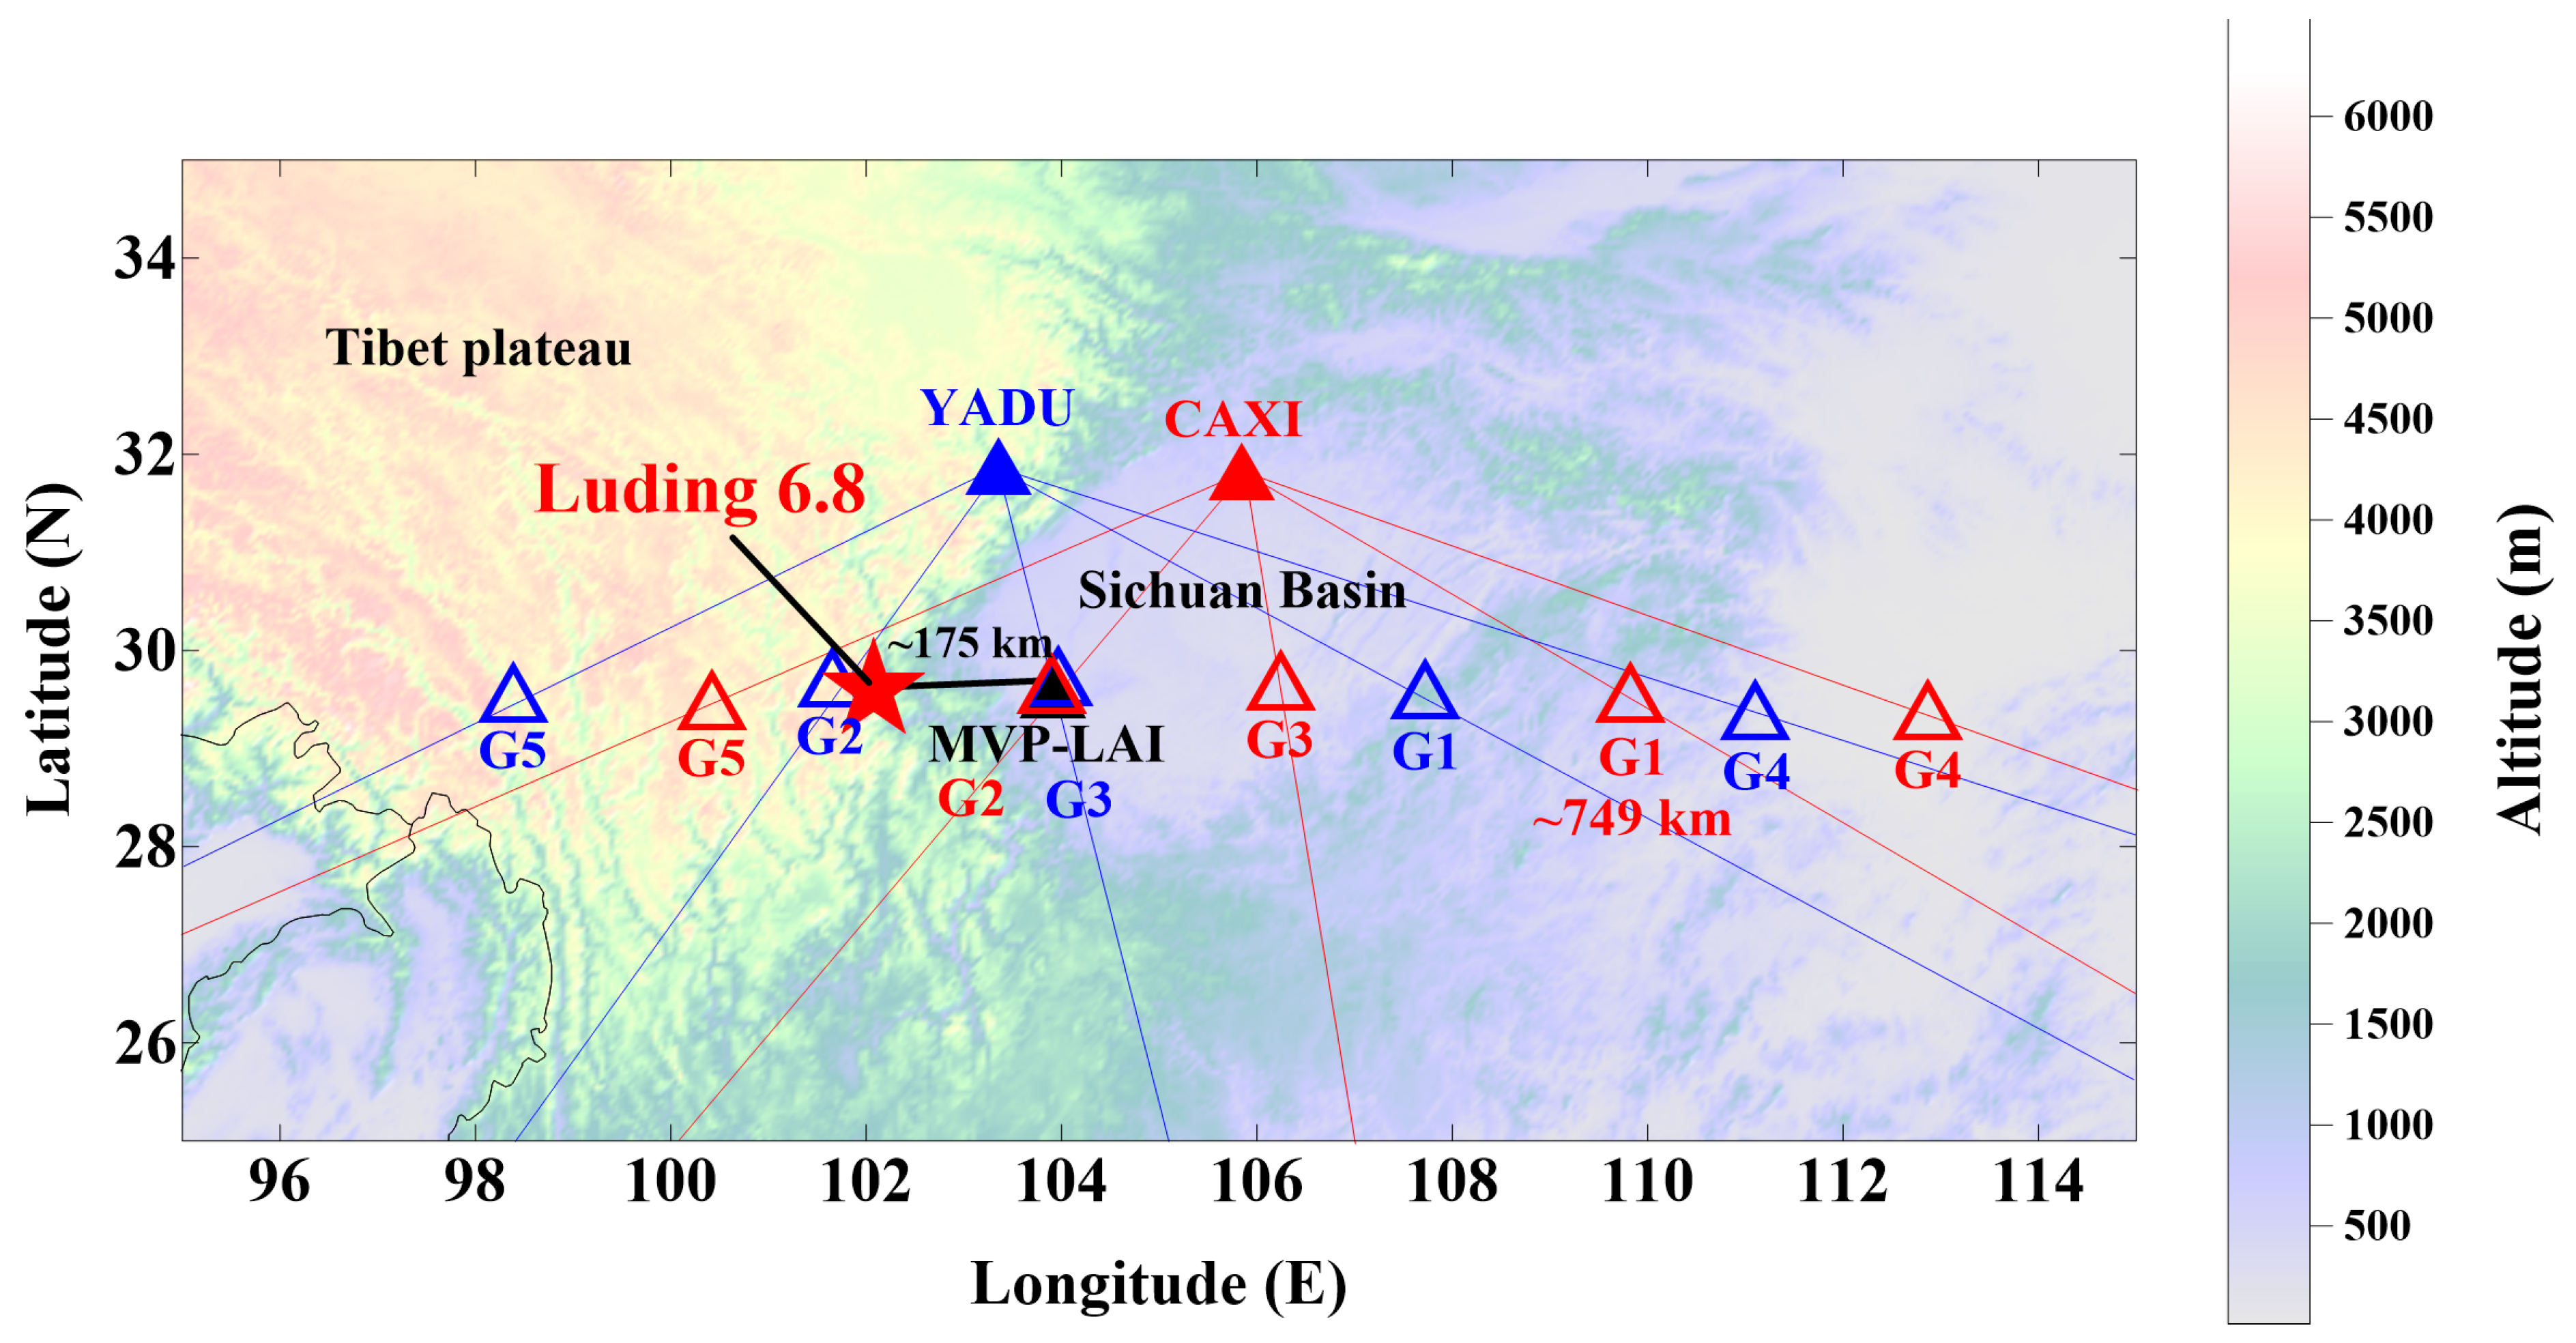
In 2021, an instrumental array was established in Leshan, Sichuan, China (103.91° E, 29.60° N) to address one of the main challenges in detecting impending anomalies related to earthquakes [34]. The instrumental array consists of more than 15 distinct instruments that monitor over 15 different geophysical parameters, ranging from the subsurface to the ionosphere (for more details, refer to Chen et al. [34]). These instruments are primarily installed within a 20 m × 20 m area to monitor vibrations and perturbations in the lithosphere, atmosphere, and ionosphere (MVP-LAI), with a predominant focus on vertical propagation. It is important to note that geostationary satellites operated by the BeiDou Navigation Satellite System serve the MVP-LAI system for continuously monitoring changes in TECs at fixed ionospheric pierce points (IPPs) over specific locations on the Earth’s surface. To monitor TEC changes across the MVP-LAI system, ground-based GNSS (Global Navigation Satellite System) receivers were installed at two substations: YADU (103.4° E, 31.9° N) and CAXI (105.8° E, 31.8° N), located approximately 200 km north of the MVP-LAI system. The IPPs for the YADU and CAXI substations, corresponding to the BeiDou geostationary satellites (G3 and G2), are positioned directly over the MVP-LAI system at an altitude of approximately 350 km (Figure 1). Thus, changes in the ionosphere over the MVP-LAI system are monitored by calculating TEC values from electromagnetic signals transmitted by the associated BeiDou geostationary satellites [35,36] received by ground-based GNSS stations at YADU and CAXI. The MVP-LAI system detected resident signals prior to the Maduo and Yangbi earthquakes [37] and observed interactions between the lithosphere, atmosphere, and ionosphere associated with the Lamb waves triggered by the Tonga volcano eruption [38]. Furthermore, Chen et al. [39] identified and proposed four distinct coupling and/or interactions between the LAI triggered by the Lamb waves associated with the Tonga volcano eruption. Although the MVP-LAI system is insufficient for monitoring changes in Very Low-Frequency (VLF) data [40], the observational results related to earthquakes and the Tonga volcano eruption have demonstrated the capability of the MVP-LAI system to monitor phenomena during natural hazards.
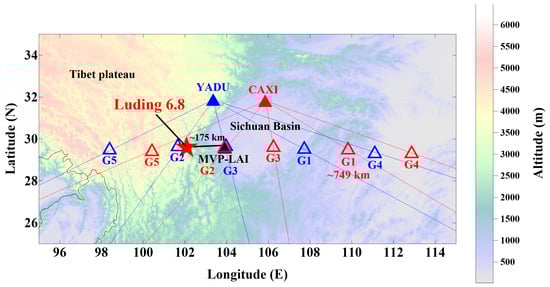
Figure 1.
The locations of various observational points related to the 2022 M6.8 Luding earthquake. The red star represents the epicenter of the Luding earthquake. The black triangle indicates the instrumental array for monitoring vibrations and perturbations in the lithosphere, atmosphere, and ionosphere (MVP-LAI). The blue and red solid triangles denote the YADU and CAXI ground-based GNSS (Global Navigation Satellite System) stations, respectively. The blue and red open triangles show the ionospheric pierce points (IPPs) corresponding to the BeiDou geostationary (G1–G5) satellites. The approximate distances from the MVP-LAI system and the IPPs on the CAXI-G1 route to the epicenter of the Luding earthquake are 175 km and 749 km, respectively.
On 5 September 2022, at 4:52:18 Universal Time (UT), an earthquake, 6.8 in magnitude, struck near Luding County in Sichuan, China, at the coordinates 102.08° E, 29.59° N [41,42]. The earthquake reached a ground intensity level of nine, resulting in the loss of 97 lives, with 20 people reported as missing. In a study conducted by Liu et al. [43], various geophysical parameters in the ionosphere, infrared radiation, atmospheric electrostatic field, and hot spring ions in the seismogenic region were examined. Pre-earthquake anomalies were observed in the lithosphere–atmosphere–ionosphere coupling approximately 10 days before the Luding earthquake. However, the specific impending anomalies prior to the Luding earthquake remain unclear. The estimated radius of the earthquake preparation zone, calculated using a formula proposed in Dobrovolsky et al. [44], is approximately 840 km. The epicenter of the earthquake is approximately 175 km away from the MVP-LAI system. This suggests that the MVP-LAI system has a high potential for detecting multiple anomalous phenomena before an earthquake occurs. As part of this study, data on ground tilts, air pressure, radon concentration, atmospheric vertical electric field near the Earth’s surface, wind field up to an altitude of approximately 5000 m, magnetic field corresponding to the ionospheric current at around 100 km altitude, and TECs from the YADU and CAXI substations at approximately 350 km altitude were collected from 4 to 5 September 2022. Since there was no precipitation during this period, data from the rain gauge in the MVP-LAI system were not included.
2. Materials and Methods
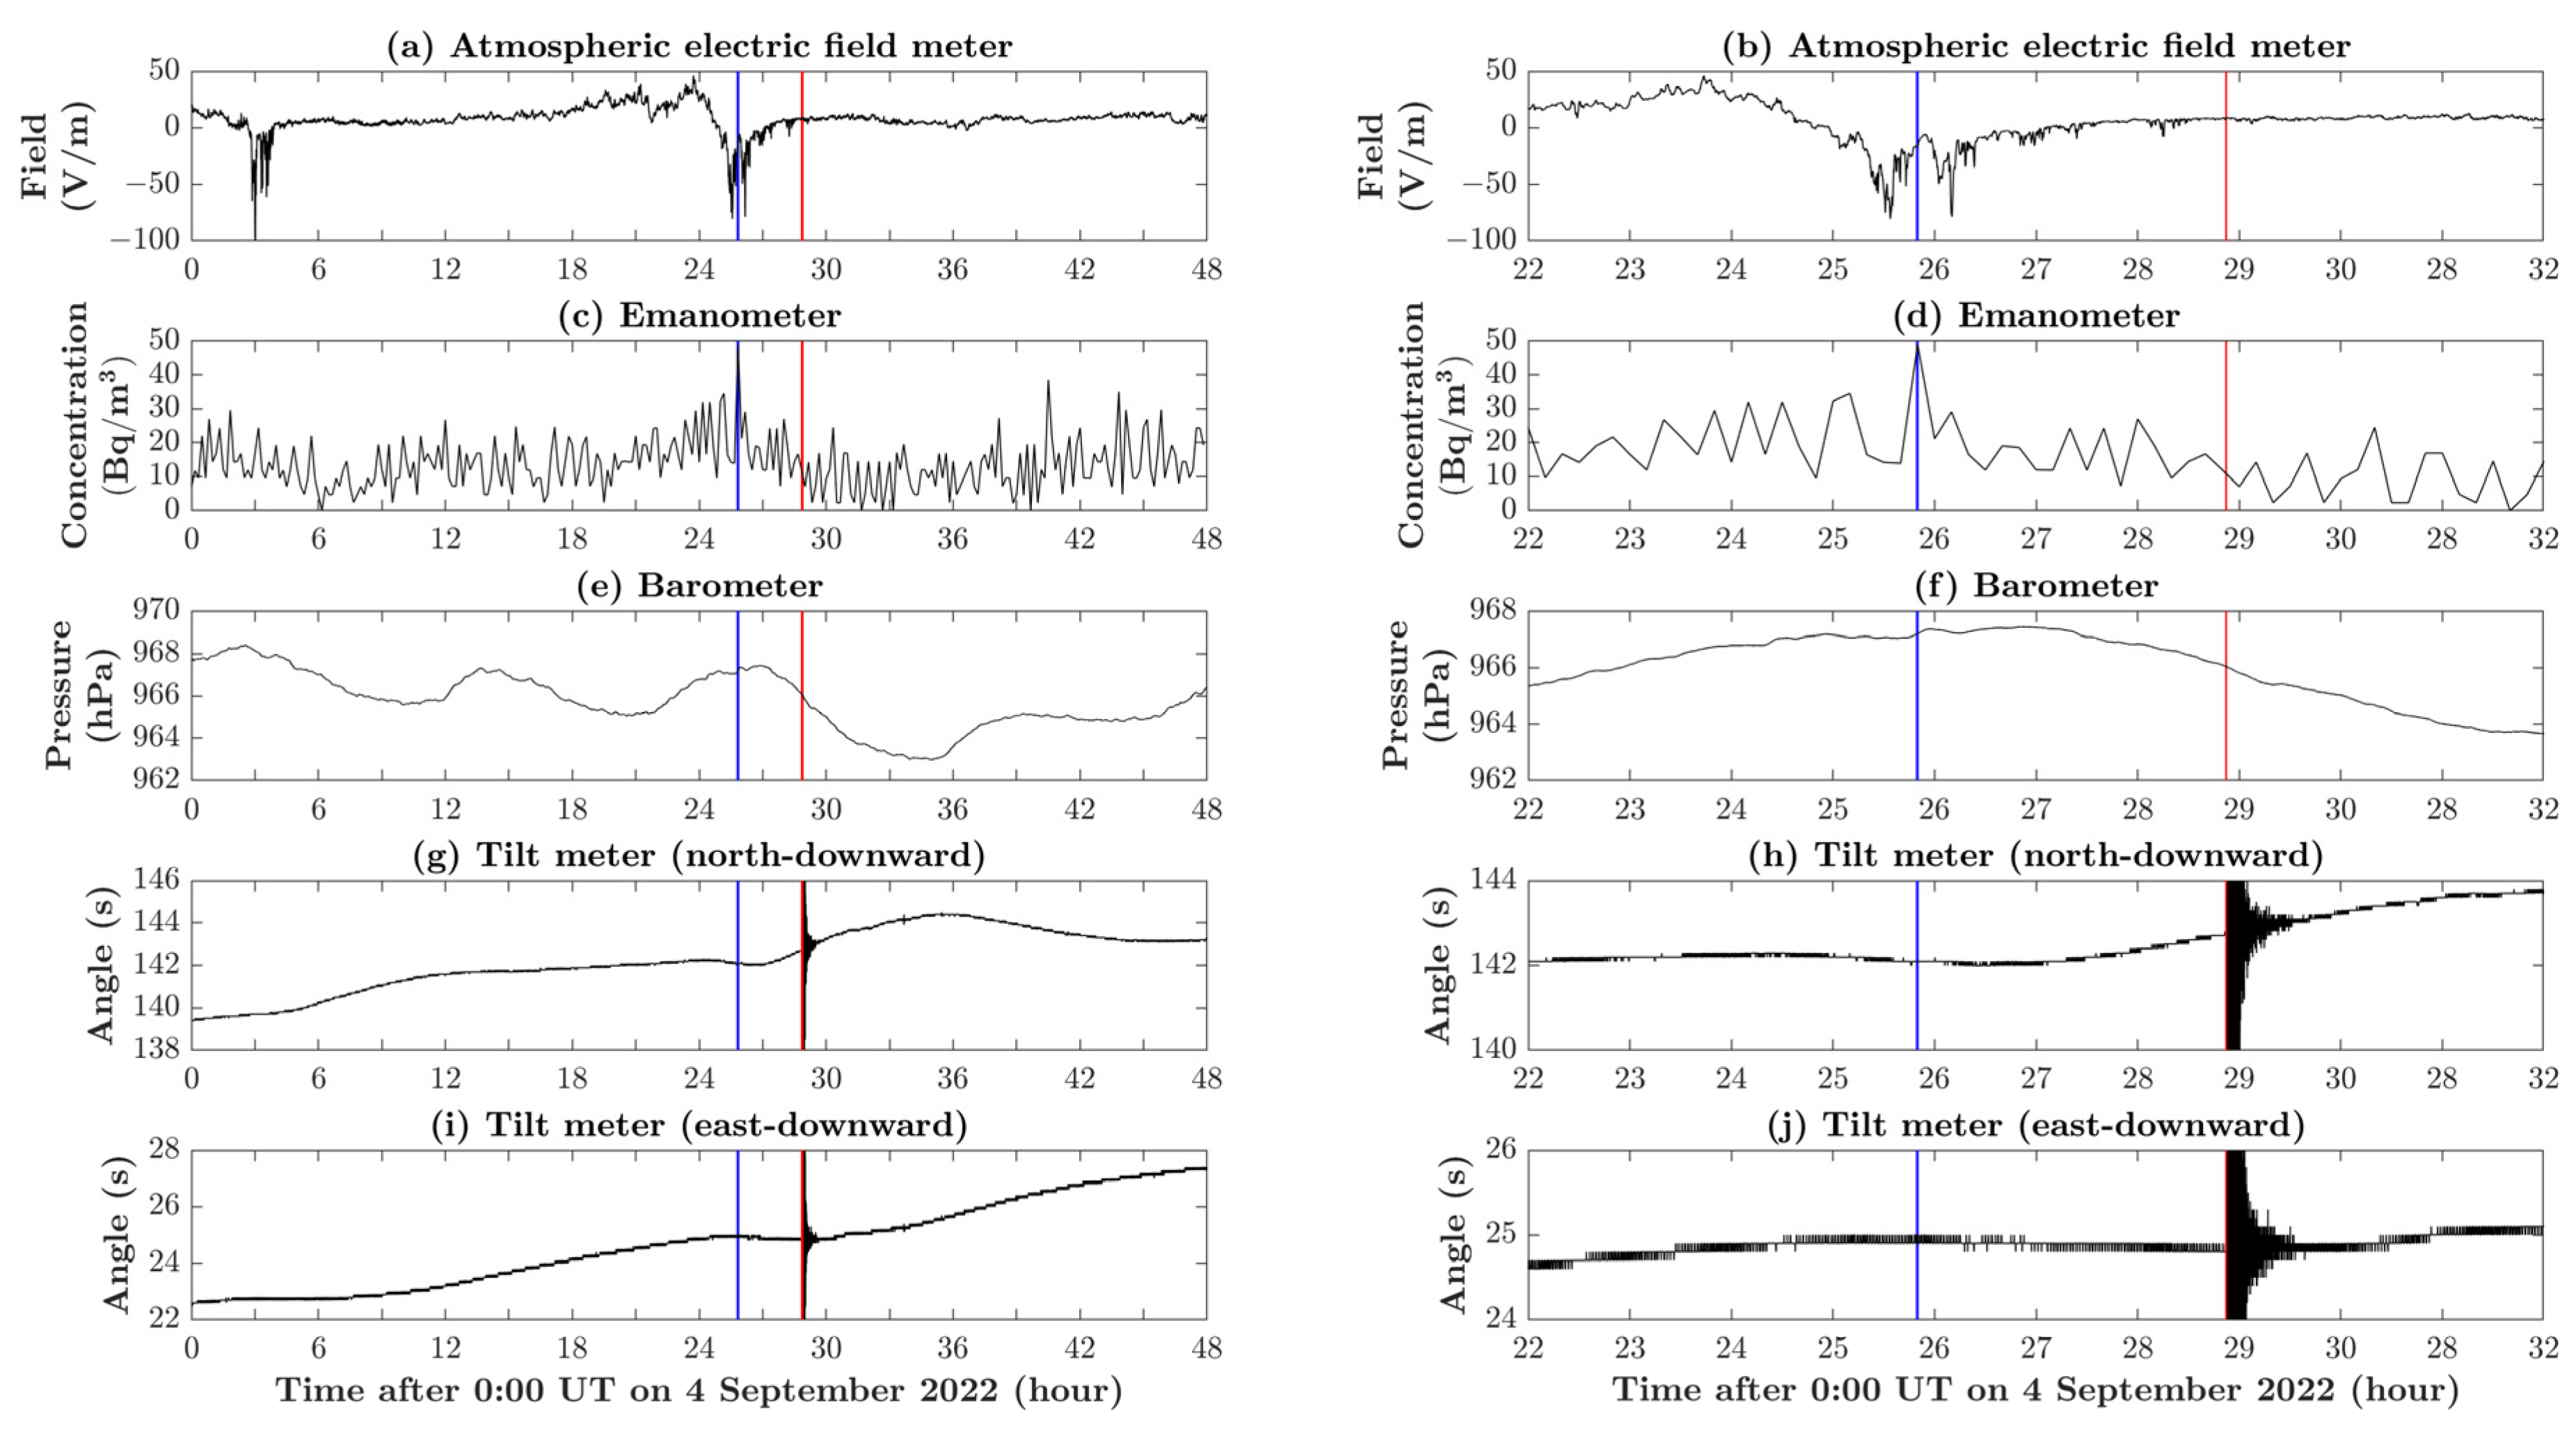
Daily variations in data from the MVP-LAI system have been routinely shown at http://geostation.top (accessed on 4 October 2023; please also visit the website for references). Data from 4 September to 5 September 2022 were retrieved to illustrate various factors, including the atmospheric vertical electric field near the Earth’s surface (Figure 2a,b), radon concentration (Figure 2c,d), air pressure (Figure 2e,f), and ground tilts (Figure 2g–j). Here, we examine this diverse dataset, spanning from the lithosphere to the ionosphere, in order to investigate potential abnormal phenomena preceding the Luding earthquake. It is important to note that the tilts embedded in the magnetometers in the MVP-LAI system were used as seismic data in this study due to the seismometers breaking down during the Luding earthquake. Significant ground tilts were observed at 4:52:48 UT in the tilt data shown in Figure 2g–j. These vibrations were triggered by the seismic waves of the Luding earthquake and appeared approximately 30 s later. The velocity of the ground vibration propagation was approximately ~5.8 (=175/30) km/s, corresponding to the seismic primary waves. Around three hours before the Luding earthquake, there was a temporal change in the east-downward tilts, with persistent east-downward declinations shifting to east-upward declinations (Figure 2i,j). Roughly one hour after the earthquake, the east-upward declination reverted back to east-downward declinations. Similar changes were observed in the north-downward tilts, where the steady north-downward declination temporarily shifted to north-upward declination from three hours to two hours before the earthquake (Figure 2g,h).
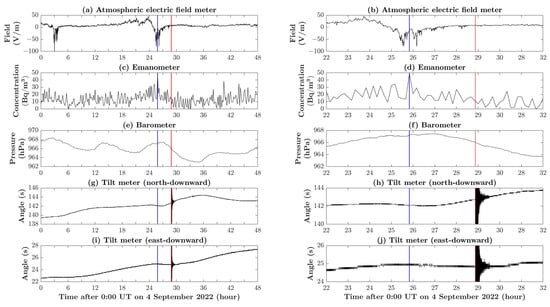
Figure 2.
The changes in five geophysical parameters from the MVP-LAI system between the 4 and 5 September 2022. The variations in the atmosphere’s electric field are depicted in (a,b), while the changes in radon concentration are shown in (c,d). The alterations in air pressure are displayed in (e,f), and the ground tilts for the north downward are illustrated in (g,h). Furthermore, the ground tilts for the east downward can be seen in (i,j). The changes in geophysical parameters over a time span from the 4 to the 5 September 2022 are shown in (a,c,e,g,i). Additionally, the changes in geophysical parameters over a shorter time span from 22:00 UT on the 4 September 2022 to 8:00 UT on the 5 September 2022 are shown in (b,d,f,h,j). The red vertical lines indicate the occurrence of the Luding earthquake, while the blue lines highlight the abnormal changes in geophysical parameters occurring three hours prior to the earthquake.
Barometers monitor changes in air pressure near the Earth’s surface with a sampling interval of 2 s. Figure 2e illustrates air pressure changes with semi-diurnal variations. Additionally, Figure 2f shows a small enhancement coinciding with the semi-diurnal variations around 1:56 UT, with an amplitude of approximately 0.3 hPa. The emanometer records variations in air radon with a sampling interval of 10 min. The radon concentration (Figure 2c) remained low, between 0 Bq/m3 and 30 Bq/m3, but notably increased to around 50 Bq/m3 near 1:50 UT (Figure 2d). Vertical changes in the atmospheric electric field near the Earth’s surface are monitored using the atmospheric electric meter with a sampling interval of 1 s. Significant drops in the atmospheric electric field occurred around 3:00 UT on 4 September 2022, and 1:30 UT on 5 September 2022 (Figure 2a). No abnormal phenomenon was observed in the other geophysical parameters around 3:00 UT on 4 September 2022. However, a drop in the atmospheric electric field, corresponding to the anomalous changes in the other geophysical parameters around 1:50 UT, can be seen (Figure 2b). In summary, abnormal changes were detected in multiple geophysical parameters near the Earth’s surface in the MVP-LAI system at approximately 1:50 UT, approximately 3 h before the Luding earthquake.
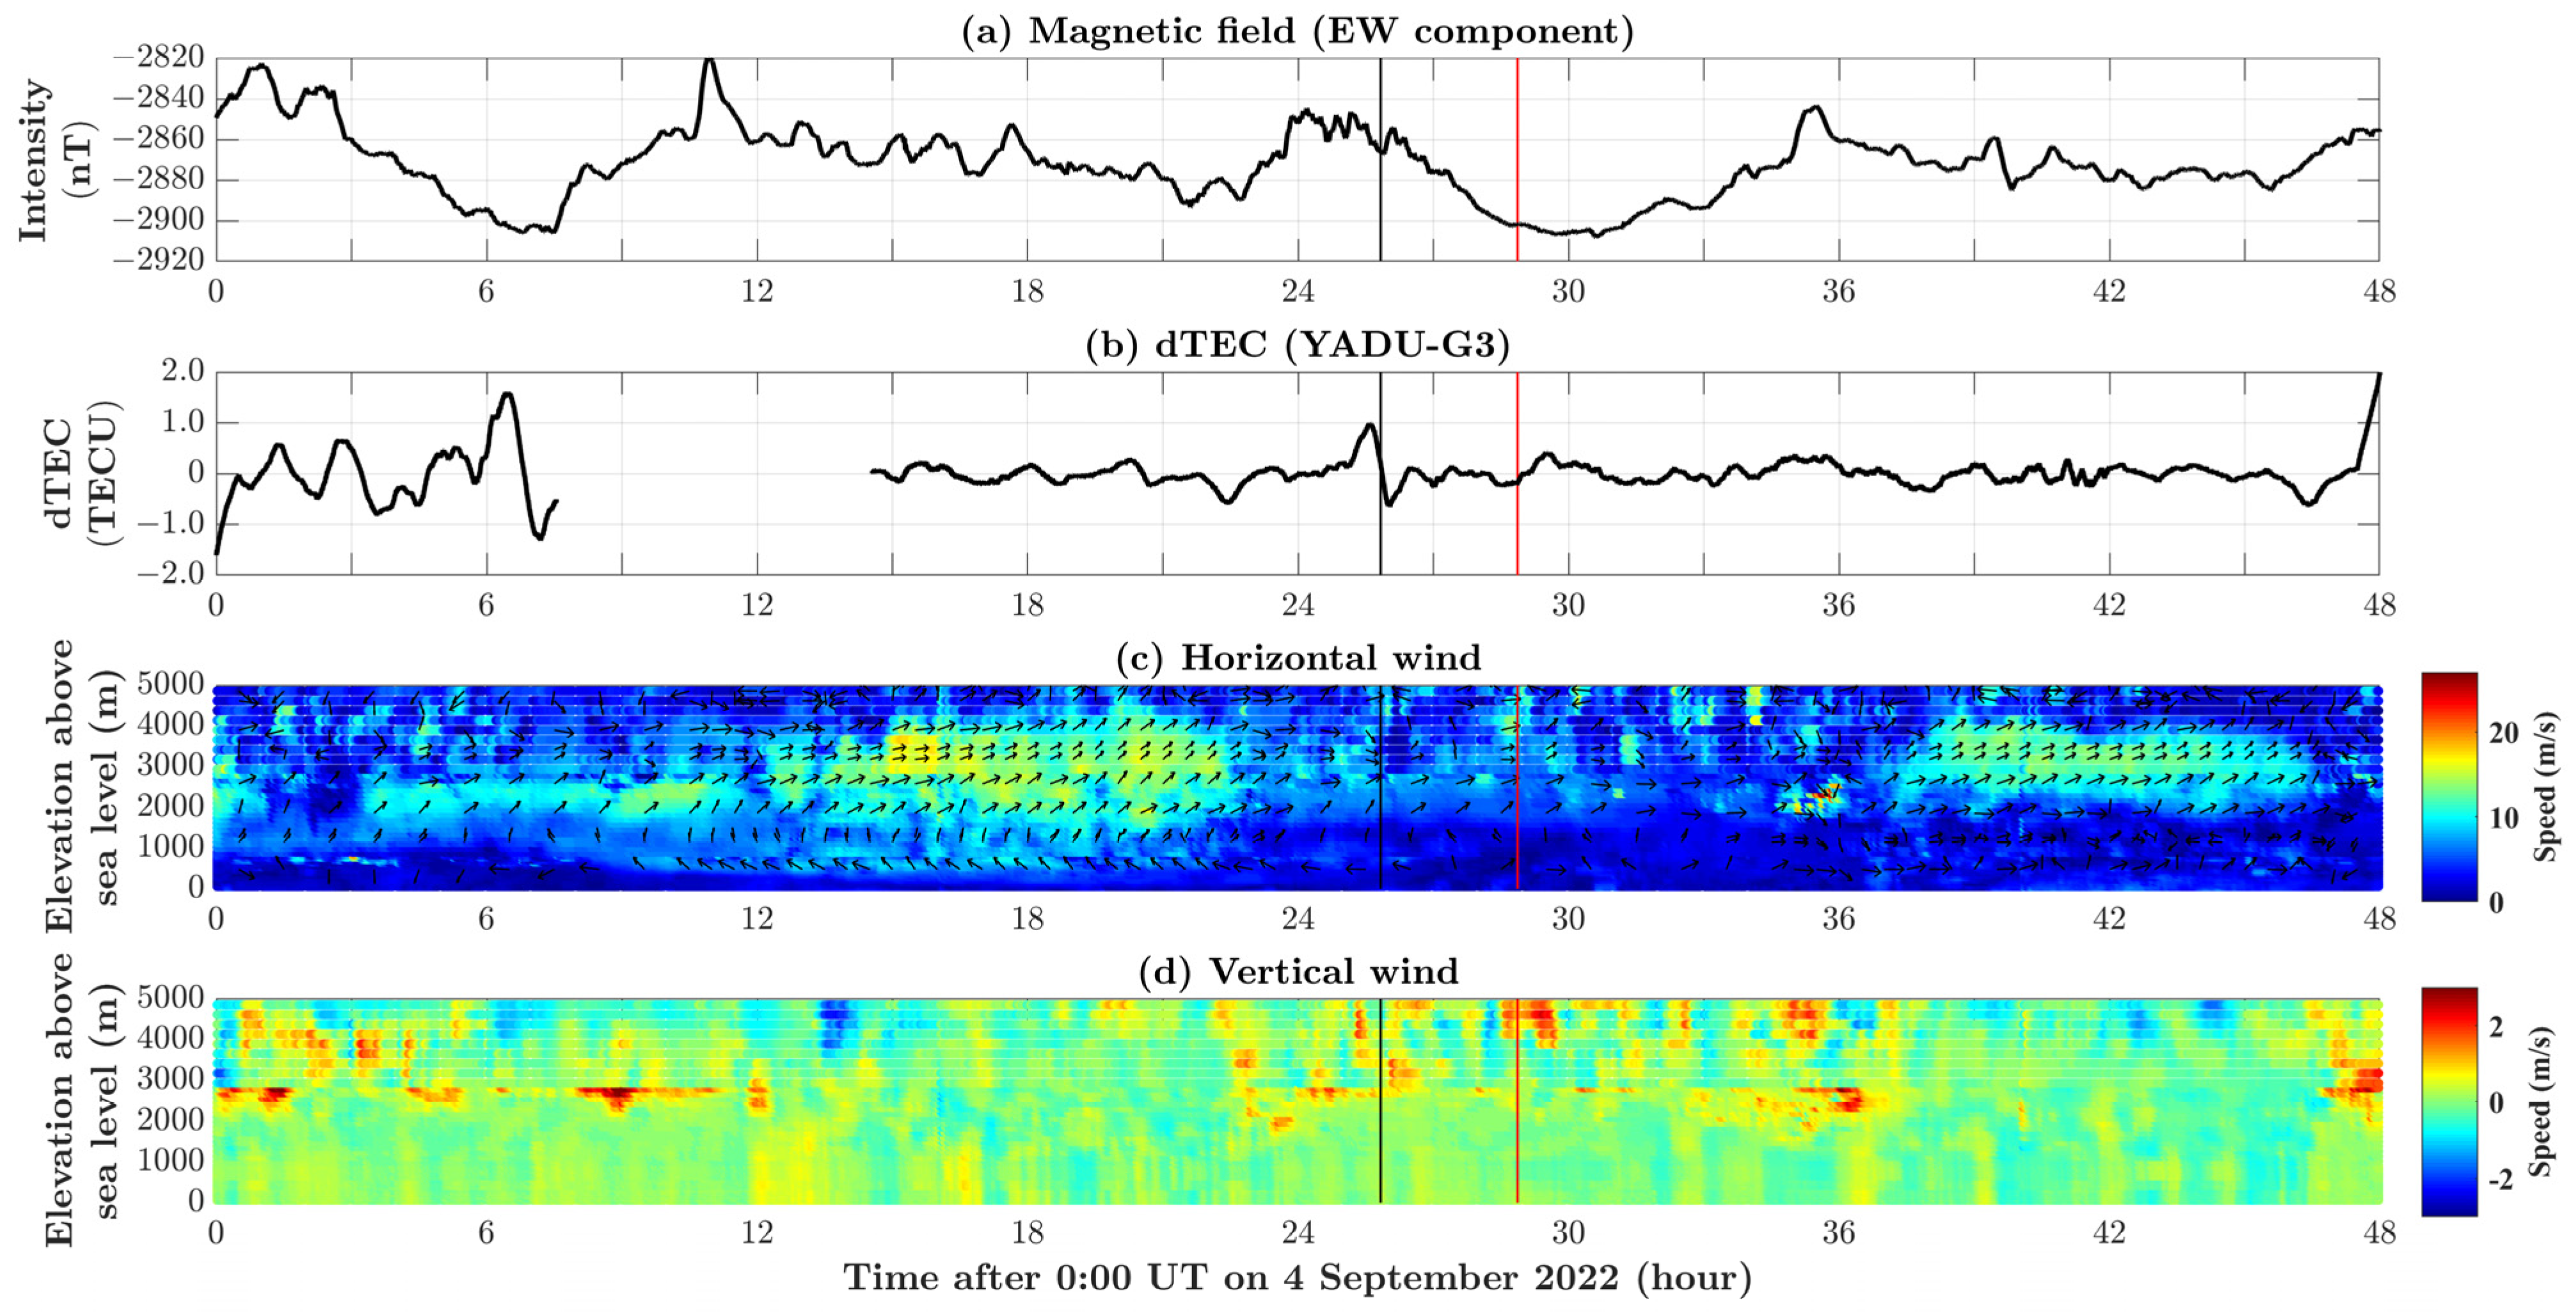
Figure 3 illustrates changes in the wind field, geomagnetic field, and TECs during the Luding earthquake. The radar wind profile in the MVP-LAI system monitors the three-dimensional wind field from the Earth’s surface up to an altitude of approximately 5000 m, with a 2 min sampling interval. Between approximately 12:00 UT and 23:00 UT on 4 September 2022, an intense horizontal wind with a speed of around 15 m/s was observed at altitudes ranging from approximately 2000 m to 4000 m (Figure 3c). After approximately 23:00 UT on 4 September 2022, and until around 13:00 UT on 5 September 2022, this intense horizontal wind either ceased or weakened. However, after 13:00 UT on 5 September 2022, the horizontal wind reversed from weakening to intensifying, with a speed of approximately 10 m/s at altitudes ranging from approximately 3000 m to 4000 m. Simultaneously, the vertical wind frequently changed direction, exhibiting intense upward wind speeds exceeding approximately 3 m/s when the intense horizontal wind either ceased or weakened (Figure 3d). These intense upward winds coincided with abnormal tilt changes, indicating that the wind field was affected by abnormal ground vibrations over a wide area. A magnetometer monitored changes in the geomagnetic field at the north-south, east-west, and vertical components with a 0.1 s sampling interval. Changes in the north–south and east–west components correspond to ionospheric currents at an altitude of approximately 100 km above the Earth’s surface [45]. Variations in the vertical geomagnetic field are attributed to underground currents [46,47]. No significant abnormal phenomena were detected in the north–south and vertical geomagnetic field. In contrast, periodic magnetic disturbances with an amplitude of approximately 10 nT were observed from around 0:00 UT to 3:30 UT on 5 September 2022 (Figure 3b). TEC variations over the MVP-LAI system were obtained from ground-based GNSS receivers using electromagnetic signals transmitted from the BeiDou geostationary G3 satellites. To remove long-term background variations (e.g., diurnal variation) in TECs, a moving average computed with a 1 h window was subtracted, resulting in residual TEC (dTEC) values. The dTEC variations with an amplitude of approximately 1.5 TECU (TEC unit = 1016 el/m2) were observed around the same time as abnormal ground vibrations (Figure 2g–j), perturbations in air pressure (Figure 2e,f), increases in radon concentration (Figure 2c,d), decreases in atmospheric electric field (Figure 2a,b), mitigation of horizontal wind (Figure 3c), enhancements of upward wind (Figure 3d), and periodic magnetic perturbations (Figure 3b). This suggests that dTECs in the ionosphere may have been influenced by abnormal ground vibrations approximately 3 h before the Luding earthquake.

Figure 3.
The changes in the magnetic field at the east–west component, residual total electron content (dTEC) at the ionospheric pierce point (IPP) for the YADU-G3 route, and wind field from the MVP-LAI system between the 4 and 5 September 2022. The variations in the magnetic field at the east–west component are presented in (a). The residual TEC (dTEC) at the IPP for the YADU-G3 route is displayed in (b). The horizontal and vertical winds from the surface up to an altitude of 5000 m can be seen in (c,d), respectively. In (c), the arrows indicate the azimuths of the wind. The red vertical lines signify the occurrence of the Luding earthquake, while the black lines highlight the abnormal changes in geophysical parameters occurring three hours before the earthquake.
3. Discussion
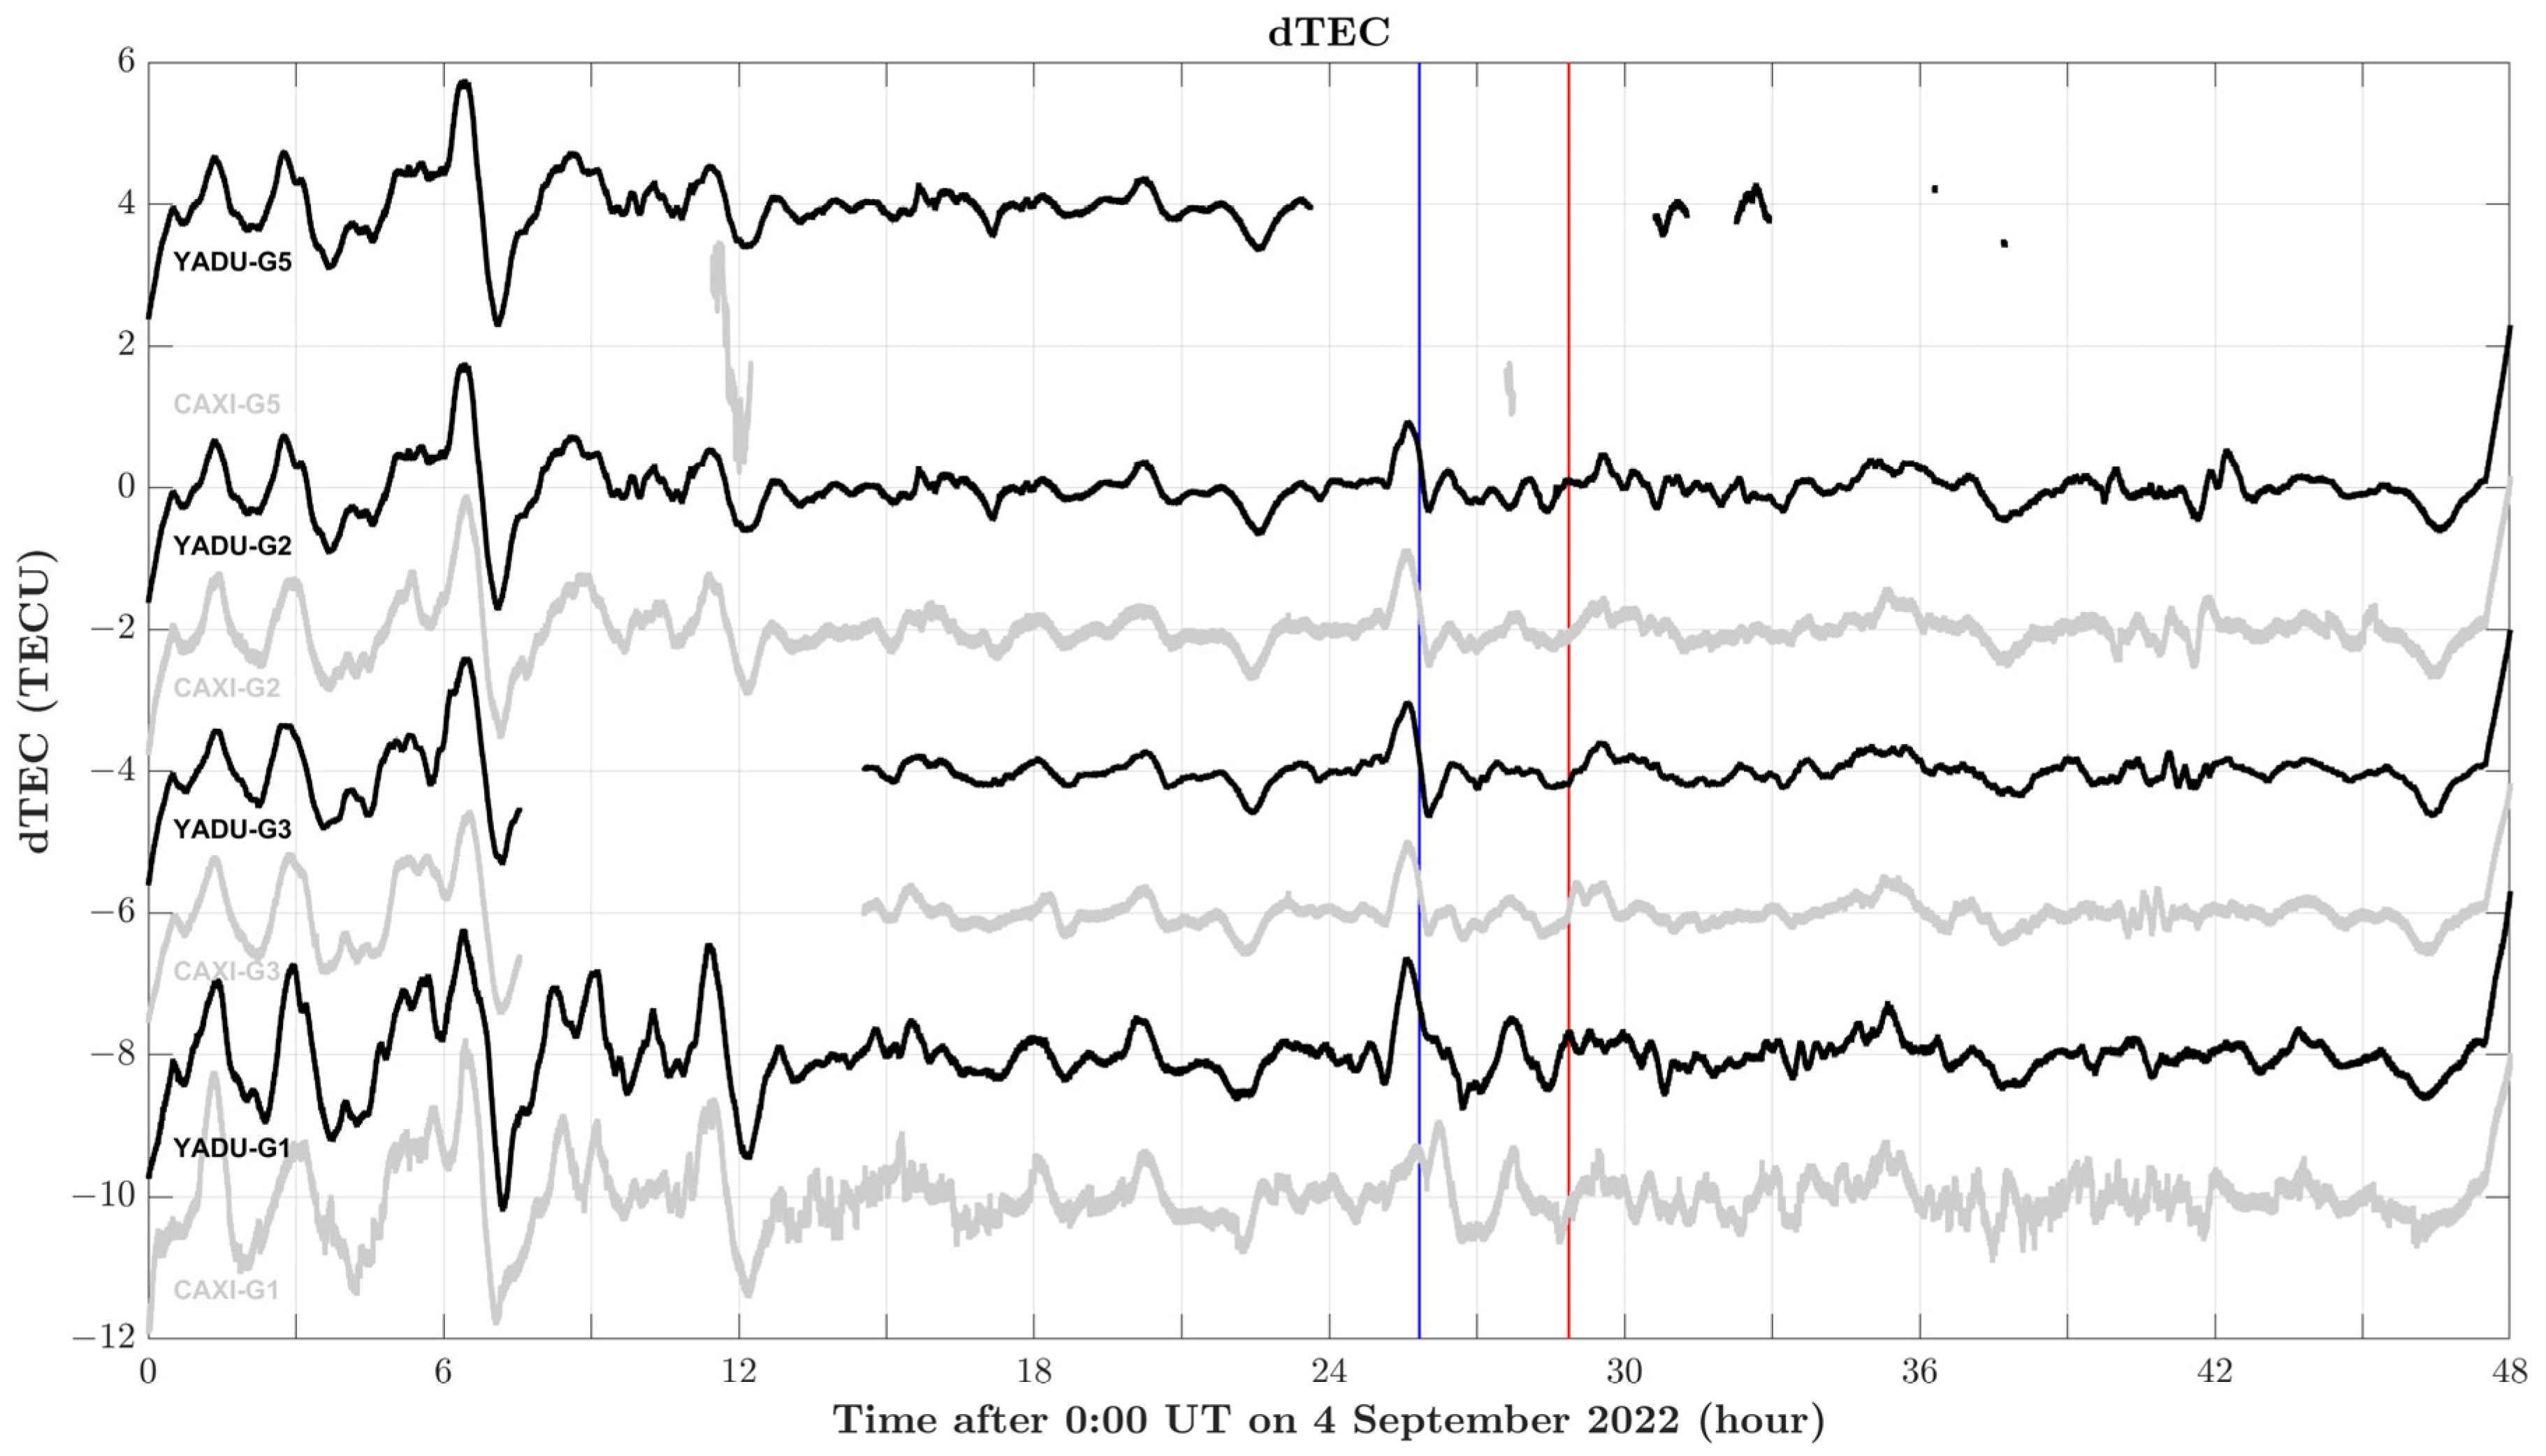
Figure 2 and Figure 3 depict abnormal changes in multiple geophysical parameters at approximately 1:50 UT, which occurred about 3 h before the Luding earthquake. In addition, we gathered TEC data from the YADU and CAXI stations to investigate the spatial distribution of TEC abnormal changes for further clarifying the potential source locations. These data were obtained through the reception of electromagnetic signals emitted by the BeiDou geostationary satellites (G1, G2, G3, and G5) using the standard method [37,48]. The assumed altitude of the IPPs for the collected TEC data is 350 km above the Earth’s surface. Figure 1 shows the approximate latitude alignment of the IPPs at 29.6° N, which is due to the geostationary satellites being stationary and positioned around the equator in space. However, it is worth noting that a series of discontinuities was observed in the electromagnetic signals emitted by the BeiDou G4 satellite. As a result, the TEC data from the BeiDou G4 satellite were not considered in this study.
The dTEC values shown in Figure 4 were computed using TEC data collected from the YADU and CAXI stations, employing the same method of removing a 1 h moving average. Generally, dTEC values from both stations exhibited synchronized changes. This synchronization can be attributed to the fact that the IPPs associated with the TEC measurements were located within a radius of approximately 850 km. Notably, abnormal changes occurring 3 h prior to the Luding earthquake were consistently observed throughout the entire dTEC dataset, except for the dTEC derived from signals emitted by the G1 satellite at the CAXI station. The delayed abnormal changes in dTEC for the CAXI-G1 route compared to others suggest that the sources of TEC perturbations may exist on the west side of this route. Additionally, the IPP for the CAXI-G1 route was approximately 749 km away from the epicenter, a distance that roughly aligns with the earthquake preparation zone proposed in Dobrovolsky et al. [44].
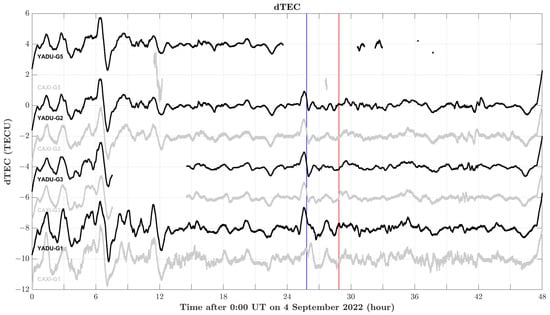
Figure 4.
The changes in residual total electron content (dTEC) at the ionospheric pierce points (IPPs) for ground-based GNSS receivers at the YADU and CAXI substations corresponding to the BeiDou geostationary satellites (i.e., G1, G2, G3, and G) between the 4 and 5 September 2022. The residual TEC (dTEC) at the IPPs, as depicted in Figure 1, for ground-based GNSS receivers at the YADU and CAXI substations corresponding to the BeiDou geostationary satellites, are represented by the black and gray curves. The routes (station code–satellite code) are denoted below the curves with the same color. The red vertical line indicates the occurrence of the Luding earthquake, while the blue line highlights the abnormal changes in other geophysical parameters obtained three hours before the earthquake.
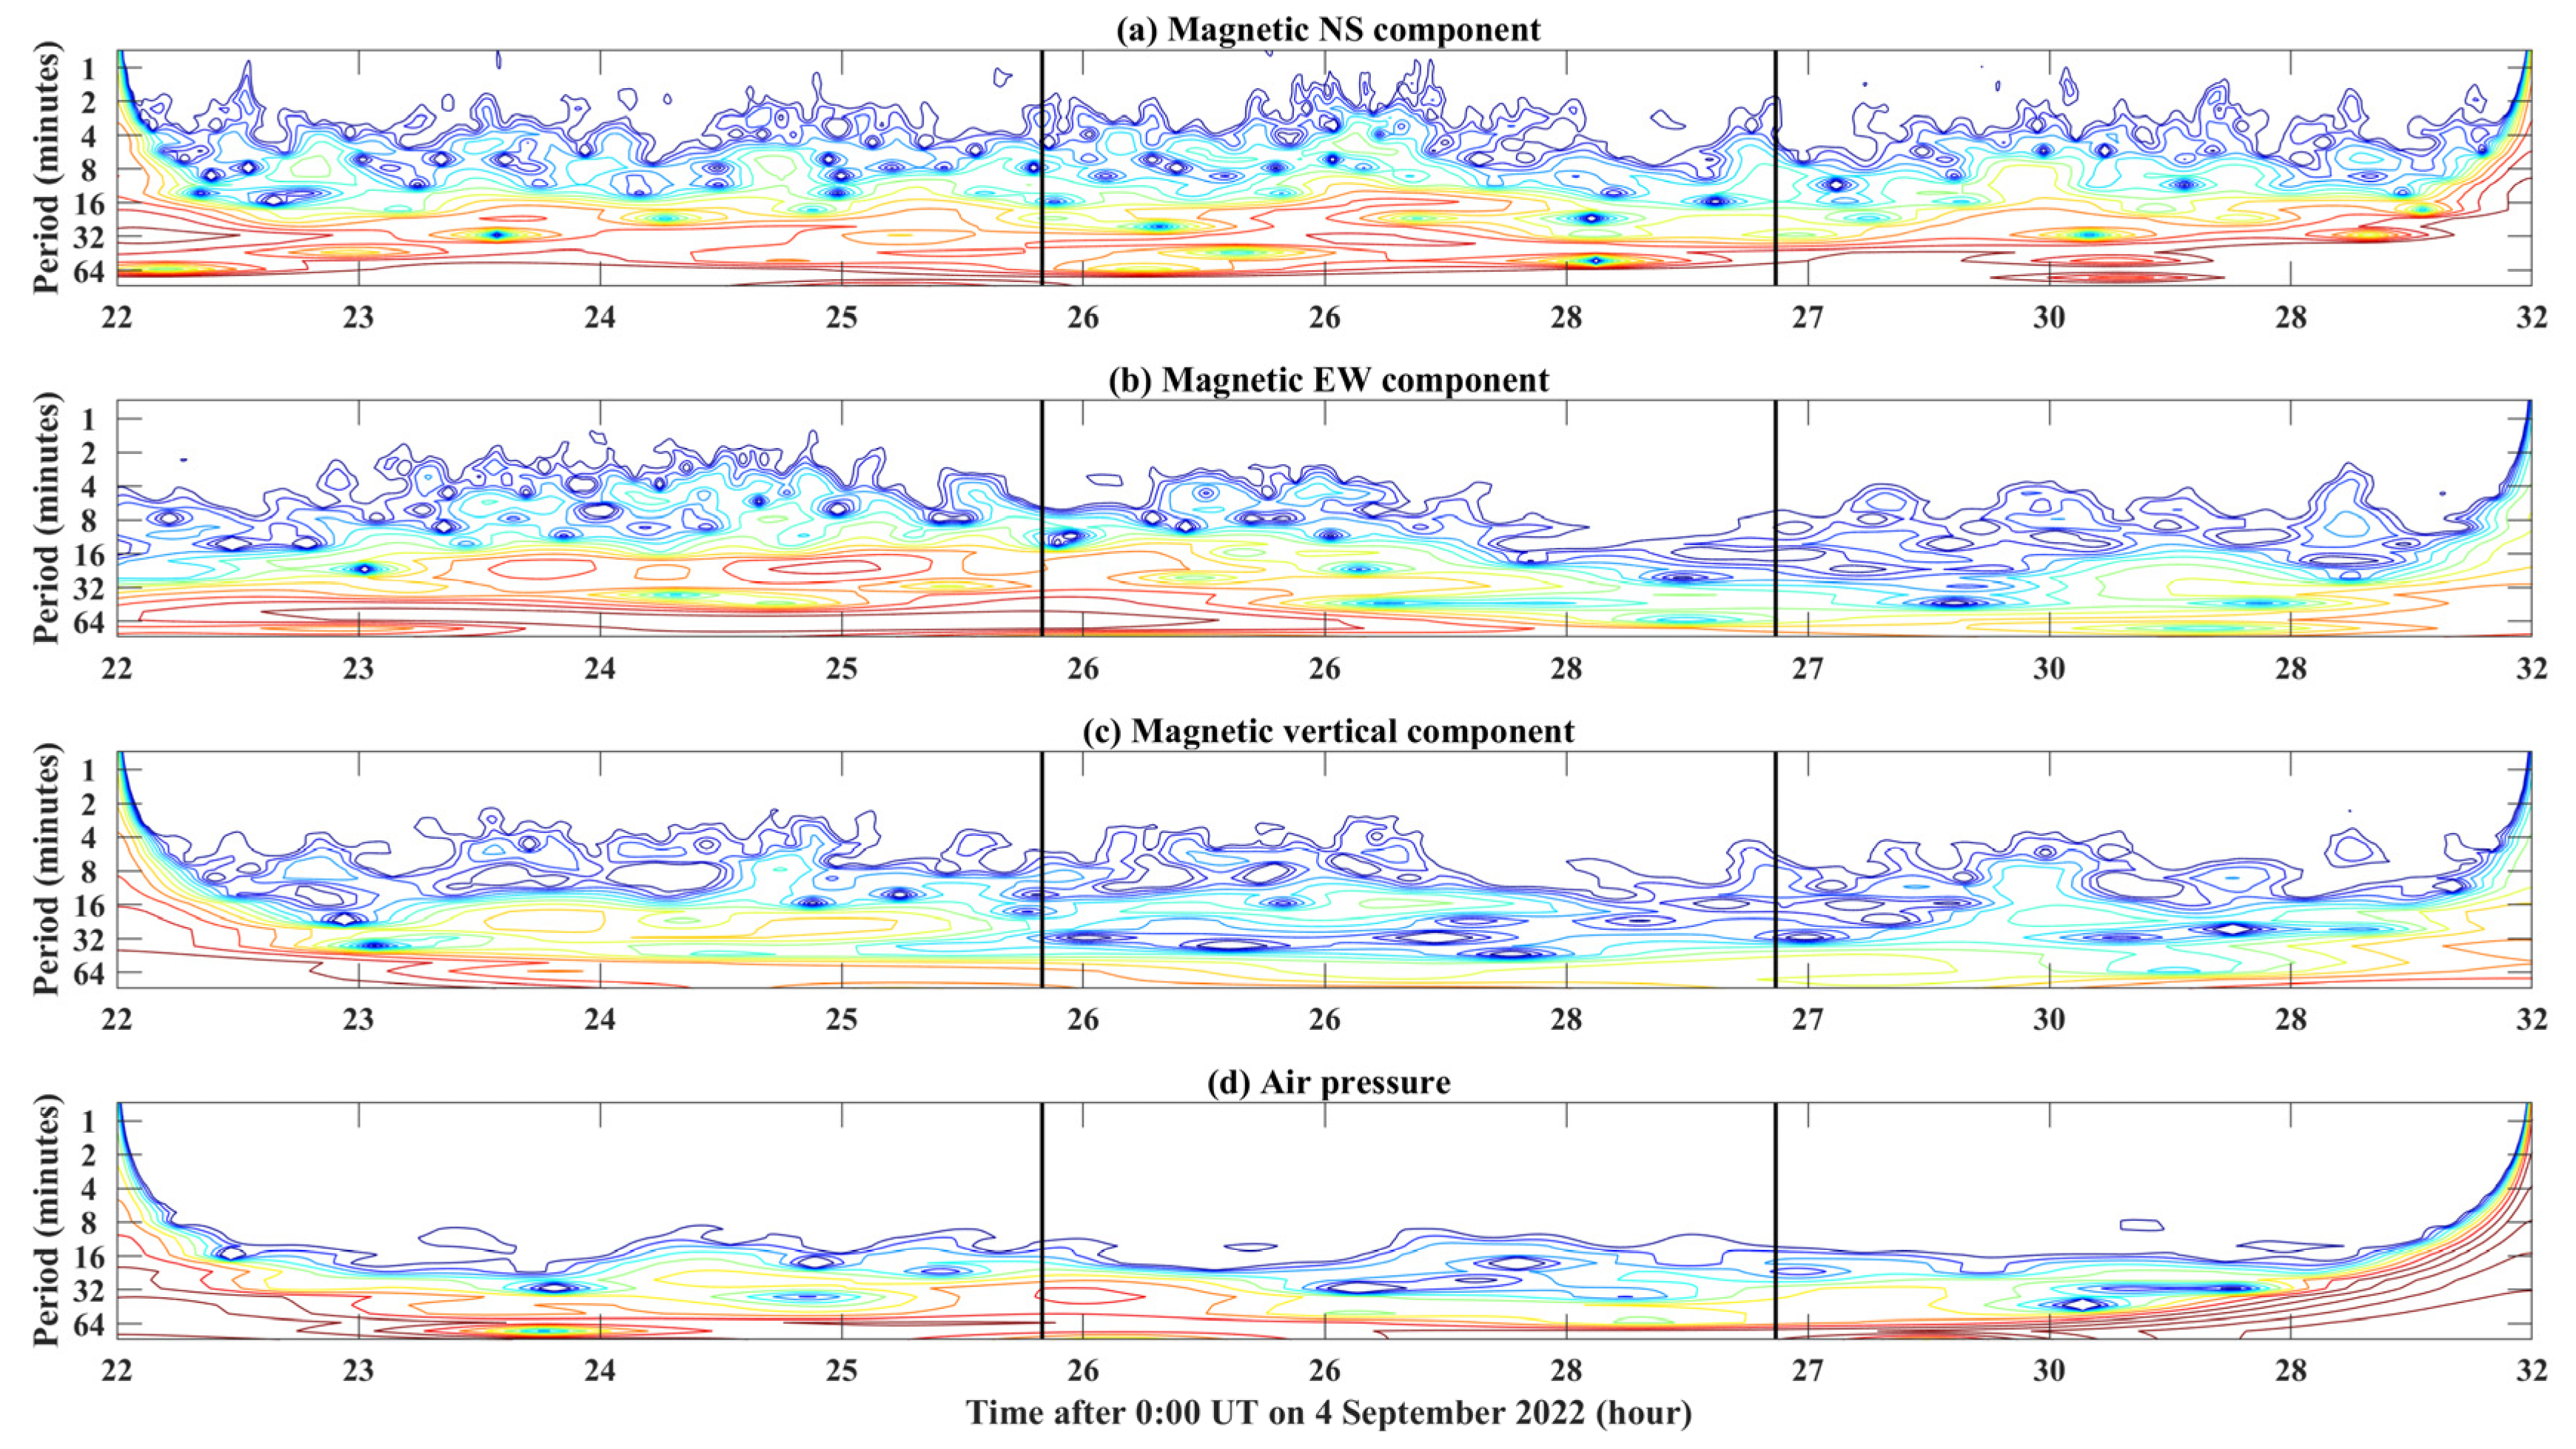
The second question pertains to the relatively small abnormal signals observed in the geomagnetic field and air pressure, which may not, by themselves, be convincing. To further analyze these signals, we employed the Morlet wavelet transform [49] to convert the magnetic and air pressure data into the frequency domain shown in Figure 5. We examined the magnetic field, specifically the north–south component (Figure 5a) and the vertical component (Figure 5c), no significant enhancements were detected around 3 h before the Luding earthquake that numerous anomalies were observed. Conversely, in the east–west component, enhancements with a period of 14–32 min were noted from 6 h to 3.5 h before the earthquake (Figure 5b). These enhancements temporarily subsided and then reversed around 3 h before the earthquake. The period of the secondary enhancements was similar to the first but slightly longer (16–32 min). In the air pressure data, Figure 5d displays a clear enhancement with a period of approximately 16–40 min around 3 h before the earthquake. The presence of these enhancements in both air pressure and the east–west component of the geomagnetic field, occurring at the same time and with similar periods, suggests that they may have a common underlying physical mechanism. These abnormal changes in air pressure and the geomagnetic field at the east-west component could provide valuable clues for identifying other abnormal parameters.
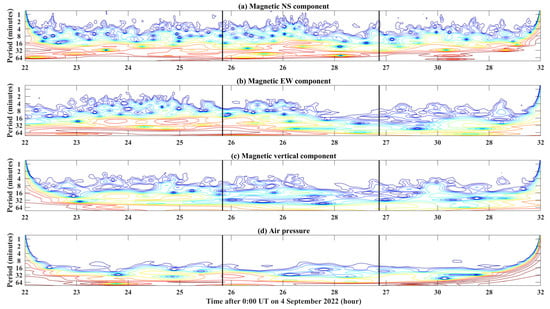
Figure 5.
The time-period–energy distribution of the geomagnetic field and the air pressure from the MVP-LAI system between the 4 and 5 September 2022. The geomagnetic and air pressure data, obtained from the MVP-LAI system, are transformed into the frequency domain using the Morlet wavelet transform [44]. The color changing from blue to red suggests that the energy goes from weak to strong. Panels (a–c) display the time-period-energy distribution of the geomagnetic field for the north-south, east-west, and vertical components, respectively. Panel (d) presents the time-period-energy distribution of the air pressure data. The black vertical lines indicate occurrences three hours before the Luding earthquake, which were determined based on abnormal changes in other geophysical parameters and the earthquake occurrence time.
Four potential channels have been proposed to explain the coupling between the lithosphere, atmosphere, and ionosphere for multiple geophysical parameters before earthquakes in Hayakawa [50,51]. These channels include the chemical channel, conductivity channel, acoustic-gravity channel, and electromagnetic channel. In the chemical channel, the concentration of radon plays a key role in triggering anomalies in various geophysical parameters [52,53,54,55]. The decay of radon radiation leads to electromagnetic anomalies. The conductivity channel is associated with an increase in conductivity, which can result in more upward lightning strikes, causing heating in the ionosphere [56,57,58,59,60]. The acoustic-gravity channel involves thermal anomalies and pre-earthquake ground vibrations that generate upward acoustic-gravity waves, leading to changes in TECs in the ionosphere [61,62,63,64,65,66,67,68,69]. In the electromagnetic channel, electromagnetic waves emitted from the lithosphere can modify the ionosphere [70,71,72,73].
Figure 2c,d show an abnormal increase in radon concentration approximately 3 h before the Luding earthquake. This suggests that the chemical channel dominates the seismo-anomalies in multiple geophysical parameters. Additionally, the decay of radon radiation leads to a decrease in the atmospheric electric field, as demonstrated in Figure 2a,b. This observation coincides with the statistical results in Chen et al. [74], which indicate that negative abnormal signals in the atmospheric electric field usually appear 2–48 h before major earthquakes. However, the periodic changes in atmospheric pressure, electromagnetic field, and TEC anomalies cannot be fully explained by the chemical channel alone.
Chen et al. [39] observed that Lamb waves changed air pressure by approximately 1 hPa, causing variations of about 10 nT in the geomagnetic field and approximately 2 TECU in the TEC due to the upward propagation of the acoustic waves during the Tonga volcano eruption. The perturbations of air pressure, magnetic field, and TEC share a frequency at around 0.002 Hz. Meanwhile, once the coupling is dominated by the acoustic-gravity waves, abnormal changes in the lithosphere can lead to corresponding changes in the ionosphere within a few minutes to hours [75].
Abnormal changes in the amplitudes of air pressure, magnetic field, and TEC are approximately 0.3 hPa, 10 nT, and 1.5 TECU in this study, respectively. These abnormal changes are comparable to those observed during the Tonga volcano eruption. Abnormal changes in the geomagnetic field components and air pressure exhibit frequency characteristics of 0.0005–0.001 Hz, approximately corresponding to periods of 15–30 min in Figure 5b,d. The TEC variations, with a clear amplitude of about 1.5 TECU (TEC unit) approximately 3 h before the earthquake, have a period of approximately 30 min. This suggests that the coupling between air pressure near the Earth’s surface, the magnetic field at the east–west component influenced by ionospheric currents at around 100 km altitude, and TEC at approximately 350 km altitude may be dominated by the acoustic-gravity channel due to the observed abnormal amplitudes and frequency characteristics.
Nevertheless, once the coupling is dominated by the acoustic-gravity waves, it contradicts the observations in this study that abnormal changes in the lithosphere, atmosphere, and ionosphere exhibit no significant time difference. Although the frequencies were slightly lower than the atmospheric resonance frequency, which is around 0.005 Hz from the surface to an altitude of 500 km [76], the lack of significant time discrepancy between these anomalies suggests a promising mechanism of double resonance [77]. This mechanism implies that a resonance in the ground [32] triggers a resonance in the atmosphere before major earthquakes. Additionally, Figure 3c,d show that the horizontal wind temporarily decreases, and the vertical wind frequently reverses during the Luding earthquake. The frequent reversal of the vertical wind replaces the horizontal winds, providing further evidence of atmospheric resonance. Therefore, it can be concluded that at least two mechanisms dominate the coupling between the lithosphere, atmosphere, and ionosphere before the Luding earthquake, including the chemical channel and double resonance, which simultaneously affect various geophysical parameters.
4. Conclusions
Multiple geophysical parameters exhibit anomalous phenomena in a sequence spanning from months to days before major earthquakes. This has been widely reported in numerous previous studies. This is the first instance where seven distinct geophysical parameters distributed in the lithosphere, atmosphere, and ionosphere all show abnormal phenomena occurring nearly simultaneously, approximately 3 h before the major earthquake. The increase in radon concentration supports the idea that the seismo-LAI coupling is primarily influenced by the chemical channel. However, the chemical channel alone cannot explain the shared frequency characteristics observed among air pressure, the geomagnetic field, and TEC data. A novel abnormal phenomenon involving vertical winds frequently reversing direction, corresponding to the cessation or weakening of horizontal winds, was detected by the radar wind profile in the MVP-LAI system. The characteristics of these reverse wind directions and shared frequencies suggest the presence of promising atmospheric resonance in the LAI coupling. It appears that multiple channels and/or mechanisms play a dominant role in the LAI coupling of various parameters before the Luding earthquake. Additionally, our study’s results confirm the effectiveness of the MVP-LAI system in distinguishing these distinct LAI coupling mechanisms once again.
Author Contributions
Conceptualization, C.-H.C. and Z.M.; methodology, C.-H.C., Z.M. and Y.-Y.S.; software, S.Z.; validation, J.L., Z.M. and Y.-Y.S.; formal analysis, C.-H.C. and Z.M.; investigation, A.Y., T.C., H.Q., T.L. and F.W.; writing—original draft preparation, C.-H.C. and Z.M.; writing—review and editing, Z.M., Y.-Y.S., J.L., T.C., X.Z., T.L., Y.G. and F.W.; visualization, C.-H.C. and Z.M.; funding acquisition, C.-H.C., X.Z., A.Y. and Y.G. All authors have read and agreed to the published version of the manuscript.
Funding
This research was funded by the Special Fund of China Seismic Experimental Site, grant number CEAIEF20230401, National Natural Science Foundation of China (NNSFC), grant number 42230207, the Special Training Project of National Science Foundation of Xinjiang Uygur Autonomous Region, grant number 2022D03031, and the State Key Laboratory of Geodesy and Earth’s Dynamics, Innovation Academy for Precision Measurement Science and Technology, grant number SKLGED2023-3-4.
Data Availability Statement
Daily data have been shown on the website: http://geostation.top (assessed on 20 November 2023). Data are available by directly contacting the first author, Chieh-Hung Chen, through the E-mail: nononochchen@gmail.com.
Acknowledgments
The authors thank the people who established and maintain the MVP-LAI system and the substations providing numerous geophysical data.
Conflicts of Interest
Author Tianya Luo was employed by Guangxi Transportation Science and Technology Group Co., Ltd. The remaining authors declare that the research was conducted in the absence of any commercial or financial relationships that could be construed as a potential conflict of interest.
References
- Hayakawa, M.; Molchanov, O.A. Seismo Electromagnetics, Lithospheric-Atmospheric-Ionospheric Coupling; Terra Science Publication Co.: Tokyo, Japan, 2002. [Google Scholar]
- Pulinets, S.; Ouzounov, D. Lithosphere–Atmosphere–Ionosphere Coupling (LAIC) model–An unified concept for earthquake precursors validation. J. Asian Earth Sci. 2011, 41, 371–382. [Google Scholar] [CrossRef]
- Mehdi, S.; Shah, M.; Naqvi, N.A. Lithosphere atmosphere ionosphere coupling associated with the 2019 Mw 7.1 California earthquake using GNSS and multiple satellites. Environ. Monit. Assess. 2021, 193, 501. [Google Scholar]
- Adil, M.A.; Şentürk, E.; Pulinets, S.A.; Amory-Mazaudier, C. A lithosphere–atmosphere–ionosphere coupling phenomenon observed before M 7.7 Jamaica Earthquake. Pure Appl. Geophys. 2021, 178, 3869–3886. [Google Scholar] [CrossRef]
- Parrot, M.; Tramutoli, V.; Liu, T.J.Y.; Pulinets, S.; Ouzounov, D.; Genzano, N.; Lisi, M.; Hattori, K.; Namgaladze, A. Atmospheric and ionospheric coupling phenomena associated with large earthquakes. Eur. Phys. J. Spec. Top. 2021, 230, 197–225. [Google Scholar] [CrossRef]
- Shen, X.; Zhang, X.; Wang, L.; Chen, H.; Wu, Y.; Yuan, S.; Shen, J.; Zhao, S.; Qian, J.; Ding, J. The earthquake-related disturbances in ionosphere and project of the first China seismo-electromagnetic satellite. Earthq. Sci. 2011, 24, 639–650. [Google Scholar] [CrossRef]
- Reid, H.F. The Mechanics of the Earthquake. In The California Earthquake of April 18, 1906: Report of the State Earthquake Investigation Commission; Carnegie Institution of Washington Publication: Washington, DC, USA, 1910. [Google Scholar]
- Liu, J.Y.; Chen, Y.I.; Pulinets, S.A.; Tsai, Y.B.; Chuo, Y.J. Seismo-ionospheric signatures prior to M ≥ 6.0 Taiwan earthquakes. Geophys. Res. Lett. 2000, 27, 3113–3116. [Google Scholar] [CrossRef]
- Liu, J.Y.; Chen, Y.I.; Jhuang, H.K.; Lin, Y.S. Ionospheric foF2 and TEC anomalous days associated with M ≥ 5.0 earthquake in Taiwan during 1997–1999. Terr. Atmo. Oceanic Sci. 2004, 15, 371–383. [Google Scholar] [CrossRef]
- Oyama, K.-I.; Kakinami, Y.; Liu, J.-Y.; Kamogawa, M.; Kodama, T. Reduction of electron temperature in low-latitude ionosphere at 600 km before and after large earthquakes. J. Geophys. Res. 2008, 113, A11317. [Google Scholar] [CrossRef]
- Chen, C.H.; Wang, C.H.; Wen, S.; Yeh, T.K.; Lin, C.H.; Liu, J.Y.; Yen, H.Y.; Lin, C.; Rau, R.J.; Lin, T.W. Anomalous frequency characteristics of groundwater level before major earthquake in Taiwan. Hydrol. Earth Syst. Sci. 2013, 17, 1693–1703. [Google Scholar] [CrossRef]
- Chen, C.H.; Tang, C.C.; Cheng, K.C.; Wang, C.H.; Wen, S.; Lin, C.H.; Wen, Y.Y.; Meng, G.; Yeh, T.K.; Jan, J.C.; et al. Groundwater-strain coupling before the 1999 Mw 7.6 Taiwan Chi-Chi earthquake. J. Hydrol. 2015, 524, 378–384. [Google Scholar] [CrossRef]
- Liu, J.Y.; Chen, C.H.; Chen, Y.I.; Yen, H.Y.; Hattori, K.; Yumoto, K. Seismo-geomagnetic anomalies and M ≥ 5.0 earthquakes observed in Taiwan during 1988–2001. Phy. Chem. Earth. 2006, 30, 215–222. [Google Scholar] [CrossRef]
- Yen, H.Y.; Chen, C.H.; Yeh, Y.H.; Liu, J.Y.; Lin, C.R.; Tsai, Y.B. Geomagnetic fluctuations during the 1999 Chi-Chi earthquake in Taiwan. Earth Planets Space 2004, 56, 39–45. [Google Scholar] [CrossRef]
- Liu, J.Y.; Chen, Y.I.; Chuo, Y.J.; Tsai, H.F. Variations of ionospheric total electron content during the Chi-Chi earthquake. Geophys. Res. Lett. 2001, 28, 1383–1386. [Google Scholar] [CrossRef]
- Chen, C.H.; Wen, S.; Liu, J.Y.; Hattori, K.; Han, P.; Hobara, Y.; Wang, C.H.; Yeh, T.K.; Yen, H.Y. Surface displacements in Japan before the 11 March 2011 M9.0 Tohoku-Oki earthquake. J. Asian Earth Sci. 2014, 80, 165–171. [Google Scholar] [CrossRef]
- Han, P.; Hattori, K.; Huang, Q.; Hirooka, S.; Yoshino, C. Spatiotemporal characteristics of the geomagnetic diurnal variation anomalies prior to the 2011 Tohoku earthquake (Mw 9.0) and the possible coupling of multiple pre-earthquake phenomena. J. Asian Earth Sci. 2016, 129, 13–21. [Google Scholar] [CrossRef]
- Orihara, Y.; Kamogawa, M.; Nagao, T. Preseismic Changes of the level and temperature of confined groundwater related to the 2011 Tohoku earthquake. Sci. Rep. 2014, 4, 6907. [Google Scholar] [CrossRef]
- Varotsos, P.A.; Sarlis, N.V.; Skordas, E.S.; Lazaridou, M.S. Seismic electric signals: An additional fact showing their physical interconnection with seismicity. Tectonophysics 2013, 589, 116–125. [Google Scholar] [CrossRef]
- Sarlis, N.V.; Skordas, E.S.; Varotsos, P.A.; Nagao, T.; Kamogawa, M.; Tanaka, H.; Uyeda, S. Minimum of the order parameter fluctuations of seismicity before major earthquakes in Japan. Proc. Natl. Acad. Sci. USA 2013, 110, 13734–13738. [Google Scholar] [CrossRef]
- Kato, A.; Obara, K.; Igarashi, T.; Tsuruoka, H.; Nakagawa, S.; Hirata, N. Propagation of slow slip leading up to the 2011 Mw 9.0 Tohoku-Oki earthquake. Science 2012, 335, 705–708. [Google Scholar] [CrossRef]
- Ito, Y.; Hino, R.; Kido, M.; Fujimoto, H.; Osada, Y.; Inazu, D.; Ohta, Y.; Iinuma, T.; Ohzono, M.; Miura, S.; et al. Episodic slow slip events in the Japan subduction zone before the 2011 Tohoku-Oki earthquake. Tectonophysics 2013, 600, 14–26. [Google Scholar] [CrossRef]
- Hattori, K.; Han, P. Investigation on preparation process of the 2011 off the Pacific Coast of Tohoku Earthquake (Mw 9.0) by GPS data. In Proceedings of the 2014 American Geophysics Union Fall Meeting, San Francisco, CA, USA, 15–19 December 2014. [Google Scholar]
- Le, H.; Liu, L.; Liu, J.-Y.; Zhao, B.; Chen, Y.; Wan, W. The ionospheric anomalies prior to the M9.0 Tohoku-Oki earthquake. J. Asian Earth Sci. 2013, 62, 476–484. [Google Scholar] [CrossRef]
- Heki, K. Ionospheric electron enhancement preceding the 2011 Tohoku-Oki earthquake. Geophys. Res. Lett. 2011, 38, 312. [Google Scholar] [CrossRef]
- Hayakawa, M. Probing the Lower Ionospheric Perturbations Associated with Earthquakes by Means Of Sub-Ionospheric VLF/LF Propagation. Earthq. Sci. 2011, 24, 609–637. [Google Scholar] [CrossRef]
- Hayakawa, M.; Molchanov, O.A.; Ondoh, T.; Kawai, E. The Precursory Signature Effect of the Kobe Earthquake on VLF Sub-Ionospheric Signals. J. Comm. Res. Lab. 1996, 43, 169–180. [Google Scholar]
- Hayakawa, M. VLF/LF Radio Sounding of Ionospheric Perturbations Associated with Earthquakes. Sensors 2007, 7, 1141–1158. [Google Scholar] [CrossRef]
- Molchanov, O.; Hayakawa, M.; Oudoh, T.; Kawai, E. Precursory Effects in the Sub-Ionospheric VLF Signals for the Kobe Earthquake. Phys. Earth Planet. Inter. 1998, 105, 239–248. [Google Scholar] [CrossRef]
- Politis, D.Z.; Potirakis, S.M.; Contoyiannis, Y.F.; Biswas, S.; Sasmal, S.; Hayakawa, M. Statistical and Criticality Analysis of the Lower Ionosphere Prior to the 30 October 2020 Samos (Greece) Earthquake (M6.9), Based on VLF Electromagnetic Propagation Data as Recorded by a New VLF/LF Receiver Installed in Athens (Greece). Entropy 2021, 23, 676. [Google Scholar] [CrossRef]
- Chen, C.H.; Yeh, T.K.; Liu, J.Y.; Wang, C.H.; Wen, S.; Yen, H.Y.; Chang, S.H. Surface Deformation and Seismic Rebound: Implications and applications. Surv. Geophys. 2011, 32, 291–313. [Google Scholar] [CrossRef]
- Chen, C.H.; Lin, L.-C.; Yeh, T.-K.; Wen, S.; Yu, H.; Yu, C.; Gao, Y.; Han, P.; Sun, Y.-Y.; Liu, J.-Y.; et al. Determination of epicenters before earthquakes utilizing far seismic and GNSS data, Insights from ground vibrations. Remote Sens. 2020, 12, 3252. [Google Scholar] [CrossRef]
- Bedford, J.R.; Moreno, M.; Deng, Z.; Oncken, O.; Schurr, B.; John, T.; Báez, J.C.; Bevis, M. Months-long thousand-kilometre-scale wobbling before great subduction earthquakes. Nature 2020, 580, 628–635. [Google Scholar] [CrossRef]
- Chen, C.H.; Sun, Y.Y.; Lin, K.; Zhou, C.; Xu, R.; Qing, H.Y.; Gao, Y.; Chen, T.; Wang, F.; Yu, H.; et al. A new instrumental array in Sichuan, China, to monitor vibrations and perturbations of the lithosphere, atmosphere and ionosphere. Surv. Geophys. 2021, 42, 1425–1442. [Google Scholar] [CrossRef]
- Su, X.; Meng, G.; Sun, H.; Wu, W. Positioning performance of BDS observation of the crustal movement observation network of China and its potential application on crustal deformation. Sensors 2018, 18, 3353. [Google Scholar] [CrossRef]
- Wang, F.; Zhang, X.; Dong, L.; Liu, J.; Mao, Z.; Lin, K.; Chen, C.-H. Monitoring Seismo-TEC perturbations utilizing the Beidou geostationary satellites. Remote Sens. 2023, 15, 2608. [Google Scholar] [CrossRef]
- Chen, C.H.; Sun, Y.-Y.; Xu, R.; Lin, K.; Wang, F.; Zhang, D.; Zhou, Y.; Gao, Y.; Zhang, X.; Yu, H.; et al. Resident waves in the ionosphere before the M6.1 Dali and M7.3 Qinghai earthquakes of 21–22 May 2021. Earth Space Sci. 2022, 9, e2021EA002159. [Google Scholar] [CrossRef]
- Chen, C.-H.; Zhang, X.; Sun, Y.-Y.; Wang, F.; Liu, T.-C.; Lin, C.-Y.; Gao, Y.; Lyu, J.; Jin, X.; Zhao, X. Individual Wave Propagations in Ionosphere and Troposphere Triggered by the Hunga Tonga-Hunga Ha’apai Underwater Volcano Eruption on 15 January 2022. Remote Sens. 2022, 14, 2179. [Google Scholar] [CrossRef]
- Chen, C.-H.; Sun, Y.-Y.; Zhang, X.; Wang, F.; Lin, K.; Gao, Y.; Tang, C.-C.; Lyu, J.; Huang, R.; Huang, Q. Far-field coupling and interactions in multiple geospheres after the Tonga volcano eruptions. Surv. Geophys. 2023, 44, 587–601. [Google Scholar] [CrossRef]
- Hayakawa, M.; Schekotov, A.; Izutsu, J.; Nickolaenko, A.P.; Hobara, Y. Seismogenic ULF/ELF Wave Phenomena: Recent Advances and Future Perspectives. Open J. Earthq. Res. 2023, 12, 45–133. [Google Scholar] [CrossRef]
- Fan, X.; Wang, X.; Dai, L.; Fang, C.; Deng, Y.; Zou, C.; Tang, M.; Wei, Z.; Dou, X.; Zhang, J.; et al. Characteristics and spatial distribution pattern of Ms 6.8 Luding earthquake occurred on September 5, 2022. J. Eng. Geol. 2022, 30, 1504–1516. [Google Scholar] [CrossRef]
- An, Y.; Wang, D.; Ma, Q.; Xu, Y.; Li, Y.; Zhang, Y.; Liu, Z.; Huang, C.; Su, J.; Li, J.; et al. Preliminary report of the September 5, 2022 Ms 6.8 Luding earthquake, Sichuan, China. Earthq. Res. Adv. 2023, 3, 100184. [Google Scholar] [CrossRef]
- Liu, J.; Zhang, X.; Yang, X.; Yang, M.; Zhang, T.; Bao, Z.; Wu, W.; Qiu, G.; Yang, X.; Lu, Q. The Analysis of Lithosphere–Atmosphere– Ionosphere Coupling Associated with the 2022 Luding Ms6.8 Earthquake. Remote Sens. 2023, 15, 4042. [Google Scholar] [CrossRef]
- Dobrovolsky, I.P.; Zubkov, S.I.; Miachkin, V.I. Estimation of the size of earthquake preparation zones. Pure Appl. Geophys. 1979, 117, 1025–1044. [Google Scholar] [CrossRef]
- Yamazaki, Y.; Maute, A. Sq and EEJ—A review on the daily variation of the geomagnetic field caused by ionospheric dynamo currents. Space Sci. Rev. 2017, 206, 299–405. [Google Scholar] [CrossRef]
- Campbell, W.H. Introduction to Geomagnetic Fields; Cambridge University Press: Cambridge, UK, 2003. [Google Scholar]
- Rasson, J.L.; Lévêque, J.J. The Earth’s Magnetic Field: Its History, Origin and Planetary Perspective; Springer: Berlin/Heidelberg, Germany, 2004. [Google Scholar]
- Liu, J.Y.; Tsai, H.F.; Jung, T.K. Total electron content obtained by using the global positioning system. Terr. Atmos. Ocean Sci. 1996, 7, 107–117. [Google Scholar] [CrossRef]
- Torrence, C.; Compo, G.P. A practical guide to wavelet analysis. Bull Am. Meteor Soc. 1998, 79, 61–78. [Google Scholar] [CrossRef]
- Hayakawa, M. Earthquake Prediction with Radio Techniques; John Wiley & Sons: Hoboken, NJ, USA; Singapore Pte Ltd.: Singapore, 2015; p. 294. [Google Scholar]
- Hayakawa, M. Earthquake Prediction with Electromagnetic Phenomena. In AIP Conference Proceedings; AIP Publishing: Melville, NY, USA, 2016; Volume 1705, p. 20002. [Google Scholar]
- Pulinets, S.A.; Boyarchuk, K. Ionospheric Precursors of Earthquakes; Springer: Berlin/Heidelberg, Germany, 2004. [Google Scholar]
- Sorokin, V.; Chemyrev, V.; Hayakawa, M. Electrodynamic Coupling of Lithosphere-Atmosphere-Ionosphere of the Earth; Nova Science Publishing: Hauppauge, NY, USA, 2015. [Google Scholar]
- Harrison, R.G.; Aplin, K.L.; Rycroft, M.J. Atmospheric electricity coupling between earthquake regions and the ionosphere. J. Atmos. Sol. Terr. Phys. 2010, 72, 376–381. [Google Scholar] [CrossRef]
- Harrison, R.; Aplin, K.; Rycroft, M. Brief Communication: Earthquake-cloud coupling through the global atmospheric electric circuit. Nat. Hazards Earth Syst. Sci. 2014, 14, 773–777. [Google Scholar] [CrossRef]
- Inan, U.S.; Bell, T.F.; Rodriguez, J.V. Heating and ionization of the lower ionosphere by lightning. Geophys. Res. Lett. 1991, 18, 705–708. [Google Scholar] [CrossRef]
- Pasko, V.P.; Inan, U.S.; Bell, T.F.; Taranenko, Y.N. Sprites produced by quasi-electrostatic heating and ionization in the lower ionosphere. J. Geophys. Res. Space Phys. 1997, 102, 4529–4561. [Google Scholar] [CrossRef]
- Cho, M.; Rycroft, M.J. Computer simulation of the electric field structure and optical emission from cloud-top to the ionospheres. J. Atmos. Solar.-Terr. Phys. 1998, 60, 871–888. [Google Scholar]
- Rodger, C.J. Red sprites, upward lighting and VLF perturbations. Rev. Geophys. 1999, 37, 317–336. [Google Scholar] [CrossRef]
- Takahashi, Y.; Miyasato, R.; Adachi, T.; Adachi, K.; Sera, M.; Uchida, A.; Fukunishi, H. Activities of sprites and elves in the winter season, Japan. J. Atmos. Solar.-Terr. Phys. 2003, 65, 551–560. [Google Scholar] [CrossRef]
- Molchanov, O.A.; Hayakawa, M.; Miyaki, K. VLF/LF sounding of the lower ionosphere to study the role of atmospheric oscillations in the lithosphere-ionosphere coupling. Adv. Polar Upper Atmos. Res. Tokyo 2001, 15, 146–158. [Google Scholar]
- Sun, Y.-Y.; Oyama, K.I.; Liu, J.Y.; Jhuang, H.K.; Cheng, C.Z. The neutral temperature in the ionospheric dynamo region and the ionospheric F region density during Wenchuan and Pingtung Doublet earthquakes. Nat. Hazards Earth Syst. Sci. 2011, 11, 1759–1768. [Google Scholar] [CrossRef]
- Oyama, K.I.; Devi, M.; Ryu, K.; Chen, C.H.; Liu, J.Y.; Liu, H.; Bankov, L.; Kodama, T. Modifications of the ionosphere prior to large earthquakes: Report from the ionospheric precursor study group. Geosci. Lett. 2016, 3, 6. [Google Scholar] [CrossRef]
- Yang, S.-S.; Asano, T.; Hayakawa, M. Abnormal gravity wave activity in the stratosphere prior to the 2016 Kumamoto earthquakes. J. Geophys. Res. Space Phys. 2019, 124, 1410–1425. [Google Scholar] [CrossRef]
- Liu, J.Y.; Chen, C.H.; Sun, Y.Y.; Chen, C.H.; Tsai, H.F.; Yen, H.Y.; Chum, J.; Lastovicka, J.; Yang, Q.S.; Chen, W.S.; et al. The vertical propagation of disturbances triggered by seismic waves of the 11 March 2011 M9.0 Tohoku earthquake over Taiwan. Geophys. Res. Lett. 2016, 43, 1759–1765. [Google Scholar] [CrossRef]
- Chou, M.Y.; Cherniak, I.; Lin, C.C.H.; Pedatella, N.M. The persistent ionospheric responses over Japan after the impact of the 2011 Tohoku earthquake. Space Weather 2020, 18, e2019SW002302. [Google Scholar] [CrossRef]
- Yang, S.S.; Hayakawa, M. Gravity wave activity in the stratosphere before the 2011 Tohoku earthquake as the mechanism of lithosphere-atmosphere-ionosphere coupling. Entropy 2020, 22, 110. [Google Scholar] [CrossRef]
- Yang, S.S.; Potirakis, S.M.; Sasmal, S.; Hayakawa, M. Natural time analysis of global navigation satellite system surface deformation: The case of the 2016 Kumamoto earthquakes. Entropy 2020, 22, 674. [Google Scholar] [CrossRef]
- Chen, C.-H.; Oyama, K.; Jhuang, H.-K.; Das, U. Driving Source of Change for Ionosphere before Large Earthquake -Vertical Ground Motion. Remote Sens. 2023, 15, 4556. [Google Scholar] [CrossRef]
- Fraser-Smith, A.C.; Bernardi, A.; McGill, P.R.; Ladd, M.E.; Helliwell, R.A.; Villard, O.G., Jr. Low-frequency magnetic field measurements near the epicenter of the Ms 7.1 Loma Prieta Earthquake. Geophys. Res. Lett. 1990, 17, 1465–1468. [Google Scholar] [CrossRef]
- Molchanov, O.A.; Mazhaeva, O.A.; Goliavin, A.N.; Hayakawa, M. Observations by the intercosmos-24 satellite of ELF-VLF electromagnetic emissions associated with earthquakes. Ann. Geophys. 1993, 11, 431–440. [Google Scholar]
- Molchanov, O.A.; Hayakawa, M.; Rafalsky, V.A. Penetration characteristics of electromagnetic emissions from an under-ground seismic source into the atmosphere, ionosphere and magnetosphere. J. Geophys. Res. 1995, 100, 1691–1712. [Google Scholar] [CrossRef]
- Molchanov, O.A.; Hayakawa, M. Generation of ULF electromagnetic emissions by microfracturing. Geophys. Res. Lett. 1995, 22, 3091–3094. [Google Scholar] [CrossRef]
- Chen, T.; Li, L.; Zhang, X.; Wang, C.; Jin, X.; Wu, H.; Ti, S.; Wang, S.; Song, J.; Li, W.; et al. Possible Locking Shock Time in 2–48 Hours. Appl. Sci. 2023, 13, 813. [Google Scholar] [CrossRef]
- Sun, Y.Y.; Chen, C.H.; Zhang, P.; Li, S.; Xu, H.R.; Yu, T.; Lin, K.; Mao, Z.; Zhang, D.; Lin, C.Y.; et al. Explosive eruption of the Tonga underwater volcano modulates the ionospheric E-region current on 15 January 2022. Geophys. Res. Lett. 2022, 49, e2022GL099621. [Google Scholar] [CrossRef]
- Dautermann, T.; Calais, E.; Lognonné, P.; Mattioli, G.S. Lithosphere—Amosphere—Ionosphere coupling after the 2003 explosive eruption of the Soufriere Hills Volcano, Montserrat. Geophys. J. Int. 2009, 179, 1537–1546. [Google Scholar] [CrossRef]
- Chen, C.-H.; Sun, Y.-Y.; Zhang, X.; Gao, Y.; Yisimayili, A.; Qing, H.; Yeh, T.-K.; Lin, K.; Wang, F.; Yen, H.-Y.; et al. Double resonance in seismo-lithosphere-atmosphere-ionosphere coupling. Ann. Geophys. 2023. accepted. [Google Scholar]
Disclaimer/Publisher’s Note: The statements, opinions and data contained in all publications are solely those of the individual author(s) and contributor(s) and not of MDPI and/or the editor(s). MDPI and/or the editor(s) disclaim responsibility for any injury to people or property resulting from any ideas, methods, instructions or products referred to in the content. |
© 2023 by the authors. Licensee MDPI, Basel, Switzerland. This article is an open access article distributed under the terms and conditions of the Creative Commons Attribution (CC BY) license (https://creativecommons.org/licenses/by/4.0/).