Article

New Insights from Geophysical, Hydrogeological and Borehole Data into the Deep Structure of the Louta Phosphatic Deposit (Gantour Basin, Morocco): Mining Implications

1
Geology and Sustainable Mining Institute (GSMI), Mohammed VI Polytechnic University (UM6P), Hay Moulay Rachid, Benguerir 43150, Morocco
2
Georessources, Geoenvironment and Civil Engineering Laboratory (L3G), Faculty of Sciences and Techniques, Cadi Ayyad University, Marrakech 40000, Morocco
3
OCP Group, Casablanca 20200, Morocco
4
Earth and Environment Editorial Group, Springer Nature, 69121 Heidelberg, Germany
*
Author to whom correspondence should be addressed.
Geosciences 2023, 13(12), 357; https://doi.org/10.3390/geosciences13120357
Submission received: 23 August 2023 / Revised: 25 September 2023 / Accepted: 6 October 2023 / Published: 22 November 2023
(This article belongs to the Section Hydrogeology)

Abstract

:
The Gantour Phosphatic Basin (GPB) is formed by a sedimentary series of Maastrichtian to the Eocene age, which consists of alternating phosphate layers and sterile levels. This series outcrops in the northern part of the basin, where it is exploited in open-pit mines. The exploration methodology employed by the Office Chérifien des Phosphates (OCP) group to investigate the GPB is based on direct recognition with boreholes drilled on a 500 × 500 m grid. This research is concerned with the compilation and analysis of data collected during several drilling campaigns conducted on the central segment of the GPB, namely the Louta deposit. This research also includes acquiring, processing, and interpreting new geophysical and hydrogeological data. Its main objective is to provide a better understanding of the deep structure of the phosphatic series. Therefore, the present study was carried out according to a multidisciplinary approach that comprises three parts. (i) The first one involves geological modeling of the exploration borehole data using Datamine Studio RM software (version 1.4), developed by Datamine Corporate Ltd., (Bristol, United Kingdom). It results in establishing a series of geological cross-sections that display a detailed view of the deep structure of the phosphatic series and its lateral variations. (ii) The second part is related to the hydrogeological study, whose purpose was to elaborate on an accurate and updated piezometric map of the study area. The new map helps understand the groundwater flow in the Louta deposit. Furthermore, the superimposition of the piezometric level with the geological sections throws light on the flooded volume of phosphate in this deposit. (iii) The third part of the study focuses on implementing the Electrical Resistivity Tomography (ERT) method. The interpretation of the recorded geoelectrical data not only highlights the main features controlling the mode and the proportion of the phosphate series deepening under the Plio-Quaternary cover but also confirms the evolution of the overall structure of the studied area. The obtained 2D ERT models generally corroborate the cross-sections produced by geological modeling. They also correlate with the information provided by the hydrogeological study. Such information will help guide future hydrogeological and mining extraction planning in the studied area.

1. Introduction

The Gantour Phosphatic Basin (GPB), located in central Morocco, contains significant phosphate resources. In this basin, the Triassic to Eocene sedimentary series has a tabular structure and lies in discordance on the Hercynian basement of the western Moroccan Meseta (Figure 1a) [1,2,3]. The phosphatic series represents the upper part of the GPB sedimentary deposits. It is formed by alternating sandy phosphatic layers and sterile levels with a dominance of limestone, marl-limestone, clay, and silex nodules of Maastrichtian to the Eocene age [4,5]. The phosphatic layers are outcropping to subcropping in the northern part of the basin, where they are currently being extracted through open-pit mines [6]. Moving southward, these layers deepen beneath a Neogene and Quaternary cover.
The exploration work for phosphate deposits, carried out by the OCP (Office Chérifien des Phosphates) group, consists of a campaign of boreholes crossing the entire phosphatic series and executed on a grid of 500 × 500 m. In contrast, in the southern part of the GPB, these works are limited to a few boreholes spaced several kilometers apart. Exploration work for future phosphate extensions shows that Neogene and Quaternary cover becomes very thick in the southern part of the GPB and is accompanied by the progressive passage of the phosphatic layers under the piezometric level [7].
The present study aims to consolidate the existing database and propose a methodology for exploration based on a geological modeling approach and geophysical prospecting. Furthermore, it seeks to better understand the deep structure of the phosphatic series in a new geological and hydrogeological context of future extensions of the GPB phosphates. Understanding such a structure would help OCP mining engineers predict the necessary arrangements for phosphate extraction in future mines.
The mining subdivision of the GPB includes six deposits, which are, respectively, from west to east: Youssoufia, Recette 6, Louta, Benguérir, N’zalet, and Tassaout. Our study focuses on the Louta deposit, which will be subject to exploitation in the near future. This deposit, covering an area of 60 km2, is located in the central part of the GPB, southwest of Benguerir (Figure 1a).
The study includes three research components: (i) The first concerns the compilation and integration of geological data from exploration borehole campaigns carried out in the studied deposit. The data processing using Datamine Studio RM software allowed the establishment of serial geological sections that outline the evolution of the phosphatic layers under the Neogene and Quaternary cover of the southern part of the GPB. (ii) The second component is dedicated to implementing a piezometric measurement campaign throughout the Louta deposit to determine the hydrostatic level’s current position on the established geological sections and thus estimate the submerged proportion of the phosphatic series. (iii) The third and final component involves the completion of electrical tomography profiles between exploration boreholes and drillings to determine the resistivity signature of the main geological units of the phosphatic series and to check the correlations made using Datamine Studio RM software, particularly in areas where geological information is very sparse.

2. Geological Setting

From the geological point of view, the Gantour Basin is part of the Moroccan Meseta domain (Figure 1a) [2]. In this basin, the post-Paleozoic sedimentary cover ranges from Triassic to Quaternary and particularly includes the Maastrichtian to Eocene phosphatic series [8,9,10,11]. The sedimentary deposits were laid down on the denuded Hercynian chain. They formed a sub-tabular to monoclinal cover, deepening with a low dip from the Hercynian massif of Rehamna in the north to that of Jebilets in the south.
The Triassic-age outcrops in the western part of the Jebilets massif consist of conglomerates topped by sandstone, red pelites, and doleritic basalts. At the scale of the whole GPB, the Triassic has been locally recognized by drilling and is represented by conglomerates followed by alternating layers of clays and red sandstones with some gypsum levels [9,12]. The upper Jurassic outcrops are in the western part of the GPB. It is characterized by a 200 m thick series that begins with sandy limestone and massive gypsum levels with clayey intervals and ends with marls and dolomitic limestone [8,9]. The middle and upper Cretaceous outcrops are in the northern part of the GPB and are mainly made up of marl-limestone.
The phosphatic series In the GPB corresponds to a transgressive sequence deposited from the upper Cretaceous to the lower Eocene (Figure 1b). Phosphatogenesis mainly occurred during the Maastrichtian, the Selandian, the Thanetian, the Ypresian, and to a lesser extent during the Lutetian (Figure 2). This series is presented as an alternation of phosphatic layers and poorly or non-phosphatic levels (interlayers). The Maastrichtian outcrops in the northern part of the Gantour plateau sometimes lie in discordance with older terms, including the Paleozoic. It is formed by an alternation of phosphatic sands, phosphatic marls, siliceous marls, and clays [6,9]. The OCP geominers integrate all the phosphatic layers (C6, C5, C4, C3, C2, and SX) in this geological stage. The Selandian is characterized by its low thickness (6–8 m) and high phosphate content compared to other stages of the phosphatic series. It begins with hard, white, sandy marls with silex nodules. Its phosphatic part comprises two layers (C1 and C0), separated by intercalations of phosphatic limestone beds. The C1 layer is black oolitic phosphate rich in BPL (bone phosphate of lime), whose thickness varies between 1.5 and 1.8 m. Alternating phosphatic limestones form the C0 layer with thin sandy phosphatic coprolithic horizons. The Thanetian, with an average thickness of 12.5 m, comprises phosphatic marls and sands. According to the mining division, this stage corresponds to layer A, often subdivided into SFA1, SFA2, and SFA3 by phosphatic limestone beds. The Ypresian is dominated by siliceous facies and is represented by a complex of a wide variety of facies, including sandstone marls, oolitic phosphates, limestone, sandy phosphates, fossiliferous limestone, phosphatic sands, sandstone marls, and clays. In its terminal part, the Ypresian is represented by a formation of silty and phosphatic sands known as the 11 m layer (C11) by the OCP geominers. This layer is topped by phosphatic levels SB, SC, SD, and SE that intercalate with marls and siliceous marls. The Lutetian marks the end of phosphatic sedimentation. It is characterized by sedimentation dominated by carbonate and is mainly made of a fossiliferous marly limestone formation known as the Thersitae slab (Figure 2) [4].
From a structural point of view, the secondary and tertiary sedimentary cover in the GPB presents a monoclinal structure with a low dip toward the south. It gradually deepens under the Neogene and Quaternary deposits, whose thickness can exceed 150 m in some places. From a hydrogeological point of view, several studies [7,9,12,13] show that the main groundwater aquifers in the GPB correspond to (i) the Paleozoic aquifers recognized in the north and south of the GPB. The groundwater flow is governed by the basement’s fracturing and shows a transmissivity of 10−4 to 10−6 m2/s [12]. (ii) The Turonian aquifer, located in the northeastern part of the GPB in karstified limestones, with a thickness of about 10 m [8]. (iii) The lower phosphatic aquifer is mainly represented by the upper Maastrichtian sandy phosphates and the Thanetian sandy phosphatic marls. This aquifer is delimited by two impermeable levels of regional extension, namely the Maastrichtian and the Ypresian clay horizons (Figure 2) [12]. (iv) The upper phosphatic aquifer includes the lower Ypresian siliceous phosphatic sands and the Lutetian fractured siliceous limestones. This aquifer is the most important in the region. It presents a particular interest in drinking water supply and irrigation throughout the GPB, especially in its southern part, where the phosphatic series deepens under the Neogene and Quaternary deposits [7]. (v) The Plio-Quaternary aquifer is quite heterogeneous, mainly made of a red clay complex with the intercalation of gravel beds. This aquifer shows poor hydrodynamic characteristics (transmissivity and permeability of about 10−5 m2/s and 10−6 m/s, respectively) [12].

3. Material and Methods

3.1. Geological Modeling

The GPB has been the subject of numerous direct exploration works carried out by drillings for several kilometers around the areas in exploitation. The OCP group uses this method during the upstream phases of phosphate basin exploration programs. Its implementation in our study area has made it possible to carry out many boreholes distributed according to a regular square mesh of 500 m. These boreholes, as well as the majority of wells drilled by individuals for the groundwater supply, have been subject to detailed geological surveys by the OCP teams. As a result, today we have an important litho-stratigraphic database covering the entire Louta deposit. This part of our study is devoted to analyzing this database to characterize the structure of the phosphatic series. To do this, we made a series of eleven cross-sections, arranged every two kilometers over the entire study area, using Datamine Studio RM software (Figure 1c). This software is a geological modeling tool that is mainly used in the mining field for the 3D representation of deposits, calculation of reserves, design of mining facilities, etc. However, 3D modeling with Datamine has also been successfully used in other application fields such as hydrogeology, geotechnics, etc. [14,15,16,17,18,19]. The Datamine Studio RM software offers modules for managing multi-parameter databases collected from drilling exploration, as conducted in the Louta deposit.
As part of this study, the geological modeling procedure using the Datamine Studio RM software was applied in a sedimentary environment to establish stratigraphic sections of the phosphatic series. This procedure took place in several stages. The first is devoted to structuring the database in Excel sheets containing information on the boreholes (name, coordinates, depth, orientation, and deviation) and the geoscientific data subject to modeling (lithology, piezometry, etc.). The database is then validated by meticulous verification and correction to avoid eventual errors. The second step concerns the import of the database and topography into the software and the boreholes’ 3D visualization. The third and final step is to create the cross-sections. This step starts with defining sections in a plan view of the geological model. Then, sections are displayed separately to laterally correlate the phosphatic layers, taking into account a coding based on the stratigraphic nomenclature of these layers adopted by OCP mining engineers. Once this operation is complete, the Datamine software offers an overall 3D perspective of all the established sections, with the possibility to complete the geological model with additional data such as piezometry, topography, etc.

3.2. Piezometric Campaign

The GPB is a region with an arid to semi-arid climate, characterized by low and irregular precipitation that does not exceed 200 mm per year on average. Temperatures are low to moderate during the winter and high during the summer, resulting in increased evaporation rates that exceed 1000 mm per year [12]. In recent decades, the succession of several years of drought has aggravated the situation by leading to intense exploitation of groundwater to meet the increasing needs of irrigation and domestic use by the population. The increase in pumping activity, accompanied by insufficient water resources for recharging the aquifer, has resulted in a significant drop in the piezometric level, as evidenced by the drying up of many usual water sources.
Given this situation and considering the objectives of the present study, it was necessary to update the piezometric map of the Louta deposit from 2015. To do this, we conducted a campaign of hydrostatic level measurements, considering all existing water points at the scale of the study area (Figure 1c). For each measurement, the GPS position and depth of the hydrostatic level were collected. The obtained results allowed us to establish a new piezometric map of the study area.

3.3. ERT Survey

The Electrical Resistivity Tomography (ERT) method is a non-destructive tool for near-surface investigation [20,21]. Indeed, this technique is increasingly used for both characterizing subsurface geological structures [22,23,24,25,26,27] and hydrogeological investigations [28,29,30,31,32,33]. The growing interest in the ERT method is due to the development of multi-electrode measurement devices that have facilitated field operations and new automated data acquisition and inversion algorithms.
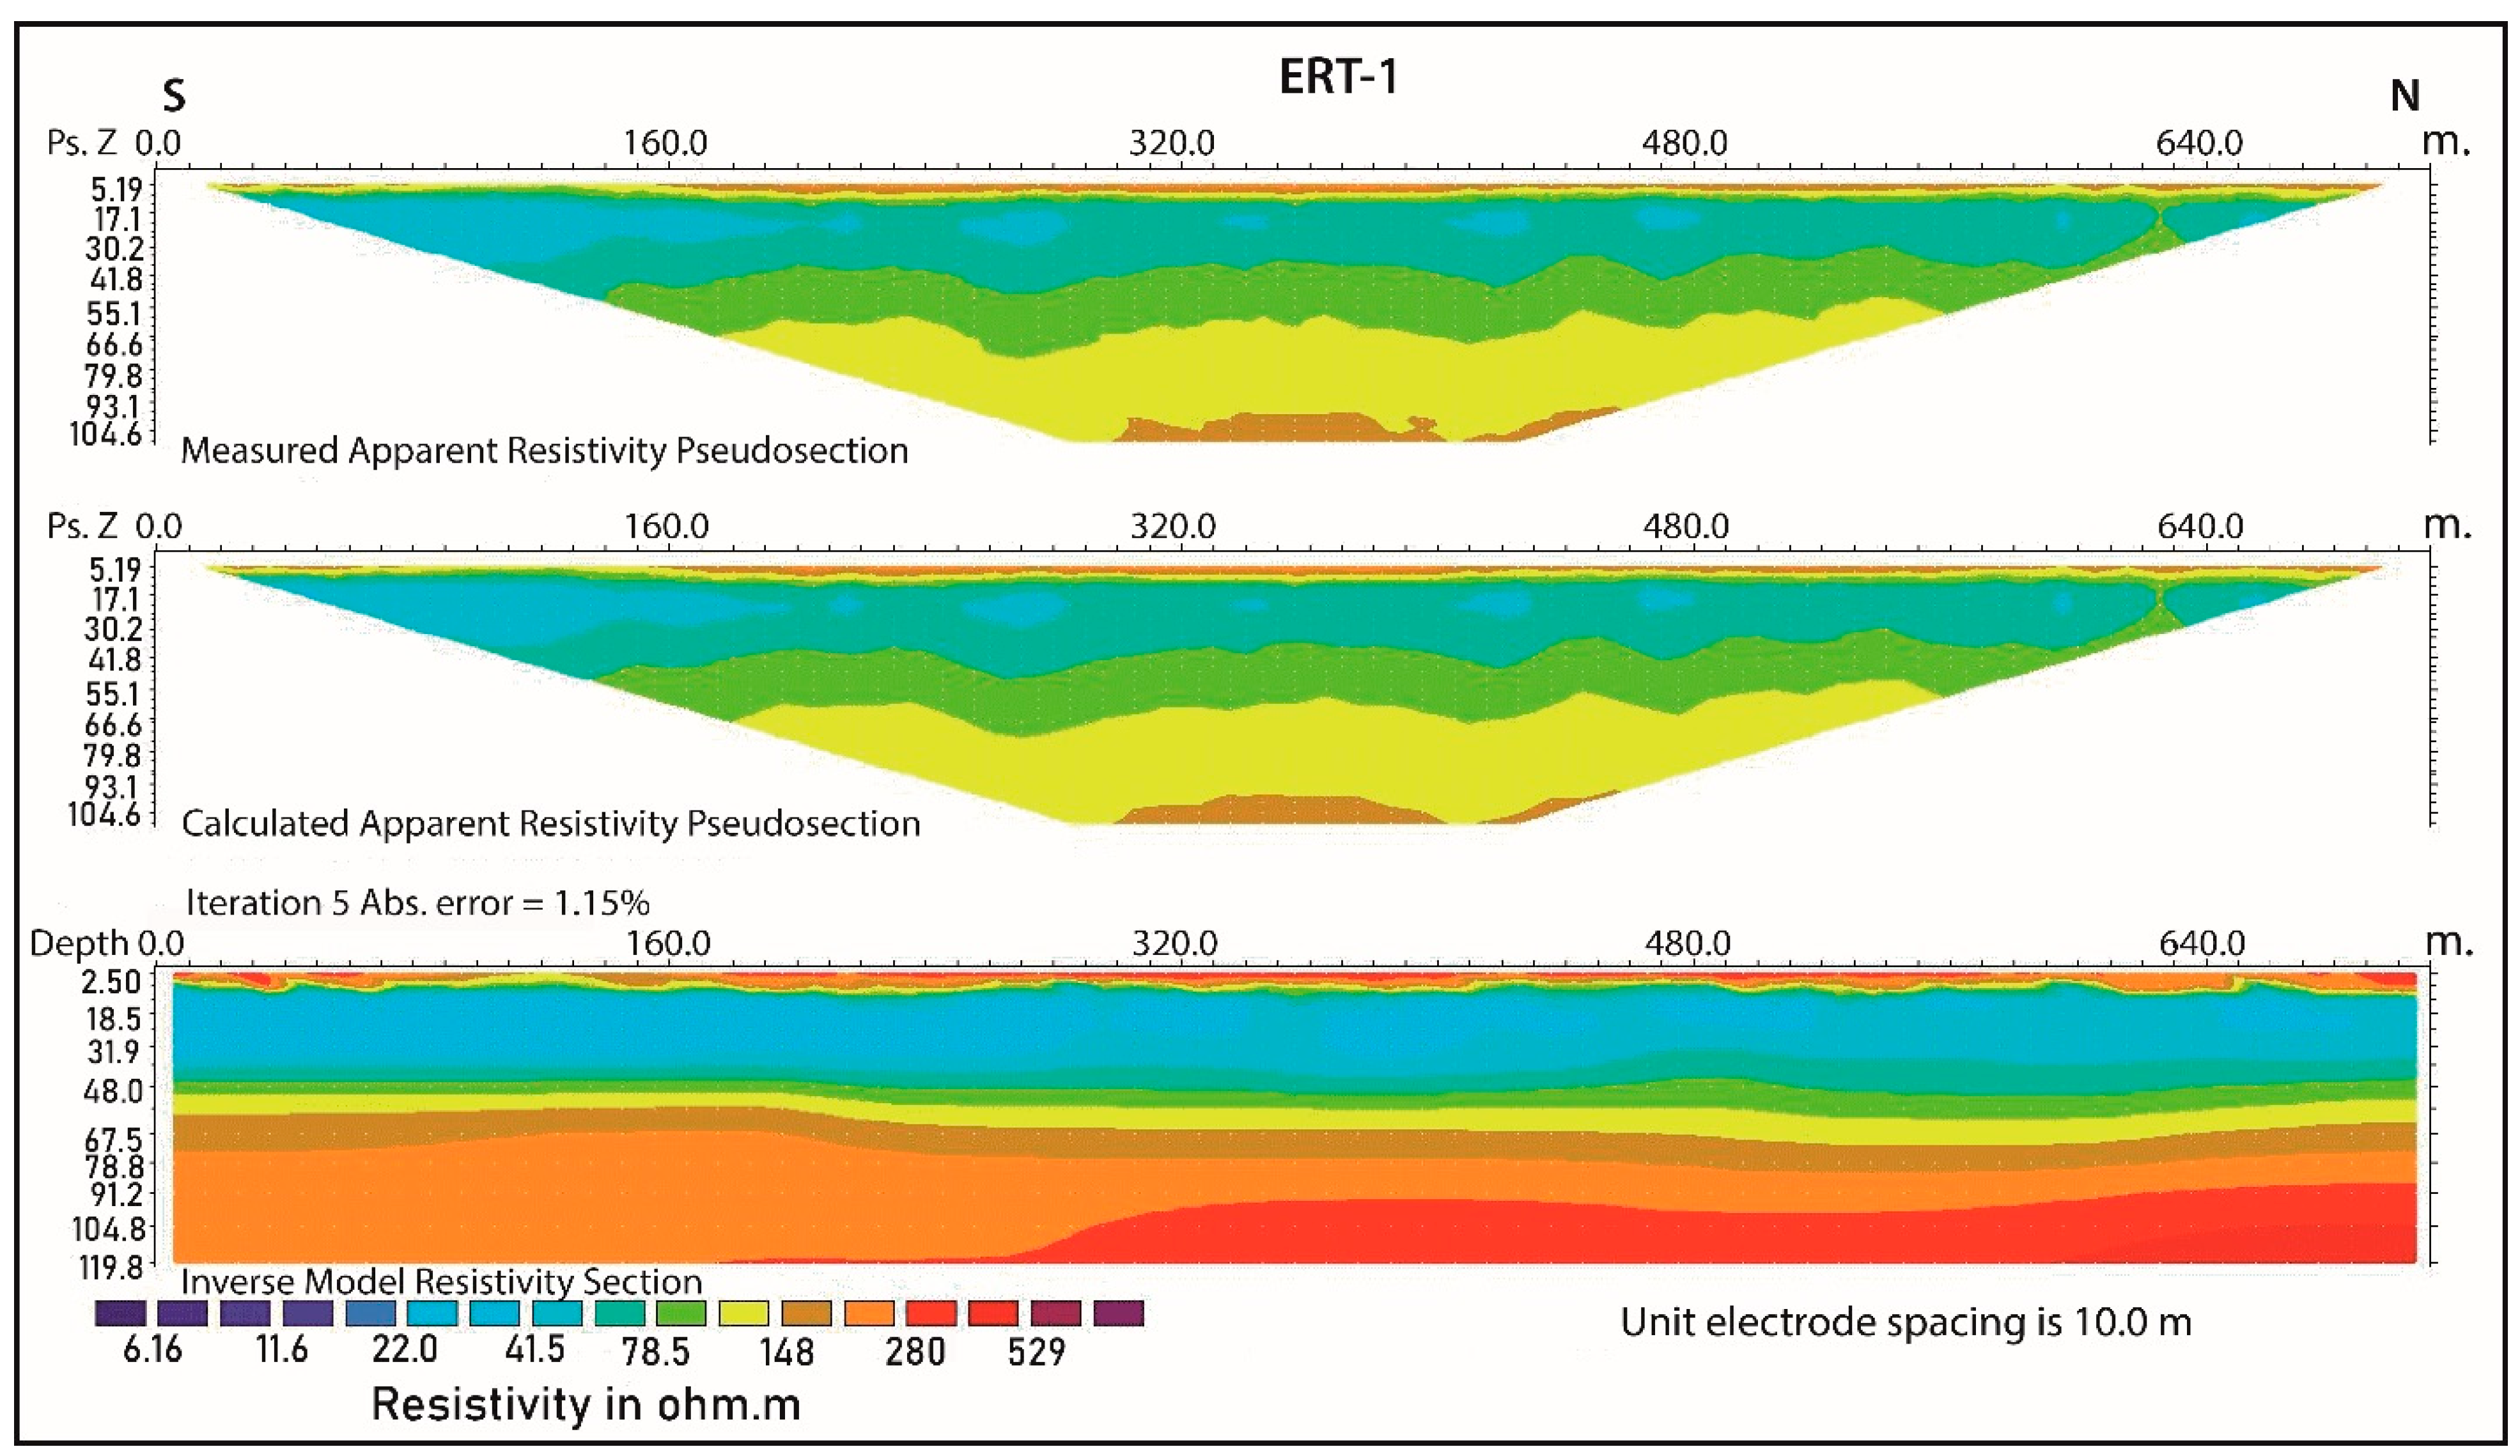
To take advantage of the performance of this subsurface imaging technique, the ERT was implemented during this study. As a result, four profiles labeled ERT-1 to ERT-4 and arranged along the cross-section number 8 were achieved (Figure 1c). The measuring device provides an investigation depth that allows imaging of the entire series and the top of the PB. This device, with a length of 710 m, is composed of a Syscal R1 Plus resistivity meter, manufactured by Iris Instruments, and connected with a multi-conductor cable to a set of 72 electrodes spaced 10 m apart (Figure 3). A sequence of 1318 electrical resistivity measurements was performed for each profile during the implementation of the ERT survey. This sequence was previously prepared considering the Wenner-Schlumberger configuration with a 1s reading time and a minimal stack of 3. In addition, the electrodes’ positions (X, Y) were systematically recorded by GPS, and the profile’s topography was extracted from available Lidar data.
The inversion of acquired data was carried out using the Res2Dinv software (version 4.8.12) developed by Geotomo-Software (Penang, Malaysia) [34]. This inversion process was executed using a maximum of 5 iterations and the smoothness-constrained Gauss–Newton method to calculate the 2D model of the subsurface resistivity [35] (Figure 4).

4. Results and Discussion

4.1. Geological Cross-Sections

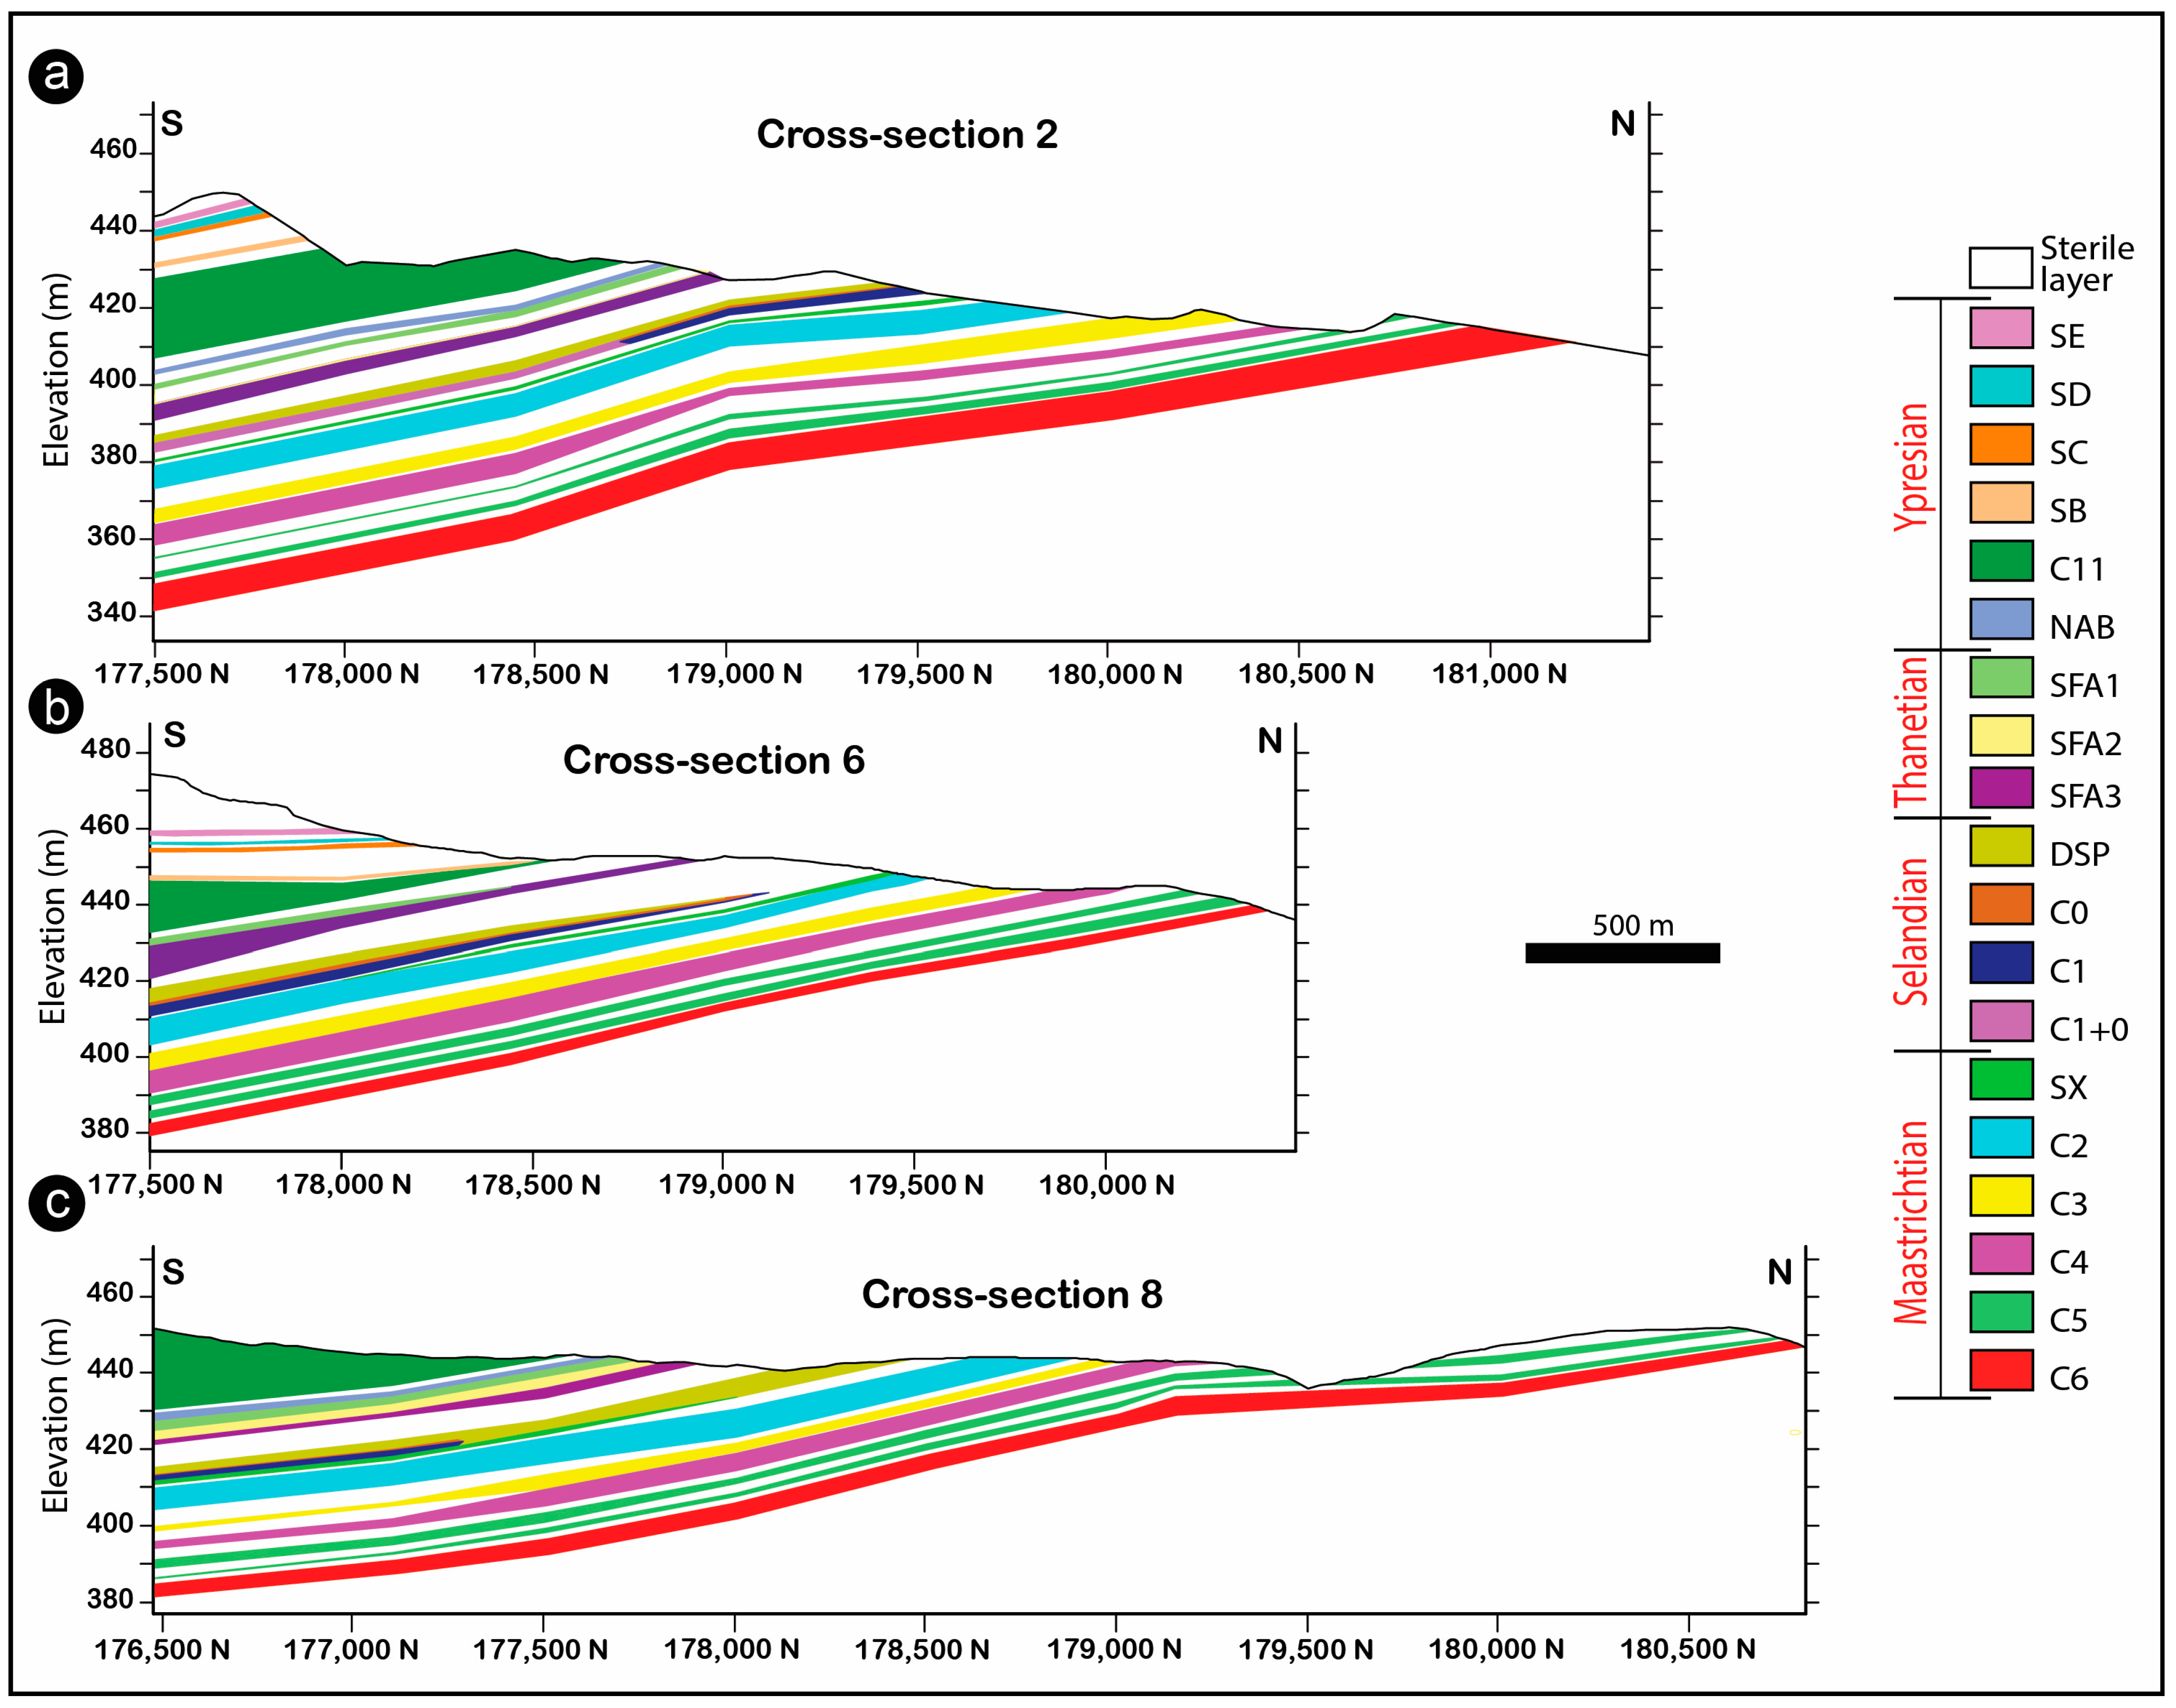
The processing of geological data using Datamine Studio RM software helps create a series of north–south cross-sections through the study area. Linking the equivalent interfaces from one exploration borehole to another allowed the establishment of envelope curves (strings), delimiting each layer or lithostratigraphic unit whose similar attributes were previously defined. The elaborated geological cross-sections show that the phosphatic series in the study area has an overall monoclinal, south-dipping structure with an average value of about 2%. This is clearly illustrated in Figure 5, which displays the sections P2, P6, and P8 that were generated with a vertical exaggeration of 10 (see Figure 1c for location). To examine this structure in more detail, we have analyzed these three sections, where the phosphatic layers are represented by the same colors and the sterile interlayers are drawn in white (Figure 5).
Cross-Section 2 is located west of the Louta phosphatic deposit (Figure 1c). It extends four kilometers and provides an accurate image of a monoclinal south-dipping phosphatic series. The phosphatic layers generally maintain the same thickness along the section, except layer C6, which is thicker in the northern part of the deposit. The layers’ erosion profile and dip direction mean that the oldest layer (C6, lower Maastrichtian) outcrops in the northern part of the deposit, while the youngest layer (Ypresian) outcrops in the southern part. Except for layer C0, dated from the Selandian [4], all other stratigraphic terms of the phosphatic series are represented in the western part of the studied deposit. The overall thickness of the phosphatic series in this area is about 91 m.
Cross-section 6 is located in the center of the Louta deposit (Figure 1c). It extends over three kilometers and shows a relatively similar image to Section 2. We find roughly the same monoclinal structure of the series with the same dip order. The thickness of the lower layers (C6, C5, C4, and C3) remains constant along the section, while the overlying layers (C2 to C11) show a thinning toward the north. The upper layers of the phosphatic series again show a constant thickness and have a low dip. Stratigraphically, cross-section 6 shows that all the phosphatic layers recognized in the Louta deposit are present in the central part, even if the overall thickness of the series is only 74 m.
Similarly, cross-section 8 also reveals the monoclinal structure of the phosphatic series in the Louta deposit (Figure 1c). This section, which extends over more than four kilometers, is located in an area where the topography is almost flat and where the upper terms of the series are absent due to erosion. The thickness of the phosphatic series in this area is only 47 m.
These results show a thinning of the phosphatic series from the west (cross-section 2) to the east (cross-section 8). This evolution is consistent with that known throughout the GPB and reflects the paleogeography of the Gantour Basin during the depositional era of this series [4].

4.2. Piezometry

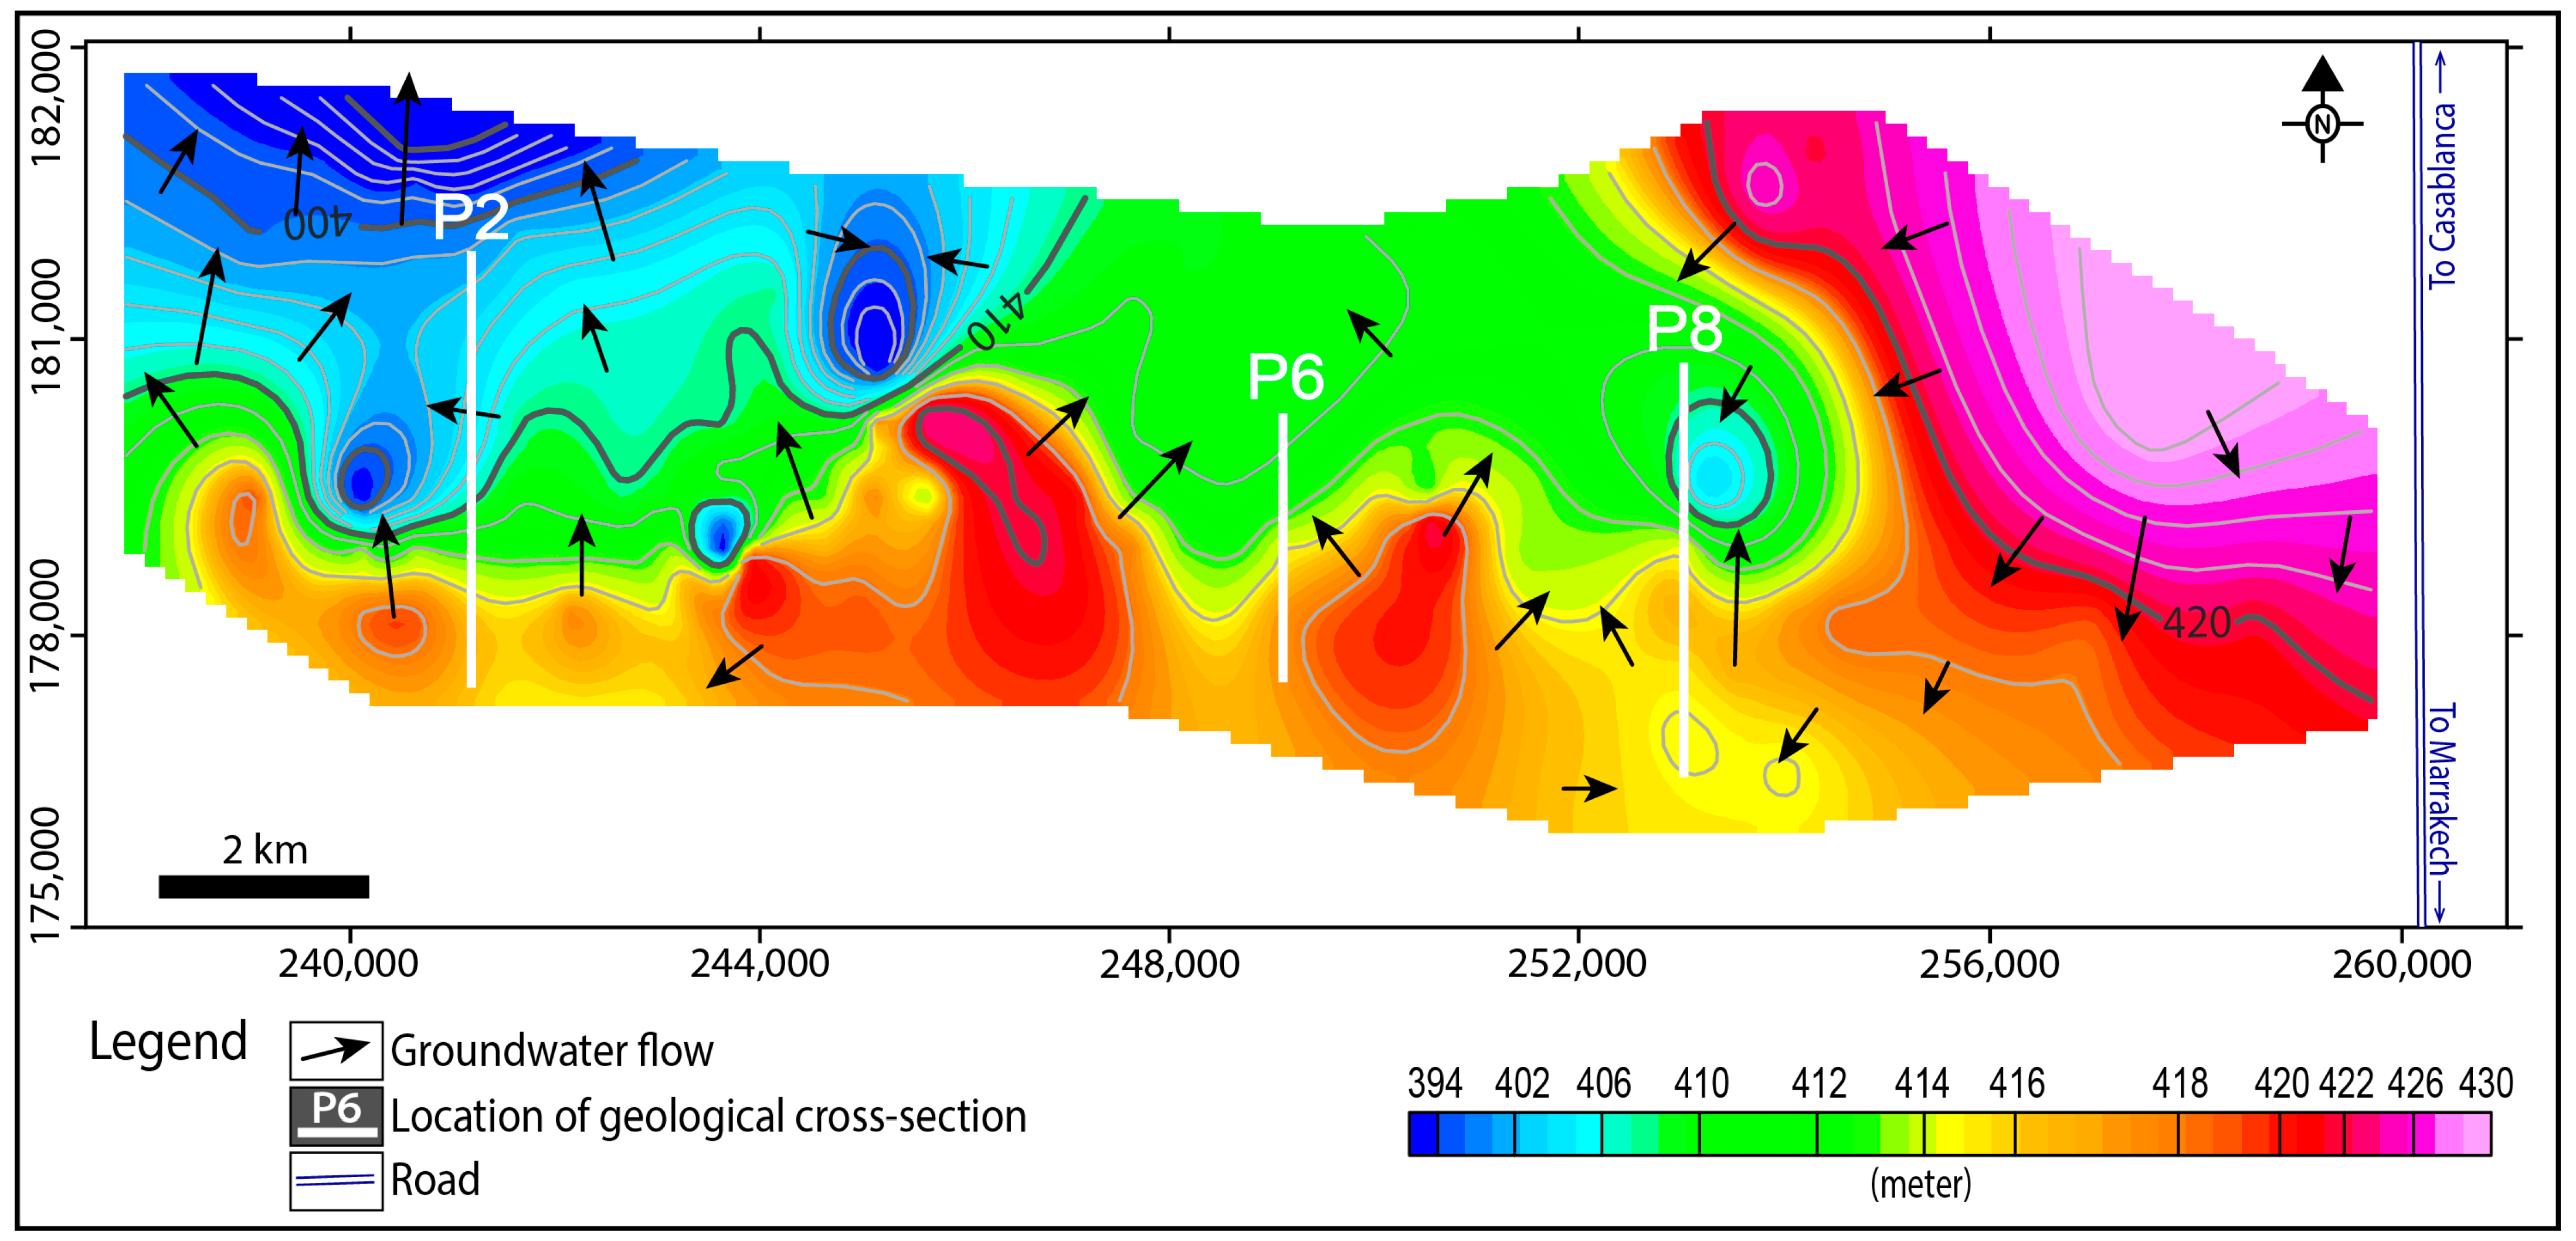
Among the 119 investigated wells, 36 were found to be dry. The water level in the other wells ranges from 379.18 m to 429.43 m mean sea level (MSL). The groundwater is confined in the phosphatic multilayer aquifer, particularly the sandy phosphatic layers of the Maastrichtian, Selandian, and Ypresian. The established piezometric map shows two areas with different groundwater flow directions (Figure 6):
An eastern domain is limited by the meridian 250,000 and the main road connecting Marrakech to Casablanca, where the isopiestic curves are oriented NW-SE with a groundwater flow toward the southwest. The piezometric level varies from 405.4 m (well 212) to 429.43 m (well 374).
A western domain, limited by the meridians 239,000 and 250,000, where the isopiestic curves are oriented east–west with a groundwater flow from south to north. The piezometric level varies from 391.55 m (well 9056) to 421.55 m (well 9016).
The significant drop in the piezometric level recorded in some wells is explained by excessive groundwater pumping for drinking water or irrigation purposes. However, the rest of the wells reveal a regular hydraulic gradient, giving rise to the aforementioned groundwater flow directions. The piezometric map also shows that the northern, southern, eastern, and western boundaries of the studied area are permeable. The flow lines there are almost perpendicular, indicating that these exact flow directions continue to the east in the Benguérir aquifer, to the west in the Recette 6 aquifer, and to the north and south in the northern and southern parts of the GPB.

4.3. Electrical Resistivity Tomography

In the electrical tomography method, resistivity is the main function of the rock type and water content. The processing of raw field measurements allows the elaboration of a subsurface’s geoelectrical model that reflects these characteristics. The geoelectrical models (ERT-1, ERT-2, ERT-3, and ERT-4) resulting from the inversion of ERT data are presented in Figure 7. In the same figure, we also indicate the location of exploration boreholes drilled by the OCP group, which were used to validate the ERT results. Synthetic lithologs were used to constrain the calculated resistivity models and assign the measured resistivities to the lithological units of the phosphatic series. In the same ERT sections, we also indicate the piezometric level (white dotted line) measured during the geophysical survey campaign.
The geoelectrical model of the ERT-1 profile is particularly marked by the presence of a highly resistive surface layer (Er1, >350 Ohm.m), which shows significant thickness variations (Figure 7a). This layer has been attributed to the limestone crusts visible on the ground. Below is a considerable decrease in resistivity (<60 Ohm.m) on an average thickness of 42 m. We attribute this roughly conductive layer (Ec1) to the different units of the phosphatic series. Below, the geoelectrical model shows another resistive layer (Er2) with values exceeding 400 Ohm.m. We attribute this layer to the shale bedrock that constitutes the base of the phosphatic series in the study area and which crops out a few hundred meters north of the profile, as shown in the interpretive section (Figure 7e). The superposition of the piezometric level on the geoelectrical model ERT-1 shows that the conductive signature of the layer Ec1 is primarily explained by its position under the piezometric level. The abundance of marl and clay interlayers within the phosphatic series would also explain this signature.
The geoelectrical model of the ERT-2 profile is broadly similar to that of the ERT-1 profile. It also shows the superposition of three layers, Er1, Ec1, and Er2, described above, with slight differences in resistivity values. The resistive layer Er1 is more or less discontinuous, and the conductive layer Ec1 is slightly thicker, reflecting an increase in the thickness of the phosphatic layers. The shale bedrock (Er2) has become relatively deep, which confirms the overall deepening of the phosphatic series described above (see Section 4.1). At the bottom of the ERT-2 profile, the Paleozoic basement (PB) is separated from the phosphatic series by a conductive formation attributed to the non-phosphatic Maastrichtian (NPM) [4].
The geoelectrical model of the ERT-3 profile highlights the three layers: Er1, Ec1, and Er2. The resistivity values are generally lower than those observed in the ERT-1 and ERT-2 profiles. The Er1 layer attributed to surface limestone crusts has a discontinuous aspect. The conductor Ec1 is even thicker than in the previous two profiles. Within this layer, we can also note variations in resistivity related to local facies heterogeneities, as described in the established geological sections. The Er2 layer, corresponding to the PB, becomes deeper as the thickness of the non-phosphatic Maastrichtian (NPM) formation increases.
The geoelectrical model of the ERT-4 profile shows the same geoelectrical units (Er1, Ec1, and Er2). The Ec1 conductor also shows variations in resistivity related to local facies heterogeneities. The Er2 layer is less deep in the extreme south of the profile. This could correspond to a PB raise while approaching its outcropping at Douar Rhirat, located a few kilometers south of the ERT-4 profile. This evolution is consistent with the descriptions mentioned in several works conducted in the GPB [12,36].
In Section 8, we indicate the position of the piezometric level to highlight the submerged part of the phosphatic layers. A good part of these layers in the Louta deposit are located below the piezometric level. About 35% of the phosphate resources will thus be extracted in submerged zones, particularly in the southern part of the deposit. This is very useful to consider in planning the future exploitation of the phosphatic Louta deposit.

5. Conclusions

The research conducted in this study provides a better understanding of the structure of the phosphatic series in the central part of the GPB. The geological modeling of exploration borehole data using Datamine Studio RM software shows that this series, which outcrops in the northern part of the basin and is being extracted as open-pit mines, deepens southward under the Plio-Quaternary cover. The phosphatic series is a monoclinal structure with an average dip toward the southeast of about 2%. The cross-sections established by the geological modeling also show that the thickness of the phosphatic series decreases from the west to the east of the Louta deposit. Some phosphatic layers show local variations in thickness and also in the N-S direction. In the southernmost parts of the cross-sections, the top of the series is at about 450 m, and the base is sometimes at more than 340 m. As a result, the extraction of phosphates, which is currently done in sub-outcropping layers, will, in the medium-long term, face the existence of a thick cover and high exploitation trenches that can exceed 100 m in some places.
The piezometric map, established from the hydrostatic level measurement campaign carried out during this study, provides valuable information about this level and the groundwater flows throughout the central part of the GPB. Furthermore, the superposition of the piezometric level on the established geological cross-sections allows us to have an idea of the flooded volume of phosphate resources in the studied area. This concerns about 35% of these resources in the southern part of the Louta deposit.
The electrical tomography survey carried out along the N-S transect through the study area provides further insight into the Louta deposit. In addition, the subsurface resistivity models offer a complete view of the deposit, including the entire phosphatic series, an underlying unit assigned to the NPM, and PB. The latter outcrops north of the transect and gradually becomes deeper toward the south before undergoing a local horst-like uplift while approaching the Rhirat area. The geoelectrical models thus confirm the established geological cross-sections and are also in harmony with the hydrogeological information collected during this study.
At the end of this study, it is clear that the exploitation of phosphatic layers in the southern part of the central zone of the GPB would take place in a geological and hydrogeological context different from that existing in the current extraction sites: the base of the phosphatic series will be deeply seated at more than 100 m in some places, and a significant volume of phosphates will be flooded. Therefore, it would be essential to generalize the multidisciplinary exploration approach undertaken in this study to the entire southern part of the GPB that hosts future phosphate deposits. This would allow OCP mining engineers to predict the necessary arrangements for extracting phosphates in this new geological and hydrogeological context.

Author Contributions

Conceptualization, A.K., M.J. and A.C.; methodology, M.J., A.K. and A.C.; software, M.J. and A.C.; validation, A.K., M.J. and E.-S.J.; formal analysis, A.K., M.J. and A.C.; investigation, A.C., M.G., M.A., A.B. and O.Y.K.; resources, M.G., M.A., A.B. and O.Y.K.; data curation, M.J., A.K. and A.C.; writing—original draft preparation, A.K., M.J., A.C. and E.-S.J.; writing—review and editing, M.J., A.C. and N.K.; visualization, M.J., A.K. and A.C.; supervision, A.K., M.J. and E.-S.J.; project administration, A.K. and M.J.; funding acquisition, A.K. All authors have read and agreed to the published version of the manuscript.

Funding

This research was funded by the Moroccan Ministry of Higher Education, Scientific Research and Innovation and the OCP Foundation within the framework of the APRD research program.

Data Availability Statement

The authors do not have permission to share data.

Conflicts of Interest

The authors declare no conflict of interest.

References

  1. Choubert, G.; Salvan, H. Evolution du Domaine atlasique marocain depuis les temps paléozoiques. Mém. Serv. Géol. Fr. 1976, 1, 447–527. [Google Scholar]
  2. Michard, A. Elément de Géologie Marocaine. Notes et Mémoires du Service Géologique du Maroc; Éditions du Service Géologique du Maroc: Rabat, Morocco, 1976. [Google Scholar]
  3. Zouhri, S.; Kchikach, A.; Saddiqi, O.; Haïmer FZ, E.; Baidder, L.; Michard, A. The Cretaceous-Tertiary Plateaus. In Continental Evolution: The Geology of Morocco; Michard, A., Saddiqi, O., Chalouan, A., de Lamotte, D.F., Eds.; Springer: Berlin/Heidelberg, Germany, 2008; Volume 116, pp. 331–358. [Google Scholar] [CrossRef]
  4. Boujo, A. Contribution à l’étude géologique du gisement de phosphate Crétacé-Éocène des Ganntour (Maroc Occidental). Université Louis-Pasteur de Strasbourg—Institut de géologie. Sci. Géologiques 1976, 43, 244. [Google Scholar]
  5. El Kiram, N.; Jaffal, M.; Kchikach, A.; El Azzab, D.; El Ghorfi, M.; Khadiri, O.; Jourani, E.-S.; Manar, A.; Nahim, M. Phosphatic series under Plio-Quaternary cover of Tadla Plain, Morocco: Gravity and seismic data. Comptes Rendus Geosci. 2019, 351, 420–429. [Google Scholar] [CrossRef]
  6. Kchikach, A.; Elassel, N.; Gurein, R.; Teixido, T.; Pena, J.A.; Jaffal, M. TDEM and EM31 Methods for Detecting Sterile Bodies in the Phosphatic Bearing of Sidi Chennane (Morocco). In Near Surface Geoscience 2012—18th European Meeting of Environmental and Engineering Geophysics; European Association of Geoscientists & Engineers: Bunnik, The Netherlands, 2012. [Google Scholar] [CrossRef]
  7. Ihbach, F.-Z.; Kchikach, A.; Jaffal, M.; El Azzab, D.; Khadiri Yazami, O.; Jourani, E.-S.; Peña Ruano, J.A.; Olaiz, O.A.; Dávila, L.V. Geophysical Prospecting for Groundwater Resources in Phosphate Deposits (Morocco). Minerals 2020, 10, 842. [Google Scholar] [CrossRef]
  8. Khalil, N. Contribution à l’étude Hydrogéologique de la Plaine de la Bahira (Maroc Central). Ph.D. Thesis, Université Cadi Ayyad Marrakech, Marrakech, Morocco, 1989. [Google Scholar]
  9. Er-Rouane, S. Mise en œuvre D’outils Informatisés Pour la Modélisation du Système Aquifère de la Plaine de la Bahira (Maroc occidental). Ph.D. Thesis, Université Cadi Ayyad, Marrakech, Morocco, 1996. [Google Scholar]
  10. Piqué, A.; Soulaimani, A.; Hoepffner, C.; Bouabdelli, M.; Laville, E.; Amrhar, M.; et Chalouan, A. Géologie du Maroc; GEODE: Marrakech, Morocco, 2007. [Google Scholar]
  11. Michard, A.; Saddiqi, O.; Chalouan, A.; de Lamotte, D.F. Continental Evolution: The Geology of Morocco: Structure, Stratigraphy, and Tectonics of the Africa-Atlantic-Mediterranean Triple Junction; Springer: Berlin/Heidelberg, Germany, 2008; Volume 116. [Google Scholar]
  12. Karroum, M. L’apport de la Géophysique et de la Géochimie Dans l’identification Hydrogéologiques et la Qualité des Eaux de la Plaine de la Bahira (Maroc centrale). Ph.D. Thesis, Université Cadi Ayyad, Marrakech, Morocco, 2015. [Google Scholar]
  13. Bougadra, A. Synthèse Hydrogéologique de la Bahira Occidentale. Ph.D. Thesis, Université Cadi Ayyad, Marrakech, Morocco, 1991. [Google Scholar]
  14. Bajc, A.F.; Newton, M.J. 3D Modelling of Quaternary Deposits in Waterloo Region, Ontario; A Case Study Using Datamine Studio Software. In Three-Dimensional Geological Mapping for Groundwater Applications: Workshop Extended Abstracts; Geological Survey of Canada: Ottawa, ON, Canada, 2006. [Google Scholar] [CrossRef]
  15. Bye, A.R. The strategic and tactical value of a 3D geotechnical model for mining optimization, Anglo Platinum, Sandsloot open pit. J. S. Afr. Inst. Min. Metall. 2006, 106, 97–104. [Google Scholar]
  16. Miladinovič, M.; Čebašek, V.; Gojkovič, N. Computer programs for design and modeling in mining. Undergr. Min. Eng. 2011, 19, 109–124. [Google Scholar]
  17. Sewnun, D.; Joughin, W.; Wanless, M.; Mpunzi, P. The Creation and Application of a Geotechnical Block Model for an Underground Mining Project. In Ground Support 2019: Proceedings of the Ninth International Symposium on Ground Support in Mining and Underground Construction; Hadjigeorgiou, J., Hudyma, M., Eds.; Australian Centre for Geomechanics: Perth, Australia, 2019; pp. 479–492. [Google Scholar] [CrossRef]
  18. Hu, L.; Zhang, M.; Yang, Z.; Fan, Y.; Li, J.; Wang, H.; Lubale, C. Estimating dewatering in an underground mine by using a 3D finite element model. PLoS ONE 2020, 15, e0239682. [Google Scholar] [CrossRef]
  19. Safhi, A.M.; Amar, H.; El Berdai, Y.; El Ghorfi, M.; Taha, Y.; Hakkou Yassine Al-Dahhan, M.; Benzaazoua, M. Characterizations and potential recovery pathways of phosphate mines waste rocks. J. Clean. Prod. 2022, 374, 134034. [Google Scholar] [CrossRef]
  20. Mainoo, P.A.; Manu, E.; Yidana, S.M.; Agyekum, W.A.; Stigter, T.; Duah, A.A.; Preko, K. Application of 2D-Electrical resistivity tomography in delineating groundwater potential zones: Case study from the Voltaian super group of Ghana. J. Afr. Earth Sci. 2019, 160, 103618. [Google Scholar] [CrossRef]
  21. Mukhwathi, U.; Fourie, F. The influence of angled survey lines on 2D ERT surveys using the Wenner (α) array with implications for groundwater exploration in Karoo rocks. J. Afr. Earth Sci. 2020, 168, 103875. [Google Scholar] [CrossRef]
  22. Dahlin, T.; Zhou, B. A numerical comparison of 2D resistivity imaging with 10 electrode arrays. Geophys. Prospect. 2004, 52, 379–398. [Google Scholar] [CrossRef]
  23. Cardarelli, E.; Fischanger, F. 2D data modelling by electrical resistivity tomography for complex subsurface geology. Geophys. Prospect. 2006, 54, 121–133. [Google Scholar] [CrossRef]
  24. El Assel, N.; Kchikach, A.; Teixidó, T.; Peña, J.; Jaffal, M.; Guérin, R.; Lutz, P.; Jourani, E.-S.; Amaghzaz, M. A Ground Penetrating Radar and Electrical Resistivity Tomography Prospection for Detecting Sterile Bodies in the Phosphatic Bearing of Sidi Chennane (Morocco). Int. J. Geosci. 2011, 2, 406–413. [Google Scholar] [CrossRef]
  25. Panda, K.P.; Sharma, S.P.; Jha, M.K. Mapping lithological variations in a river basin of West Bengal, India using electrical resistivity survey: Implications for artificial recharge. Environ. Earth Sci. 2018, 77, 626. [Google Scholar] [CrossRef]
  26. Woźniak, T.; Bania, G. Integrated geoelectrical and geological data sets for shallow structure characterization of the southern margin of the Krzeszowice Graben (Southern Poland). Data Brief 2019, 25, 104157. [Google Scholar] [CrossRef] [PubMed]
  27. Porras, D.; Carrasco, J.; Carrasco, P.; González, P.J. Imaging extensional fault systems using deep electrical resistivity tomography: A case study of the Baza fault, Betic Cordillera, Spain. J. Appl. Geophys. 2022, 202, 104673. [Google Scholar] [CrossRef]
  28. Binley, A.; Hubbard, S.S.; Huisman, J.A.; Revil, A.; Robinson, D.A.; Singha, K.; Slater, L.D. The emergence of hydrogeophysics for improved understanding of subsurface processes over multiple scales. Water Resour. Res. 2015, 51, 3837–3866. [Google Scholar] [CrossRef]
  29. Guérin, R. Borehole and surface-based hydrogeophysics. Hydrogeol. J. 2005, 13, 251–254. [Google Scholar] [CrossRef]
  30. Gupta, G.; Patil, J.D.; Maiti, S.; Erram, V.C.; Pawar, N.J.; Mahajan, S.H.; Suryawanshi, R.A. Electrical resistivity imaging for aquifer mapping over Chikotra basin, Kolhapur district, Maharashtra. Environ. Earth Sci. 2015, 73, 8125–8143. [Google Scholar] [CrossRef]
  31. Kumar, D.; Mondal, S.; Warsi, T. Deep insight to the complex aquifer and its characteristics from high resolution electrical resistivity tomography and borehole studies for groundwater exploration and development. J. Earth Syst. Sci. 2020, 129, 68. [Google Scholar] [CrossRef]
  32. Amponsah, T.Y.; Danuor, S.K.; Wemegah, D.D.; Forson, E.D. Groundwater potential characterisation over the Voltaian basin using geophysical, geological, hydrological and topographical datasets. J. Afr. Earth Sci. 2022, 192, 104558. [Google Scholar] [CrossRef]
  33. Rochdane, S.; Elgettafi, M.; El Mandour, A.; Himi, M.; Casas, A.; Daafi, Y.; Karroum, M.; Chouikri, I. Contribution of electrical resistivity tomography in the study of aquifer geometry and groundwater salinization of Eastern Haouz and upstream Tassaout domain, Morocco. Environ. Earth Sci. 2022, 81, 122. [Google Scholar] [CrossRef]
  34. Loke, M.H. RES2DINV Software User’s Manual, Version 3.57; Geotomo Software: Penang, Malaysia, 2007; p. 86. [Google Scholar]
  35. Loke, M.H.; Dahlin, T. A comparison of the Gauss–Newton and quasi-Newton methods in resistivity imaging inversion. J. Appl. Geophys. 2002, 49, 149–162. [Google Scholar] [CrossRef]
  36. Jaffal, M.; Charbaoui, A.; Kchikach, A.; El Ghorfi, M.; Khaldoun, A.; El Mahdi Safhi, A.; Bodinier, J.-L.; Yazami, O.K.; Jourani, E.-S.; Manar, A. Gravity study of the Western Bahira Basin and the Gantour Phosphatic Plateau, central Morocco: Interpretation and hydrogeological implications. J. Afr. Earth Sci. 2022, 193, 104581. [Google Scholar] [CrossRef]
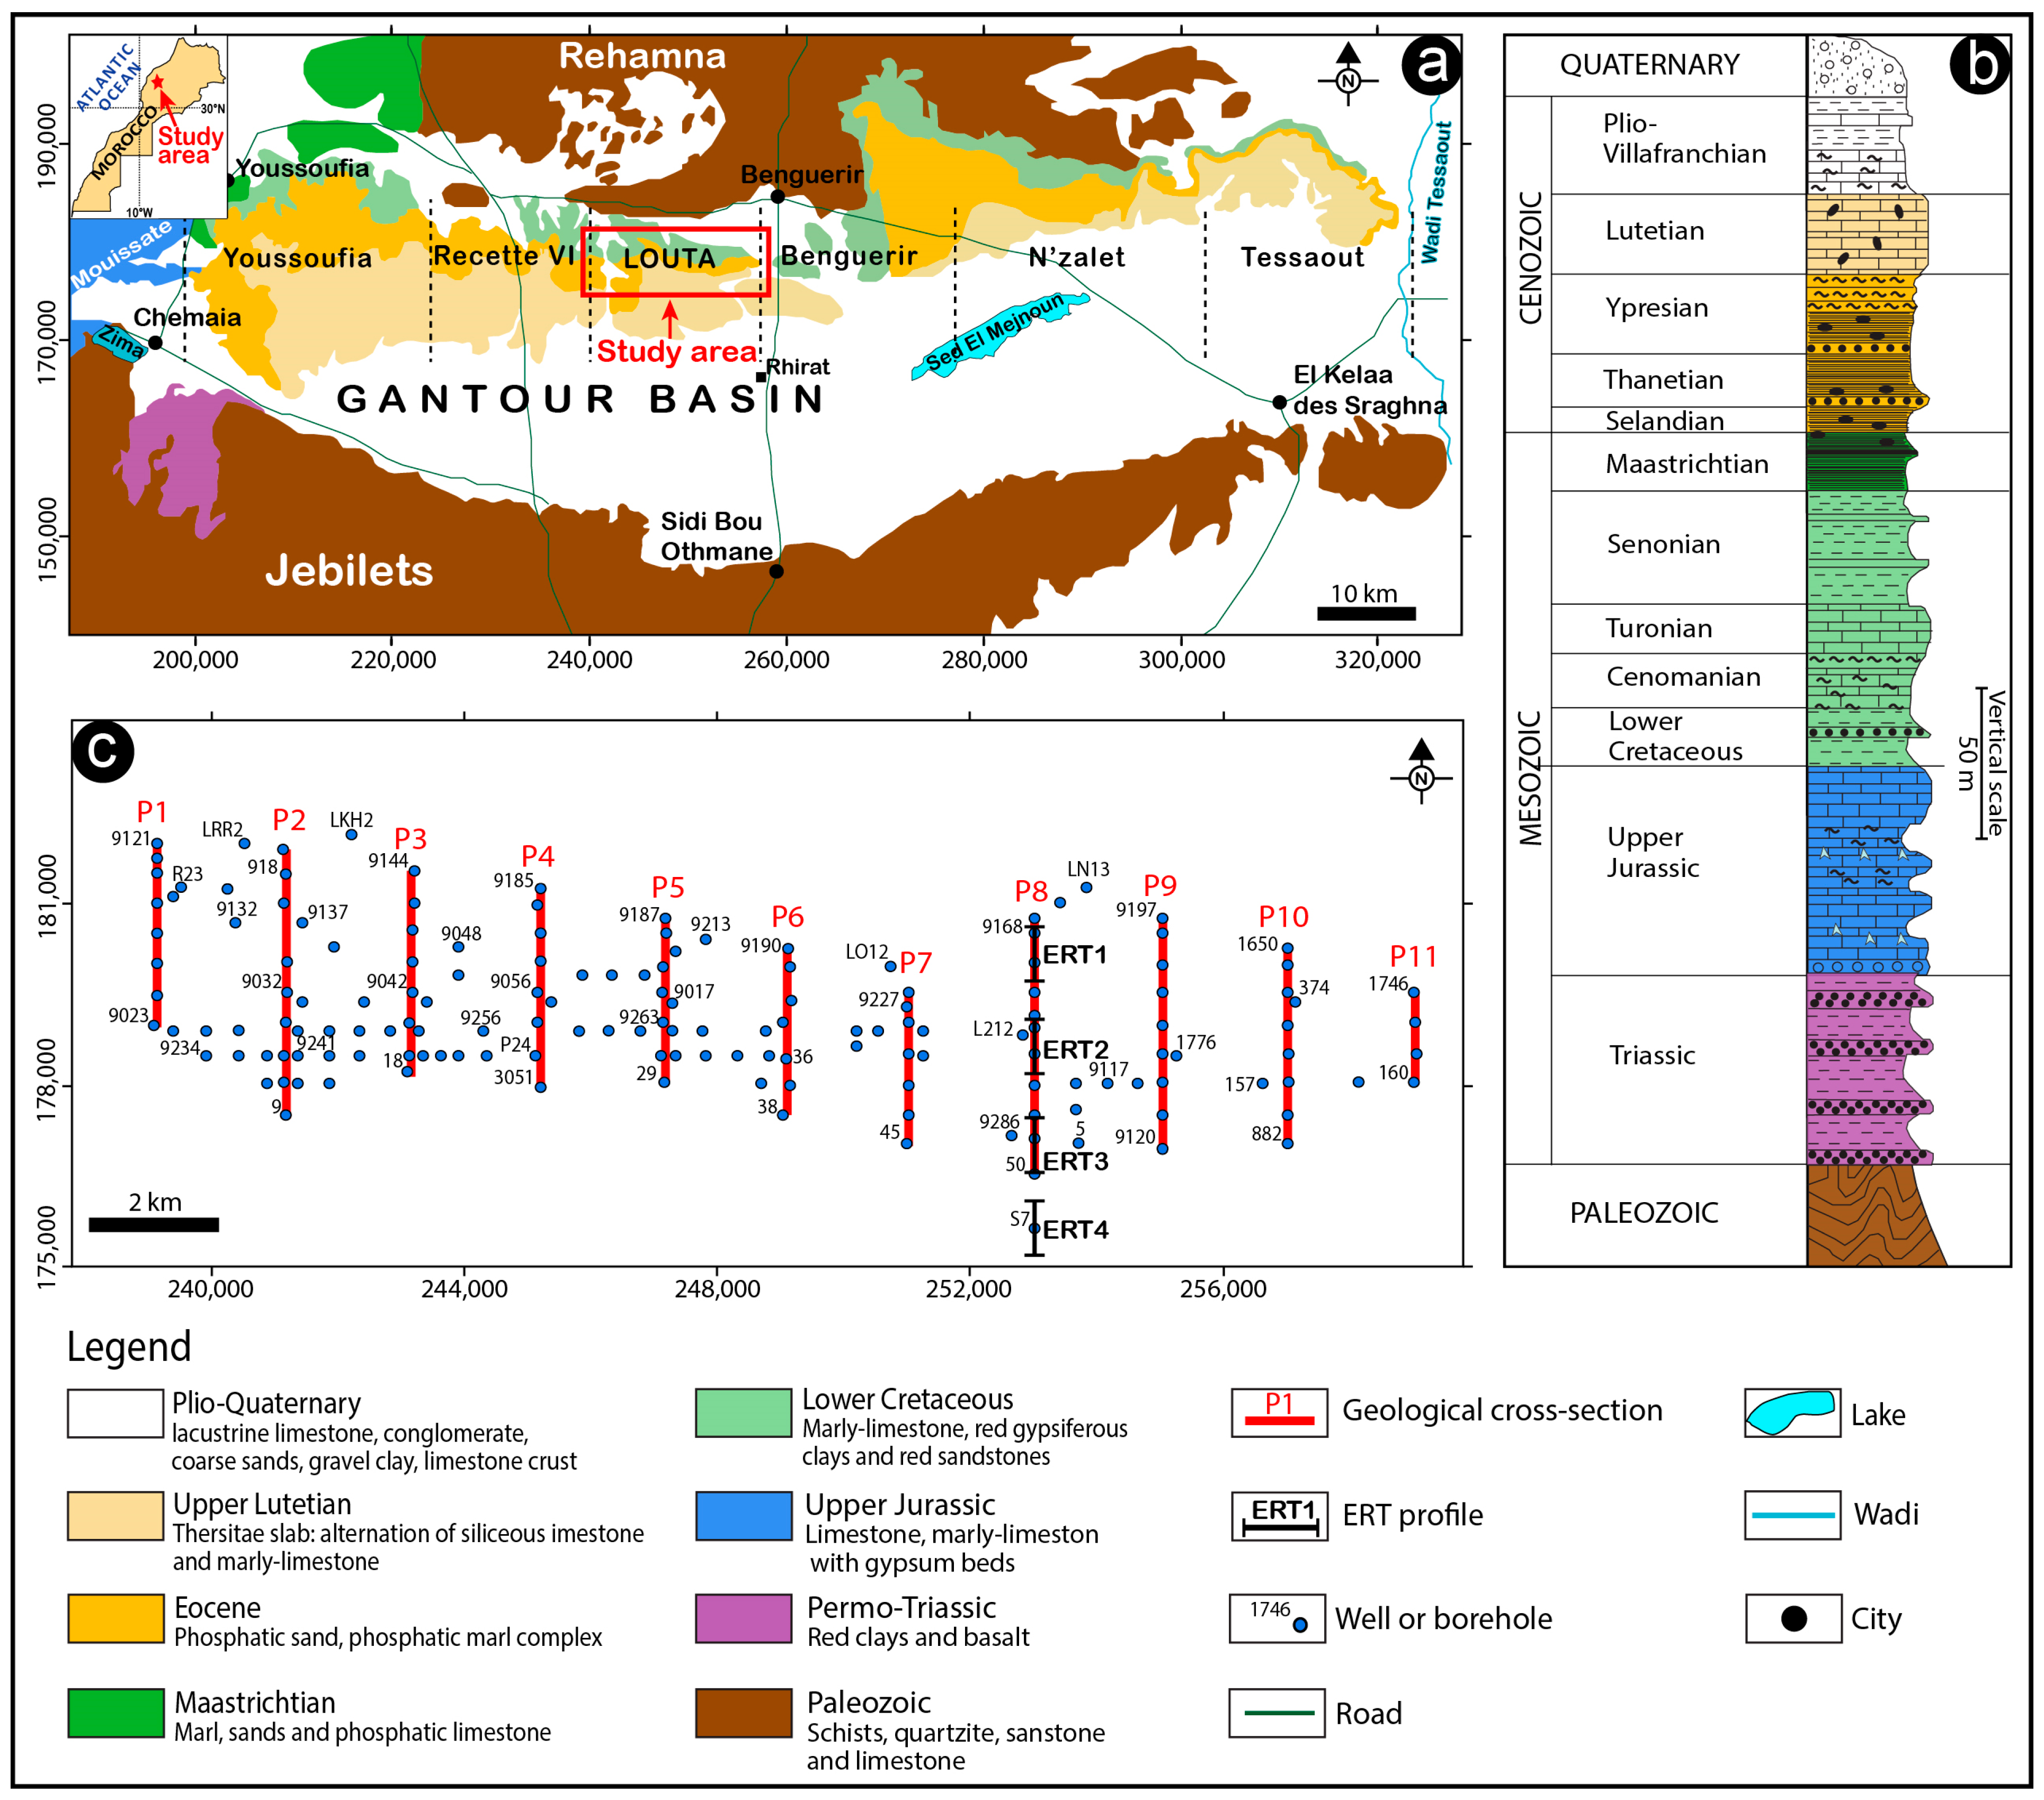
Figure 1. Simplified geological map (a) and synthetic stratigraphic log (b) of the Gantour Phosphate Basin (compiled from [4,6]). (c) Location of the works carried out in the present study.
Geosciences 13 00357 g001
Figure 2. Stratigraphic log of the Gantour basin phosphatic series with the acronyms of the different layers and the corresponding aquifers (compiled from [4,6]).
Geosciences 13 00357 g002
Figure 3. (a) Geophysical equipment used to implement the ERT (Electrical Resistivity Tomography) survey. (b) Deployment of the ERT device on the field in the studied area.
Geosciences 13 00357 g003
Figure 4. An example of results from the electrical tomography survey carried out in this study (ERT-1 Profile).
Geosciences 13 00357 g004
Figure 5. Geological cross-sections created using Datamine Studio RM software through the Louta deposit (see Figure 1c for location) (vertical exaggeration ×10). C6 to SE: phosphatic layers according to the mining nomenclature adopted by OCP geominers. The letters (ac) refer to the cross-sections P2, P6, and P8, respectively.
Geosciences 13 00357 g005
Figure 6. Piezometric map of the Louta deposit in May 2022.
Geosciences 13 00357 g006
Figure 7. (ad) Geological interpretation of the subsurface resistivity models obtained by inverting the ERT data acquired in the present study. (e) Superimposition of ERT inversion models on the outlines of geological Section 8 at the same scale (i.e., with a vertical scale of 10) with interpretation of the base of the phosphatic series from borehole data and of the top of the Paleozoic basement from ERT data. PS: phosphatic series; NPM: non-phosphatic Maastrichtian; PB: Paleozoic basement. (f) An interpretive section integrating the ERT survey results and geological Section 8 (same legend as Figure 5). The white dotted line corresponds to the piezometric level extracted from Figure 5.
Geosciences 13 00357 g007
Disclaimer/Publisher’s Note: The statements, opinions and data contained in all publications are solely those of the individual author(s) and contributor(s) and not of MDPI and/or the editor(s). MDPI and/or the editor(s) disclaim responsibility for any injury to people or property resulting from any ideas, methods, instructions or products referred to in the content.