Article

Temperature Dependence of the Dielectric Constant on the Lunar Surface Based on Mini-RF and Diviner Observations

Department of Systems Innovation, School of Engineering, The University of Tokyo, 7-3-1 Hongo, Bunkyo-ku, Tokyo 113-8656, Japan
*
Author to whom correspondence should be addressed.
Geosciences 2024, 14(4), 101; https://doi.org/10.3390/geosciences14040101
Submission received: 21 January 2024 / Revised: 5 April 2024 / Accepted: 7 April 2024 / Published: 9 April 2024

Abstract

:
Radar observation is an effective way to understand subsurface structures in terms of the dielectric constant, whose controlling factors include chemical composition, packing density, and water/ice content. Recently, laboratory measurements have shown that the dielectric constant of lunar regolith simulants also depends on the temperature, which has never been evaluated from remote sensing data. In this study, we estimated the dielectric constant from the Miniature Radio Frequency (Mini-RF) data on a lunar crater floor in the north polar region at two different local times (i.e., different surface temperatures). We calculated the dielectric constant using the inversion method and obtained the bolometric surface temperature from the Diviner Lunar Radiometer Experiment (Diviner) data. The histograms of the estimated dielectric constant values are different between the two local times. This could be interpreted as a result of the temperature dependence of the dielectric constant, while further evaluation of the influence of topography on the incidence angle and small surface roughness is needed. Nevertheless, our result suggests that the temperature dependence of the dielectric constant should be considered when interpreting S-band radar observations of the Moon and other celestial bodies with large surface temperature differences.

1. Introduction

Radar observation is an effective method for investigating subsurface structures and has been used in several lunar exploration missions (e.g., [1,2,3]). Radar observations utilize electromagnetic waves, which are transmitted to the surface and reflected from the surface and the subsurface due to the difference in the dielectric constant. This study focuses on the dielectric constant obtained from radar observations in the lunar exploration missions.
The dielectric constant depends on several factors, including the packing density and the chemical composition [4]. Therefore, to obtain accurate subsurface information from the dielectric constant, it is necessary to properly evaluate the contribution of the parameters to the dielectric constant. A recent laboratory study has shown that the real part of the dielectric constant of the lunar simulant has the temperature dependence at 210–300 K, indicating that the dielectric constant can vary up to ~18%, which is ~0.2 of the dielectric constant value on the lunar surface [5]. However, such a dependence has never been discussed in the analysis of lunar radar observations.
In this study, we used data obtained by Miniature Radio Frequency (Mini-RF), a synthetic aperture radar onboard the Lunar Reconnaissance Orbiter (LRO), because (1) Mini-RF acquired extensive subsurface observations down to meters, and (2) the analytical methods of Mini-RF have been established to retrieve dielectric constants (e.g., [6,7,8]). To investigate the temperature dependence, we estimated the dielectric constant at the crater floor in the north polar region using the method proposed by Gao et al. [6]. Two Mini-RF datasets observed at different local times were used to estimate the dielectric constant. The surface temperature at each local time of the Mini-RF observations was obtained from the bolometric temperature map derived from the Diviner observations [9]. This allowed us to compare the estimated dielectric constants of the same region at different bolometric surface temperatures.

2. Studied Data and Methods

2.1. Lunar Remote-Sensing Data Used in This Study

2.1.1. Mini-RF Data

Mini-RF is a hybrid polarimetric Synthetic Aperture Radar (SAR) onboard the LRO, operating in two wavebands, S-band (2.38 GHz, wavelength = 12.6 cm) and X-band (7.14 GHz, wavelength = 4.2 cm) with the radar incidence angle about 49°. The resolutions of the radar images are 150 m (baseline mode) and 15 × 30 m (zoom mode), and the imaging swaths are 6 km (S-band) and 4 km (X-band).
Mini-RF transmits left-hand circular polarized electromagnetic waves and receives coherent orthogonal horizontal and vertical linear polarizations [10]. The data provide the characterization of backscattered power, which includes the subsurface information down to meter scales [11]. The main product of Mini-RF is the Stokes parameters calculated from the radar echoes, describing the polarization state of the backscattered power [12]:
[   S 1 S 2 S 3 S 4   ] = [   | E H | 2 + | E V | 2 | E H | 2 | E V | 2 2 R e E H E V 2 I m E H E V   ] ,
where E H and E V are the total power of horizontal and vertical polarization in the received signal, 〈 〉 denotes the average, and denotes the complex conjugate. S 1 is the total power of the received signal, and S 2 is the power difference between the horizontal polarization and the vertical polarization. S 3 represents the preponderance of the polarization oriented at 45° to the horizontal axis and that oriented at 135°. S 4 represents the preponderance of the right-hand circular polarization over the left-hand circular polarization. In this study, the S-band zoom data, the highest resolution data provided by Mini-RF, were used to calculate the dielectric constants, considering that the Mini-RF S-band zoom mode covers a wide area of nearly 98% of both polar regions with latitude above 70° [1].
USGS’s Integrated Software for Imagers and Spectrometers (ISIS) (version 22.9.0) was used to process the Mini-RF data. Level 1 data were first imported into ISIS using the program mrf2isis, and the necessary spacecraft and camera geometry information were attached to the data using the program spiceinit. The Stokes parameters were calculated using Equation (1) and were projected on a map using the program cam2map. The resolution was set to 15 m/pixel from 7.5 m/pixel, which is the original resolution of the Level 1 raw data, using the program reduce. The Stokes parameters derived from the data were processed with a 3 × 3 mean filter to reduce the effect of the speckle noise in SAR images.

2.1.2. Diviner Brightness Temperature Data

The Diviner Lunar Radiometer Experiment onboard the LRO performed radiance measurements using seven spectral channels (Channels 3–9) with wavelengths ranging from 7.55 to 400 μm [13]. The radiance measured in these seven channels was integrated into the bolometric brightness temperature, which represents the temperature of an equivalent blackbody and can be interpreted as a measure of the temperature of the lunar surface [14].
Nearly a decade of observations has provided seasonal brightness temperature maps of the polar regions north of 80° N and south of 80° S at every 0.25 h of local time at a resolution of 240 m/pixel [9]. We used these bolometric temperature maps to obtain the surface temperature when the Mini-RF data in this study were acquired.

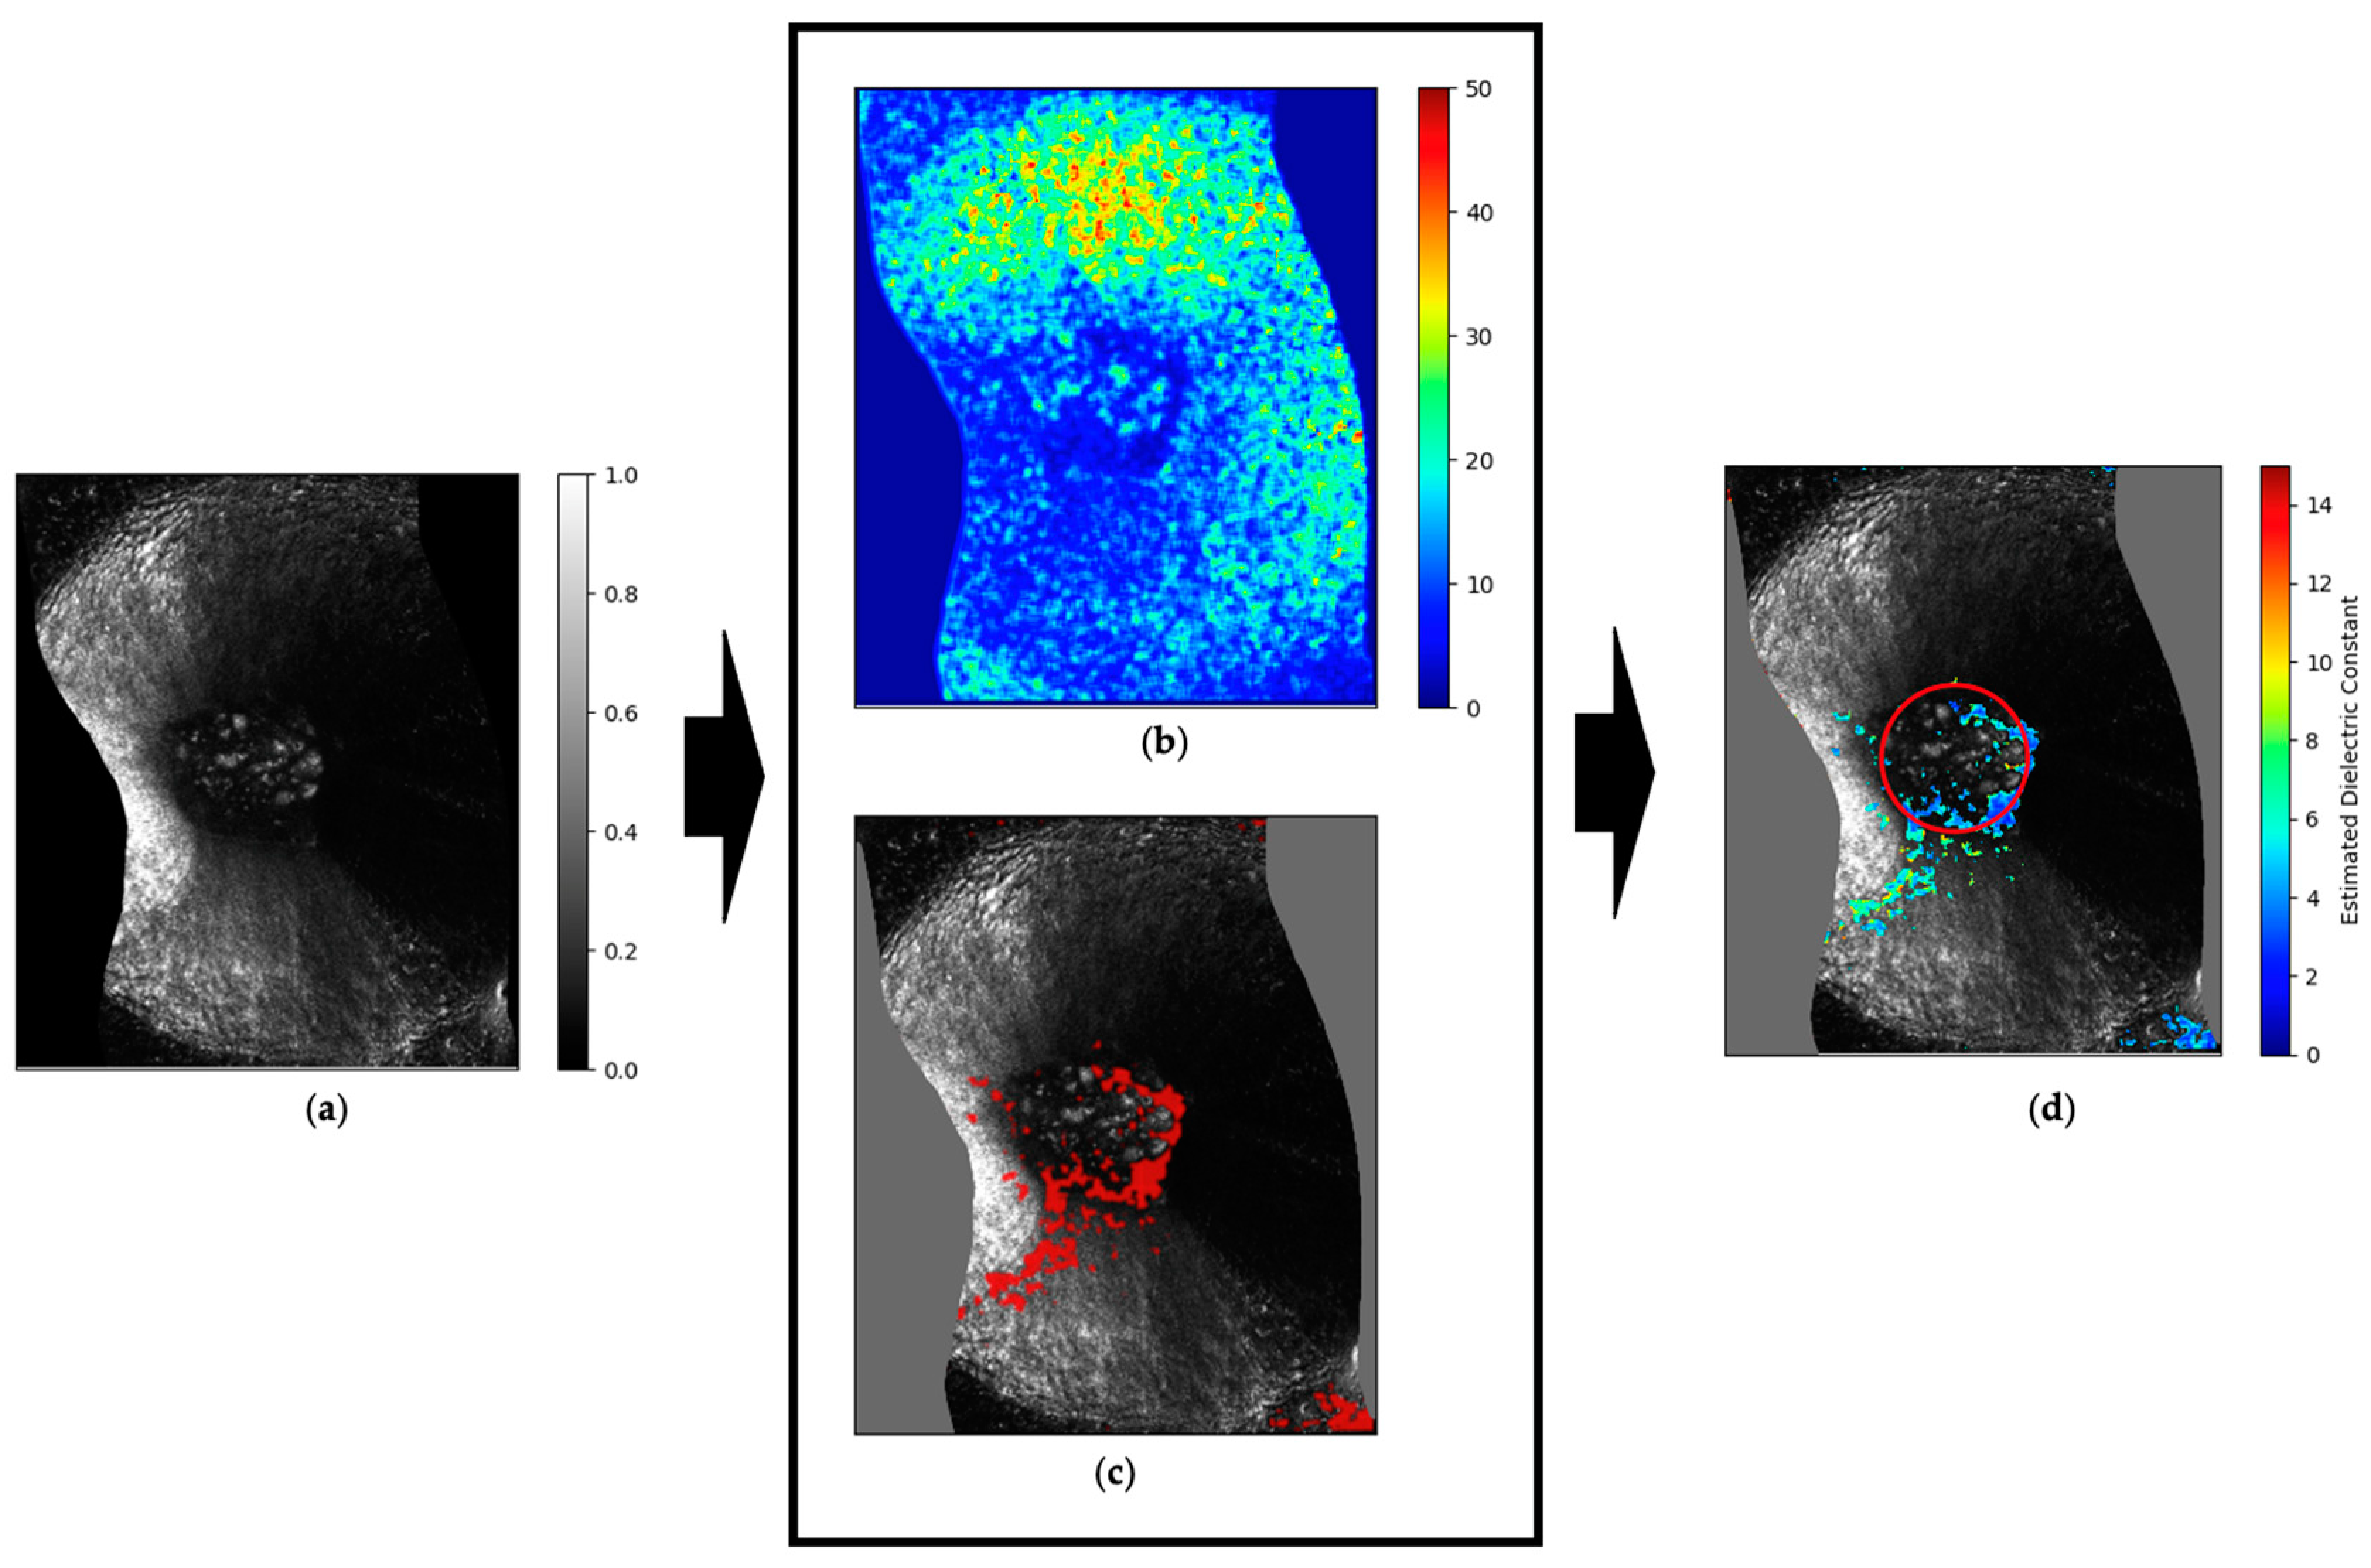
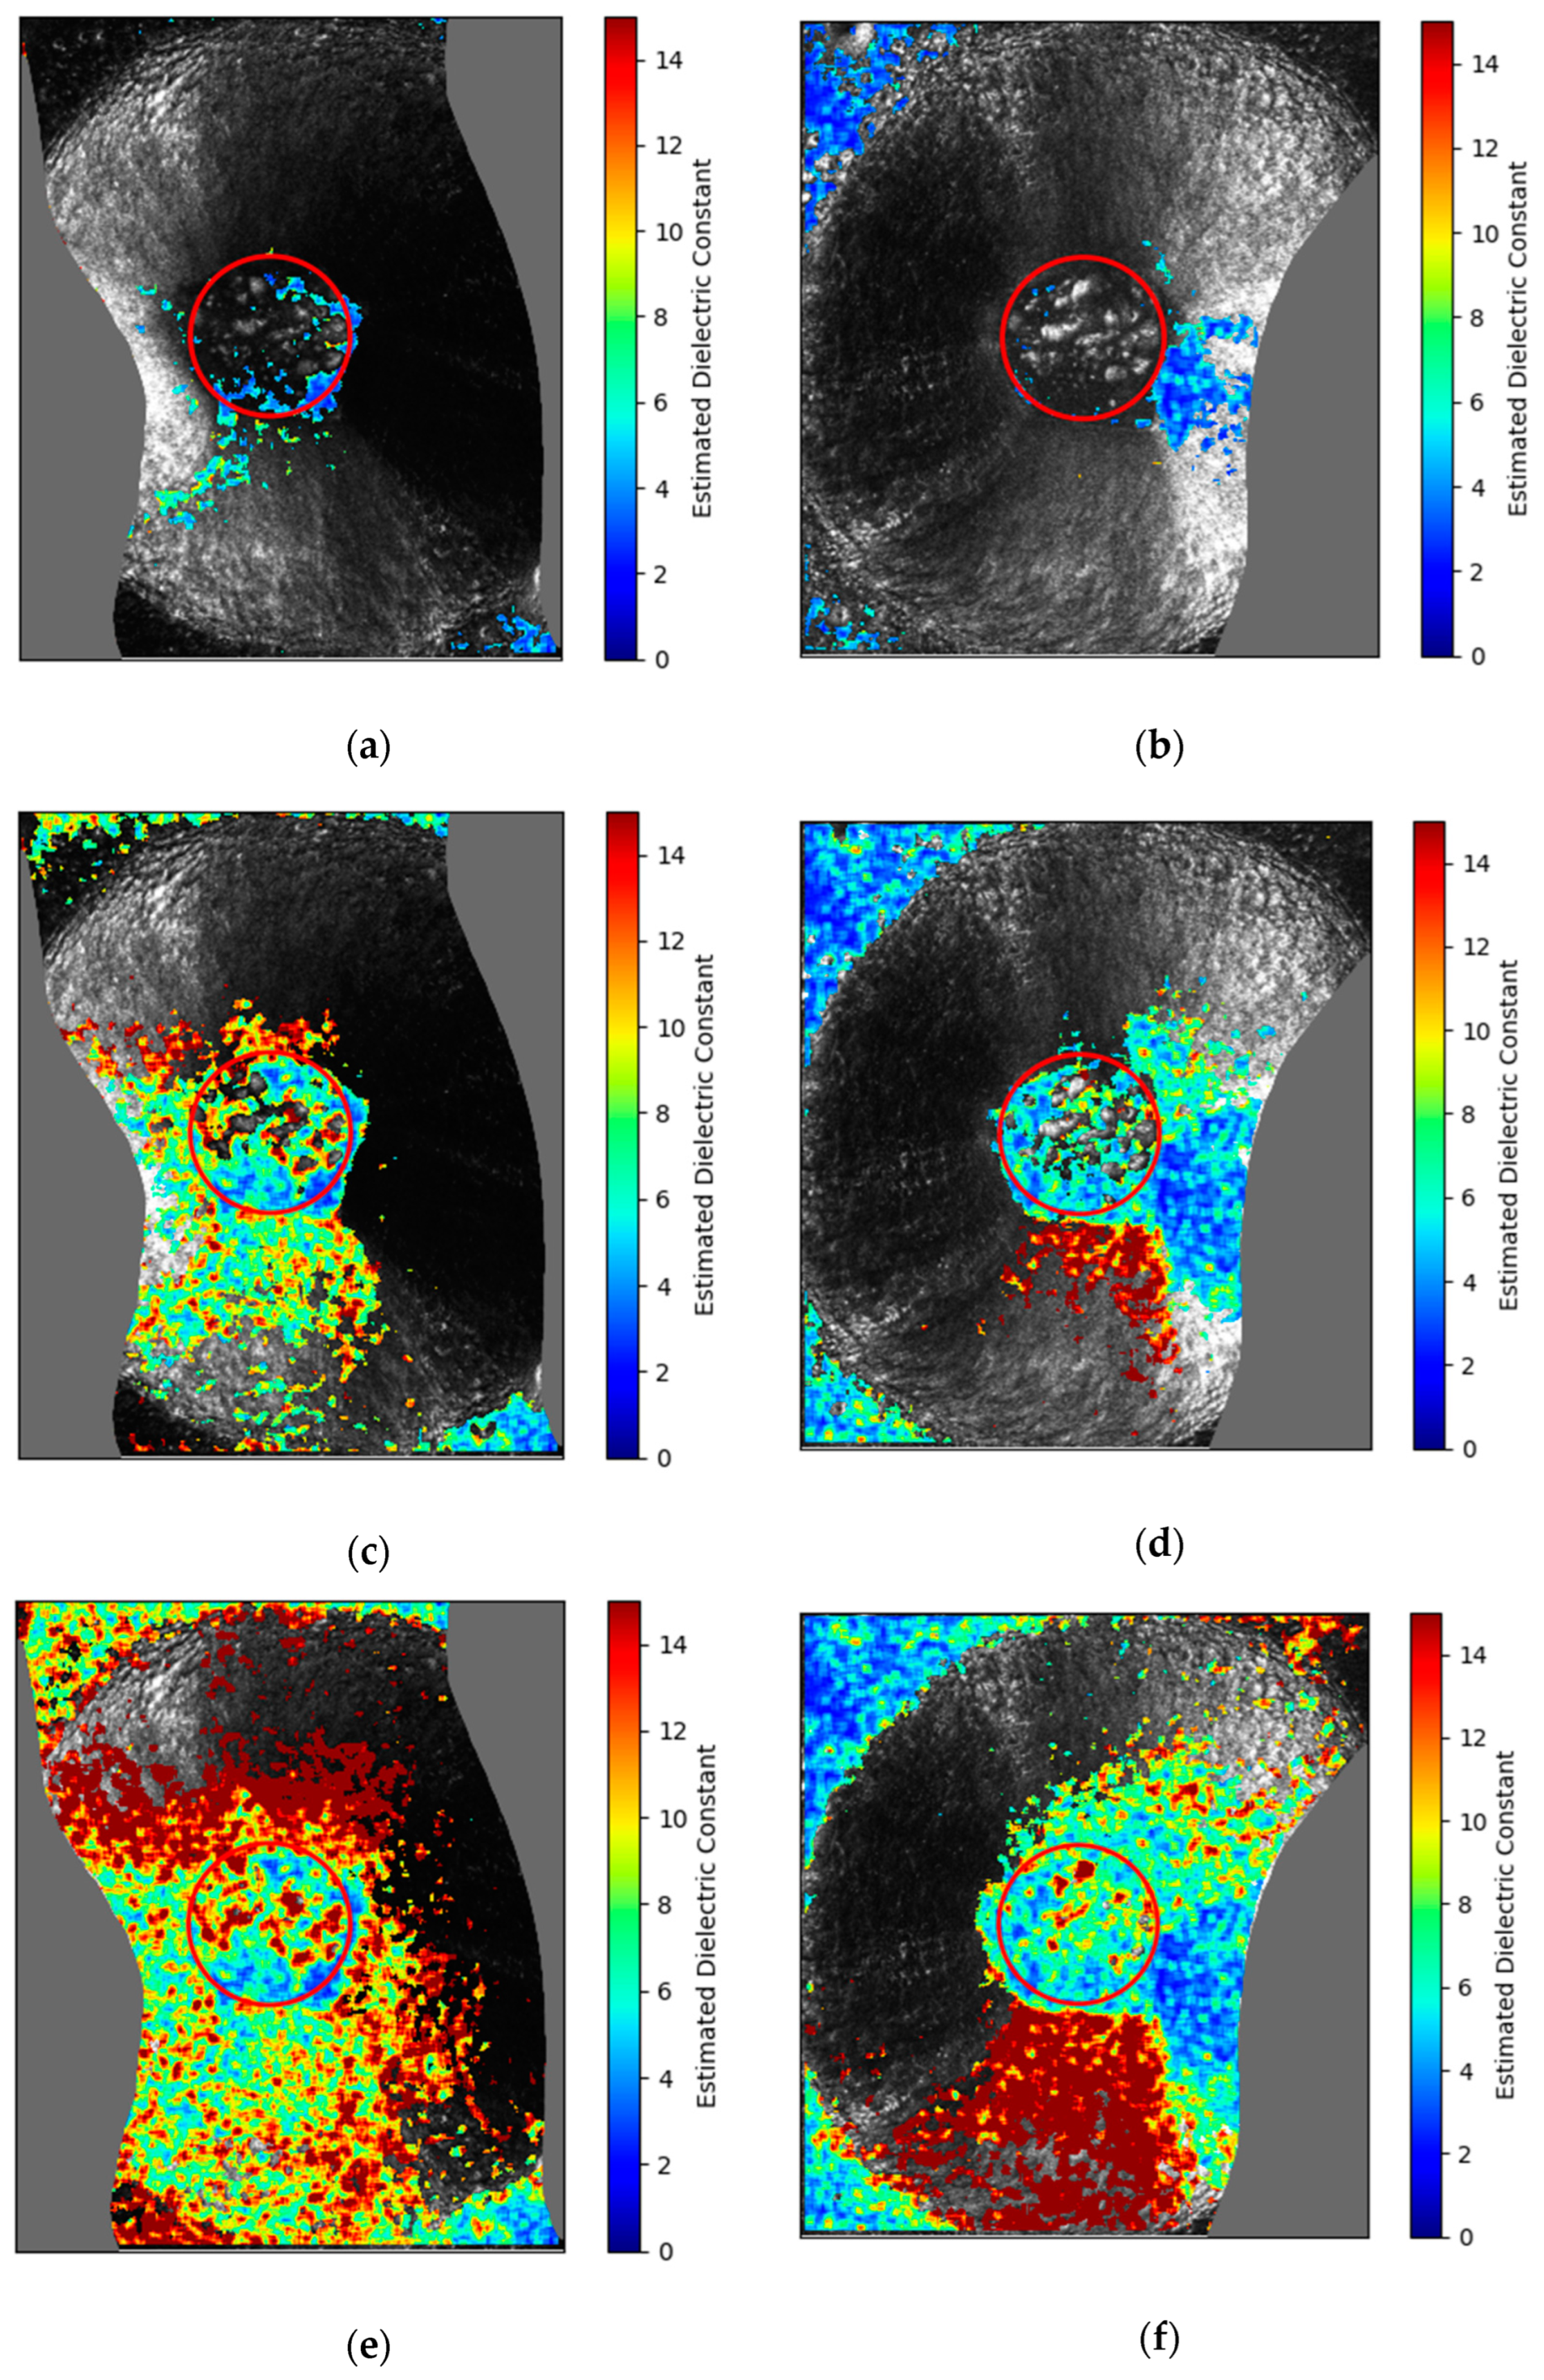
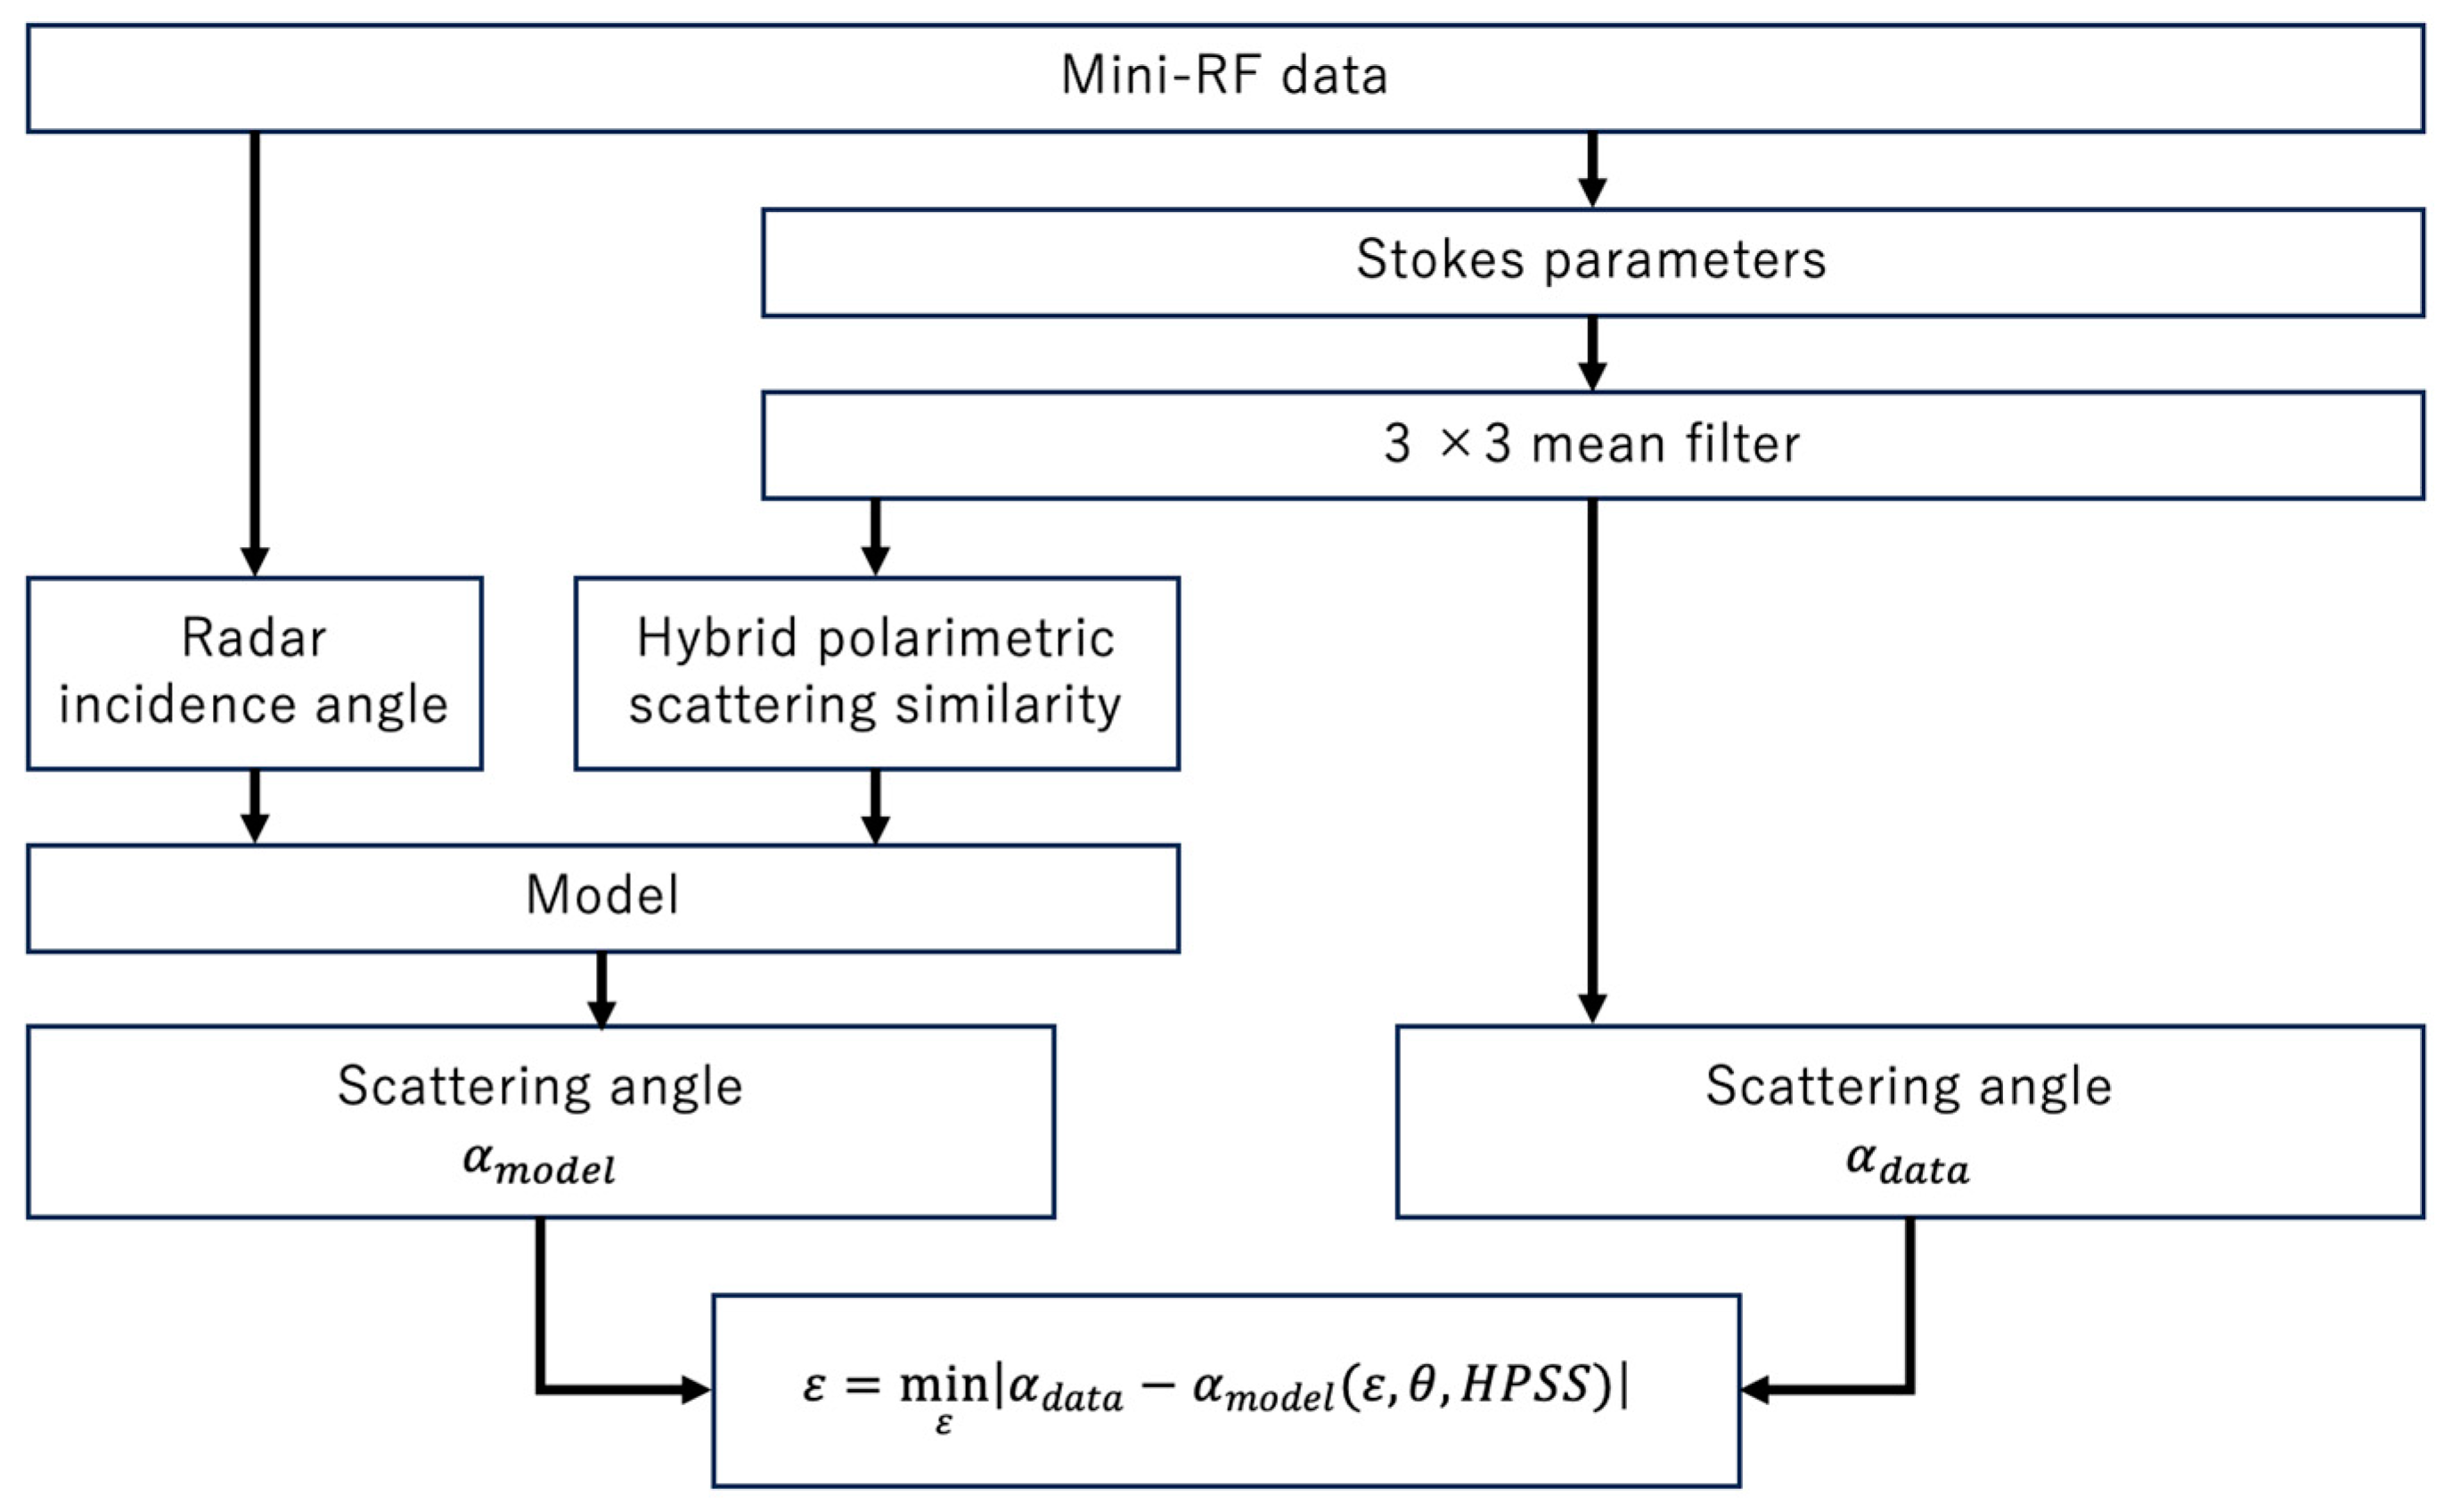
2.2. The Method for Estimating the Dielectric Constant

The mean CPR is ~0.5 for the entire lunar surface, demonstrating the significant influence of even bounce scattering, and the target crater also has a mean CPR of 0.6. Thus, it is challenging to estimate the dielectric constant using simple models such as the X-Bragg model, which is applicable to the regions where single-scattering dominates. In this study, we used the dielectric constant inversion method proposed by Gao et al. [6], which is a modified version of the X-Bragg model, extracting the region dominated by single scattering to estimate the dielectric constant there. We conducted the dielectric constant estimations for crater floors, which we focused on in this study. The X-Bragg model retrieves surface dielectric constants and roughness from quadrature polarimetric (quad-pol) SAR data using the alpha angle ( α ), different from the radar incidence angle θ , to describe the scattering characteristics [15]. The alpha angle is not a geometric angle but a parameter indicating the dominant scattering mechanism, which is calculated from the data and the model. The dielectric constant is determined to minimize the difference between the two α values [15].
The X-Bragg model, however, cannot be directly applied to hybrid polarimetric SAR [16], such as Mini-RF, because the roughness indicator in the X-Bragg model cannot be calculated directly from the hybrid polarimetric SAR data. Thus, Gao et al. [6] introduced the hybrid polarimetric scattering similarity (HPSS) parameter, which describes the similarity between the scattering observed in radar echoes and the standard single scattering. This parameter implies the dominance of the single scattering in radar echoes, which allows the roughness indicator to be estimated from hybrid polarimetric SAR data. We followed this approach to calculate the HPSS parameter to evaluate the coherency of the scattered wave. In the dielectric constant inversion method used in this study, the HPSS above 0.6 is defined as the case where the single scattering is dominant.
The full explanation of this model is detailed in Appendix A. Some of the equations in the method proposed by Gao et al. [6] have been modified. Equation (4) in Gao et al. [6] provides the Stokes parameters represented by the Bragg components and roughness indicators, which is modified in the following Equation (2), considering that the Mini-RF transmitted the left-hand circular polarization:
S 1 = 0.5 ( C 1 + 2 C 3 ) ,   S 2 = C 2 sin c ( 2 β 1 ) ,   S 3 = 0 ,   S 4 = 0.5 ( 2 C 3 C 1 ) ,
where sin c ( x ) = sin ( x ) / x , the coefficients C 1 , C 2 , and C 3 are the Bragg components of the surface, and β 1 is the roughness indicator. Equation (2) is yielded using the following expression of the 3 × 3 coherency matrix T in the X-Bragg model [15]:
T = [ C 1 C 2 sin c ( 2 β 1 ) 0 C 2 sin c ( 2 β 1 ) C 3 ( 1 + sin c ( 4 β 1 ) ) 0 0 0 C 3 ( 1 sin c ( 4 β 1 ) ) ] .
Equation (8) in Gao et al. [6], which is the alpha angle represented by the Bragg components and roughness indicators, has been modified as follows in conjunction with the modification in Equation (2):
α = 1 2 tan 1 ( C 2 sin c ( 2 β 1 ) 0.5 ( 2 C 3 C 1 ) ) .
Equation (10) in Gao et al. [6], which is the 2 × 2 average wave coherency matrix of radar echoes ( J ), has also been modified as follows:
J = 1 2 [ S 1 + S 2 S 3 j S 4 S 3 + j S 4 S 1 S 2 ] ,
where j is the imaginary unit.
Equation (11) in Gao et al. [6], which is the 2 × 2 average wave coherency matrix of the pure single scattering ( J S ), has been modified as follows for the SAR transmitting the left-hand circular polarization [12].
  J S = 1 2 [ 1 j j 1 ]
The flowchart of the entire dielectric constant estimation method is shown in Figure 1.

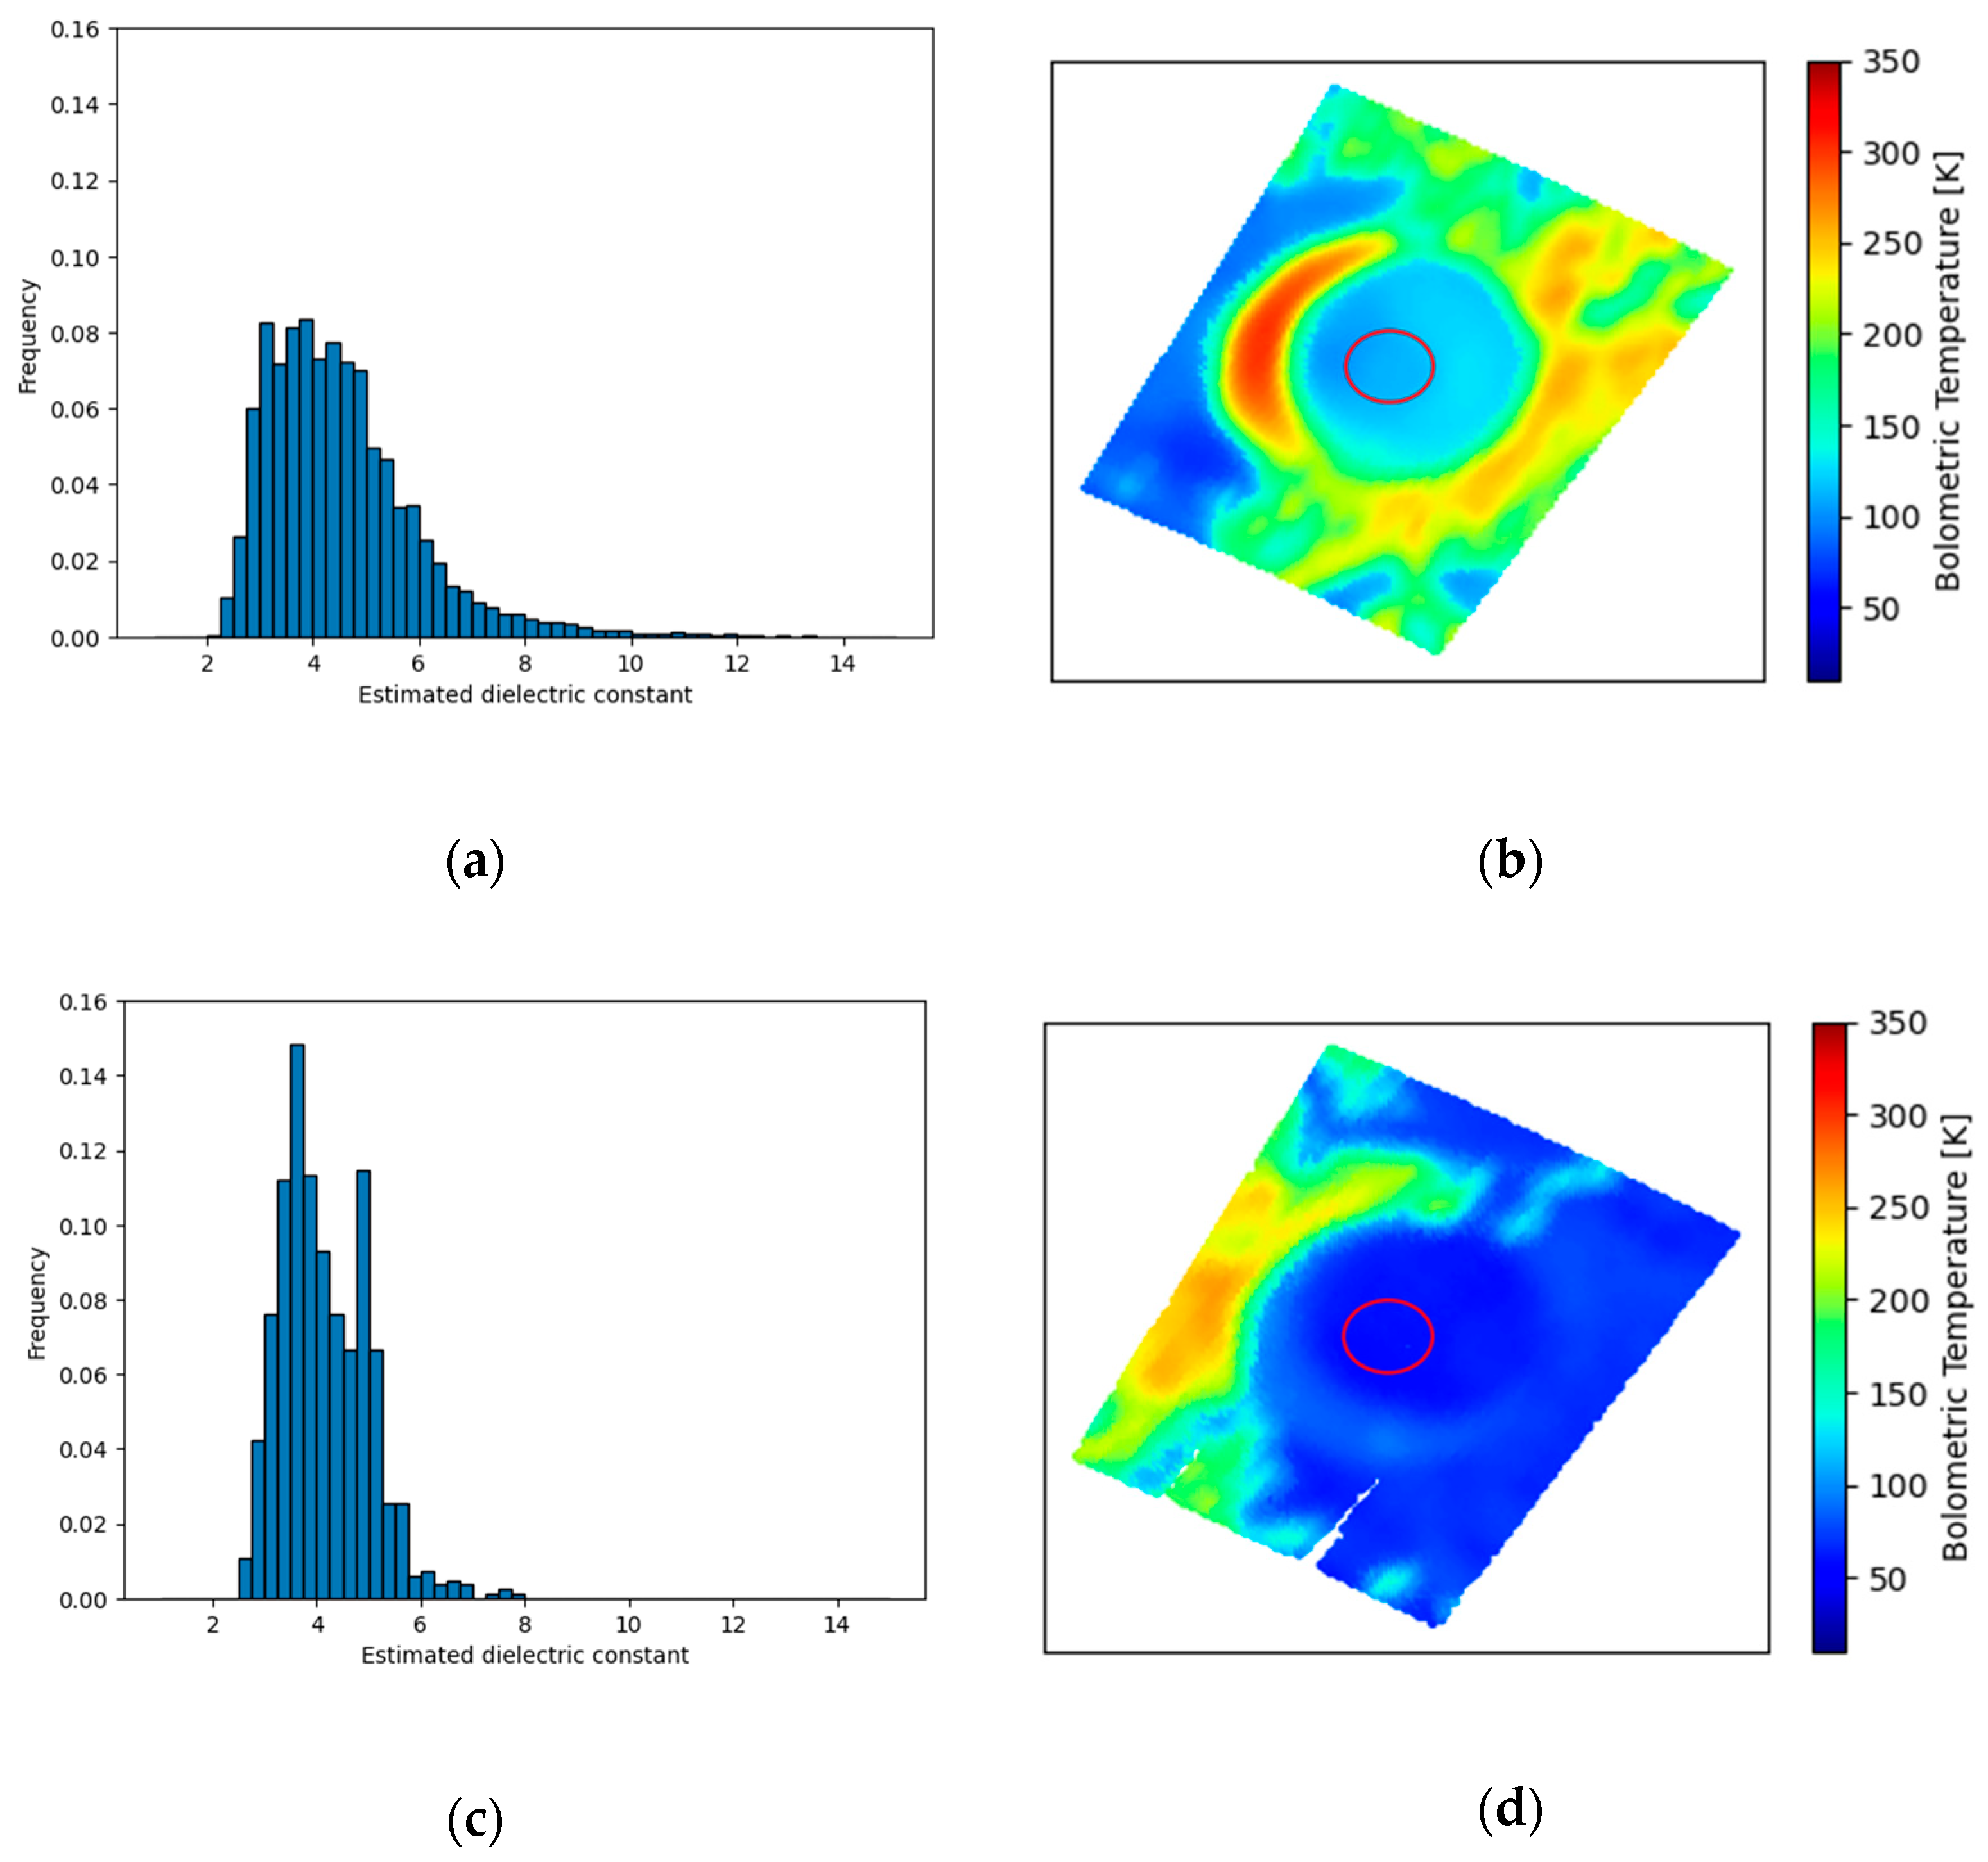
2.3. Analysis of a Crater Floor in the North Polar Region

We applied the above method to estimate the dielectric constants of the crater at 81.0° N, 150.6° E for this study because (1) this is one of the 52 craters, whose dielectric constants were estimated in the previous study [6], (2) a stable temperature condition is expected inside a crater floor even in a high-latitude region, and (3) multiple Mini-RF data are available, allowing for studies at different temperature conditions.
The radar incidence angle θ is given as the angle between the local vertical and the spacecraft direction at the pixel located at the center of each Mini-RF data. As for the target crater, the LOLA (Lunar Orbiter Laser Altimeter)-derived DEM (Digital Elevation Model) indicates that the crater floor is not inclined. We calculated the HPSS, and the pixels with HPSS < 0.7 were masked to select pixels dominated by single scattering. Then, the estimated dielectric constant at each pixel was determined as the average of the 15 × 15-pixel area with the pixel at its center because local effects caused by topography can significantly affect the results if the analysis area of each pixel is too small. The analysis procedure is shown in Figure 2.
The surface temperature of the crater floor was obtained from the bolometric temperature map corresponding to the season and the local time, when the Mini-RF data were acquired. The season was determined by the subsolar latitude during the Mini-RF observation. The bolometric temperature of the area within 2.5 km from the coordinates of the center of the crater was averaged and used as the surface temperature of the crater floor. All data used in this analysis of the crater floor are shown in Table 1.

3. Results

We estimated the dielectric constant of the crater floor at two local times using the model and obtained the surface bolometric temperature at each time. The estimated dielectric constant values and the bolometric temperatures at the local time of 18.01 in summer (hereafter, summer evening) and 6.47 in winter (hereafter, winter morning) are shown in Figure 3. Figure 3a,c are the frequency distributions of the estimated dielectric constants at the crater floor in the summer evening and the winter morning, respectively. Figure 3b,d are the corresponding bolometric surface temperatures. Note that the bolometric temperature includes the measurement uncertainty induced by the noise in each channel. From the noise-equivalent temperature difference of each channel [13], the uncertainty of the bolometric temperature is about 0.5–5 K. Statistical values of the results are summarized in Table 2.

4. Discussion

4.1. Temperature Dependence of the Dielectric Constant

The frequency distributions of the dielectric constants at the crater floor estimated from the Mini-RF data at different local times appear to be different (Figure 3a,c). The histograms at the two local times (Figure 3a,c) are somewhat similar except for a longer tail for the summer evening. The two-sample Kolmogorov–Smirnov test (KS test) and the Mann-Whitney U test were performed, and the null hypothesis that the distribution of the estimated dielectric constants for the summer evening and that for the winter morning follow the same distribution was rejected at a significance level of 5% with a p-value 0; the shape of the distribution of the estimated dielectric constants is statistically different between the summer evening and the winter morning. This might be attributed to the temperature dependence of the dielectric constant. The Debye model [17] suggests that the dielectric constant remains constant at very low temperatures (less than 150 K or so, depending on the relaxation time of the dipole moment), which can explain the similar shapes of the frequency distributions for the lower dielectric constants (i.e., lower temperatures). On the other hand, the Debye model [17] and laboratory experiments [5] indicate that the dielectric constant depends on the temperature at higher temperatures. In this sense, the regions with higher surface temperatures may have larger dielectric constant values, resulting in the broadening of the tails of the shape of the frequency distribution of the dielectric constant of the summer evening.
Note that some estimated dielectric constant values appear to be outside the range of the laboratory measurement result [5]. This may be partly due to the sensitivity of the Mini-RF observations to various factors, such as the wavelength-scale roughness and the surface slope [18]. The SAR backscattering from the surface depends on the Fresnel reflection coefficients, which are directly related to the surface dielectric constant and the incidence angle. Even though we studied the crater floor to minimize the topographical slope effect, the actual radar incidence angle can vary from pixel to pixel due to the existences of boulders or small-scale topography. Thus, if we interpret the SAR backscattering with an inaccurate radar incidence angle, the estimated dielectric constant values can be biased. This effect contributes to broadening the frequency distribution patterns of the dielectric constant, which may explain the longer tail of the histogram and a larger standard deviation for the summer evening.
The relatively large standard deviation for both the summer evening and the winter morning can be attributed to the inherent speckle noise of SAR images or the potential abundance of wavelength-scale rocks on the lunar surface and subsurface [6]. In addition, the instrumentation and processing errors associated with the radiometric calibration and retrieval of the H and V linear backscatter components cause the relatively large standard deviation in the retrieved dielectric constant [10]. Further, advanced data processing methods to reduce the slope effect on the radar echo (e.g., [19]) might help reduce these errors.

4.2. The Threshold of the HPSS Parameter

As mentioned above, we used the pixels with HPSS > 0.7; the main conclusion remains the same when we use different thresholds, such as 0.6 and 0.65. Figure 4c,d and Figure 4e,f show the estimated dielectric constant for the pixels with HPSS > 0.65 and >0.6, respectively. Note that the lower the threshold we use, the more pixels remain, probably due to the existence of boulders [20]. In this case, double-bounce scattering is more likely to occur, reducing the proportion of single scattering in the radar echo. Thus, the HPSS parameter representing the dominance of single scattering is likely to become smaller.
Figure 5 shows the frequency distributions of the estimated dielectric constants for different HPSS thresholds. Note that the shapes of the frequency distributions are similar regardless of the HPSS values, with the exception of the summer evening results, which consistently show longer tails. In the case with HPSS thresholds of 0.6 and 0.65, the two-sample KS test and Mann–Whitney U test were also performed, and the null hypothesis that the distribution of the estimated dielectric constants for the summer evening and that for the winter morning follow the same distribution was rejected at a significance level of 5% with a p-value of 0; the longer tails in the summer evening are statistically significant differences. Thus, the selection of the HPSS value is independent of the observed tendency discussed in Section 4.1.
In this study, we used the HPSS threshold to extract pixels with fewer rocks and less slope within the crater floor. However, for a more accurate assessment, future research might utilize data such as rock abundance derived from Diviner [21]. This approach could enhance the precision of evaluating the dielectric constant of the regolith in future studies.

4.3. Difference in Observation Depth between Mini-RF and Diviner

The Mini-RF reflections come from the meter scale depth [11], while Diviner observes the top few centimeters [13]. This means that the difference in the surface temperature observed by Diviner does not necessarily represent the temperature difference of the regolith down to the penetration depth of the Mini-RF observation. However, considering that the thermal diurnal skin depth on the lunar surface is about 4–10 cm [22], and that the estimated dielectric constant is likely more influenced by the shallower layers, the temperature obtained by Diviner is still a good reference for discussing the dielectric constants of the regolith materials down to the penetration depth of the Mini-RF observation. For an accurate evaluation of the temperature of the regolith at the layer much deeper than the diurnal skin depth, a fully three-dimensional numerical thermal model should be invoked, though the uncertainty in the heat flux remains.

5. Conclusions

We estimated the dielectric constant values from the Mini-RF data of a crater floor in the north polar region at two local times (the summer evening and the winter morning) using the dielectric constant inversion method [6]. The bolometric surface temperatures at these local times were derived from the Diviner observation data. The shapes of the frequency distributions of the estimated dielectric constants in both the summer evening and the winter morning are somewhat similar, except for a longer tail in the case of the summer evening. The Debye model of the dielectric constant suggests that the dielectric constant does not have a temperature dependence at a very low temperature. This can explain the similarities in the frequency distribution plots in the parts of lower dielectric constants. On the other hand, at a relatively high temperature, the value of a dielectric constant can increase, the effect of which might contribute to an increase in the deviations of the estimated dielectric constants.
Our result might suggest that the dielectric constant of the lunar regolith depends on the surface temperature as found by laboratory experiments [5]. This implies that the influence of temperature on the dielectric constant is better considered when analyzing the S-band radar observation data to study the nature of subsurface materials.

Author Contributions

C.S., H.M. and M.K. conceived and designed research; C.S. analyzed data; C.S., H.M. and M.K. wrote the paper. All authors have read and agreed to the published version of the manuscript.

Funding

Japan Society for the Promotion of Science: 23H00279; Ministry of Internal Affairs and Communications: 0155-0135.

Data Availability Statement

All the Mini-RF data and Diviner brightness temperature data used in this study are available from NASA’s Planetary Data System (PDS) (http://pds-geosciences.wustl.edu, lastly accessed on 6 April 2024).

Acknowledgments

We thank Mini-RF and Diviner science team for producing publicly available datasets. We also thank the developers of USGS Integrated Software for Imagers and Spectrometers (ISIS) for enabling us to handle the Mini-RF datasets.

Conflicts of Interest

The authors declare no conflicts of interest.

Appendix A

A detailed full process of the model is explained here.
Polarimetric information obtained from quad-pol SAR observations can be expressed as a 3 × 3 coherency matrix T , under the assumption of reflection symmetry [12] as follows:
T = [ T 11 T 12 0 T 12 T 22 0 0 0 T 33 ]
The Stokes parameters for the received signals have a mapping relationship with the elements of T as shown below, where the upper and lower signs apply for left-hand circular and right-hand circular transmission [23].
[   S 1 S 2 S 3 S 4   ] = [   1 2 ( T 11 + T 22 + T 33 ) R e ( T 12 ) I m ( T 12 ) ± 1 2 ( T 23 + T 33 T 11 )   ]
The coherency matrix T can also be expressed in X-Bragg model [15] as
T = [ C 1 C 2 sin c ( 2 β 1 ) 0 C 2 sin c ( 2 β 1 ) C 3 ( 1 + sin c ( 4 β 1 ) ) 0 0 0 C 3 ( 1 sin c ( 4 β 1 ) ) ]
where sin c ( x ) = sin ( x ) / x , and the coefficients C 1 , C 2 , and C 3 are the Bragg components of the surface as shown in Equation (A4). β 1 is a roughness indicator, the width of the uniform distribution that the angle of the inclination of the plane where the scattering occurs.
C 1 = | R S + R P | 2 ,   C 2 = ( R S + R P ) ( R S R P ) ,   C 3 = 1 2 | R S R P | 2
R S and R P are the vertical and horizontal Bragg scattering coefficients, which are functions depending only on the radar incidence angle θ and the dielectric constant ε .
R S = cos θ ε sin 2 θ cos θ + ε sin 2 θ R P = ( ε 1 ) ( sin 2 θ ε ( 1 + sin 2 θ ) ) ( ε cos θ + ε sin 2 θ ) 2
From (A1)–(A3), considering that Mini-RF transmitted left-hand circular polarization, the Stokes parameters can be expressed in X-Bragg model as
S 1 = 0.5 ( C 1 + 2 C 3 ) ,   S 2 = C 2 sin c ( 2 β 1 ) ,   S 3 = 0 ,   S 4 = 0.5 ( 2 C 3 C 1 )
The alpha angle can be expressed by the Stokes parameters:
α = 1 2 tan 1 ( S 2 2 + S 3 2 S 4 )
and from (A6) and (A7), the alpha angle in X-Bragg model is
α = 1 2 tan 1 ( C 2 sin c ( 2 β 1 ) 0.5 ( 2 C 3 C 1 ) )
The indicator of roughness β 1 cannot be calculated directly from hybrid polarimetric SAR data [16]. To estimate β 1 , the hybrid polarimetric scattering similarity (HPSS), a parameter describing the similarity between the scattering observed in radar echoes and the standard single scattering, is introduced. On the lunar surface, the single scattering is dominant in radar echoes when observing a surface with small roughness [24]. Thus, HPSS can be interpreted as a measure to estimate β 1 . HPSS is calculated as the similarity between the 2 × 2 average wave coherency matrix of radar echoes ( J ) and that of the pure single scattering ( J S ).
H P S S ( J ,   J S ) = T r ( J · J S H ) T r ( J ) T r ( J S )
where T r denotes the trace of the matrix, and H denotes the Hermitian conjugate. J and   J S are defined as follows [12]:
J = 1 2 [ S 1 + S 2 S 3 j S 4 S 3 + j S 4 S 1 S 2 ]   J S = 1 2 [ 1 j j 1 ]
where j is the imaginary unit. HPSS takes the value from 0 to 1, and as the HPSS approaches 1, the single scattering is dominant in the observed radar echoes. β 1 should be calculated so that it approaches 0 when the HPSS approaches 1, which means the single scattering is more dominant. Thus, β 1 can be estimated as
β 1 = ( 1 H P S S ) π 2
Now, α in Equation (A8) is a function depending only on ε , because β 1 can be calculated from the Stokes parameters by Equations (A9)–(A11), and the coefficients C 1 , C 2 , and C 3 are a function of ε when θ is known from data, due to Equation (A4) and (A5). The dielectric constant can be estimated by obtaining α d a t a with Equation (A7) and α m o d e l with Equation (A8) as follows:
ε = min ε | α d a t a α m o d e l ( ε ,   θ ,   H P S S ) |

References

  1. Spudis, P.D.; Bussey, D.B.J.; Baloga, S.M.; Cahill, J.T.S.; Glaze, L.S.; Patterson, G.W.; Raney, R.K.; Thompson, T.W.; Thomson, B.J.; Ustinov, E.A. Evidence for water ice on the moon: Results for anomalous polar craters from the LRO Mini-RF imaging radar. J. Geophys. Res. Planets 2013, 118, 2016–2029. [Google Scholar] [CrossRef]
  2. Ishiyama, K.; Kumamoto, A.; Ono, T.; Yamaguchi, Y.; Haruyama, J.; Ohtake, M.; Katoh, Y.; Terada, N.; Oshigami, S. Estimation of the permittivity and porosity of the lunar uppermost basalt layer based on observations of impact craters by SELENE. J. Geophys. Res. Planets 2013, 118, 1453–1467. [Google Scholar] [CrossRef]
  3. Su, Y.; Wang, R.; Deng, X.; Zhang, Z.; Zhou, J.; Xiao, Z.; Ding, C.; Li, Y.; Dai, S.; Ren, X.; et al. Hyperfine Structure of Regolith Unveiled by Chang’E-5 Lunar Regolith Penetrating Radar. IEEE Trans. Geosci. Remote Sens. 2022, 60, 1–14. [Google Scholar] [CrossRef]
  4. Olhoeft, G.R.; Strangway, D.W. Dielectric Properties of First 100 Meters of Moon. Earth Planet. Sci. Lett. 1975, 24, 394–404. [Google Scholar] [CrossRef]
  5. Kobayashi, M.; Miyamoto, H.; Pál, B.D.; Niihara, T.; Takemura, T. Laboratory measurements show temperature-dependent permittivity of lunar regolith simulants. Earth Planets Space 2023, 75, 8. [Google Scholar] [CrossRef]
  6. Gao, Y.; Dang, Y.; Lu, P.; Hou, W.; Zhao, F.; Wang, B.; Yu, W.; Wang, R. Investigating the dielectric properties of lunar surface regolith fines using Mini-RF SAR data. ISPRS J. Photogramm. Remote Sens. 2023, 197, 56–70. [Google Scholar] [CrossRef]
  7. Singh, A.; Sharma, A.; Kumar, S.; Chang, L.; Vashishtha, A.; Raj, R.; Agrawal, S.; Chauhan, P. Dielectric characterization and polarimetric analysis of lunar north polar crater Hermite-A using Chandrayaan-1 Mini-SAR, Lunar Reconnaissance Orbiter (LRO) Mini-RF, and Chandrayaan-2 DFSAR data. Adv. Space Res. 2022, 70, 4030–4055. [Google Scholar] [CrossRef]
  8. Kumar, A.; Kochar, I.M.; Pandey, D.K.; Das, A.; Putrevu, D.; Kumar, R.; Panigrahi, R.K. Dielectric Constant Estimation of Lunar Surface Using Mini-RF and Chandrayaan-2 SAR Data. IEEE Trans. Geosci. Remote Sens. 2022, 60, 1–8. [Google Scholar] [CrossRef]
  9. Williams, J.; Greenhagen, B.T.; Paige, D.A.; Schorghofer, N.; Sefton-Nash, E.; Hayne, P.O.; Lucey, P.G.; Siegler, M.A.; Aye, K.M. Seasonal Polar Temperatures on the Moon. J. Geophys. Res. Planets 2019, 124, 2505–2521. [Google Scholar] [CrossRef]
  10. Raney, R.K.; Spudis, P.D.; Bussey, B.; Crusan, J.; Jensen, J.R.; Marinelli, W.; McKerracher, P.; Neish, C.; Palsetia, M.; Schulze, R.; et al. The Lunar Mini-RF Radars: Hybrid Polarimetric Architecture and Initial Results. Proc. IEEE 2011, 99, 808–823. [Google Scholar] [CrossRef]
  11. Nozette, S.; Spudis, P.; Bussey, B.; Jensen, R.; Raney, K.; Winters, H.; Lichtenberg, C.L.; Marinelli, W.; Crusan, J.; Gates, M.; et al. The Lunar Reconnaissance Orbiter Miniature Radio Frequency (Mini-RF) Technology Demonstration. Space Sci. Rev. 2010, 150, 285–302. [Google Scholar] [CrossRef]
  12. Lee, J.S.; Pottier, E. Polarimetric Radar Imaging: From Basics to Applications; CRC Press: New York, NY, USA, 2009. [Google Scholar]
  13. Paige, D.A.; Foote, M.C.; Greenhagen, B.T.; Schofield, J.T.; Calcutt, S.; Vasavada, A.R.; Preston, D.J.; Taylor, F.W.; Allen, C.C.; Snook, K.J.; et al. The Lunar Reconnaissance Orbiter Diviner Lunar Radiometer Experiment. Space Sci. Rev. 2010, 150, 125–160. [Google Scholar] [CrossRef]
  14. Paige, D.A.; Siegler, M.A.; Zhang, J.A.; Hayne, P.O.; Foote, E.J.; Bennett, K.A.; Vasavada, A.R.; Greenhagen, B.T.; Schofield, J.T.; McCleese, D.J.; et al. Diviner Lunar Radiometer Observations of Cold Traps in the Moon’s South Polar Region. Science 2010, 330, 479–482. [Google Scholar] [CrossRef]
  15. Hajnsek, I.; Pottier, E.; Cloude, S.R. Inversion of surface parameters from polarimetric SAR. IEEE Trans. Geosci. Remote Sens. 2003, 41, 727–744. [Google Scholar] [CrossRef]
  16. Ponnurangam, G.G.; Jagdhuber, T.; Hajnsek, I.; Rao, Y.S. Soil Moisture Estimation Using Hybrid Polarimetric SAR Data of RISAT-1. IEEE Trans. Geosci. Remote Sens. 2016, 54, 2033–2049. [Google Scholar] [CrossRef]
  17. Yushkova, O.V.; Kibardina, I.N. Dielectric Properties of Lunar Surface. Sol. Syst. Res. 2017, 51, 121–126. [Google Scholar] [CrossRef]
  18. Eke, V.R.; Bartram, S.A.; Lane, D.A.; Smith, D.; Teodoro, L.F. Lunar polar craters—Icy, rough or just sloping? Icarus 2014, 241, 66–78. [Google Scholar] [CrossRef]
  19. Fassett, C.I.; Bramson, A.M.; Cahill, J.T.S.; Harris, C.P.; Morgan, G.A.; Neish, C.D.; Nypaver, C.A.; Patterson, G.W.; Rivera-Valentin, E.; Taylor, P.A.; et al. Improved Orthorectification and Empirical Reduction of Topographic Effects in Monostatic Mini-RF S-band Observations of the Moon. Planet. Sci. J. 2024, 5, 4. [Google Scholar] [CrossRef]
  20. Campbell, B.A. High circular polarization ratios in radar scattering from geologic targets. J. Geophys. Res. Planets 2012, 117, E6. [Google Scholar] [CrossRef]
  21. Bandfield, J.L.; Ghent, R.R.; Vasavada, A.R.; Paige, D.A.; Lawrence, S.J.; Robinson, M.S. Lunar surface rock abundance and regolith fines temperatures derived from LRO Diviner Radiometer data. J. Geophys. Res. Planets 2011, 116, E12. [Google Scholar] [CrossRef]
  22. Hayne, P.O.; Bandfield, J.L.; Siegler, M.A.; Vasavada, A.R.; Ghent, R.R.; Williams, J.; Greenhagen, B.T.; Aharonson, O.; Elder, C.M.; Lucey, P.G.; et al. Global Regolith Thermophysical Properties of the Moon From the Diviner Lunar Radiometer Experiment. J. Geophys. Res. Planets 2017, 122, 2371–2400. [Google Scholar] [CrossRef]
  23. Cloude, S.R.; Goodenough, D.G.; Chen, H. Compact Decomposition Theory. IEEE Geosci. Remote Sens. Lett. 2012, 9, 28–32. [Google Scholar] [CrossRef]
  24. Heggy, E.; Palmer, E.M.; Thompson, T.W.; Thomson, B.J.; Patterson, G.W. Bulk composition of regolith fines on lunar crater floors: Initial investigation by LRO/Mini-RF. Earth Planet. Sci. Lett. 2020, 541, 116274. [Google Scholar] [CrossRef]
Figure 1. Flowchart of the dielectric constant estimation method.
Geosciences 14 00101 g001
Figure 2. The overview of the dielectric constant estimation at the crater floor: (a) Normalized S1 parameter image of the crater (lsz_04556_1cd_xku_82n149_v1). (b) Estimated dielectric constant for the whole crater. (c) The locations of the pixels where HPSS > 0.7 overlaid on the S1 parameter image. (d) Estimated dielectric constant at the pixels where HPSS > 0.7 overlaid on the S1 parameter image. The red circle indicates the crater floor.
Geosciences 14 00101 g002
Figure 3. (a) The frequency distribution of the estimated dielectric constant of the crater floor for pixels with HPSS > 0.7 in the summer evening. The bins for the estimated dielectric constants are set to 0.25. (b) The bolometric temperature map around the crater in the summer evening. The temperature in Table 2 was obtained by averaging the 2.5 km in diameter circle at the center of the crater (red circle). (c) The frequency distribution of the estimated dielectric constant of the crater floor at pixels with HPSS > 0.7 in the winter morning. The bins for the estimated dielectric constants are set to 0.25. (d) The bolometric temperature map around the crater floor in the winter morning. The temperature in Table 2 was obtained by averaging the 2.5 km in diameter circle at the center of the crater (red circle).
Geosciences 14 00101 g003
Figure 4. Estimated dielectric constant at the pixels where HPSS is greater than the threshold overlaid on the S1 parameter image. The red circle indicates the crater floor. (a,c,e) are the estimation result from the data in the summer evening, and (b,d,f) are the estimation result from the data in the winter morning. The threshold that determines whether to include the pixel when averaging the estimated dielectric constants for the whole crater floor is set to 0.7 in (a,b), 0.65 in (c,d), and 0.6 in (e,f).
Geosciences 14 00101 g004
Figure 5. Frequency distribution of the estimated dielectric constant at the crater floor. The bins for the estimated dielectric constant are 0.25. Red indicates the summer evening (i.e., the higher surface temperature), while blue indicates the winter morning (i.e., the lower surface temperature). The solid line represents the frequency distribution of the estimated dielectric constant in the case where the HPSS threshold is 0.7, the dashed line represents the case when the threshold is 0.65, and the dotted line represents the case when the threshold is 0.6.
Geosciences 14 00101 g005
Table 1. Dataset.
Table 1. Dataset.
Local Time at Crater Floor
<hour> 1
Mini-RF DataSeasonDiviner Data
18.01 (evening)lsz_04556_1cd_xku_82n149_v1 2summerpcp_avg_tbol_poln_sum_ltim71_240 4
pcp_avg_tbol_poln_sum_ltim73_240 4
6.47 (morning)lsz_04751_1cd_xku_82n152_v1 3winterpcp_avg_tbol_poln_win_ltim27_240 5
1 The hour is in decimals. 2 lsz_04556_1cd_xku_82n149_v1 was collected on 21 June 2010. 3 lsz_04751_1cd_xku_82n152_v1 was collected on 7 July 2010. 4 pcp_avg_tbol_poln_sum_ltim72_240, the temperature distribution map at the time closest to 18.01 h, was missing the data for the crater floor, so the average of the data before and after that time were used. 5 pcp_avg_tbol_poln_win_ltim26_240, the temperature distribution map at the time closest to 6.48 h, and the data before that time (pcp_avg_tbol_poln_win_ltim25_240) was missing the data for the crater floor, so the data before that time was used.
Table 2. The estimated dielectric constant and surface bolometric temperature.
Local Time <hour> 1Tbol [K] 2 ε Average ε Std 3 ε Median
18.01 (summer evening)109.24.531.434.28
6.47 (winter morning)58.74.140.843.99
1 The hour is in decimals. 2 The temperature is the average in the red circle in Figure 3. 3 The standard deviation of the pixels averaged.
Disclaimer/Publisher’s Note: The statements, opinions and data contained in all publications are solely those of the individual author(s) and contributor(s) and not of MDPI and/or the editor(s). MDPI and/or the editor(s) disclaim responsibility for any injury to people or property resulting from any ideas, methods, instructions or products referred to in the content.

