Article

Opening and Post-Rift Evolution of Alpine Tethys Passive Margins: Insights from 1D Numerical Modeling of the Jurassic Mikulov Formation in the Vienna Basin Region, Austria

1
Geological Survey of Serbia, Rovinjska 12, 11000 Belgrade, Serbia
2
Department of Geology, University of Vienna, Josef Holaubek-Platz 2, 1090 Vienna, Austria
3
Institute of Chemistry, Technology and Metallurgy, University of Belgrade, Njegoseva 12, 11000 Belgrade, Serbia
4
Jaroslav Černi Water Institute, Jaroslava Černog 80, 11226 Belgrade, Serbia
*
Authors to whom correspondence should be addressed.
Geosciences 2024, 14(8), 202; https://doi.org/10.3390/geosciences14080202
Submission received: 9 June 2024 / Revised: 23 July 2024 / Accepted: 25 July 2024 / Published: 30 July 2024

Abstract

:
This study employed 1D numerical pseudo models to examine the Upper Jurassic carbonate succession, focusing on the Mikulov Formation in the Vienna Basin region. It addresses the protracted and complex history of the Jurassic source rock play, revealing a transition from rapid syn-rift (>200 m/Ma) to slower post-rift sedimentation/subsidence of the overlying layers during extensional deformation (up to 120 m/Ma with a thickness of 1300 m). This provides valuable insights into the rift-to-drift stage of the central Alpine Tethys margin. The Mikulov marls exhibit characteristics of a post-rift passive margin with slow sedimentation rates. However, a crustal stretching analysis using syn-rift heat flow sensitivity suggested that thermal extension of the basement alone cannot fully explain the mid-Jurassic syn-rift stage in this segment of the Alpine Tethys. The sensitivity analysis showed that the mid-late Jurassic differential syn-rift sequences were exposed to slightly cooler temperatures than the crustal stretching model predicted. Heat flow values below 120 mW/m2 aligned with measurements from deeply settled Mesozoic successions, suggesting cold but short gravity-driven subsidence. This may account for the relatively low thermal maturation of the primary source rock interval identified by the time-chart analysis, despite the complex tectonic history and considerable sedimentary burial. The post-Mesozoic changes in the compaction trend are possibly linked to the compressional thrusting of the Alpine foreland and postdating listric faulting across the Vienna Basin.

1. Introduction

The crustal opening of basins and subsequent development of post-rift passive continental margins are crucial processes in Earth’s geological history, contributing to the formation of oceans. However, research into these processes delves into a less-explored aspect of ancient oceanic opening stages and their early continental margins. There is a lack of understanding regarding the incipient stages of the Alpine Tethys—the oceanic domain between the European–Iberian and African–Adriatic (micro)continents. Further studies have been required to investigate the crustal behavior, mechanism, and passive margin evolution during and after the opening of the Alpine Tethys [1,2,3,4,5]. Numerical analyses of crustal and lithospheric behavior and the quantification of bulk extensional activity are essential for understanding the complex transitional history of paleo-ocean openings and rifted margins (e.g., [6]). However, as often embedded into collisional orogens, ancient passive margins frequently underwent intense deformation, tectonic exhumation, or deep burial, complicating the reconstruction of their original configuration [7]. An example of such margins is recorded in Central Europe, particularly in the Eastern Alps (Austria, Switzerland; e.g., [1,2,8]; Figure 1).
The passive margin phase of the Alpine Tethys (Penninic ocean realm) exhibits significant age disparities due to varying onset times of syn-rift extension along the peri-Tethyan margins [4,5,8] (Figure 2a). Sedimentary deposits on these margins, particularly the Upper Jurassic Mikulov Formation (Fm.), play a pivotal role as important sources for a multitude of hydrocarbon reservoirs, stretching from the Vienna Basin to the Moesian Platform. Despite its lower coverage, the significance of the Mikulov Fm. in the Vienna Basin region for hydrocarbon reservoir exploration cannot be overstated [8,13,14]. The Upper Jurassic sequences act as the main detachment layer, facilitating the formation of significant Alpine thrusts and likely postdating rollover Miocene plays [12,15,16]. This study examined the sedimentation and subsidence trends of the Mikulov Fm. in the Vienna Basin region, Austria, which reflects the evolution of the deeply buried yet displaced passive margin of the Alpine Tethys. This research presents a complex and challenging study of the crustal opening and post-rift evolution of the Alpine Tethys and its passive margins, further connecting the importance of the Upper Jurassic strata to hydrocarbon reservoir exploration. The Upper Jurassic successions are characterized by substantial thickness and an organic-rich content with total organic carbon (TOC) levels ranging between 1.5% and 2% and containing kerogen types II and III [17,18,19,20]. These characteristics suggest a somewhat deep-water depositional environment during the Late Jurassic. The Mikulov marls have received significant but focused attention as the Vienna Basin’s primary source rock pod, yielding oil, gas, and condensate [13,14] (Table A1). The oil window is notably deep, estimated at between 4000 and 6000 m [13,15,17,18]. The relatively low thermal levels in the modern-day play could result from the peculiar crustal opening processes, post-Jurassic events, or post-depositional subsidence (Figure 2b), likely contributing to hydrocarbon generation in the Vienna Basin. The primary gas generation stage typically occurs below 6000 m, with depleted overmature source rock potentially reaching depths exceeding 9 km [15,17]. Notably, the hydrocarbons were generated from the Jurassic source rocks only after the secondary subsidence of the entire thrust belt and the formation of the Vienna Basin in Miocene time [19,20]. Thus, the hydrocarbon generation history is closely associated with the original yet barely constrained autochthonous configuration of the landlocked Jurassic Alpine Tethys. The source rock interval is represented by the poorly understood but very thick deep-water Mikulov sequence, overlain by the late Alpine thrusting sequence and the Neogene basin strata (Figure 2b). In addition to regional geological constraints, quantifying the region’s post-rift sedimentation and subsidence rates can provide insights into these early processes.
The Vienna Basin is one of the most extensively explored basins in the world, offering abundant tectonostratigraphic data from hydrocarbon-bearing Neogene sequences (e.g., [9,10,11,12,24,25,26]). However, with a few exceptions (e.g., [10,22,23]), its basement evolution remains insufficiently explored, particularly the tectonic autochthonous basement of the Mesozoic age. Such an asymmetry in exploration efforts is primarily due to the focus on reservoir sections within the Molasse and Vienna basins [27,28,29,30,31,32,33]. A significant challenge hindering deeper exploration is the nappe-stacked crustal configuration, which limits the seismic data quality with increasing depth (e.g., [12]). The tectono-paleogeographic evolution and the role of the Jurassic opening of the Alpine Tethys [1,2,3,4,5,34], including the deposition of Upper Jurassic marls before the Cretaceous Tethyan closure [35], remain largely unknown. To address this gap, we aimed to quantify the opening and development of the early Alpine Tethys by scrutinizing computed subsidence trends associated with the passive margins. Employing a 1D basin modeling tool, we constructed a set of several numerical pseudo or well-based models to quantify early sedimentation rates and mechanisms that led to the opening. In addition, the study juxtaposed computed numerical constraints on the compaction trends, assessing their role in extensional (listric) faulting (e.g., [23,31]).
Computing point-based sedimentation rates is challenging because the original Jurassic Alpine Tethys and its passive margin are displaced with a nappe-stacked configuration (e.g., [33]; Figure 2b). Further complicating this issue, the mechanism of crustal behavior appears to have an atypical evolution (e.g., [36,37,38]), deviating from the widely accepted McKenzie model [39]. The compressional nappe-stacked configuration results in tectonically enlarged thicknesses of the lower-positioned Jurassic sequences (Figure 2b). Nevertheless, we present a 1D numerical modeling workaround. Our results indicate that the Upper Jurassic passive margin sequence had significantly slower subsidence. The computed subsidence rates depended on the paleo-basin locations and associated thickness of the Mikulov source rocks. Rapid syn-rift subsidence contributed to a lithospheric downwarping model with limited crustal thinning, i.e., thermal upwelling. In conventional crustal stretching terms [39], the resulting models showed different heat flow values and subsidence rates that are functions of the initial basin opening tectonic stages, syn-rift, and post-rift sequences. The computed sedimentation rates aligned with the underlying syn-rift sediments and postdating terminal thermal-type slower subsidence of the Cretaceous layers, providing a clear transition between two lithosphere-controlled stages.

2. Regional Geological Outline

The tectonosedimentary evolution of the Alpine Tethys stage in the Eastern Alps and the Western Carpathians (Figure 1a) can be traced back to the Late Permian to Early Triassic rifting. These composite sequences are characterized by siliciclastic and limestone components [2,3,19,29]. During the Triassic and Early to Middle Jurassic, early Alpine rifting processes led to the opening of several Tethyan oceanic basins linking with the central Atlantic rift system [3,40]. The extensional dynamics led to the separation of the Austroalpine microcontinent from the southern European margin (including Adria/Dinarides), followed by the formation of continental margins [2,41]. The onset of oceanic spreading probably occurred during the Aalenian to Bajocian [40]. In the Late Jurassic, the post-rift passive margins formed with the development of carbonate platforms and basins (Figure 2), accumulating up to 2000 m of Upper Jurassic and Cretaceous strata [13,14,22]. The newly formed oceanic basins and mafic-type crust developed until the beginning of the Cretaceous, when the mid-oceanic spreading was succeeded by southward subduction beneath the northern Austroapline plate. Subsequent collision events, lasting until the Paleocene, were driven by the northward thrust of the Adria plate as a part of Africa. These events transformed the southern margins of the European plate into the basement of the Alpine fold-and-thrust belt (Figure 2b). The Alpine orogenic system exhibits significant regional variations in tectonosedimentary developments [12,19,29,34,41]. In the study area, the Alpine foreland basin (Molasse Basin) and the piggy-back to pull-apart Vienna Basin conceal the Alpine fossil margins beneath substantial Neogene sedimentary deposits (Figure 1, Figure 2b and Figure 3). The study area encompasses the region surrounding the Steinberg fault and Zistersdorf depression in the central-western part of the Vienna Basin (Figure 1). The intricate arrangement of the thick sedimentary succession overlying the Paleozoic basement rocks is classified into three distinct tectonostratigraphic units (Figure 3): (i) the investigated autochthonous Mesozoic unit, primarily buried beneath (ii) the allochthonous unit comprising various crustal slices or nappes of the Waschberg, Flysch, and Calcareous Alpine zones, further overlain by (iii) the Miocene sedimentary sequences of piggy-back and pull-part basin systems (Figure 2b).
In the study area across the Steinberg fault (Zistersdorf-Maustrenk area; Figure 4), drilling activities between 1977 and 1990 targeted the primary subthrust autochthonous layers [23]. The following wells have a total depth that reaches into the Alpine Tethys-related autochthonous units: Zistersdorf ÜT1a (7544 m), Zistersdorf ÜT2A (8533 m), Maustrenk ÜT1a (6563 m), and Aderklaa ÜT1a (6630 m). These deep wells penetrated beneath the Neogene deposits, separated by the significant extensional Steinberg fault within hanging wall and footwall blocks (Figure 4b). In well Zistersdorf ÜT1a, a considerable flow of overpressured gas was discovered, related to the Ernstbrunn Fm., but production was not possible due to the borehole collapse. The replacement well, Zistersdorf ÜT2A, could not repenetrate the gas reservoir [23,25]. In well Maustrenk ÜT1a, moderate amounts of oil and gas were produced from a fractured zone near an internal detachment plane, just above the undisturbed autochthonous interval. These findings indicated the Mikulov rocks serve as a crucial source rock in the area (Figure 3 and Figure 4a [25]). In the Zistersdorf–Maustrenk area, the down-thrown hanging wall block exhibits greater thicknesses of equivalent units due to the syn-sedimentary movement of a significant listric fault, whereby the footwall thicknesses of the Mesozoic sequence were also affected by the precursory thrusting (Figure 4b). Before the Miocene extensional episode, multiple flysch units, the Waschberg Zone, and Molasse deposits were thrust over the autochthonous Mesozoic sequence [2,10,18,19,34]. This complex tectonic history highlights the dynamic interplay between extensional and compressional forces that shaped the present geological configuration in the region.

2.1. Autochthonous Mesozoic Unit

During the Middle Jurassic, the syn-rift sedimentary strata (Gresten Fm.; Aalenian to Bathonian) were deposited in half-grabens (Figure 2b), classified into four members [13,22] (Figure 3). The alternating lithologies of quartzarenite and shale are particularly significant, as they provide valuable records of fluctuations in the relative sea level and subsidence rates during the rifting phase [10,30,47,48].
After the initial rifting phase, a basin system evolved on the passive margin, leading to sedimentation in shallow marine conditions (Figure 2a). The post-rift sediments, notably dolomitic sandstones with chert nodules (Höflein Fm.; Callovian) and dolostones and limestones devoid of clastic input in stable conditions (Vranovice Fm.; lower Oxfordian), mark a significant transition in the geological history of the Vienna Basin region [19,46]. A key player in the margin’s evolution was the carbonate depositional system that developed during the Oxfordian to Tithonian, forming the Klentnitz Group (Figure 3). Due to the increasing water depth in the basin, the Altenmarkt Fm. features shallow-water carbonates, grading eastward into the Falkenstein Fm. characterized by transitional facies. The sequence culminated with the Mikulov Fm., comprising deep marine marlstones. Basinward, the Mikulov Fm. ranges from thinly bedded sequences to thick deposits [14,46]. These carbonates grade upwards into dark, sandy dolomitic limestones of the Kurdejov Fm. and a limestone succession belonging to the Ernstbrunn Fm., spanning from the uppermost Tithonian to the Berriasian age (Figure 3). The early Cretaceous episode of regional uplift was accompanied by the regression and subsequent erosion (karstification of Jurassic limestones and bauxite formation [49]). It is essential to note the post-Jurassic erosional event recorded in the broader area of the Alpine Tethys. It corresponds to a regional uplifting episode that was recently outlined for the Neo-Tethyan Vardar Zone in central Serbia [50,51]. Following the Late Cretaceous transgression, the locally developed depositional sequences are described as a sandy–marly succession (Ameis Fm.; Turonian to Santonian/Campanian) as well as a shaly–marly succession (Poysdorf Fm.; Campanian age) [19,46] (Figure 3).

2.2. Allochthonous Unit with Thrust Complex

During the Paleocene and Eocene, orogenic processes gradually deformed and thrusted over the European foreland (Figure 2b), driven by the collision between the European plate and the Adriatic and Apulian plates [41]. Subsequently, the marine sediments were uplifted, folded, and thrust over each other, which formed the Waschberg and Flysch zones, consisting of several nappes (Figure 4b and Figure 5). The fold-and-thrust belt of the Northern Calcareous Alps was positioned atop the southern European margin and suture zone (Figure 1 and Figure 2b). Their timing and sediment thickness vary depending on the geological context and location within the Alpine–Carpathian zone (e.g., [19,46,52,53,54]).
In the Vienna Basin, investigating these structural units is crucial due to the presence of gas and oil-bearing reservoirs in several thrust sheets and fractured carbonate rocks [22,25,46]. The Alpine nappes are well concealed beneath the Miocene pile in the Pannonian Basin [55]. The Mikulov marls were overthrust by a system of the allochthonous nappes, forming the Flysch belt [12,19]. Tectonic shortening occurred both in the decoupled thin-skinned thrust belt and at the deeper crustal level, where various blocks of the previously rifted margins were at least partially accreted back to the foreland plate instead of being subducted. The post-collisional thrust activity was interrupted by tectonic subsidence [56], which continued into the early Miocene [19,57]. The principal Alpine thrusting was situated within the Mikulov Fm. ([12,46]; Figure 5), suggesting that the lithology and compaction of the marlstones play a significant role in the thrusting processes.
As the orogenic wedge of the Alpine–Carpathian belt advanced northward over the European continental margin, it established a foredeep setting characterized by the formation of a wedge-shaped sediment accumulation known as the Molasse Basin (Figure 1 and Figure 2b). The basin predominantly comprises the Oligocene and Miocene deposits, sourced from the erosion of the uplifting Alpine mountains [46,47,57,58]. The Waschberg zone, thrust over the sequences of the Molasse to the north (Figure 1 and Figure 5), represents a transitional zone to the Austroalpine units. It consists of a strongly deformed Paleogene to Lower Miocene series with ‘klippen’ of the Mesozoic detached from the shelf area of the Penninic Ocean [12,23,52]. The lower Molasse deposits beneath the Waschberg zone were determined in the study area through seismic surveys and drilling (Figure 4b).

2.3. Miocene Basin System

In the Miocene, the Vienna Basin formed through a poly-phase evolution from a piggy-back (wedge-top) to a pull-apart basin phase (Figure 1b, Figure 2b and Figure 3), which is intricately associated with changes in the regional stress field. The Miocene sediments disconformably overlay the eroded surface of the Alpine–Carpathian thrust complex [9,11,25,26,45]. During the Early Miocene, several small piggy-back basins were situated on the frontal regions of the N to NW-propagating thrust belt [11,26]. The marine depositional setting expanded gradually from the depocenters in the northern Vienna Basin, which is correlated with the deltaic-brackish setting in the southern part [44]. At the end of the early Miocene, the tectonic deformation of Alpine–Carpathian units, linked to the retreating subduction zone, triggered complex strike-slip faulting and extensional regimes, resulting in the formation of a pull-apart system marked by rapid subsidence [11]. The structural architecture predominantly displays NE-SW trending sinistral strike-slip duplexes and en-echelon listric faults (Figure 1a and Figure 4a). Growth strata along normal faults, mainly the Steinberg fault with an average offset of 5.6 km (Figure 4b), indicate synsedimentary faulting during the Middle Miocene periods [25,26,45,59]. A broad paleo-Danube delta complex transported massive sediments from the Alpine Foreland Basin area into the basin. During the late Miocene, the depositional environment transitioned from restricted marine to lacustrine settings following the separation of the Paratethys [44].
During the latest Miocene, shifts in the regional stress field led to a gradual structural inversion, resulting in more than 200 m of uplift and subsequent sediment erosion [9,45]. During the Quaternary, several small depressions formed along the Vienna transfer fault system, filled with fluvial sediments unconformably overlying the Miocene sediments [60].

3. Approach, Methodology, and Construction of 1D Pseudo Models

According to widely accepted subsidence models for rift systems and passive margins, basin opening occurs as a response to the mechanical stretching of the continental lithosphere [39,61,62]. During the syn-rift phase, crustal stretching, asthenosphere upwelling, and elevated heat flow induce tectonic subsidence, forming basin accommodation and sedimentation. The processes are typically followed by thermal contraction during a prolonged cooling phase, further enhanced by sedimentary loading. The post-rift thermal subsidence of the continental margin controls the maximum accommodation space [61]. Subsidence rates for different layers in a sedimentary basin are calculated using the decompaction process, which primarily relies on the volume of expelled water due to overburden pressure [61,62,63]. In basin modeling techniques, decompaction is a (vertically oriented) computational method to correct the reduced thickness of a compacted sedimentary layer in a paleo model. This allows present-day thicknesses to be restored to their thicknesses at the time and depth of interest. The initial step is the back-stripping process, reproducing the original sediment thickness ( T 0 ). The present-day porosity ( ϕ p ) and thickness ( T p ) are used by applying the proper initial porosity ( ϕ 0 );
T 0 = [ ( 1 ϕ p ) / ( 1 ϕ 0 ) × T p ]
Subsidence rates, corresponding to sedimentation rates given sufficient sediment influx, are influenced by rifting and subsequent “cooling” processes. These rates depend on the stretching factor ß and a standard parameter in PetroMod basin modeling software (see later in the text). According to literature data, however, the subsidence mechanism and opening of the Alpine Tethys might not involve significant crustal stretching [36,37,38]. We examined the available hypotheses to evaluate the early Alpine Tethys and associated crustal models by screening syn-rift heat flow values as a boundary condition, which control the resulting basin models.
Basin modeling is a crucial tool in hydrocarbon exploration, facilitating the construction of time slices (stepwise restoration) to enhance our understanding of basin evolution and regional petroleum systems. The resulting 1D, 2D, or 3D restoration steps enable numerical-based predictions of the relationships between petroleum system elements in areas characterized by significant crustal shortening, which help identify and quantify critical components’ temporal and spatial distributions (e.g., [33,61,62,63,64,65,66,67,68,69,70]). To achieve our research objectives, we utilized burial history curves for the Jurassic strata, which were numerically reconstructed using primary lithologies and the variable thicknesses of the sedimentary formations, including the underlying metamorphic basement sections (Table S1).
To obtain reliable numerical results from finite element modeling (see [61,62,63] for details), we integrated the periods of deposition and erosion, as illustrated in Figure 3. Non-depositional periods, such as uplift, unconformities, erosion events, and hiatuses, were also considered in the 1D numerical basin modeling. Notably, only truncating events associated with the Jurassic sequences were significant. The precise age of the stratigraphic units for the subsidence modeling was correlated with the time scale of the International Chronostratigraphic Chart (updated from [71]). The subsidence trends of rocks were based on the decompaction method (e.g., [61,62,70]), implemented using the default PetroMod basin modeling software 2014.1 [63]. Once lithologies of the respective layers were input into PetroMod, their properties and compaction behavior (e.g., porosity, density, and permeability) were automatically assigned. The software also allows for modeling syn-rift crustal extension using the McKenzie model [39,72], which is commonly calibrated with available data (e.g., [68]). However, as our study aimed to better understand the sedimentation, subsidence, and opening of pre-subthrust layers of the Alpine Tethys, we employed different parameters for testing and calibration (thickness, bulk density, and effective porosity; see later in the text).
Due to the limitations of the open-source PetroMod 1D software, we were unable to apply the “1D thrusting” license, which allows for separate numerical computations for both displaced hanging wall and footwall domains (e.g., as demonstrated in the 2D reconstruction studies [33,69]). This constraint limited our ability to obtain detailed post-Jurassic to early Cretaceous parameters, but such a detailed analysis was beyond the scope of this study. To achieve reliable subsidence rates with the 1D models, we ensured that critical parameters were accurately represented, varying layer thicknesses and depositional constraints relative to appropriate timing. These factors were crucial for obtaining meaningful results within the software’s limitations. We calculated pressure and dewatering during burial and subsequent compaction to determine the finite porosity of the Mikulov layer. Our approach involved introducing the entire sedimentary layer into the model, with rock properties such as porosity, density, and elastic modulus varying with increasing depth, resulting in compaction curves [63]. Given the exclusive focus on the autochthonous Jurassic passive margin layers, we examined post-rift parameters contributing to the considerable thickness of the Mikulov Fm. We constructed a pseudo model that excluded the thrust-loaded hanging wall segment. By testing various geological scenarios and applying the same constraints/parameters to the thrusted crustal segment, we estimated the impact on the sedimentation rate of the Mikulov Fm. Since the thrusting event occurred much later than the Jurassic stage, subsequent changes in the overburden did not affect the early depositional computations. In addition, we compared the resulting compaction time-lap value (paleo-compaction parameter calculated for the Miocene) with the transient compaction effect, corresponding to the proposed onset of the detachment layer formation.
In addition to incorporating the pre-Mesozoic basement unit, the PetroMod 1D modeling tables were populated with the following formations and their estimated thicknesses (Table S1):
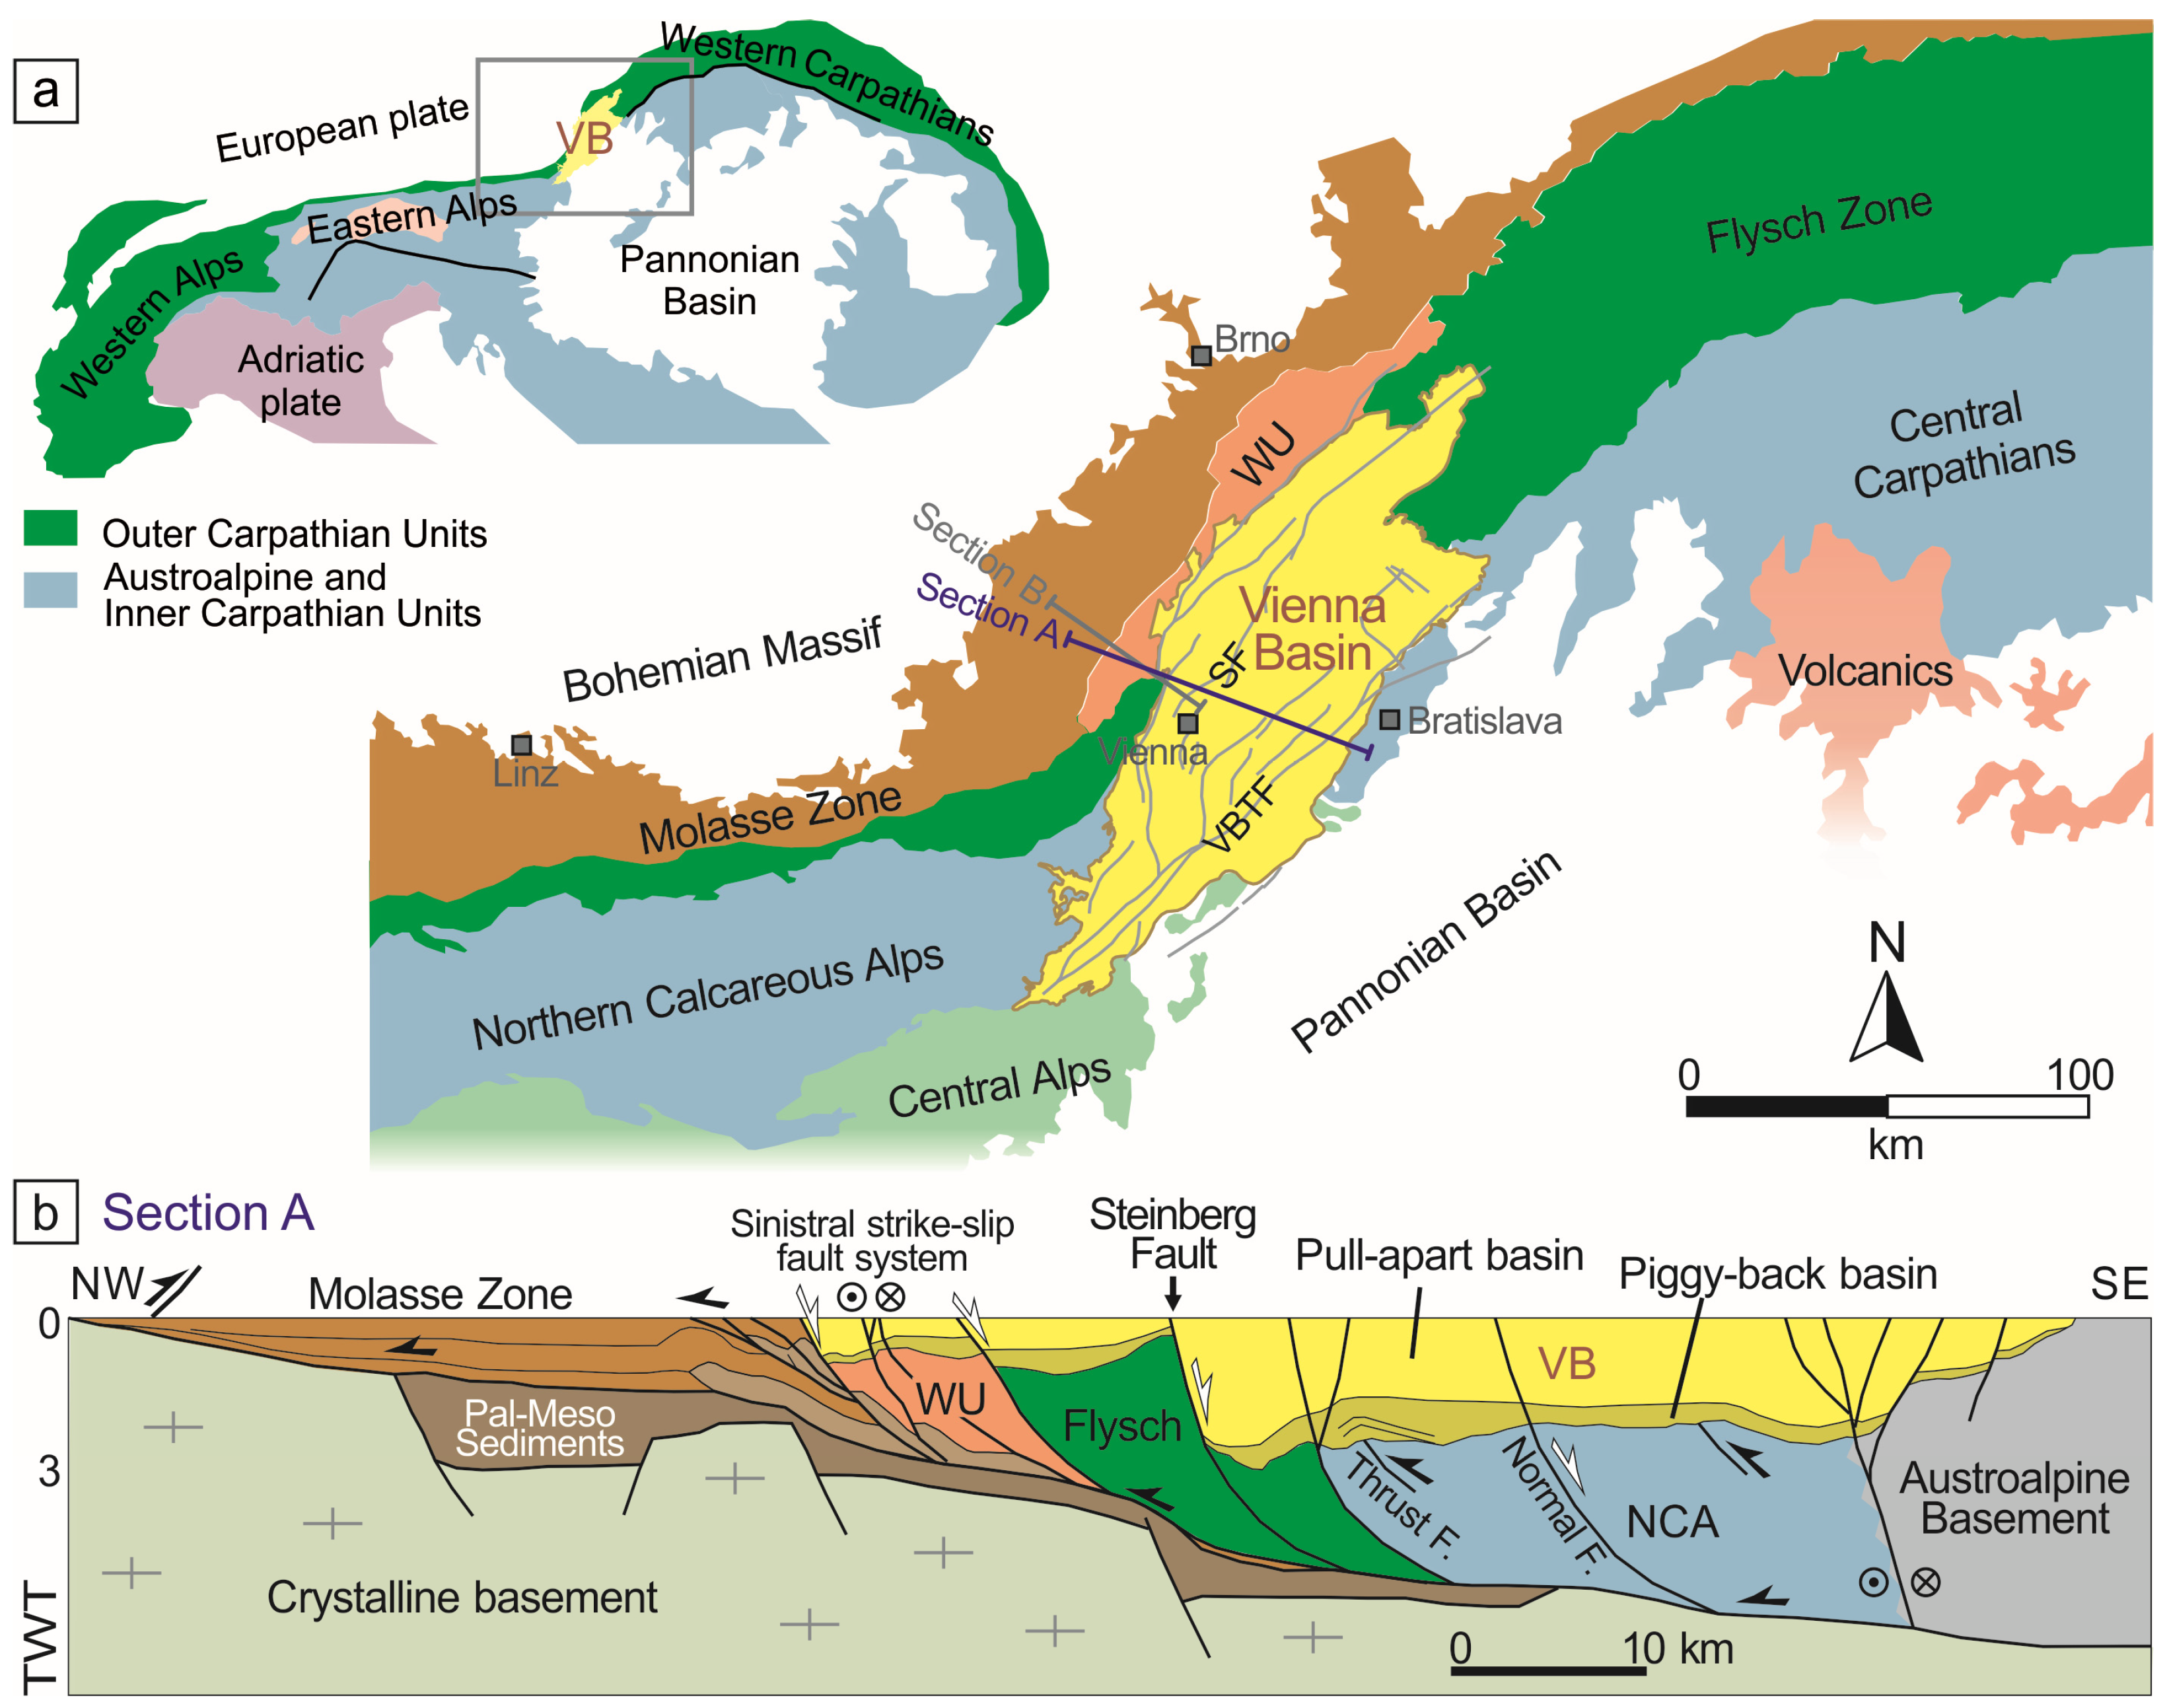
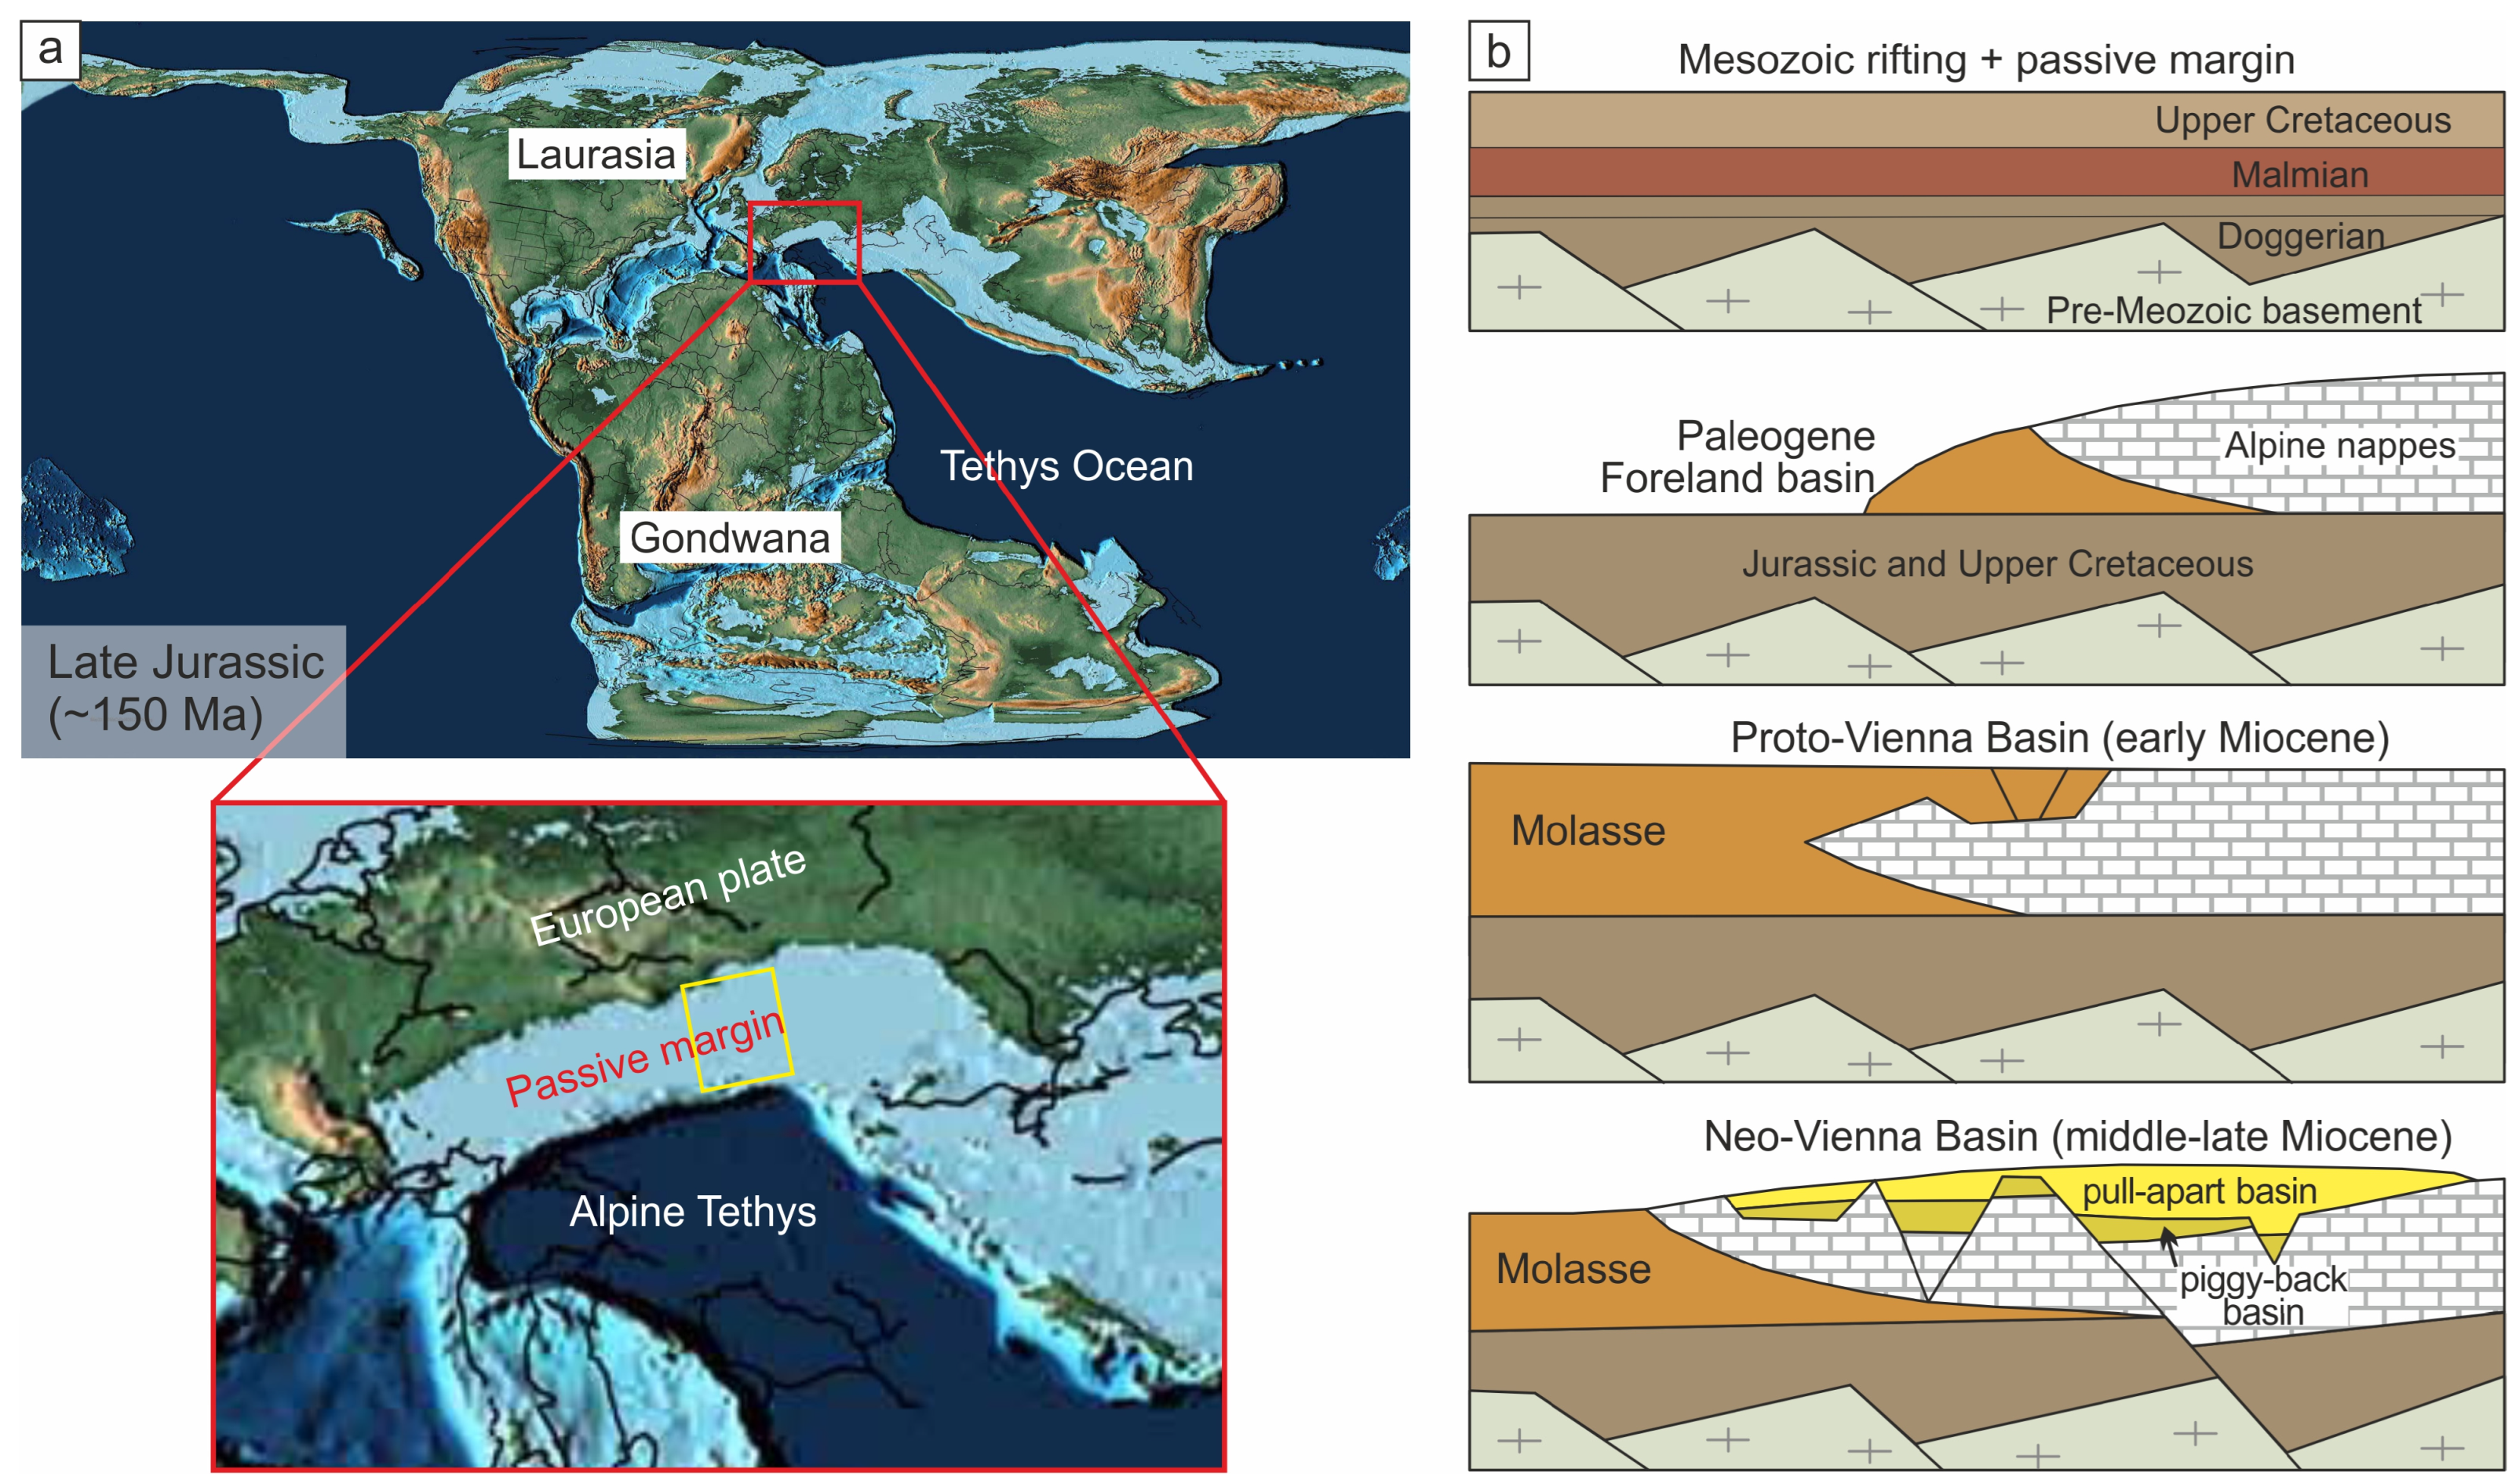
  • Gresten Fm.: The autochthonous Middle Jurassic sediments were deposited in an extensional basin ([17] and references therein), overlying the crystalline basement of the Bohemian massif and Permian sedimentary rocks on the southern edge of the European plate (Figure 2b). Deposited in rifting half-graben structures, the paleowater level experienced significant variations [10,32,46,47,48], leading to the formation of four main subunits (Figure 3); (i) the Lower Quartzarenite Member (Mbr.) comprises fluvial deltaic sandstone, shale, and coal. Locally, the sand layers contain rift-related volcanic rocks. (ii) The marine prodelta shale was deposited as the Lower Shale Mbr. during ongoing rifting and subsequent sea level rise. Similarly, (iii) the Upper Quartzarenite Mbr. consists of deltaic sandstone with shale layers akin to those in the Lower Mbr. (iv) The uppermost subunit, the Upper Shale Mbr., exhibits a similar composition to the Lower Shale Mbr. and was deposited in the Callovian age during ongoing subsidence. Its younger layers have undergone erosion.
  • Höflein Fm. and Vranovich Fm.: Marking the conclusion of the syn-rifting phase, the early post-rift sediments unconformably overlay the Gresten Fm., which were deposited in unstable to stable marine environments [19,46]. The Höflein Fm. (Callovian) comprises dolomitic sandstones. By the Oxfordian age, a uniform carbonate deposition system (Vranovice/Vranovich Fm.), characterized by passive margin dolostones and limestones devoid of clastic input, was established.
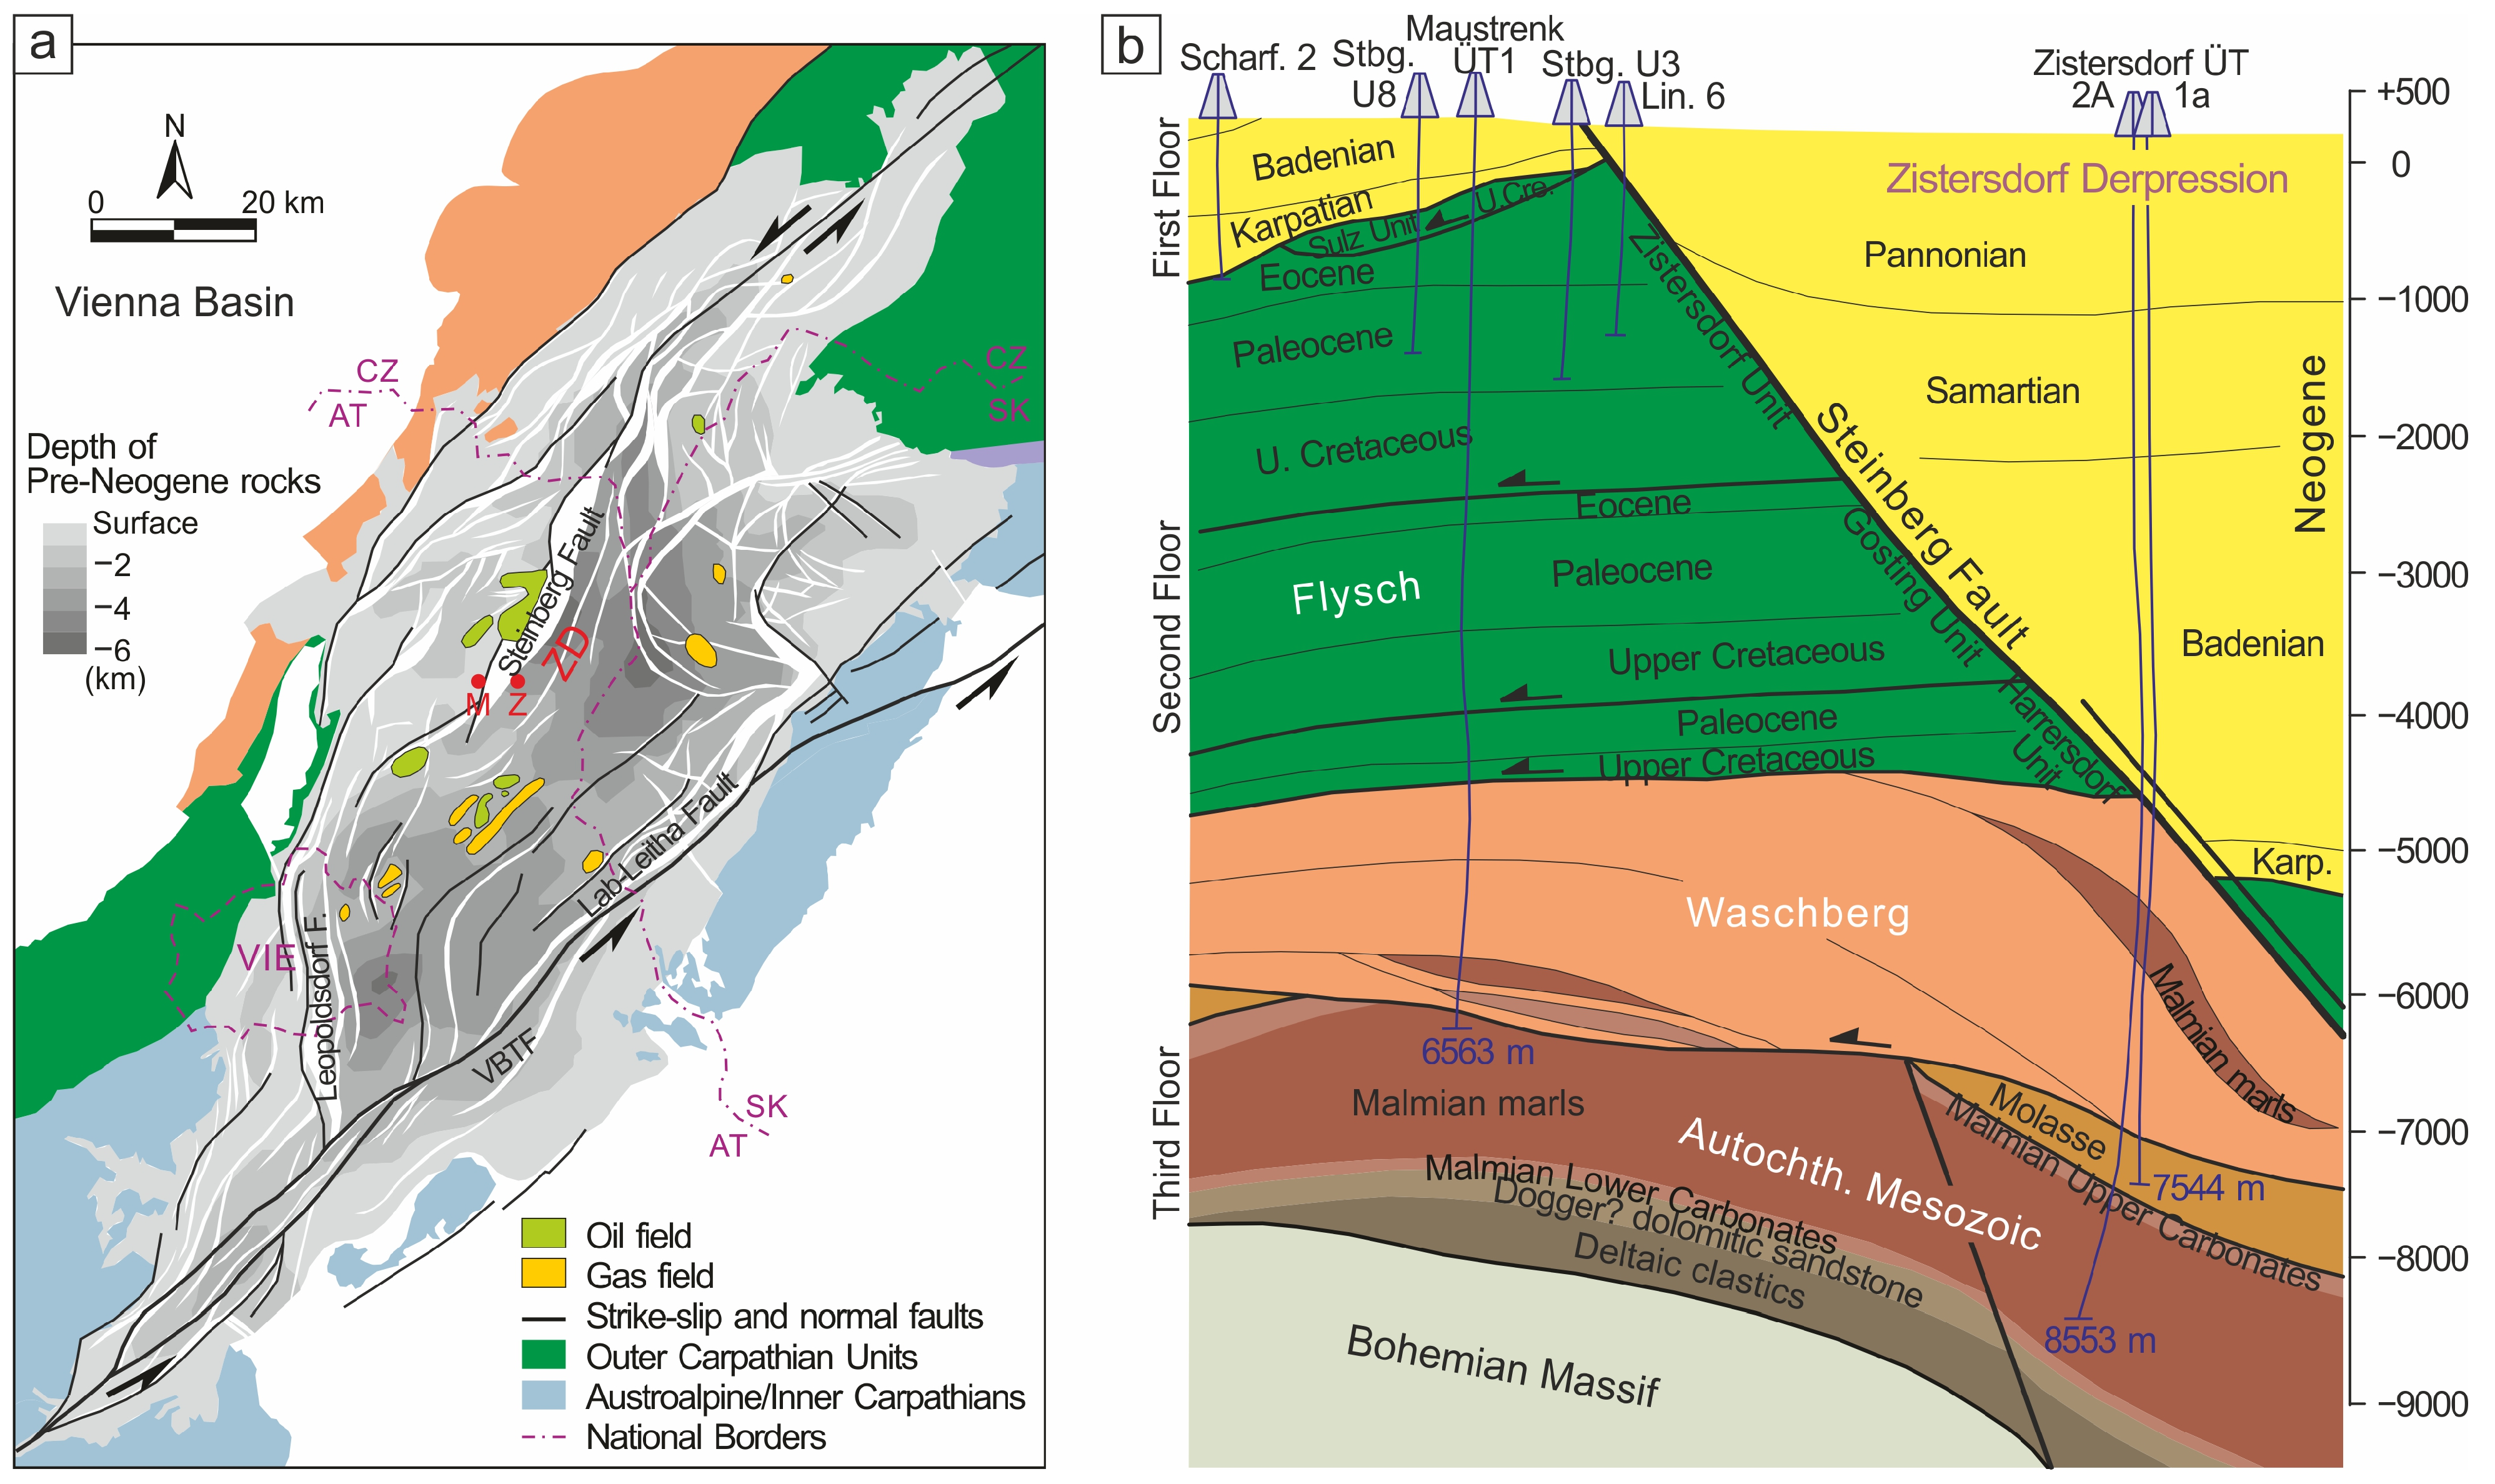
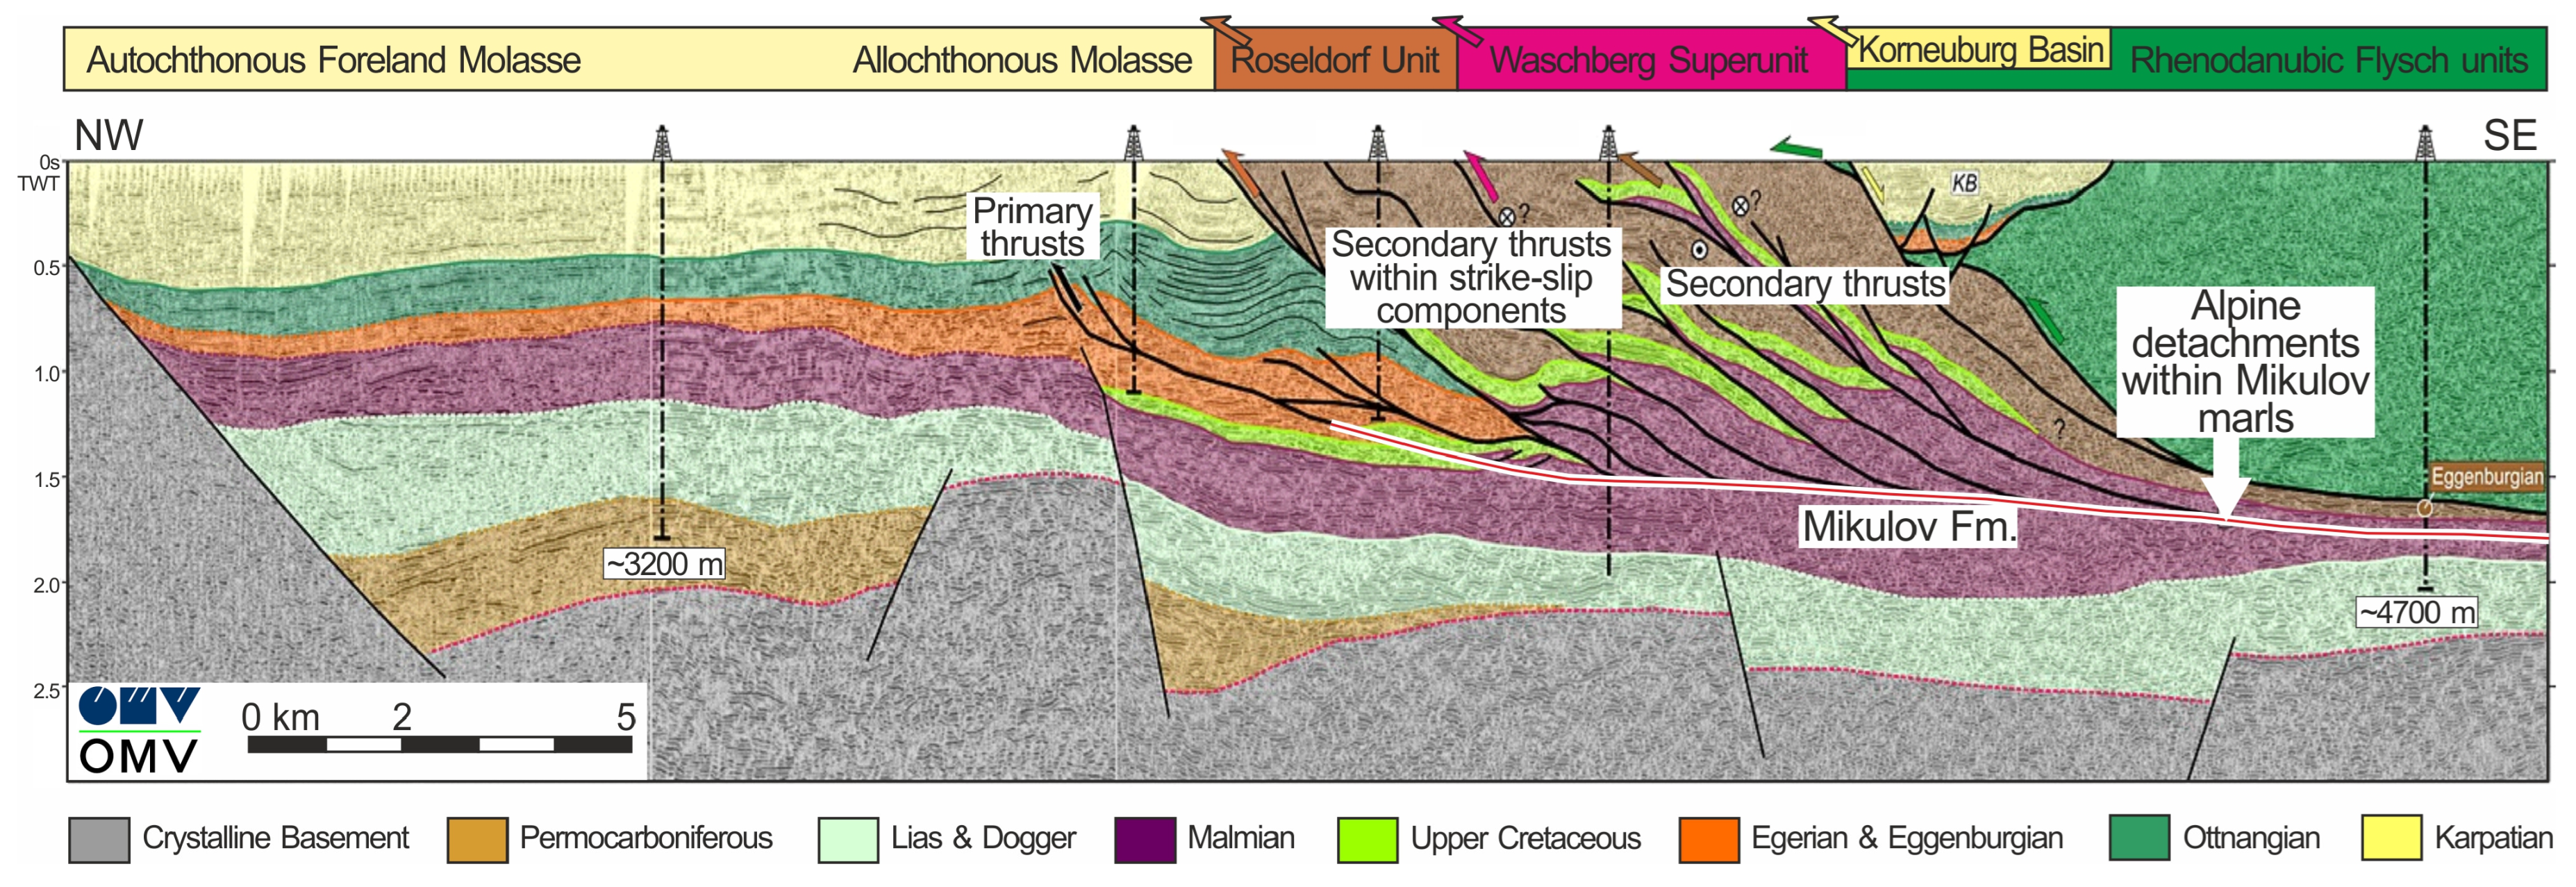
  • Klentnitz Group: The depositional environment underwent differentiation based on variations in basin depth and sedimentation type. In the western parts of the basin, a carbonate ramp formed, where shallow-water carbonates, known as the Altenmarkt Fm., were deposited. The eastern basin parts transitioned into a deeper marine environment, leading to the deposition of the transitional facies of the Falkenstein Fm. and the basinal marlstone of the Mikulov Fm. [14,46]. The transitional zone between the shallow- and deep-water environments represents a slope environment. These three formations constitute the Upper Jurassic Klentnitz Group. The Mikulov and Falkenstein strata are significant source rocks for organic matter, contributing to oil and thermogenic (thermocatalytic) gas generation [13,14]. In the study area, the Mikulov Fm. reaches a thickness up to 1.5 km (Figure 6a). The thickness of the Mikulov layer was tested in several scenarios: 400 m, 1300 m, and 700 m (Table S1). The thickness values were estimated based on data from drilling and seismic profiles reaching the Alpine Tethys-related autochthonous units in the Zistersdorf–Maustrenk area (e.g., [13,19,23]). These thicknesses represent locations on the passive margin stage or vary as a function of the thickness itself. The variations in the thickness of the Mikulov package align with the subsectors of a passive margin, reflecting changes in the depositional setting relative to water depth. The thinnest value represents a shallower depositional environment, while the thickest value represents areas surrounding the depocenter. The Klentnitz Group is discordantly overlain by the sandy dolomitic limestone of the Kurdejov Fm., which transitioned into the oldest Cretaceous limestone(?) of the Ernstbrunn Fm. (Barriasian) (Figure 3). Subsequently, significant regression and erosion affected the strata.
  • Ameis Fm. and Poysdorf Fm.: Sedimentation during the Late Cretaceous period led to the deposition of the Ameis Fm., comprising sand and marlstone, and the Poysdorf Fm., comprising shale and marlstone [46]. According to [17], the Upper Jurassic carbonates and marls are overlain by glauconitic Upper Cretaceous sandstone, with thicknesses reaching up to 900 m [73].
  • Waschberg Zone: The Waschberg deformation event, spanning the Paleocene to Oligocene, contributed to the interruption and subsequent formation of the Molasse Basin and other geological structures (e.g., [12]).
  • Miocene Vienna Basin: The complex Miocene deposits formed in the piggy-back and pull-apart basin systems, resulting in a bulk sedimentary pile with a thickness of 4500 m (e.g., [11,25,26]).
  • Quaternary: The Quaternary deposits have a max. thickness of 50 m.
Except for a few instances, the erosional events spanning the Mesozoic to the Neogene have more precise constraints [33,73]. Our study attempted to approximate and minimize the erosion effect using the following estimates. These estimations primarily rely on the extent of each particular event (Figure 3; Table S1): an eroded thickness of (i) 1500 m from 340 Ma to 174 Ma, (ii) 200 m from 165 Ma to164 Ma, (iii) 200 m from 139 Ma to 93.9 Ma, and (iv) 200 m from 9 Ma to 3 Ma. The late Oligocene event marks the primary shortening stage and the formation of the crustal hanging wall [19].
To ensure the best fit with the actual events of the Alpine Tethys, the rifting peak was designated at 150 Ma. This modeling approach requires boundary conditions, including heat flow, surface temperature, Sediment–Water-Interface Temperature (SWIT), and paleowater depth (PWD), which we approximated based on literature data (Figure 7).
During the Jurassic period, the sea level curves generally indicated lower levels [74], while the SWIT was established for southern Europe using software (e.g., [75]; Figure 7c). The PWD was determined from literature sources and shallow-water half-graben data (Figure 7d). Maturity serves as an essential calibration parameter, particularly in reconstructing complex basin histories [63,64]. However, in our modeling of subsidence rate, thickness took precedence over maturity, with vitrinite trend acting as a secondary parameter. Vitrinite reflectance data from deep wells showed a linear trend from 1.46%Ro at 5600 m to 2.53%Ro at 8500 m (Table A2). Although there is a data gap between 4500 and 5600 m depth, the presented and calculated parameters align with the position of the oil window (4000–6000 m), as reported in [17] (Tmax and biomarker data are provided in Table A1 and Table A2).
Figure 7. Boundary conditions for our models in PetroMod. (a) Standard heat flow values following the syn-rift stage based on the McKenzie model [39], with an approximate value of 120 mW/m2 from 190 Ma to 170 Ma. (b) Mean surface temperature, providing constraints on the temperatures at the bottom of the basin in southern Europe, based on data from [75]. (c) Sediment–Water-Interface Temperature (SWIT) setting for southern Europe. (d) Paleowater depth (PWD) trends.
Geosciences 14 00202 g007

4. Results

The results of the 1D numerical modeling for the three different thickness inputs provided the following parameters for the Upper Jurassic Mikulov Fm.:
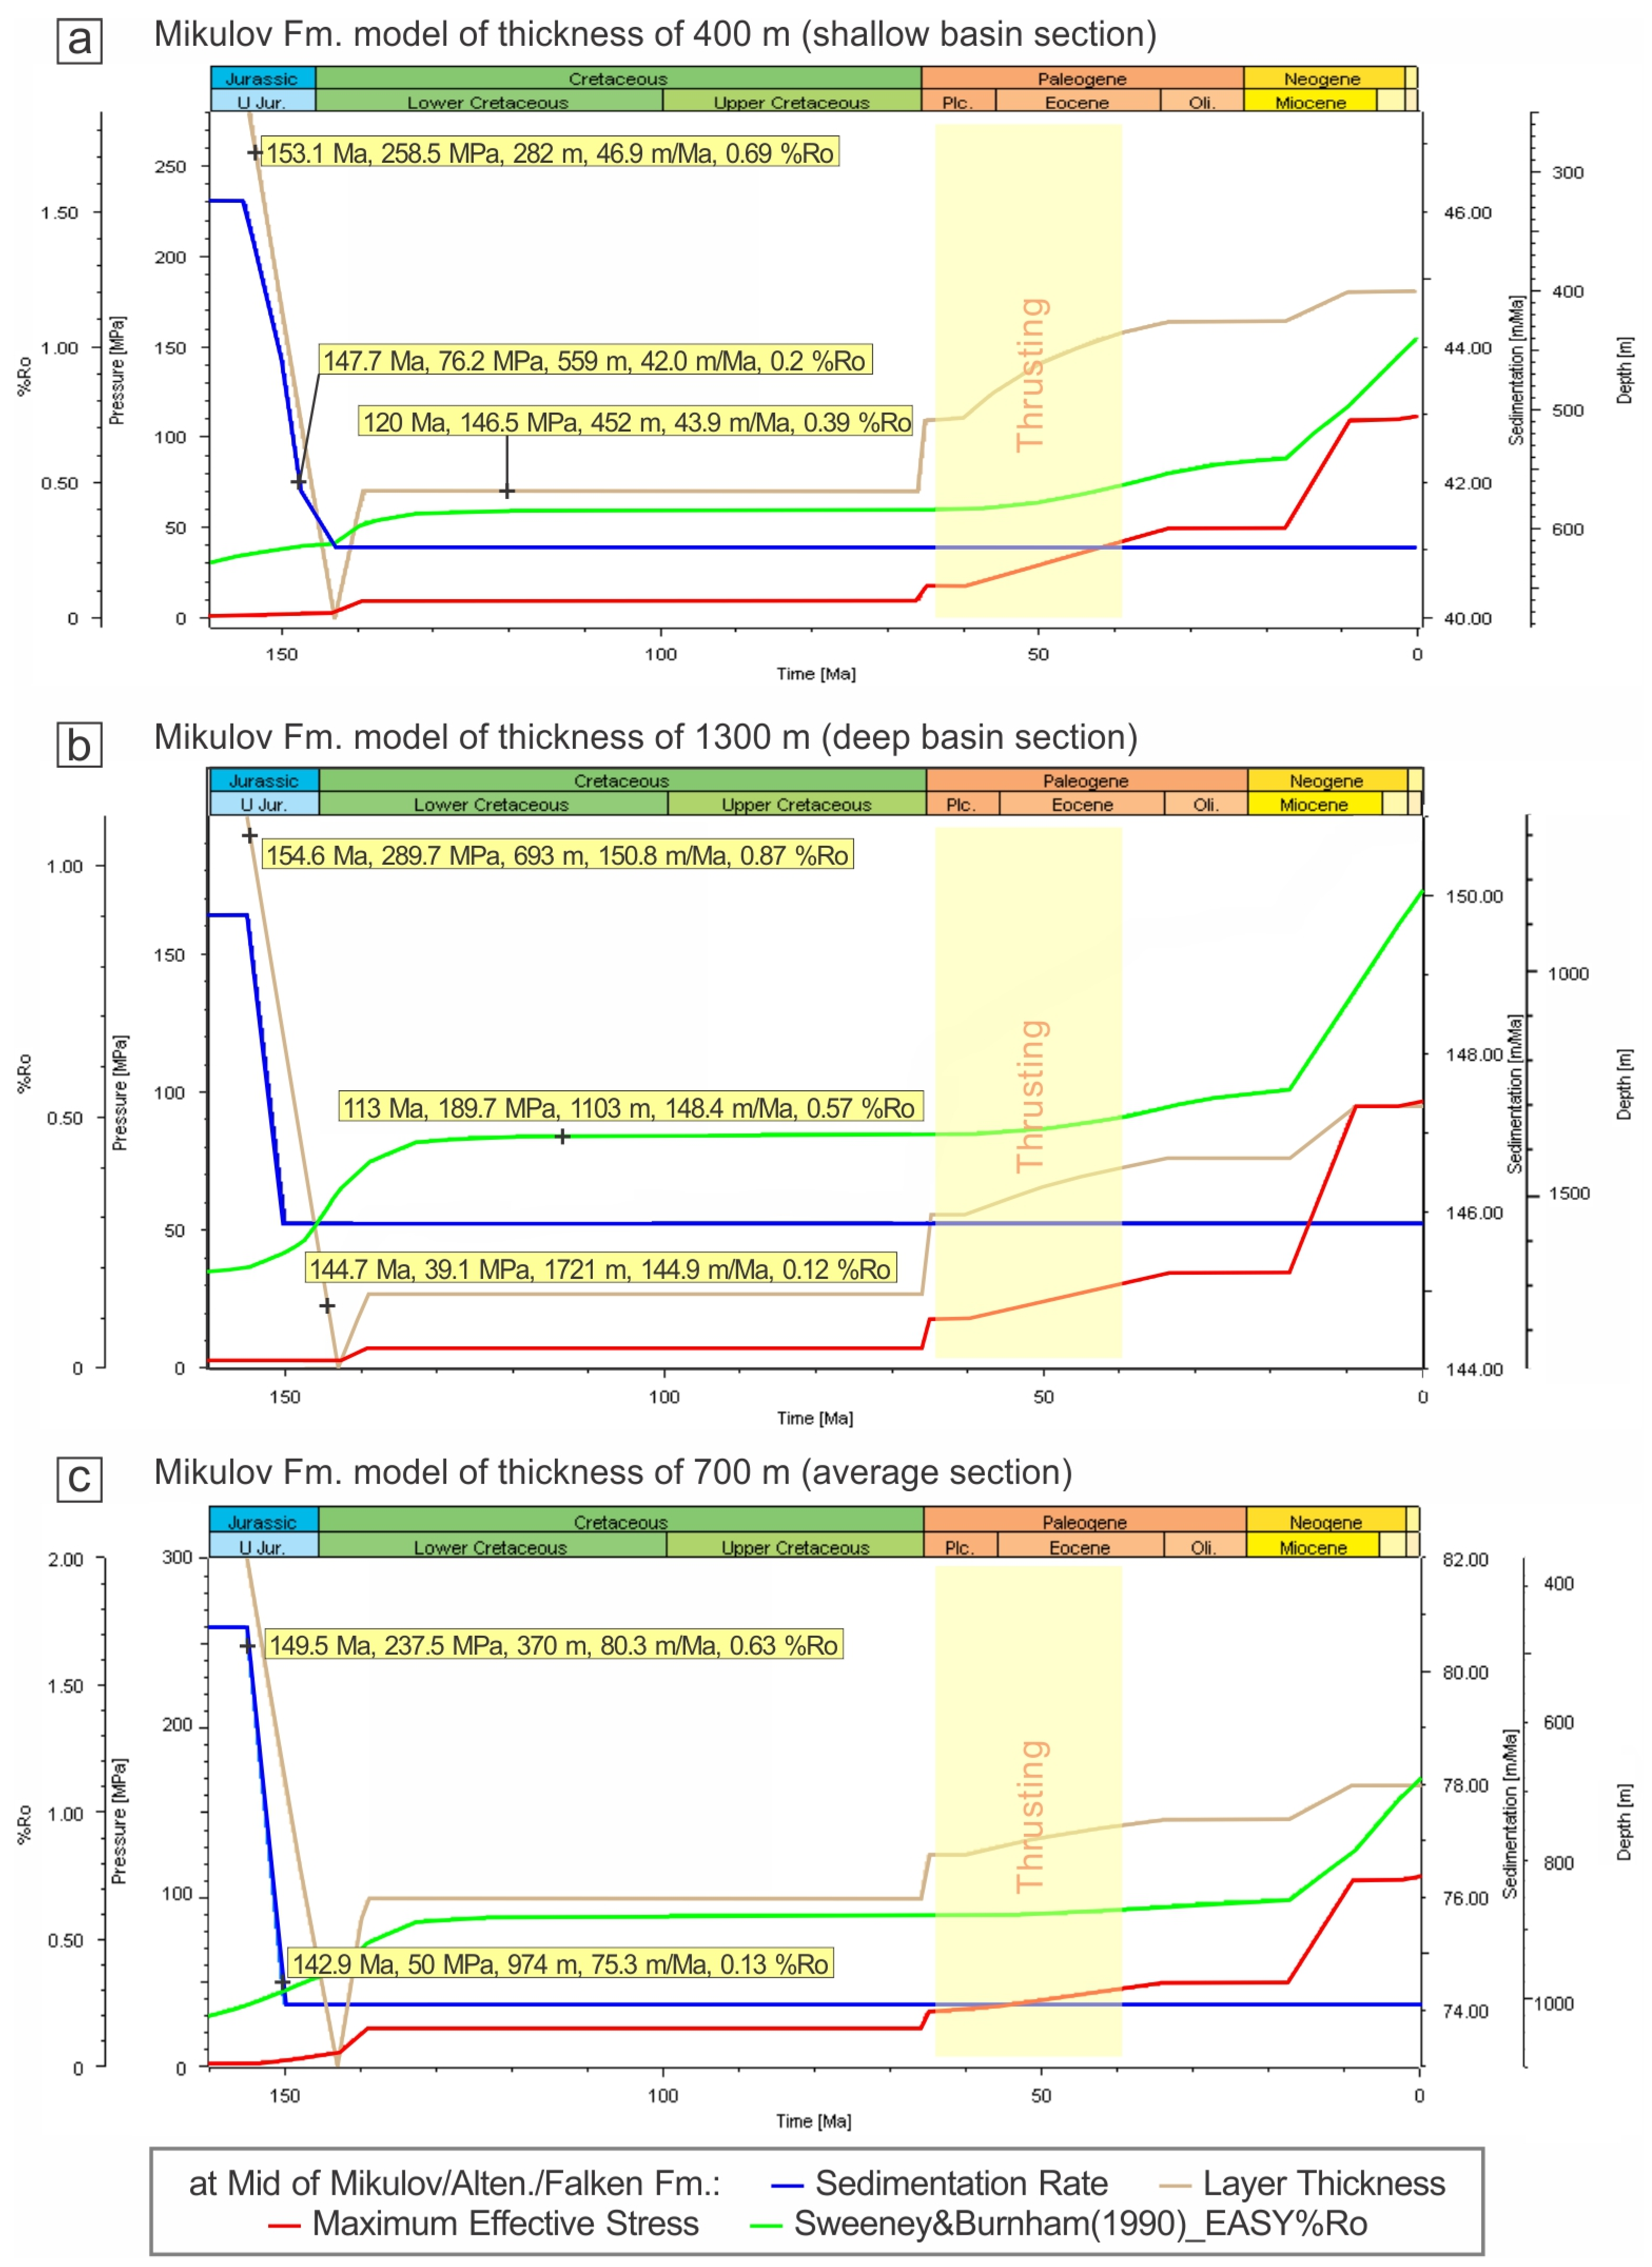
  • Computed sedimentation rates during the syn-rift stage averaged around 200 m/Ma (Figure 8), which is lower compared to peri-Pannonian Neogene basins (e.g., [67]). For the Mikulov Fm., these rates were evaluated across different thicknesses as the primary input, characterizing shallow, moderate, and deeper depositional settings of the Upper Jurassic Alpine Tethys. With a present-day thickness of 400 m, the sedimentation rate was approximately 48 m/Ma, significantly slower than during the syn-rift phase, particularly in the Upper Quartzite Mbr. interval (Figure 8a). For a thickness of 1300 m, the sedimentation rate increased to approximately 120 m/Ma (Figure 8b). An intermediate thickness of 700 m resulted in a sedimentation rate of around 43 m/Ma. These findings illustrate the variability in sedimentation rates relative to different depositional settings and thickness inputs, providing a framework for understanding the subsidence history over time;
  • The overlapping time diagrams exhibit extracted data from the Mikulov Fm. for the time frame spanning from the Jurassic to the present day (Figure 9). Among a number of computed parameters, we focused on parameters such as maximum effective stress, layer thickness over time, sedimentation rate, and EASY%Ro of the Mikulov Fm. (e.g., [76]). The results indicate that the maximum effective stress increases immediately once the sedimentation ceases and compaction begins due to overburden accumulation. The sedimentation rates during the Upper Jurassic varies among the models, which were approximately 46 m/Ma, 150 m/Ma, and 80 m/Ma, respectively (Figure 9). The initial layer thicknesses for the same time slice ranged from 280 to 690 m. These data show relatively low thermal maturation at the onset of subsequent subsidence, highlighting the impact of compaction and sedimentation rates on the thermal history of the formation;
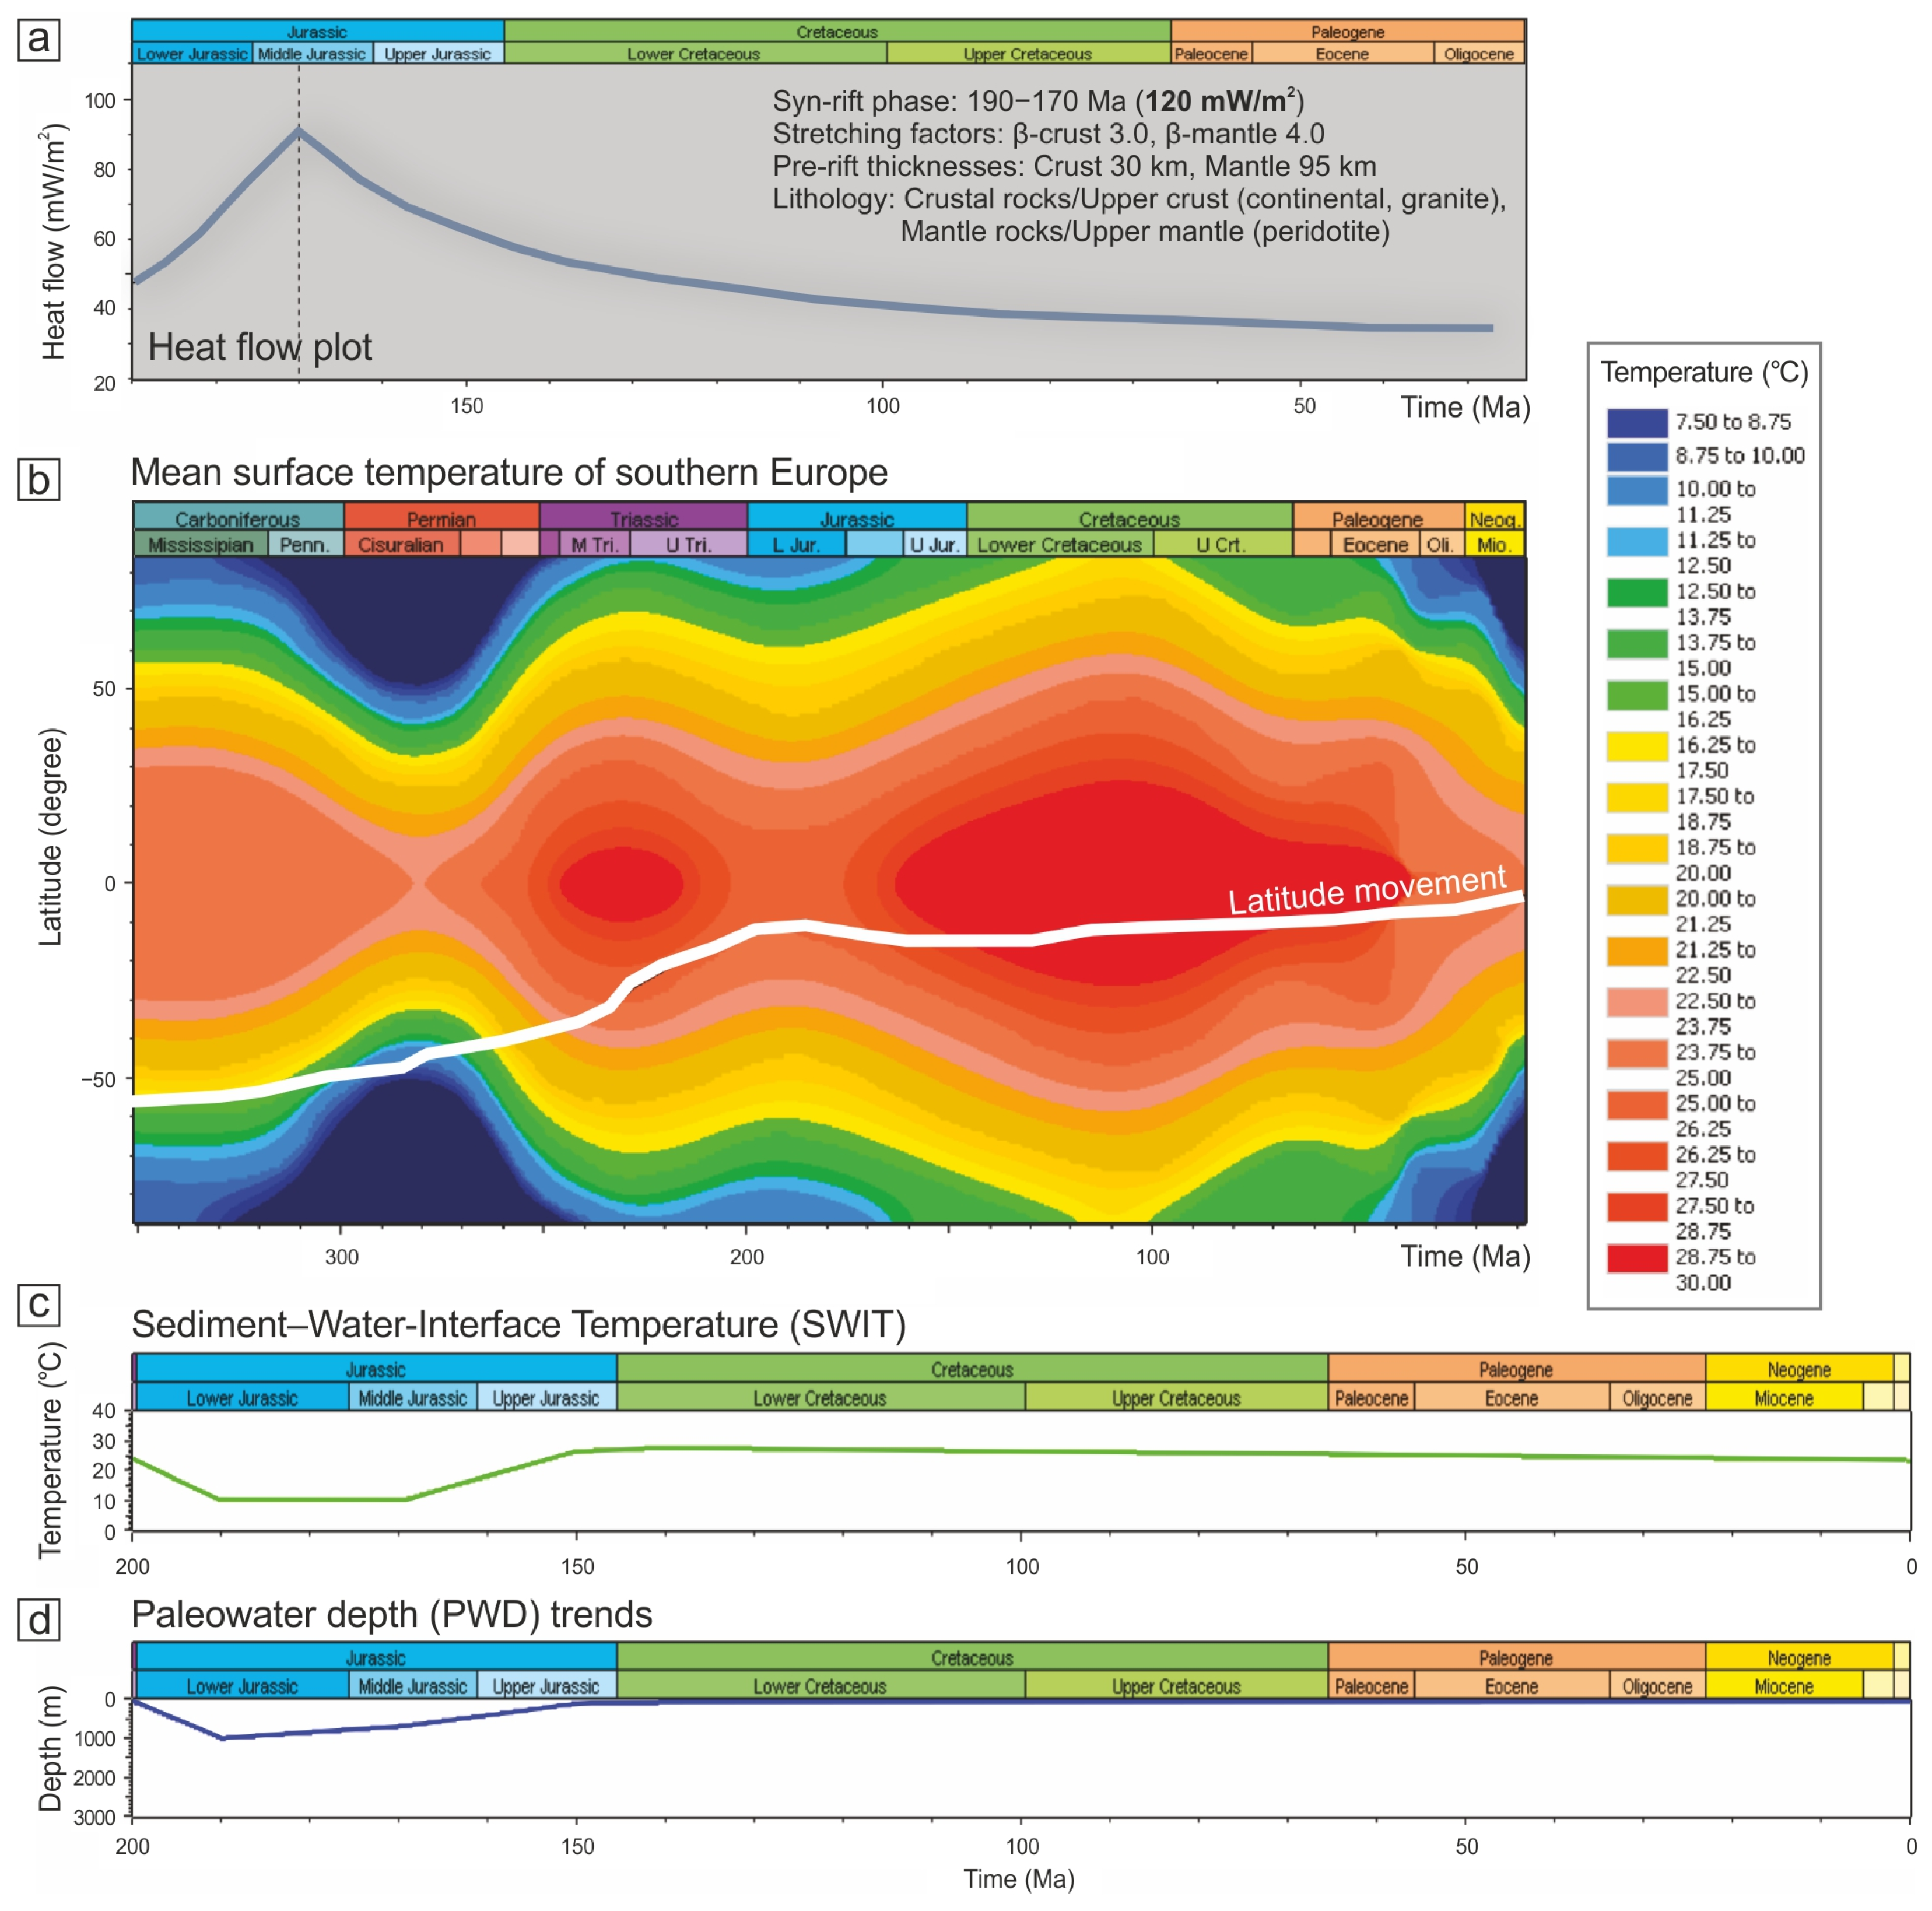
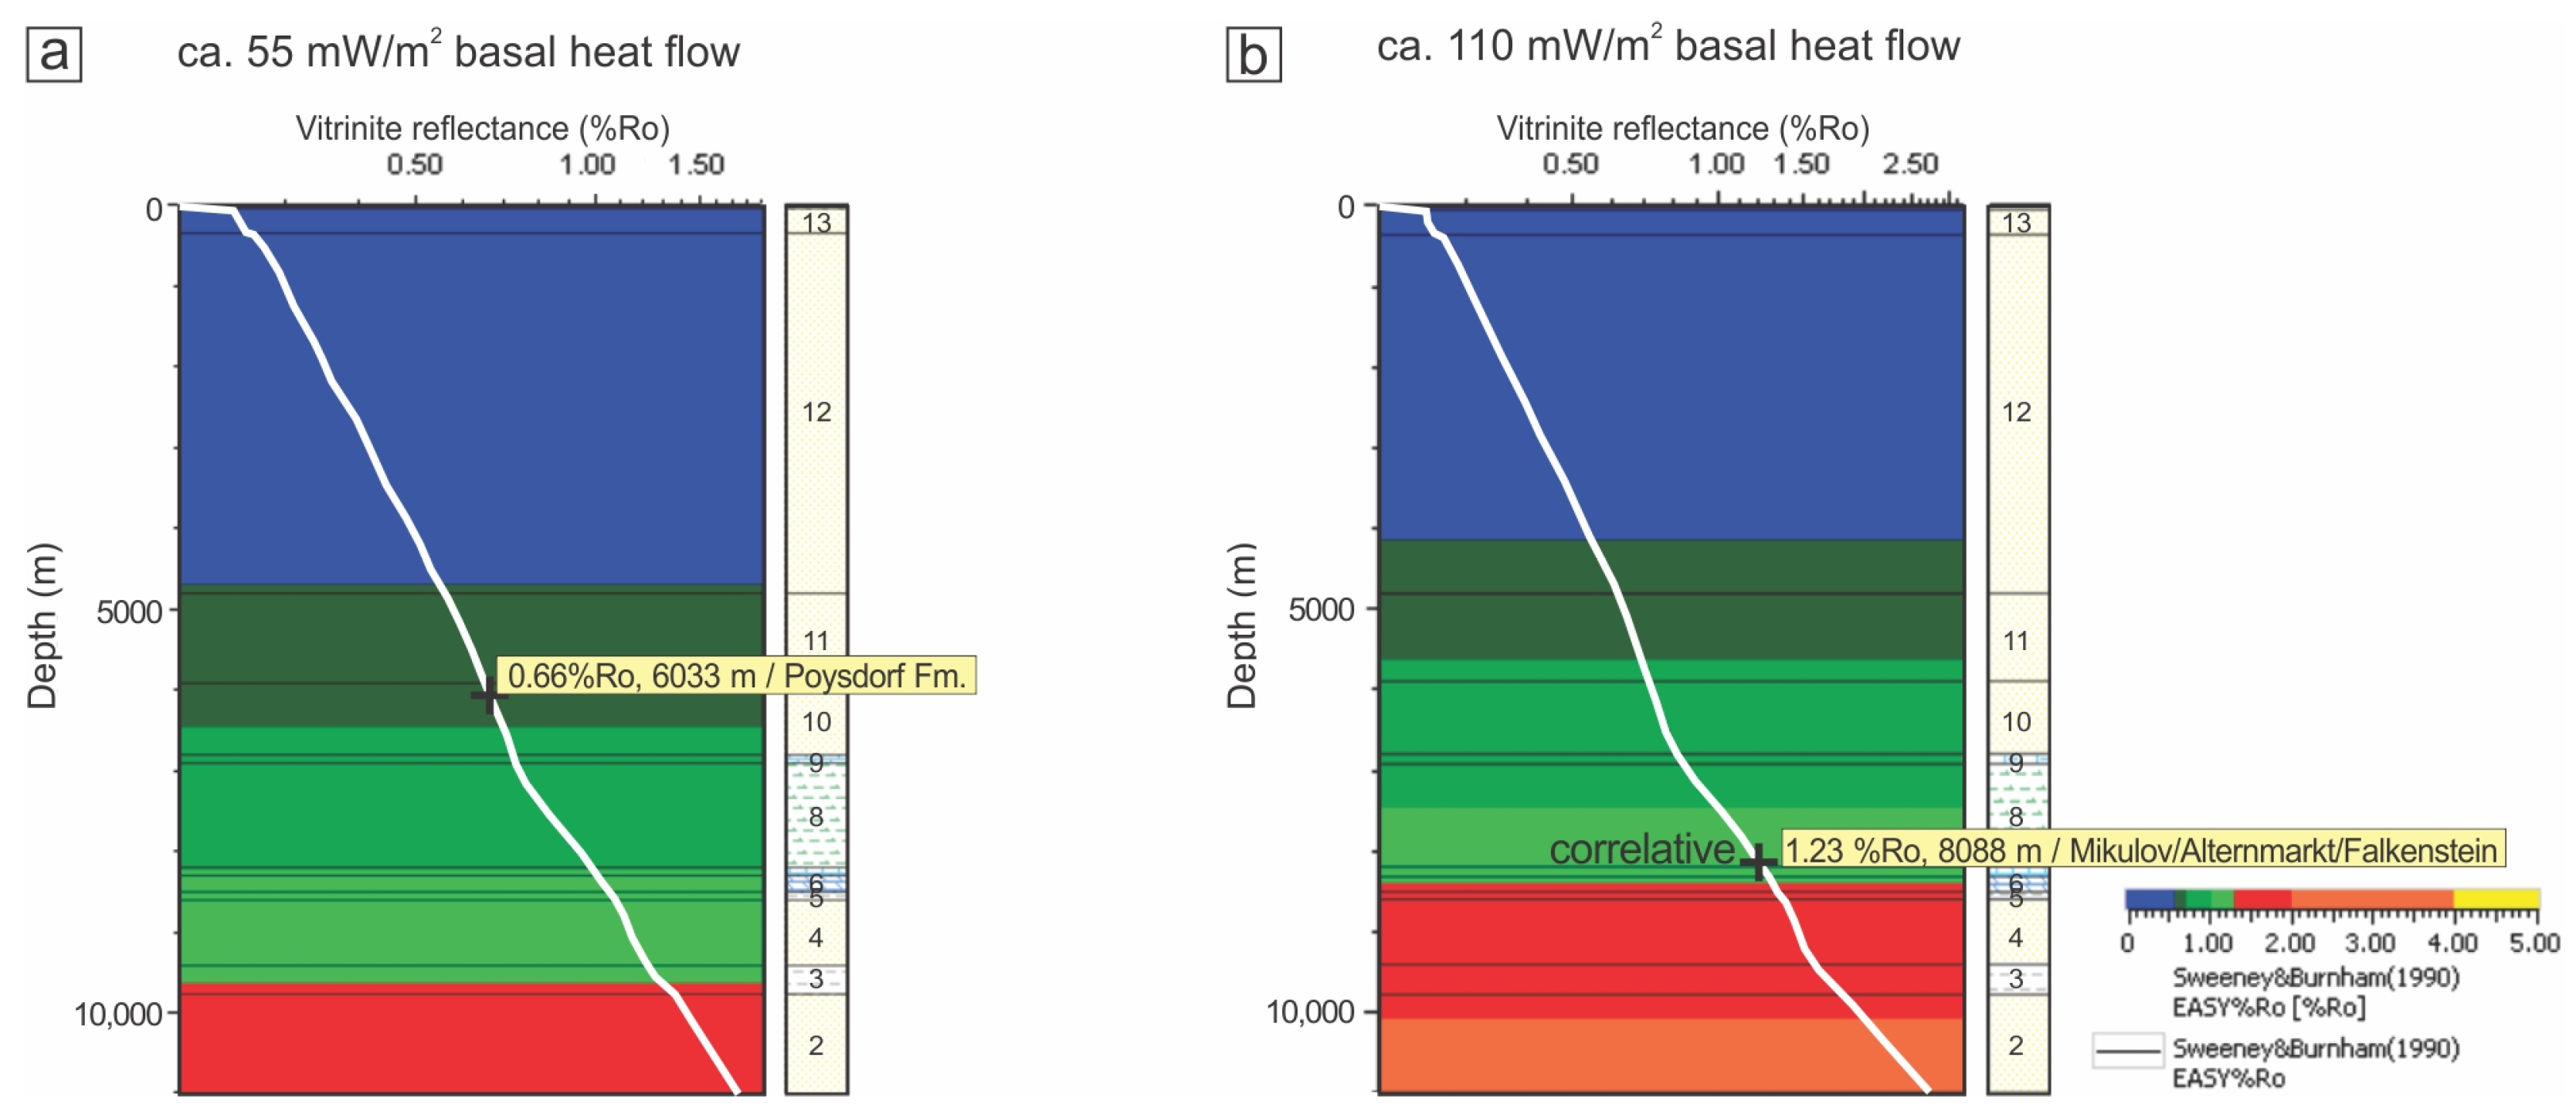
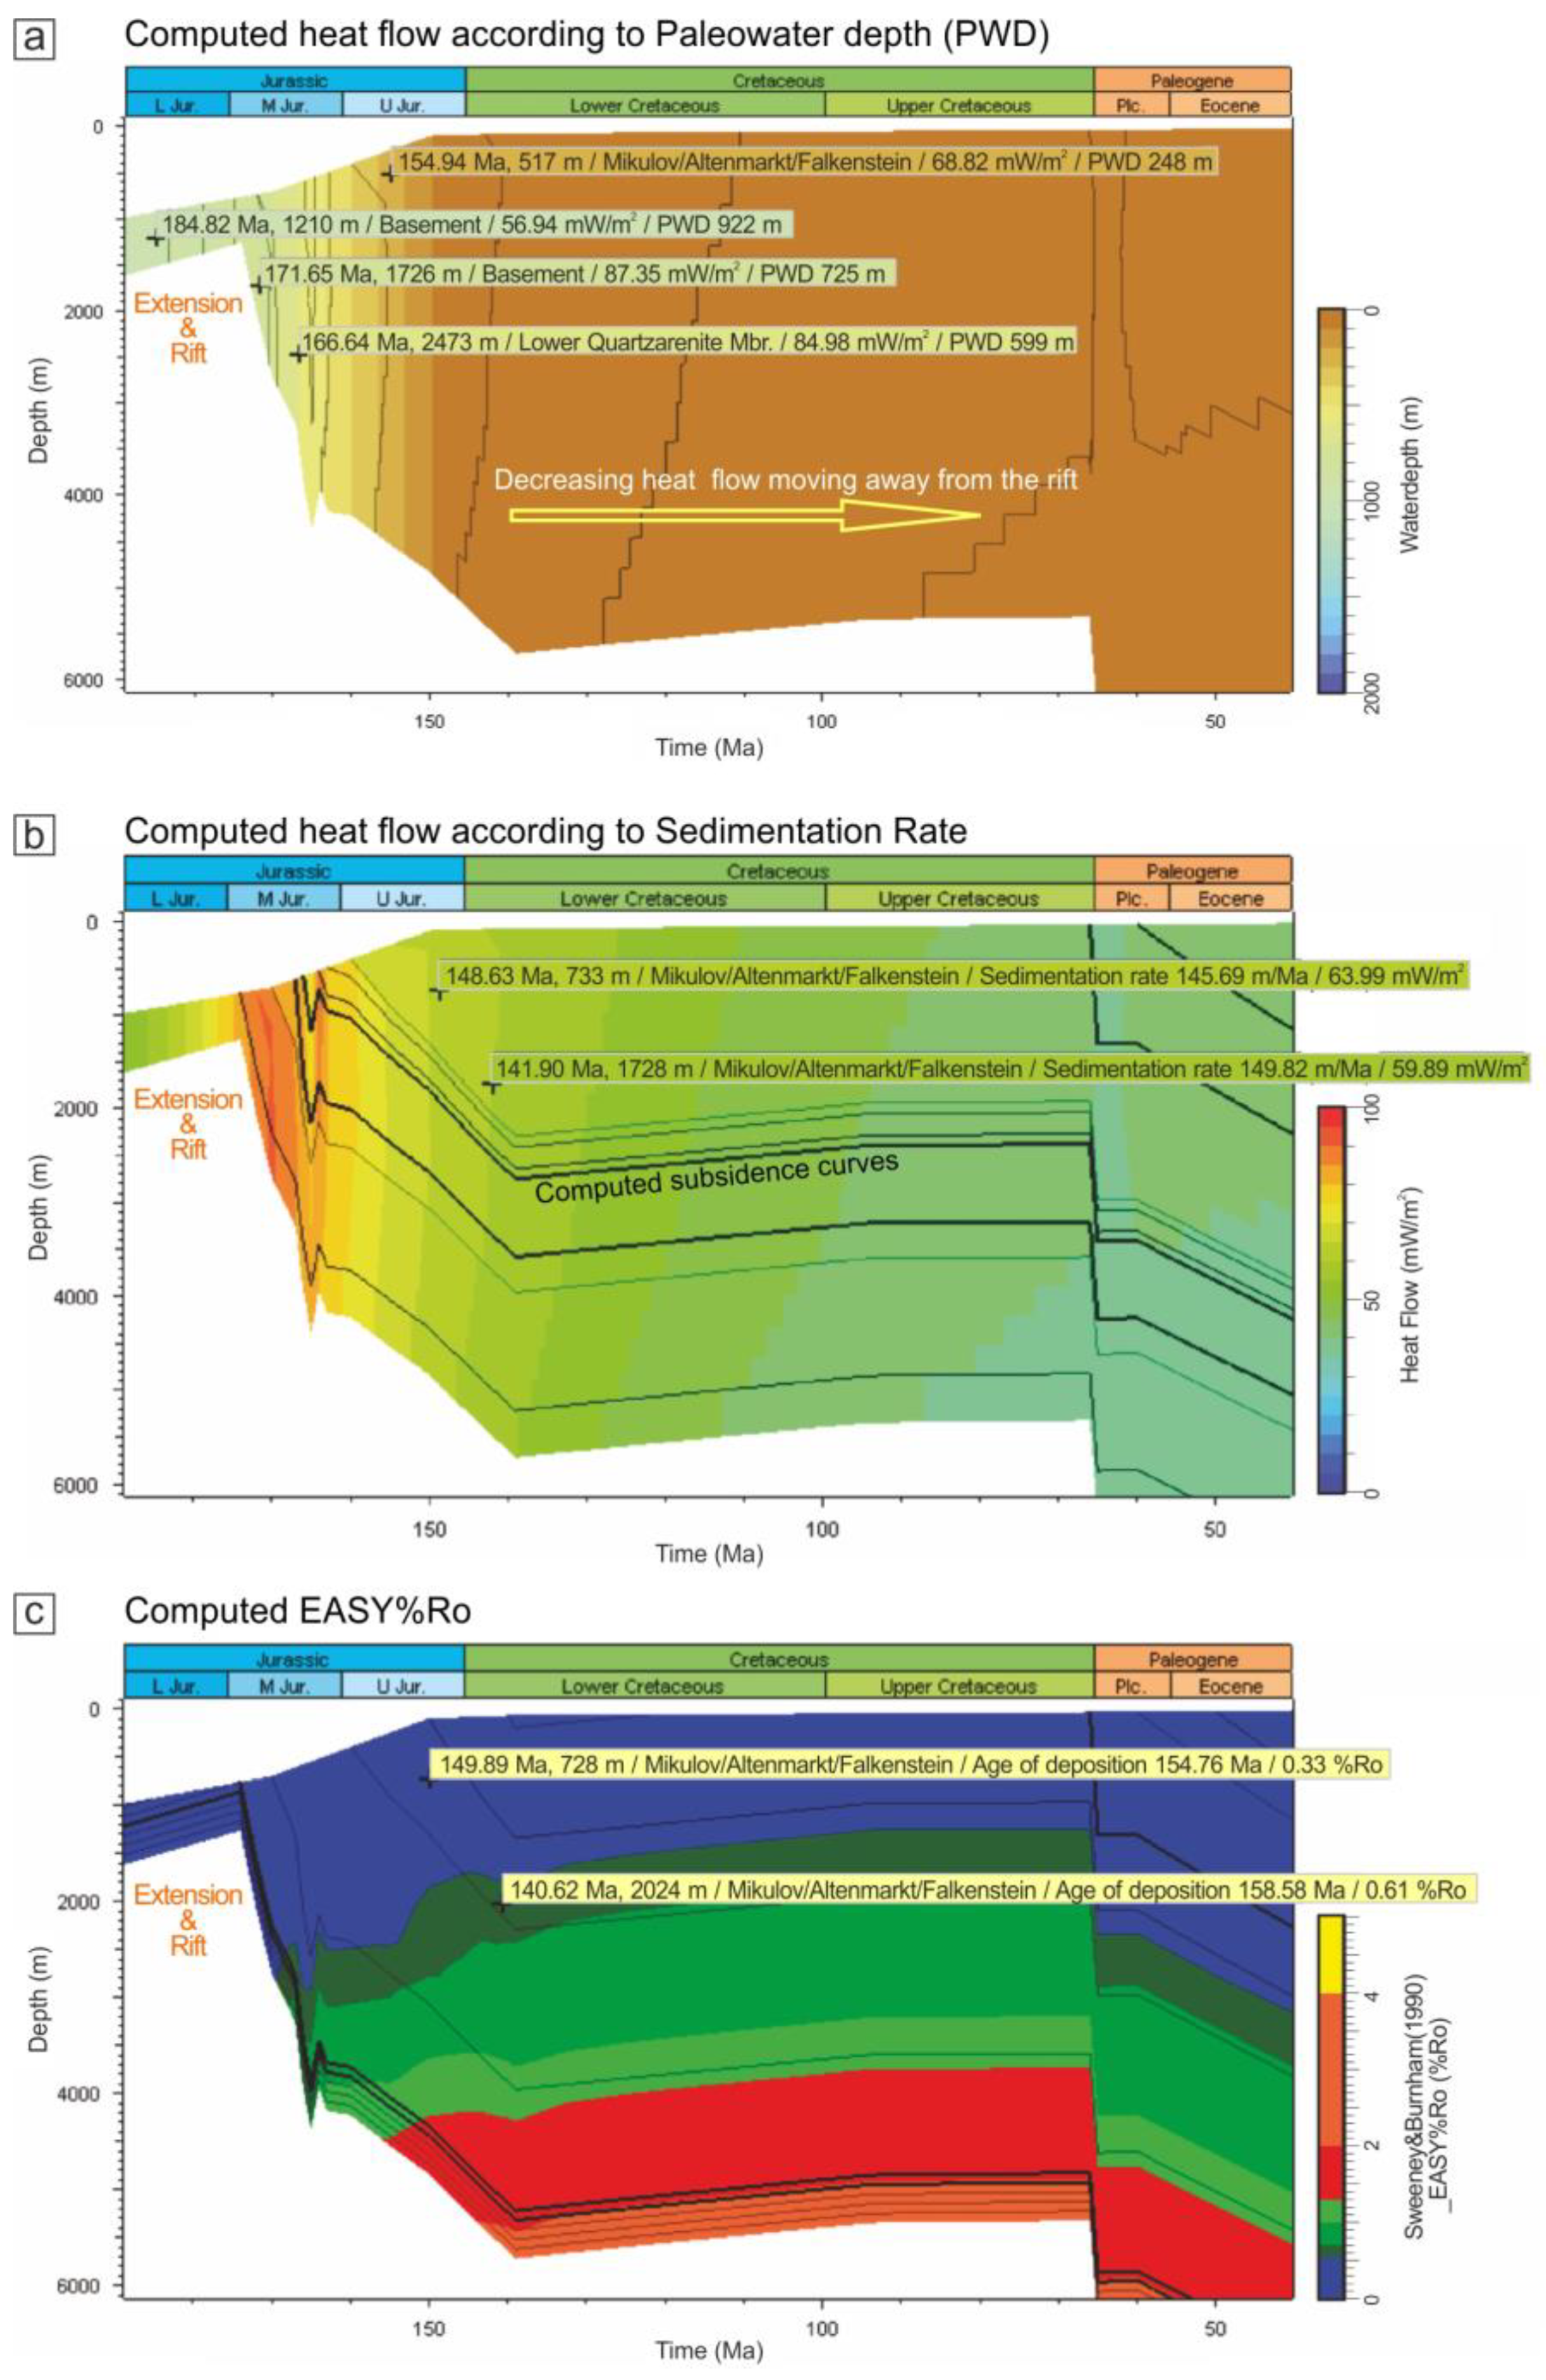
  • The computed time-depth models spanning the Lower Jurassic to the Eocene revealed significant differences between the syn-rift and post-rift stages. The models are (Figure 10) (a) computed subsurface heat flow distribution with PWD, (b) computed heat flow with sedimentation rate and subsidence depths, and (c) computed thermal maturity according to EASY%Ro. The numerical output data provide constraints on both the syn-rift formations (notably, the Upper Shale Mbr.) and the post-rift formations (notably, the Mikulov Fm.). The input heat flow values show a significant decline after the typical syn-rift phase with 120 mW/m2, reflected in the computed time-based EASY%Ro values (Figure 9). The thermal point-based maturation time plot (Figure 10) was given by applying the EASY%Ro equation (e.g., [76]). The thermal maturity data align with the calibration data, suggesting that the oil window is between 4000 and 6000 m (extending further in depth).

5. Discussion

5.1. Crustal Mechanisms and Oceanic Opening

The resulting sedimentation rates distinguish between the rapid syn-rift (over 200 m/Ma) tectonic subsidence stage and the significantly slower post-rift (thermal) subsidence stage (Figure 8). The transition can correspond to the rift-to-drift phase of the central Alpine Tethys margin, reflecting the typical oceanic opening and differential sedimentary loading driven by the intricate crustal stretching processes. This substantial difference may also be attributed to regional settings. For instance, a recent subsidence analysis study for several Triassic carbonate platforms in the nearby eastern Northern Calcareous Alps showed that salt expulsion controlled the formation of thick (ca. 1.5 km deep) and isolated depocenters [38]. These subsiding localized depocenters likely grew at rates faster than the accommodation space created by tectonic subsidence. We propose that the thick-skinned extension controlling accommodation space model is not applicable in this case. Instead, a high rate of crustal down-lifting devoid of any mantle-driven stretching seems to be an essential factor capable of producing such deep basins in the continental crust. Such landlocked, water-loaded basins ranging from 1 to 3 km in depth formed in cratonic regions over a few million years, potentially driven by a gabbro-eclogite transformation in the basaltic layer (e.g., [36]). A similar phenomenon of strong early basin subsidence without significant fault involvement (no crustal stretching) was reported in the nearby central parts of the Southern Alps (Lombardian Basin) [37]. Strongly perturbed thermal conditions followed the process of the Triassic basin opening. Accordingly, the perturbed upper-crustal geotherms associated with the Middle–Late Triassic for tens of millions of years were crucial crustal drivers for the onset of extension in the South Alpine realm. The entire oceanic basin had already relaxed by the Mid-Jurassic period and remained stable until the Late Cretaceous onset of Alpine shortening. During lithospheric cooling, rock densities increase, affecting the observed subsidence before and during rifting. Such observations align with the proposed crustal down-warping caused by gravity-driven gabbro-eclogite transformations [36]. The cold lithosphere down-warping might affect short-term but rapid subsidence, consistent with the crustal separation and syn-rifting in the mid-Jurassic period, and the deposition of relatively thin successions of deep-water sediments. Thus, the thermal assessment of the southern Alpine crust suggests cooling during the rifting or “cold syn-rifting stage” with heat flow values below 60 mW/m2 [37].
However, numerical testing of these atypical crustal behaviors by assigning different basal heat flows for the initial syn-rift values yielded ambiguous data. In the first scenario, assigning basal heat flow values lower than average for the syn-rift stage resulted in a computed vitrinite reflectance that was inconsistent with both shallower and deeper trends (relative to the trend in Figure 6a and Figure 11). When a basal heat flow value of 110 mW/m2 was assigned, which is still less than the proposed 120 mW/m2, consistency with well data vitrinite trends was observed at deeper Mesozoic levels. However, the lower vitrinite reflectance values in the upper section (post-Jurassic) still require further fine-tuning and calibration.

5.2. Mikulov Fm.: Tracing the Early Evolution of the Alpine Tethys Passive Margin

Passive margin sedimentation forms critical stratigraphic records shaped by rift, drift, and collisional processes [77,78]. However, one often overlooked aspect of passive margins is their potential role in marking the rift-to-drift transition. In the context of the Alpine Tethys, its rifting is likely influenced by the opening of the Atlantic Ocean [3,37]. Additionally, the formation of widespread oceanic basins aligned with the opening of the northwestern NeoTethys Vardar Ocean, which spread across the western Balkan Peninsula (e.g., [53]). To understand these early stages better, examining the variations in sedimentation rates through scenario modeling can provide valuable insights. Such modeling allows for a clear distinction between syn-rift and post-rift stages, as illustrated in Figure 9 and Figure 10.
Regarding the depositional setting of the Mikulov Fm., several authors have pro-posed a scenario involving presumed coastal Upper Jurassic upwelling [13,79,80]. This hypothesis aligns with higher bioproductivity rates and oxygen-depleted conditions below the photic zone. The elevated organic matter content underwent an early transformation from approximately 0.40 to 0.57% EasyRo (Figure 9). This observation is consistent with pristane/phytane (Pr/Ph) ratios slightly above 1, indicating suitable suboxic conditions. Remnants of sessile fossils confined to the pore space corroborate the anoxic conditions [13]. Moreover, the layer’s TOC contents and hydrogen indices (HIs) were diminished, while clay minerals (illite and kaolinite) were abundant. Diagenesis led to cement formation and the development of various smaller pores [14]. Distal depositional settings revealed a basinward increase in organic matter content. The Falkenstein and Mikulov strata exhibited a Tmax of 431 °C, signifying the immaturity of the organic matter. Consistent with this immaturity, relatively high HI values (300–400 mgHC/gTOC) were recorded in lateral analogs of the Falkenstein Fm. (extracted from boreholes Waschberg 1, Wildendürnbach K4, and Falkenstein 1; Table A1). Similar results were obtained in the 1D models despite the tested variations in Mikulov thickness (Figure 9). These attributes could be related to a lower syn-rift heat flow, i.e., suggesting a cold opening of the continental lithosphere. Nevertheless, the modeling results of a typical syn-rift basal heat flow of 120 mW/m2 indicated that the oil widow could be expected in the deepest segment of the Mikulov Fm., reaching a computed 0.6–0.7% EasyRo (Figure 10 and Figure 11c).
The computed lower-grade thermal maturation aligns with the significantly reduced HI values collected from deeper levels (0–170 mgHC/gTOC; wells Aderklaa UT1, Maustrenk ÜT1a, Zistersdorf ÜT1/2a) (Table A1). The 1D modeling results showed relatively slow computed sedimentation rates for different thicknesses of the Mikulov layers’ shallow and deeper levels (Figure 8). Whether determined by location during the passive margin stage and/or as a function of the thickness itself, the 1D modeling results showed different values of sedimentation rates, potentially associated with subsidence rates. The sedimentation rates in the scenario with a thin 400 m layer were relatively low. Still, as the thickness increased to 1300 m, the sedimentation rate rose significantly, nearly doubling from approximately 48 m/Ma to around 120 m/Ma. For an intermediate thickness of 700 m, the sedimentation rate was approximately 43 m/Ma, similar to the 400 m setting (Figure 8). Notably, the average modern-day total depth of the analyzed Mikulov Fm. exceeds 7500 m with a thickness surpassing 1 km (consistent with well Zistersdorf ÜT2a; Figure 4b and Figure 6). Therefore, when the thickness was less than half of the measured thickness (or 1300 m), the sedimentation and subsidence rate values may be influenced by the sinking Jurassic depocenter. Considering the “cold syn-rift crustal-driven subsidence” scenario, we observed that the main producing interval was accommodated in deeper present-day depths with a considerably lower thermal maturity than expected for such buried intervals (ca. 1.9% EASYRo). Very deep sources with a lower maturity, together with a lower basal heat production than usual (110 mW/m2; Figure 11 [81]), suggest that several crustal processes influenced the opening of the Alpine Tethys: (1) large magnitude and rapid subsidence in a relatively cold cratonic area, whereby, in turn, (2) a significant role of thermal relaxation mechanisms was observed in the thick Mikulov Fm. Further study is needed to fully understand the mechanism of basin opening.

5.3. Implication of Extensional Detachment

To correlate the basin modeling results with the detachment mechanism and listric-type extensional tectonics of the Vienna Basin (e.g., [82,83]), we further coupled the computed Miocene compaction parameters (including HC generation pressure, effective porosity, and burial depth; Figure 12) with the available description of late Oligocene to Miocene extensional detachment formation. The dependence on the formation of salt and clay detachments is typical for thin-skinned extensional and compressional tectonic environments from around the world (e.g., [16,84,85]). Similar to those depicted in the Mikulov marls (Figure 2b and Figure 5), fault rollovers develop because of geometric and spatial compatibility issues, often induced by extensional down-transport displacement along a listric growth fault and subsequent down-bending of the hanging wall strata (e.g., [16,66,82,86]). The kinematics of fault rollover anticlines are closely related to the amount of overburden and the extension rate [16]. Such mechanisms may induce stress-insensitive diagenetic processes in the shales or salt, leading to overpressure in the detachment layer, which is often a source rock for petroleum systems [87,88]. Differential pressure in a passive margin wedge (brittle overburden) above a viscous salt or shale, underpinned by hydrocarbon expulsion, contributes to detachment formation (Figure 12a,b). Additionally, abnormally high values of pore fluid pressure enhance fluid migration in the fault plane direction, which is widespread within mature source rocks affected by chemical compaction and volume increases (e.g., [88,89]; Figure 12c). The trends in bulk density and effective porosity, used as calibration parameters, aligned well with the Alpine convergence, its footwall domain, or subthrust layers. Some detachments may form along lithologic boundaries, further influencing differential compaction beneath detachment faults [90]. Similar structures on shale detachments have been reported from the Gulf of Mexico, the Scotian basin, and elsewhere.
We estimated the numerically derived compaction trends at the Oligocene interval to identify when the Mikulov detachment reactivated extensionally after the end of Alpine thrust staking (Figure 12). The computed hydrocarbon-expulsion pressure of the Mikulov Fm. showed several peaks corresponding to the tectonic events. During the Oligocene reactivation, the depth of the Mikulov Fm. was approximately 5800 m, with the temperature revolving around 75 °C. The wide variations in parameters during the early–middle Miocene likely correspond to the onset of the extensional stage of the Vienna Basin, leading to the formation of a ductile detachment. This hypothesis can be supported by the downthrown hanging wall block exhibiting greater thicknesses along a hanging wall listric fault (Figure 2b and Figure 4).

6. Conclusions

This article presents quantification and comprehensive analyses of the subsidence trends of Jurassic strata in the Vienna Basin region using 1D numerical modeling. This study focused on pre-thrust thin-skinned crustal segments of the Alpine Tethys and its cover, encompassing the overlying late Mesozoic thrusting, collision, and Miocene Vienna Basin deposits. It underscores how the land-locked position of the Alpine Tethys led to a cold opening and rapid syn-rift subsidence, followed by a transition to slow post-rift thermal subsidence during the passive margin stage. The key findings and contributions include the following:
  • The mechanism of the Alpine Tethys opening during the syn-rift stage could not be solely driven by rift-related crustal stretching. Alternatively, crustal subsidence might be associated with a “cold” lithospheric-scale downwelling;
  • By integrating 1D numerical modeling with a modified kinematic model and a geodynamic background, this study provides realistic inputs for quantifying the presumed Alpine Tethys rifting stages, particularly for the post-rift Mikulov Fm.;
  • The computed subsidence rates delineated the syn-rift and post-rift stages, with subsidence rates gradually decelerating during the post-rift stage, consistent with general models. The consistency in sedimentation rates from syn- to post-rift stages, including a subsequent Lower Cretaceous hiatus (uplift), suggests excellent indicators marking the regional extension of the Alpine Tethys;
  • The sedimentation pattern computed for the Mikulov Fm. reflects typical passive margin development related to slow thermal subsidence, which ended after the Jurassic period. This latest Jurassic stage can be correlated with similar latest Jurassic convergence stages observed across the regions, including the Carpathian–Balkans;
  • The combined results from the 1D numerical modeling, including compaction trends and hydrocarbon expulsion, offer insights into the reactivation and formation of extensional tectonic detachment, such as listric faults and subsequent Neogene tectonic subsidence;
  • The best-fit scenario depicts the Mikulov Fm. with a thickness of approximately 1300 m near the deepest basin depocenter. It indicates favorable but lower-grade maturity conditions, contrasting with models featuring shallower Jurassic depositional domains. The lower maturity is likely the marker of an atypical subsidence mechanism, driven by a “cold” lithospheric-scale downwelling.
By elucidating these dynamics, this study contributes to a deeper understanding of the geological evolution of the Alpine Tethys region. It sheds light on the complex interplay between tectonic processes and sedimentary deposition.

Supplementary Materials

The following supporting information can be downloaded at: https://www.mdpi.com/article/10.3390/geosciences14080202/s1, Table S1: The 1D model inputs included varying thicknesses of the Mikulov marls: (a) a model with a minimal thickness of 400 m, (b) a model with an immense thickness of 1300 m, and (c) a model with an average thickness of 700 m.

Author Contributions

Conceptualization, D.S.; methodology, D.S., E.Y.L. and A.Š.; software, D.S.; validation, D.S. and E.Y.L.; formal analysis, D.S., E.Y.L., A.Š. and R.S.; investigation, D.S. and E.Y.L.; resources, D.S. and E.Y.L.; data curation, D.S. and E.Y.L.; writing—original draft preparation, D.S.; writing—review and editing, D.S. and E.Y.L.; visualization, D.S. and E.Y.L.; supervision, D.S., E.Y.L. and A.Š. All authors have read and agreed to the published version of the manuscript.

Funding

This research has been partially financially supported by the Ministry of Science, Technological Development, and Innovation of the Republic of Serbia (contract No: 451-03-66/2024-03/200026).

Data Availability Statement

The primary data are provided in the text.

Acknowledgments

We would like to express our gratitude for the support provided by editors Frances Chen and Tanita Djumic. We appreciate the valuable comments from all three reviewers, which have significantly improved this manuscript.

Conflicts of Interest

The authors declare no conflicts of interest.

Appendix A

Table A1. The Mikulov marls parameters were acquired from wells Zistersdorf ÜT 1 and 2a (data from [13]). TOC: total organic carbon; S1: free hydrocarbons; S2: free hydrocarbons generated from kerogen cracking; Tmax: temperature of maximum generation; HI: hydrogen index; S: total sulfur; TOC/S: ratio of total organic carbon to sulfur content.
No.WellDepth [m]TOC [%]S1 [mgHC/g]S2 [mgHC/g]Tmax [C]HI [mgHC/gTOC]S [%]TOC/S
1Zistersdorf ÜT 15602.72.772.424.334481560.843.29
2Zistersdorf ÜT 15605.51.180.941.504491260.492.40
3Zistersdorf ÜT 15670.52.661.933.414521280.554.80
4Zistersdorf ÜT 15674.62.802.034.164511490.505.60
5Zistersdorf ÜT 15737.31.931.642.744541420.0631.29
6Zistersdorf ÜT 15740.71.761.882.494531410.247.42
7Zistersdorf ÜT 15977.33.052.593.544561160.535.74
8Zistersdorf ÜT 15983.73.331.112.85461850.794.22
9Zistersdorf ÜT 2a77042.73n.d.n.d.n.d.n.c.0.634.36
10Zistersdorf ÜT 2a81530.72n.d.n.d.n.d.n.c.0.352.06
11Zistersdorf ÜT 2a85440.74n.d.n.d.n.d.n.c.0.441.68
12Zistersdorf ÜT 2a55862.042.673.454501690.229.16
13Zistersdorf ÜT 2a55872.162.402.904461341.141.90

Appendix B

Table A2. Compiled thermal maturity data from different depths with a lower vitrinite reflectance value (VR). TR: transformation ratio. Data from [13,14,32].
Compiled Thermal Maturity
VR vs. DepthVRTR
Mikulov Formation was drilled at a depth range of 1400–8551 m
4000 m0.8%
4800 m1.0%0.75
5000 m1.2%
5500 m1.5%
6000 m1.8%
6600 m2.1%
8500 m2.2%
To provide an additional maturity overview, all wells with depth penetrating the Mikulov Fm. are provided
Aderklaa UT 1a, 6076.5 m1.8%
Ameis 1, ~3000 m<0.8%
Falkenstein 1, 3300–3900 m<0.8%
Fallbach 1, ~1800 m<0.8%
Hofflein 7a, ~2700 m<0.8%
Klement 1, 2400 m<0.8%
Korneuburg T1, 3200 m<0.8%
Maustrenk ÜT 1a, 6500 mca.2.0%
Merkersdorf 2, 1900 m<0.8%
Roseldorf T1, 1300 m<0.8%
Staatz 1, 1900–2800 m<0.8%
Stronegg 1, 2000 m<0.8%
Thomasl 1, 2300–3000 m<0.8%
Wildendürnbach T1, 1500 m<0.8%
Zistersdorf ÜT 1, 5600–5900 m1.5–1.7%
Zistersdorf ÜT 2a, 5500–8500 m1.5–2.2%
In the Czech part of the Vienna Basin, the following wells penetrated the Mikulov Fm. at the interval from 2500 to 4500 m:Kobylí 1, Morkůvky 1, Němčičky 1, Němčičky 4, Němčičky 5, Nové Mlýny 1, Nové Mlýny 2, Nové Mlýny 3, Sedlec 1, Kobylí 1, Bulhary 1, Ježov 2, Uhřice 18, Uhřice 19<0.8%
Gresten Fm0.5–0.6%

References

  1. Froitzheim, N.; Eberli, G.P. Extensional detachment faulting in the evolution of a Tethys passive continental margin, Eastern Alps, Switzerland. Geol. Soc. Am. Bull. 1990, 102, 1297–1308. [Google Scholar] [CrossRef]
  2. Mandl, G.W. The Alpine sector of the Tethyan shelf–Examples of Triassic to Jurassic sedimentation and deformation from the Northern Calcareous Alps. Mitt. Österr. Mineral. Ges. 2000, 92, 61–77. [Google Scholar]
  3. Stampfli, G.M. Tethyan oceans. Geol. Soc. Spec. Publ. 2000, 173, 1–23. [Google Scholar] [CrossRef]
  4. Lemoine, M.; Bas, T.; Arnaud-Vanneau, A.; Arnaud, H.; Dumont, T.; Gidon, M.; Tricart, P. The continental margin of the Mesozoic Tethys in the Western Alps. Mar. Pet. Geol. 1986, 3, 179–199. [Google Scholar] [CrossRef]
  5. Bernoulli, D.; Jenkyns, H.C. Ancient oceans and continental margins of the Alpine-Mediterranean Tethys: Deciphering clues from Mesozoic pelagic sediments and ophiolites. Sedimentology 2009, 56, 149–190. [Google Scholar] [CrossRef]
  6. Zhao, Z.; Sun, Z.; Qiu, N.; Zhao, M.; Zhang, J.; Li, F.; Lin, J.; Lee, E.Y. The paleo-lithospheric structure and rifting-magmatic processes of the northern South China Sea passive margin. Gondwana Res. 2023, 120, 162–174. [Google Scholar] [CrossRef]
  7. Fries, G.; Parize, O. Anatomy of ancient passive margin slope systems: Aptian gravity-driven deposition on the Vocontian palaeomargin, western Alps, south-east France. Sedimentology 2003, 50, 1231–1270. [Google Scholar] [CrossRef]
  8. Tari, G.; Strauss, P. The Jurassic Gresten facies of the European margin in Austria, Hungary and Romania: A regional overview. Berichte Der Geol. Bundesanst. 2018, 128, 154. [Google Scholar]
  9. Decker, K. Miocene tectonics at the Alpine-Carpathian junction and the evolution of the Vienna Basin. Mitt. Ges. Geol. Bergbaustud. Österr. 1996, 41, 33–44. [Google Scholar]
  10. Wessely, G. Sedimente des Wiener Beckens und seiner alpinen und subalpinen Unterlagerung (The Vienna Basin and its alpine and subalpine basement). Mitt. Ges. Geol. Bergbaustud. Österr. 2000, 44, 191–214. [Google Scholar]
  11. Lee, E.Y.; Wagreich, M. Polyphase tectonic subsidence evolution of the Vienna Basin inferred from quantitative subsidence analysis of the northern and central parts. Int. J. Earth Sci. 2017, 106, 687–705. [Google Scholar] [CrossRef]
  12. Beidinger, A.; Decker, K. Quantifying Early Miocene in-sequence and out-of-sequence thrusting at the Alpine-Carpathian junction. Tectonics 2014, 33, 222–252. [Google Scholar] [CrossRef]
  13. Rupprecht, B.J.; Sachsenhofer, R.F.; Gawlick, H.J.; Kallanxhi, M.E.; Kucher, F. Jurassic source rocks in the Vienna basin (Austria): Assessment of conventional and unconventional petroleum potential. Mar. Pet. Geol. 2017, 86, 1327–1356. [Google Scholar] [CrossRef]
  14. Schicker, A.; Gier, S.; Schieber, J.; Krois, P. Diagenesis of the Malmian Mikulov Formation source rock, Vienna Basin: Focus on matrix and pores. Mar. Pet. Geol. 2021, 129, 105082. [Google Scholar] [CrossRef]
  15. Blížkovský, M.; Kocak, A.; Morkovsky, M.; Novotny, A.; Gaza, B.; Kostelnicek, P.; Muller, P. Exploration history, geology, and hydrocarbon potential in the Czech Republic and Slovakia. In Hydrocarbons of Eastern Central Europe: Habitat, Exploration and Production History; Popescu, B.M., Ed.; Springer: Berlin/Heidelberg, Germany, 1994; pp. 71–117. ISBN 978-3-642-77207-8. [Google Scholar] [CrossRef]
  16. Krézsek, C.; Adam, J.; Grujic, D. Mechanics of fault and expulsion rollover systems developed on passive margins detached on salt: Insights from analogue modelling and optical strain monitoring. Geol. Soc. Spec. Publ. 2007, 292, 103–121. [Google Scholar] [CrossRef]
  17. Ladwein, H.W. Organic geochemistry of Vienna basin: Model for hydrocarbon generation in overthrust belts. AAPG Bull. 1988, 72, 586–599. [Google Scholar] [CrossRef]
  18. Ciprys, V.; Adámek, J.; Benada, S. Petroleum geology of the Carpathian Foredeep and overthrust zones in the Czech Republic. Petrol. Geosci. 1995, 1, 89–95. [Google Scholar] [CrossRef]
  19. Picha, F.J.; Zdenek, S.; Oldrich, K. Geology and hydrocarbon resources of the Outer Western Carpathians and their foreland, Czech Republic. In AAPG Memoir: The Carpathians and Their Foreland: Geology and Hydrocarbon Resources; Golonka, J., Picha, F.J., Eds.; American Association of Petroleum Geologists: Tulsa, OK, USA, 2006; Volume 84, pp. 49–175. [Google Scholar] [CrossRef]
  20. Picha, F.J.; Peters, K.E. Biomarker oil-to-source rock correlation in the Western Carpathians and their foreland, Czech Republic. Petrol. Geosci. 1998, 4, 289–302. [Google Scholar] [CrossRef]
  21. Scotese, C.R. PALEOMAP PaleoAtlas for GPlates and the PaleoData Plotter Program. In Paleomap Project. 2016. Available online: www.earthbyte.org/paleomap-paleoatlas-for-gplates (accessed on 16 February 2023).
  22. Wessely, G. Der Untergrund des Wiener Beckens. In Erdöl und Erdgas in Österreich; Brix, F., Schultz, O., Eds.; Naturhistorisches Museum und F.Berger: Horn, Austria, 1993; pp. 249–280. ISBN 3-900312-88-5. [Google Scholar]
  23. Wessely, G. Geological results of deep exploration in the Vienna basin. Geol. Rundsch. 1990, 79, 513–520. [Google Scholar] [CrossRef]
  24. Francu, J.; Bohacek, Z.; Radke, M.; Schaefer, R.G.; Poelchau, H.S.; Caslavsky, J. Oil-oil and oil-source rock correlations in the northern Vienna basin and adjacent Carpathian Flysch zone (Czech and Slovak area). In Oil and Gas in Alpidic Thrustbelt and Basins of Central and Eastern Europe; Wessely, G., Liebl, W., Eds.; EAGE Special Publication 5; Geological Society: London, UK, 1996; pp. 343–353. [Google Scholar]
  25. Arzmüller, G.; Buchta, S.; Ralbovský, E.; Wessely, G. The Vienna basin. In AAPG Memoir 84: The Carpathians and Their Foreland: Geology and Hydrocarbon Resources; Golonka, J., Picha, F.J., Eds.; American Association of Petroleum Geologists: Tulsa, OK, USA, 2006; pp. 191–204. [Google Scholar]
  26. Lee, E.Y.; Wagreich, M. 3D visualization of the sedimentary fill and subsidence evolution in the northern and central Vienna Basin (Miocene). Austrian J. Earth Sci. 2016, 109, 241–251. [Google Scholar] [CrossRef]
  27. Adamek, J. The Jurassic floor of the Bohemian Massif in Moravia–geology and paleogeography. Bull. Geosci. 2005, 80, 291–305. [Google Scholar]
  28. Ślączka, A.; Gasiński, M.; Bąk, M.; Wessely, G. The clasts of Cretaceous marls in the conglomerates of the Konradsheim Formation (Pöchlau quarry, Gresten Klippen Zone, Austria). Geol. Carpath. 2009, 60, 151–164. [Google Scholar] [CrossRef]
  29. Petri, B.; Wijbrans, J.R.; Mohn, G.; Manatschal, G.; Beltrando, M. Thermal evolution of Permian post-orogenic extension and Jurassic rifting recorded in the Austroalpine basement (SE Switzerland, N Italy). Lithos 2023, 444–445, 107124. [Google Scholar] [CrossRef]
  30. Gier, S. Clay mineral and organic diagenesis of the Lower Oligocene Schöneck Fishshale, western Austrian Molasse basin. Clay Miner. 2000, 35, 709–717. [Google Scholar] [CrossRef]
  31. Hamilton, W.; Wagner, L.; Wessely, G. Oil and gas in Austria. Mitt. Österr. Geol. Ges. 2000, 92, 235–262. [Google Scholar]
  32. Sachsenhofer, R.F.; Bechtel, A.; Kuffner, T.; Rainer, T.; Gratzer, R.; Sauer, R.; Sperl, H. Depositional environment and source potential of Jurassic coal-bearing sediments (Gresten Formation, Hoflein gas/condensate field, Austria). Petrol. Geosci. 2006, 12, 99–114. [Google Scholar] [CrossRef]
  33. Gusterhuber, J.; Hinsch, R.; Sachsenhofer, R.F. Evaluation of hydrocarbon generation and migration in the Molasse fold and thrust belt (Central Eastern Alps, Austria) using structural and thermal basin models. AAPG Bull. 2014, 98, 253–277. [Google Scholar] [CrossRef]
  34. Frank, W.; Schlager, W. Jurassic strike-slip versus subduction in the Eastern Alps. Int. J. Earth. Sci. 2006, 95, 431–450. [Google Scholar] [CrossRef]
  35. Lukeneder, A.; Halasova, E.; Kroh, A.; Mayrhofer, S.; Pruner, P.; Rehakova, D.; Wagreich, M. High-resolution stratigraphy of the Jurassic-Cretaceous boundary interval in the Gresten Klippenbelt (Austria). Geol. Carpath. 2010, 61, 365–381. [Google Scholar] [CrossRef]
  36. Artyushkov, E.V.; Baer, M.A. Mechanism of continental crust subsidence in the Alpine Belt. Tectonophysics 1984, 108, 193–228. [Google Scholar] [CrossRef]
  37. Bertotti, G. Subsidence, deformation, thermal and mechanical evolution of the Mesozoic South Alpine rifted margin: An analogue for Atlantic-type margins. Geol. Soc. Spec. Publ. 2001, 187, 125–141. [Google Scholar] [CrossRef]
  38. Strauss, P.; Granado, P.; Muñoz, J.A. Subsidence analysis of salt tectonics-driven carbonate minibasins (Northern Calcareous Alps, Austria). Basin Res. 2020, 33, 968–990. [Google Scholar] [CrossRef]
  39. McKenzie, D. Some remarks on the development of sedimentary basins. Earth Planet. Sci. Lett. 1978, 40, 25–32. [Google Scholar] [CrossRef]
  40. Stampfli, G.M.; Borel, G.D.; Marchant, R.; Mosar, J. Western Alps geological constraints on western Tethyan reconstructions. J. Virtual Explor. 2002, 8, 77–106. [Google Scholar] [CrossRef]
  41. Faupl, P.; Wagreich, M. Late Jurassic to Eocene palaeogeography and geodynamic evolution of the Eastern Alps. Mitt. Österr. Geol. Ges. 2000, 92, 79–94. [Google Scholar]
  42. Harzhauser, M.; Daxner-Höck, G.; Piller, W.E. An integrated stratigraphy of the Pannonian (Late Miocene) in the Vienna Basin. Aust. J. Earth Sci. 2004; 95/96, 6–19. [Google Scholar]
  43. Harzhauser, M.; Kranner, M.; Mandic, O.; Strauss, P.; Siedl, W.; Piller, W.E. Miocene lithostratigraphy of the northern and central Vienna Basin (Austria). Aust. J. Earth Sci. 2020, 113, 169–200. [Google Scholar] [CrossRef]
  44. Seifert, P. Palinspastic reconstruction of the easternmost Alps between upper Eocene and Miocene. Geol. Carpath. 1992, 43, 327–331. [Google Scholar]
  45. Strauss, P.; Harzhauser, M.; Hinsch, R.; Wagreich, M. Sequence stratigraphy in a classic pull-apart basin (Neogene, Vienna Basin). A 3D seismic based integrated approach. Geol. Carpath. 2006, 57, 185–197. [Google Scholar]
  46. Wessely, G. Geologie der Österreichischen Bundesländer: Niederösterreich; Geologische Bundesanstalt: Wien, Austria, 2006. [Google Scholar]
  47. Brix, F.; Kröll, A.; Wessely, G. Die Molasse zone und deren Untergrund in Niederösterreich. Erdöl-Erdgas-Z. Sonderausg. 1977, 93, 12–35. [Google Scholar]
  48. Eliáš, M. Paläogeographische Entwicklung des Mesozoikums und des Tertiärs am Rande der Karpaten und des Böhmischen Massifs. Erdöl-Erdgas-Z. Sonderausg. 1977, 93, 5–11. [Google Scholar]
  49. Steiner, T.M.C.; Gawlick, H.J.; Melcher, F.; Schlagintweit, F. Ophiolite derived material as parent rocks for Late Jurassic bauxite: Evidence for Tithonian unroofing in the Northern Calcareous Alps (Eastern Alps, Austria). Int. J. Earth Sci. 2021, 110, 1847–1862. [Google Scholar] [CrossRef]
  50. Spahić, D.; Kurešević, L.; Cvetković, Ž. Constraints on the Late Cretaceous post-Neotethyan oblique convergence, the olistolith perspective (Sava Suture Zone, segment Ripanj-Ropočevo-Kosmaj Mt., Belgrade area, Serbia). Carbonate Evaporite 2023, 38, 51. [Google Scholar] [CrossRef]
  51. Spahić, D.; Barjaktarović, M.; Mukherjee, S.; Bojić, Z. Tithonian limestone as a marker of early contraction of NeoTethyan Vardar Ocean: Structural constraints on the latest Jurassic—Earliest Cretaceous “docking” (Dobroljupci, Kuršumlija, Jastrebac Mt., Serbia). Carbonate Evaporite, 2024; in press. [Google Scholar]
  52. Rögl, F.; Kroh, A.; Hofmann, T.; Zuschin, M. Exkursion Waschbergzone. In Österreichische Paläontologische Gesellschaft—15. Jahrestagung, Ber. Geol. BA; Zuschin, M., Hofmann, T., Eds.; Geologische Bundesanstalt: Wien, Austria, 2009; Volume 81, pp. 32–49. [Google Scholar]
  53. Schmid, M.S.; Bernoulli, D.; Fügenschuh, B.; Matenco, L.; Schefer, S.; Schuster, R.; Tischler, M.; Ustaszewski, K. The Alps-Carpathians-Dinarides-connection: A correlation of tectonic units. Swiss J. Geosci. 2008, 101, 139–183. [Google Scholar] [CrossRef]
  54. Schmid, M.S.; Fügenschuh, B.; Kounov, A.; Matenco, L.; Nievergelte, P.; Oberhänsli, R.; Pleugerg, J.; Schefer, S.; Schuster, R.; Tomljenović, B.; et al. Tectonic units of the Alpine collision zone between Eastern Alps and western Turkey. Gondwana Res. 2020, 78, 308–374. [Google Scholar] [CrossRef]
  55. Tari, G.; Bada, G.; Beindinger, A.; Csizmeg, J.; Danišik, M.; Gjerazi, I.; Grasemann, B.; Kovaáč, M.; Plašienka, D.; Šujan, M.; et al. The connection between the Alps and the Carpathians beneath the Pannonian Basin: Selective reactivation of Alpine nappe contacts during Miocene extension. Glob. Planet. Chang. 2021, 197, 103401. [Google Scholar] [CrossRef]
  56. Genser, J.; Cloetingh, S.A.; Neubauer, F. Late orogenic rebound and oblique Alpine convergence: New constraints from subsidence analysis of the Austrian Molasse basin. Glob. Planet. Chang. 2007, 58, 214–223. [Google Scholar] [CrossRef]
  57. Wessely, G.; Liebl, W. Oil and Gas in Alpidic Thrustbelts and Basins of Central and Eastern Europe; Geological Society: London, UK, 1996; p. 448. ISBN 1-897799-73-X. [Google Scholar]
  58. Knierzinger, W.; Wagreich, M.; Palzer-Khomenko, M.; Gier, S.; Meszar, M.; Lee, E.Y.; Strauss, P. Provenance and palaeogeographic evolution of Lower Miocene sediments in the eastern North Alpine Foreland Basin. Swiss J. Geosci. 2019, 112, 269–286. [Google Scholar] [CrossRef]
  59. Lee, E.Y.; Wagreich, M. Basin modelling with a MATLAB-based program, BasinVis 2.0: A case study on the southern Vienna Basin, Austria. J. Geol. Soc. Korea 2018, 54, 615–630. [Google Scholar] [CrossRef]
  60. Salcher, B.C.; Meurers, B.; Smit, J.; Decker, K.; Hölzel, M.; Wagreich, M. Strike-slip tectonics and Quaternary basin formation along the Vienna Basin fault system inferred from Bouguer gravity derivatives. Tectonics 2012, 31, TC3004. [Google Scholar] [CrossRef]
  61. Allen, P.A.; Allen, J.R. Basin Analysis: Principles and Application to Petroleum Play Assessment, 3rd ed.; Wiley-Blackwell: Chichester, UK, 2013; p. 640. ISBN 978-0-470-67377-5. [Google Scholar]
  62. Lee, E.Y.; Novotny, J.; Wagreich, M. Subsidence Analysis and Visualization: For Sedimentary Basin Analysis and Modelling; Springer: Heidelberg/Berlin, Germany, 2019; p. 56. [Google Scholar] [CrossRef]
  63. Hantschel, T.; Kauerauf, A.I. Fundamentals of Basin and Petroleum Systems Modeling: Integrated Exploration Systems GmbH; Schlumberger Company: Houston, TX, USA; Springer: Heidelberg/Berlin, Germany, 2009; p. 476. [Google Scholar] [CrossRef]
  64. Welte, D.H.; Horsfield, B.; Baker, D.R. Petroleum and Basin Evolution: Insights from Petroleum Geochemistry, Geology and Basin Modeling; Springer Science & Business Media: Berlin, Germany, 2012; p. 535. [Google Scholar] [CrossRef]
  65. Spahić, D.; Vanin, V.; Perepelina, A.; Aryakbaeva, Z. Normal faulting and role of the reverse drag in analyzing petroleum systems, an example of 2D modeling from the Nam Con Son Basin (Vietnam). In Proceedings of the SPE Annual Caspian Technical Conference and Exhibition, Astana, Kazakhstan, 12–14 November 2014; p. SPE-172310. [Google Scholar]
  66. Spahić, D.; Rundić, L. Multi-phased normal faulting of the Eisenstadt-Sopron basin margins as a controlling factor over spatially confined coal mini-hydrocarbon play (east Austria). Carpathian J. Earth Environ. Sci. 2015, 10, 45–58. [Google Scholar]
  67. Spahić, D.; Šajnović, A.; Burazer, N.; Radisavljević, M.; Jovančićević, B. Neogene subsidence rates of the southern Peri Pannonian realm (1D basin modeling): Constraints on the extensional geodynamic drivers of the asymmetric Toplica basin (central-southern Serbia). Geoenergy Sci. Eng. 2023, 226, 211714. [Google Scholar] [CrossRef]
  68. Zare-Reisabadi, M.; Kamali, M.R.; Mohammadnia, M.; Shabani, F. Estimation of true formation temperature from well logs for basin modeling in the Persian Gulf. J. Petrol. Sci. Eng. 2015, 125, 13–22. [Google Scholar] [CrossRef]
  69. Abdelmaksoud, A.; Ali, M.Y.; Al Suwaidi, A.; Koyi, H. Petroleum system of the fold-and-thrust belt of the United Arab Emirates: New insights based on 1D and 2D basin modeling. Mar. Petrol. Geol. 2023, 158, 106567. [Google Scholar] [CrossRef]
  70. Lee, E.Y.; Novotny, J.; Wagreich, M. Compaction trend estimation and applications to sedimentary basin reconstruction (BasinVis 2.0). Appl. Comput. Geosci. 2020, 5, 100015. [Google Scholar] [CrossRef]
  71. Cohen, K.M.; Finney, S.C.; Gibbard, P.L.; Fan, J.-X. The ICS International Chronostratigraphic Chart. Episodes 2013, 36, 199–204. [Google Scholar] [CrossRef] [PubMed]
  72. McKenzie, A.S.; Mckenzie, D.P. Isomerization and aromatization of hydrocarbons in sedimentary basins formed by extension. Geol. Mag. 1983, 120, 417–470. [Google Scholar] [CrossRef]
  73. Wagner, L.R. Tectono-stratigraphy and hydrocarbons in the Molasse Foredeep of Salzburg, Upper and Lower Austria. Geol. Soc. Spec. Publ. 1998, 134, 339–369. [Google Scholar] [CrossRef]
  74. Haq, B.U. Jurassic sea-level variations: A reappraisal. GSA Today 2018, 28, 4–10. [Google Scholar] [CrossRef]
  75. Wygrala, B.P. Integrated Study of an Oil Field in the Southern Po Basin, Northern Italy; Forschungs zentrum Jülich: Jülich, Germany, 1989; p. 2313. [Google Scholar]
  76. Sweeney, J.J.; Burnham, A.K. Evaluation of a simple model of vitrinite reflectance based on chemical kinetics. AAPG Bull. 1990, 74, 1559–1570. [Google Scholar] [CrossRef]
  77. Winterer, E.L.; Bosellini, A. Subsidence and sedimentation on Jurassic passive continental margin, Southern Alps, Italy. AAPG Bull. 1981, 65, 394–421. [Google Scholar] [CrossRef]
  78. Bradley, D.C. Passive margins through Earth’s history. Earth-Sci. Rev. 2008, 91, 1–26. [Google Scholar] [CrossRef]
  79. Golonka, J.; Krobicki, M. Upwelling regime in the Carpathian Tethys: A Jurassic-Cretaceous palaeogeographic and paleoclimatic perspective. Geol. Q. 2001, 45, 15–32. [Google Scholar]
  80. Tari, G.; Ciudin, D.; Kostner, A.; Raileanu, A.; Tulucan, A.; Vacarescu, G.; Vangelov, D. Play types of the Moesian Platform of Romania and Bulgaria. In Proceedings of the Exploration in the Black Sea and Caspian Regions. American Association of Petroleum Geologists, Regional Annual Conference, Kiev, Ukraine, 18 October 2010; Available online: https://www.searchanddiscovery.com/documents/2011/10311tari/ndx_tari.pdf (accessed on 1 June 2024).
  81. Speranza, F.; Minelli, L.; Pignatelli, A.; Gilardi, M. Curie temperature depths in the Alps and the Po Plain (northern Italy): Comparison with heat flow and seismic tomography data. J. Geodyn. 2016, 98, 19–30. [Google Scholar] [CrossRef]
  82. Yamada, Y.; McClay, K. Application of geometric models to inverted listric fault systems in sandbox experiments. Paper 1: 2D hanging wall deformation and section restoration. J. Struct. Geol. 2003, 25, 1551–1560. [Google Scholar] [CrossRef]
  83. Spahić, D.; Exner, U.; Behm, M.; Grasemann, B.; Haring, A.; Pretsch, H. Listric versus planar normal fault geometry: An example from the Eisenstadt-Sopron Basin (E Austria). Int. J. Earth Sci. 2011, 100, 1685–1695. [Google Scholar] [CrossRef]
  84. Sanchis, E.; Séranne, M. Structural style and tectonic evolution of a polyphase extensional basin of the Gulf of Lion passive margin: The Tertiary Alès basin, southern France. Tectonophysics 2000, 322, 219–242. [Google Scholar] [CrossRef]
  85. Alsop, G.I.; Weinberger, R.; Marco, S.; Levi, T. Detachment fold duplexes within gravity-driven fold and thrust systems. J. Struct. Geol. 2021, 142, 104207. [Google Scholar] [CrossRef]
  86. Morley, C.K.; Naghadeh, D.H. Tectonic compaction shortening in the toe region of an isolated listric normal fault, North Taranaki Basin, New Zealand. Basin Res. 2018, 30, 424–436. [Google Scholar] [CrossRef]
  87. Bols, H.M.; Hermanrud, C.; Teige, G.M. Origin of overpressures in shales: Constraints from basin modeling. AAPG Bull. 2004, 88, 193–211. [Google Scholar] [CrossRef]
  88. Zanella, A.; Cobbold, P.R.; de Veslud, C.L.C. Physical modelling of chemical compaction, overpressure development, hydraulic fracturing and thrust detachments in organic-rich source rock. Mar. Petrol. Geol. 2014, 55, 262–274. [Google Scholar] [CrossRef]
  89. Kopf, A. Permeability variation across an active low-angle detachment fault, western Woodlark Basin (ODP Leg 180), and its implication for fault activation. Geol. Soc. Spec. Publ. 2001, 186, 23–41. [Google Scholar] [CrossRef]
  90. Xu, S.; Hao, F.; Xu, C.; Wang, Y.; Zou, H.; Gong, C. Differential compaction faults and their implications for fluid expulsion in the northern Bozhong Subbasin, Bohai Bay Basin, China. Mar. Petrol. Geol. 2015, 63, 1–16. [Google Scholar] [CrossRef]
Figure 1. (a) Tectonic outline of the Alpine–Carpathian system in central, eastern, and southern Europe, encompassing the Vienna Basin (VB) and surrounding regions (Molasse Zone, Waschberg Unit (WU), Flysch Zone, Northern Calcareous Alps (NCA), and Central Alps). In the Vienna Basin, major fault lines on the pre-Neogene surface, including the Steinberg fault (SF) and the Vienna Basin Transfer Fault (VBTF), are shown (based on [9,10,11]). (b) Geological profile (Section A) across the central Vienna Basin, Molasse Basin, and underlying tectonic units (revised from [12]).
Geosciences 14 00202 g001
Figure 2. (a) Paleogeography map of the Late Jurassic (~150 Ma), showing the Alpine Tethys, passive margin, and surroundings (red square). The area where the Late Jurassic carbonates were deposited and subsequently became part of the Vienna Basin’s basement is approximately indicated with a yellow square. The paleogeographical reconstruction is from [21]. (b) Jurassic to Neogene development model of the Vienna Basin region (based on [22,23]).
Geosciences 14 00202 g002
Figure 3. Stratigraphic framework, depositional environment, and tectonic phases of the Vienna Basin region, encompassing the autochthonous and allochthonous units and the Neogene sedimentary succession. Major petroleum system elements (PSEs) are indicated (based on [19,22,25,26,41,42,43,44,45,46]).
Geosciences 14 00202 g003
Figure 4. (a) The structure map of the Vienna Basin, showing the faulted pre-Neogene basement surface with major oil and gas fields (modified from [11,25]). Locations of Zistersdorf Depression (ZD) and wells Maustrenk ÜT1 (M) and Zistersdorf ÜT (Z) are indicated. AT—Austria; SK—Slovakia; CZ—Czech Rep. (b) Geological cross-section across the Steinberg fault and Zistersdorf depression in the Vienna Basin, illustrating the autochthonous and allochthonous units and the assumed deeper basement structure. Major stratigraphic and structural units with well positions are marked (revised from [23]).
Geosciences 14 00202 g004
Figure 5. Geological cross-section providing a comprehensive view of the Alpine thrust sheets in the Vienna Basin region, derived from 2D seismic data (see Figure 1a for Section B location; based on [13] and references therein). This section depicts the thrust units and zones characterized by active extensional detachment and Miocene sedimentation as well as out-of-sequence thrusting. In the context of our study, the detachment layers, predominantly comprised of Jurassic Mikulov Fm., are of particular importance.
Geosciences 14 00202 g005
Figure 6. (a) Mikulov isopach map, depicting thickness beneath the central Vienna and its surrounding areas (revised from [14]). (b) Vitrinite reflectance trend with increasing depth (data from [14] and references therein).
Geosciences 14 00202 g006
Figure 8. Computed sedimentation rates by 1D pseudo modeling; different 1D input data of (a) 400 m, (b) 1300 m, and (c) 700 m in thickness.
Geosciences 14 00202 g008
Figure 9. Time plots for computed parameters of the Mikulov Fm. from the Late Jurassic to the present day using different 1D input data; (a) 400 m, (b) 1300 m, and (c) 700 m thicknesses. The parameters shown include the maximum effective stress, layer thickness over time, sedimentation rate, and EASY%Ro. At the end of the Jurassic and the beginning of the Cretaceous, the sedimentation rates (blue line) showed an abrupt decrease; the computed layer thickness (pale red line) decreased due to compaction and tectonic exhumation; the thermal maturity (green line) remained low throughout the rifting, post-rift, and tectonic exhumation periods.
Geosciences 14 00202 g009
Figure 10. Tests of crustal models relative to varying syn-rift heat flow values. Colors indicate present-day thermal maturation levels; yellow denotes overmature stages, red denotes the gas generation stage, green represents different stages of the oil window, and blue denotes the not matured sections. (a,b) show differences in the computed depth-related temperature for different Mesozoic formations.
Geosciences 14 00202 g010
Figure 11. Time-depth diagrams based on the model’s analysis of Jurassic–Paleogene events, applying a thickness of 1300 m for the Mikulov Fm. (a) A 2D section model showing the change in computed subsurface heat flow according to paleowater depth input data (maximum water depth during the syn-rift). (b) Computed heat flow according to sedimentation rates. (c) Computed thermal maturity. Please note that the values were changed after the Paleocene events.
Geosciences 14 00202 g011
Figure 12. (a) Approximation of Mikulov detachment during the onset of extension (Oligocene). PA1–3 indicate the differential pressures on the margin. (b) Extensional displacement following the remobilization of detachment. The remobilization is followed by the expulsion onset of fluids and gases (see green and red in (a)). The curve shows how the workaround considers the footwall downwelling of subthrust layers (at the expense of hanging wall upthrusting during the Alpine orogeny). (c) Parameters used for interpretation and calibration were temperature, burial history, effective porosity, bulk density, hydrocarbon generation pressure, overpressure, and lithostatic pressure.
Geosciences 14 00202 g012
Disclaimer/Publisher’s Note: The statements, opinions and data contained in all publications are solely those of the individual author(s) and contributor(s) and not of MDPI and/or the editor(s). MDPI and/or the editor(s) disclaim responsibility for any injury to people or property resulting from any ideas, methods, instructions or products referred to in the content.

