Abstract
This review synthesizes existing research to elucidate the factors driving the distinct tectonic behaviors in the western and eastern Makran subduction zone, focusing on seismic activity, uplift rate, convergence rate, coupling, and subduction angle. The literature identifies the asymmetry in pressure and the variation in subduction angles between the western and eastern parts of the Makran as key factors in defining the region’s tectonic patterns. The western region has a steeper subduction angle, resulting in lower pressure, reduced coupling, and decreased seismic activity. This disparity arises from different interactions between the subducted and overriding plates. This article offers an overview of the Makran subduction zone, identifies some knowledge gaps, and suggests directions for future research to improve our understanding of this complex geological region. The review highlights the need for more comprehensive GPS stations and targeted studies on subduction dip angles to better understand the region’s tectonic dynamics.
1. Introduction
Makran is one of the largest accretionary prisms on Earth, formed by the subduction of the oceanic portion of the Arabian plate beneath the Eurasian plate [1,2,3,4,5,6]. The overriding plate consists of two blocks: the Lut block in Iran and the Helmand block, which extends from Afghanistan to Pakistan. These blocks are separated by the Sistan Suture Zone (SSZ) (Figure 1) [7]. The SSZ plays a crucial role in dividing the overriding plate into a non-deforming Helmand block and a less-deforming Lut block [8]. Subduction was initiated in the Paleocene, with accretionary growth occurring in the Eocene [9,10]. The ongoing process of orogeny continues to contribute to the geologic dynamics of the region.
The geological maps and associated reports by McCall and Kidd [11] and McCall [12,13,14] have provided a foundational geological framework for understanding the structure and stratigraphy of the onshore Makran in Iran. The eastern and western parts of Makran display distinct tectonic patterns, suggesting a complex subduction process due to variations in seismic activity, coastal uplift, convergence rate, coupling, and subduction angle. While extensive research has been conducted on the Makran region from various perspectives, there remains a need for a comprehensive review that synthesizes these findings to serve as an encyclopedia for further research. By focusing on the specific characteristics of each sub-region based on previous extensive research, we aim to highlight the unique features and processes that define them. In this section, we provide a brief overview of the discrepancies in the Makran region, which will be further discussed in subsequent sections. The eastern part experiences greater earthquake intensity than the western part, which may imply that there is aseismic or locked subduction occurring in the western part [10,15,16,17,18,19]. Thermal modeling has shown that the western Makran has the potential to generate an earthquake with a moment magnitude (Mw) of 8.65 ± 0.26 [20]. Further research indicates that the western Makran interface is accumulating elastic strain, which may lead to megathrust earthquakes [21,22,23,24]. Lin et al. [25] analyzed satellite Interferometric Synthetic Aperture Radar (InSAR) data to study the distribution of interseismic coupling on the eastern Makran megathrust. They found that elastic strain has accumulated since the 1945 earthquake, indicating the potential for future magnitude 7+ earthquakes. Ghods et al. [26] noted that the difference in the number of earthquakes between the eastern and western Makran may result from distinct overriding plate dynamics. Contradictorily, different interpretations indicate that the eastern Makran is locked as a result of high pore fluid pressures, a phenomenon typical of accretionary prisms in subduction zones with abundant sediment input [27]. Penney et al. [21] utilized teleseismic body-waveform modeling in conjunction with data from previous studies, such as P-wave first motions and global earthquake catalogs, to establish a thorough seismic record of earthquakes with well-defined depths and mechanisms in the Makran. They observed shallow earthquakes in Makran, which showed clear spatial variations in the style of strain. Shallow thrust earthquakes typically occur offshore or near the coastline, while most earthquakes onshore are of the strike-slip type. Akbarzadeh Aghdam et al. [28] examined a temporary seismic network of 39 stations around the eastern and western Makran borders from June 2016 to November 2019. The observed seismicity showed an NNW–SSE trend of shallow, small-magnitude earthquakes (ML < 3.3 and depth < 10 km) within the northern part of the accretionary prism along approximately 60° E longitude.
Coastal uplift studies unequivocally demonstrate that the uplift rate on the east coast is significantly higher than on the west coast [29,30,31,32,33,34,35,36,37]. The considerable difference in uplift rates between the western and eastern parts of the Makran raises questions that have not yet been clarified [35,37]. Uplift rate calculations indicate that in the western part of the Makran, along the Iranian coast, the rates range from 0.05 to 1.5 mm per year [29,30,31,32,34]. An exceptionally high uplift rate of up to 5 mm per year was calculated in the Pasabander area, near the border with Pakistan in the eastern part of the Makran [35,36,37]. The uplift rate in Makran is closely related to tectonic movements [38] and various types of uplift that occur across fault-bounded coastal blocks [39].
GPS measurements (e.g., [21,22,23,28,40,41,42,43,44,45,46]) and plate motion models [47,48,49,50,51,52,53,54,55,56,57] consistently indicate a gradual increase in convergence rates of the Arabian plate toward the Eurasian plate from west to east. The convergence rate between the western and eastern parts of the subducting margin exhibits a notable difference of 21% [45]. The overall convergence rates are 20.4 mm/year in the west and 32.6 mm/year in the east of 59.5° E, estimated based on surface velocity from a coupling model with a locking depth of 30 km [21].
Frohling and Szeliga [45] reported that the Makran subduction zone appears to be locked at a depth of at least 38 km, accumulating strain. Khorammi et al. [22] suggested that the Pakistani segment of the Makran region might be more strongly coupled than the Iranian segment. Abbasi et al. [58] documented that the coupling in western Makran is over four times smaller than in eastern Makran.
Previous studies have indicated variations in the dip angle of subduction between the eastern and western parts of Makran [8,16,26,59,60,61]. This difference may contribute to variations in the abundance of volcanoes. It has been demonstrated that the western part of the volcanic arc has a significantly higher abundance of volcanoes compared with the eastern part (Bazman Group (BG), Taftan Group (TG), and Sultan Group (SG)) (Figure 1). The volcanic arc is offset between the two segments (Lut and Helmand blocks); a greater distance exists between the deformation front and the volcanic arc in eastern Makran [10].
The eastern part of the Makran subducts at an 8° angle, increasing to about 20° as it reaches the asthenosphere. The western part enters the asthenosphere at an approximate 30° angle [59]. The subducted plate is sinking more steeply in the west than in the east, supported by evidence that includes variations in the depth of the Moho, the slip rates of inland faults, and the shortening of the crust [8]. Motaghi et al. [60] found that the western Makran has dips of about 18°, whereas the eastern Makran has dips of about 9°. The recent study by Priestley et al. [61] examined the geometry and dip of the subducting plate in the onshore Iranian Makran. The findings show a very low-angle subducting plate with a dip of approximately 3° between the northern coastline of the Oman Sea and the southern edge of the Jazmurian Depression. Further north of the Jazmurian Depression, the slab dips more steeply at approximately 12.5°. Ghods et al. [26] recognized that the Wadati–Benioff zone in eastern Makran indicates a subduction angle of about 15° at depths of roughly 45–80 km, which increases to approximately 45° beyond 80 km depth.
The Makran has previously been divided into western and eastern parts based on differences in seismicity. The seismic activity suggests that the SSZ can be considered the boundary between western and eastern Makran [10]. Kukowski et al. [2] identified a sinistral strike-slip fault named the Sonne fault, which separates the western part of the Makran subduction zone, where plate boundary events are absent, from the eastern part, which does show plate boundary seismicity. The Sonne fault accommodates the differential movement between the Ormara microplate (driven northward by the Murray Ridge) and the Gulf of Oman (Figure 1) [18]. Rajendran et al. [18] suggested that geometric considerations indicate the Sonne fault likely divides the Makran subduction front into western and eastern segments. In a recent view, Nemati [8] suggests that the segmentation line, or fracture zone of Makran, aligns approximately with the Sonne fault, which extends to the SSZ, separating the Lut and Helmand blocks. Mousavi et al. [62] have proposed a dual subduction scenario, suggesting that the slabs of Bazman, Taftan, and Kuh-Sultan, oriented west-to-east, correspond to different stages of the subduction process: before, during, and after the slab break-off. Akbarzadeh Aghdam et al. [28] suggested that shallow, right-lateral strike-slip earthquakes near 60° longitude in the northern accretionary prism may indicate a broad transitional boundary between the western and eastern Makran. Cheng et al. [24] stated that the Makran megathrust is segmented into three parts—western, central, and eastern—with varying degrees of plate coupling along their length. This suggests that the megathrust has the potential to produce earthquakes of up to Mw 8.7 in the case of a single-segment rupture and up to Mw 9.2 in the case of a multi-segment rupture.

Figure 1.
The study area and its structural features are shown, highlighting the Sistan Suture Zone, the Jazmurian Depression (Jazmurian D), the Mashkel Depression (Mashkel D), the Sonne Fault, the Ormara Microplate, and the Murray Ridge. Brown triangles indicate the locations of volcanoes in the Bazman Group (BG), the Taftan Group (TG), and the Sultan Group (SG) [63,64,65].

This study provides an overview of the Makran subduction zone, focusing on contrasting its western and eastern segments. The primary aim is to elucidate the factors contributing to the distinct tectonic patterns and deformations observed in these regions, as revealed by prior research. By synthesizing findings from previous studies, we aim to understand the drivers of these differences. Specifically, this investigation examines seismic activity, uplift rate, convergence rate, coupling, and subduction angle within the Makran. This paper contributes to understanding the existing gaps and highlights potential areas for future research that can be explored by other researchers.
2. Tectonic Setting
The oceanic lithosphere of the Oman Sea is tilted to the northeast and is subducted under the Eurasian plate at a low angle [66,67,68]. The convergence between the Arabian and Eurasian plates is the result of rifting in the Red Sea and the Murray Ridge, leading to the formation of the Makran accretionary prism [2]. This convergence has played a crucial role in shaping the intracontinental deformation of Iran [41].
The overriding plate consists of two different blocks: the Lut block, which is located in Iran, and the Helmand block, which extends across Afghanistan and Pakistan. The Lut and Helmand blocks, originally integral parts of the Neo-Tethys, were formed by the influence of eastward subduction beneath the Helmand block, leading to the formation of the SSZ [7]. The Jazmurian and the Mashkel Depressions are identified as forearc basins in western and eastern Makran, respectively [13,66]. The subduction zone is located 200 km onshore, and the geometry beneath the Jazmurian Depression indicates characteristics of oceanic crust [69]. In a recent study, Enayat and Ghods [70] stated that the Jazmurian Depression has a continental crust down to a depth of approximately 40 km, covered by a sedimentary layer approximately 20 km thick.
Northern Makran features a chain of volcanoes extending over 400–500 km from west–southwest to northeast. For simplicity, these volcanoes are categorized into three main groups (BG, TG, and SG), as shown in Figure 2 [65,71,72]. The western boundary is delineated by the dextral strike-slip fault system of Minab–Zendan–Palami (MZP). The MZP plays a pivotal role in adjusting the velocity gradient between the eastern Zagros and western Makran areas (Figure 2) and delineates a transition zone [41]. It has a motion rate of approximately 11 ± 2 mm/year based on GPS measurements [41,43,44]. In contrast, the eastern boundary is defined by the sinistral strike-slip fault systems of Ornach Nal (OF) and Chaman (CF), which serve as a transition zone connecting the Makran to the Indo–Eurasian collision zone [73], as shown in Figure 2. The lateral movement rate along the CF is estimated at 33.3 ± 3 mm/year based on geomorphological measurements [73]. The Moho discontinuity beneath the Makran region deepens from approximately 25 km near the coast to about 50 km beneath the volcanic arc [74,75,76].
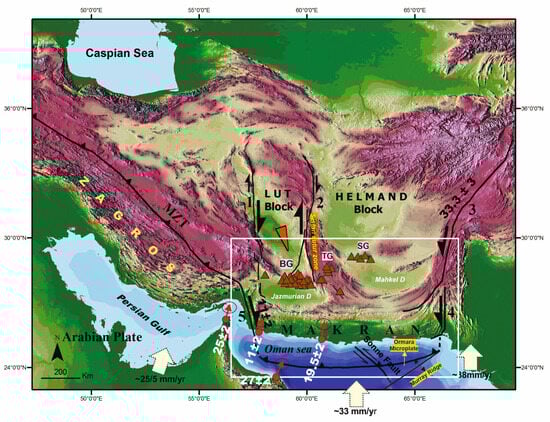
Figure 2.
Simplified tectonic map of the Makran region, showing the study area, and the main geological features. The map highlights the distinct boundaries of the Lut block, identified as the western (marked as No. 1) and eastern (marked as No. 2) boundaries, both marked by prominent dextral strike-slip fault systems. The Chaman fault (CF) (marked as No. 3), a sinistral strike-slip fault, is shown along with its rate of movement based on geomorphological measurements [73]. The Ornach Nal sinistral strike-slip fault (OF) (marked as No. 4) is also shown. The MZP fault system (marked as No. 5) is displayed along with its corresponding rates of motion [41]. The Main Zagros Thrust (MZT) is shown. The Jazmurian Depression (Jazmurian D), Mashkel Depression (Mashkel D), and Sistan Suture Zone are also indicated. Quaternary volcanoes, including the Bazman Group (BG), Taftan Group (TG), and Sultan Group (SG), are represented by brown triangles [63,64,65]. In the Lut block, an orange symbol denotes a counterclockwise rotation, supported by GPS measurements and paleomagnetic interpretations [77,78]. Red circles represent GPS stations that visualize the velocities of movement associated with the convergence between the Arabian and Eurasian plates [41]. The white arrows show the rate of motion of the Arabian plate relative to the Eurasian plate according to the GEODVEL-2010 model [56]. The white rectangle indicates the study area analyzed for the focal mechanisms of earthquakes in Makran (Figure 3) by Penney et al. [22].
3. Seismicity
The earthquake on 27 November 1945, with a magnitude of Mw 8.1, was the strongest seismic event in eastern Makran. The event was coupled with a devastating tsunami, which caused significant loss of life and property in Iran, Oman, Pakistan, and northwestern India [18]. The Makran displays distinct seismic behavior in its western and eastern parts, with negligible seismic activity in the western part [10,15,16,17,18,19].
The plate boundary in the eastern part experienced large earthquakes in 1756, 1851, and 1945 [10] (Figure 3). However, in the Iranian segment, there has not been any documented significant thrust fault earthquake [10,15,16,17,18,19], except for a probable historical earthquake of magnitude Mw 7.7 in 1483 [10,79] (Figure 3). Currently, there is no detectable seismic activity between the tectonic plates in the region [21,28]. Recent studies [20,21,24,80] indicate that large earthquakes are possible in western Makran.
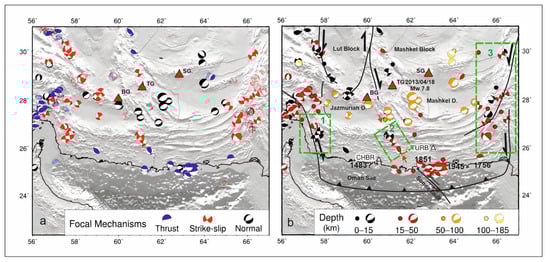
Figure 3.
(a) shows earthquakes with a magnitude (Mb) greater than 4 from 1945 to 2013. Semi-transparent events indicate poorly constrained depths and/or mechanisms. (b) displays earthquakes with a magnitude (Mb) greater than 4 from 1945 to 2013 with well-constrained depths. The white triangles indicate the locations of seismometers CHBR and TURB. The figure presents structural boundaries, faults, and the locations of significant earthquakes that ruptured the plate boundary in the eastern part in 1756, 1851, and 1945, as well as a probable historical earthquake of magnitude Mw 7.7 in 1483 in western Makran. The brown triangles represent the symbols for the Bazman Group (BG), Taftan Group (TG), and Sultan Group (SG) volcanoes. The green rectangles indicate the structural boundaries of the Makran: the MZP (marked as No. 1), the boundary between western and eastern Makran (marked as No. 2), and the OF and CF (marked as No. 3) (modified after Penney et al. [21]).
There are different perspectives on the reasons for the variation in seismic activity in the Makran region. One view attributes the seismic gap to saturated sediments and a low friction coefficient [10,43,81]. Another view suggests that the low seismic activity can be attributed to three factors: locking, aseismic slip, and cessation of subduction [10,14,17,31,43]. Some authors argue that the risk of earthquakes in the western part is lower than in the eastern part due to less strain accumulation within the megathrust zone. This is due to the northward movement of the Lut block and the lower seismic coupling between the subducting and overriding plates [58]. Ghods et al. [26] analyzed 157 relocated earthquakes between 1968 and 2023, finding that differences in the number of earthquakes between eastern and western Makran may result from distinct overriding plate dynamics. Seismic anisotropy has been observed at the base of the accretionary wedge before it bends down beneath the Jazmurian Depression. This indicates the presence of an interplate boundary that could affect the location and width of the locked zone along the boundary [80].
To better understand earthquake mechanisms, we examine the results of Penney et al. [21], which present the most comprehensive analysis of focal mechanisms for earthquakes in Makran (Figure 3). Penney et al. [21] employed teleseismic body-waveform modeling alongside data from diverse sources to construct an exhaustive inventory of earthquakes characterized by well-defined depths and mechanisms. Their criteria for delineating a well-constrained earthquake drew from multiple sources, including the Global Centroid Moment Tensor (GCMT) catalog [82,83], hypocentral locations from the EHB catalog [84], and the International Seismological Centre (ISC). Additionally, the sources encompassed the works of various studies such as Laane and Chen [85], Byrne et al. [10], Baker [86], Berberian et al. [5,6], Maggi et al. [87], Walker [88], Engdahl et al. [89], Jackson et al. [90,91,92], Nissen et al. [91,92], Talebian et al. [93], Walker et al. [94], Barnhart et al. [95], Jolivet et al. [96], and Penney et al. [97]. For older seismic events, they utilized focal mechanisms derived from P-wave first motions by Jackson and McKenzie [98], Jacob and Quittmeyer [15], and Byrne et al. [10]. The outcomes are shown in Figure 3a,b, demonstrating earthquakes with magnitudes greater than Mb 4 from 1945 to 2013, clearly differentiating those with well-defined parameters from those with less certainty. They observed the spatial separation of earthquake mechanisms (with constrained depths) in Makran: shallow thrusts cluster at the coastline, normal mechanisms are found in the north, and strike-slip events are concentrated on the eastern and western edges of the accretionary prism.
In 1992, Byrne et al. [10] identified the initial boundary between western and eastern Makran based on variations in seismic activity patterns (Figure 3b; green rectangle (No. 2)). This boundary is consistent with strike-slip earthquakes in central Makran, particularly within the longitude range of 61° to 62°. Figure 3 displays three distinct structural boundaries in Makran, determined from focal mechanism interpretations. Boundary 1 is identified as the MZP. Boundary 2 marks the division between western and eastern Makran, influenced by strike-slip earthquake focal mechanisms, particularly near the eastern Lut block [10]. Boundary 3 corresponds to the OF and CF, forming the eastern boundary of Makran. Kukowski [2] recognized another potential dividing boundary, the Sonne fault zone (Figure 3b).
Nemati [8] conducted a study that combined the spatial distribution and mechanism of seismicity, seismicity parameters, geomorphology in satellite imagery, and tectonic features in the Makran inland to demonstrate that the Makran low-angle thrust fault is divided into two separate segments (Figure 4). Variations in historical and instrumental seismicity, the bending of the coastline, and the strike-slip focal mechanisms on the fracture zone between the Sonne fault and subduction zone support the hypothesis that Makran is reliably segmented. The fractures and geometry of subduction show that the eastern Makran has a seismotectonically wider area for the potential coupling of a larger earthquake than the western Makran. It seems that the location of the subduction front (SF) may strongly depend on the resistance of the continental plate against subduction. Nemati [8] suggested that large events at shallow depths are evidence of weak and strong coupling between the oceanic and continental crusts on low-angle and very low-angle reverse faults, respectively.
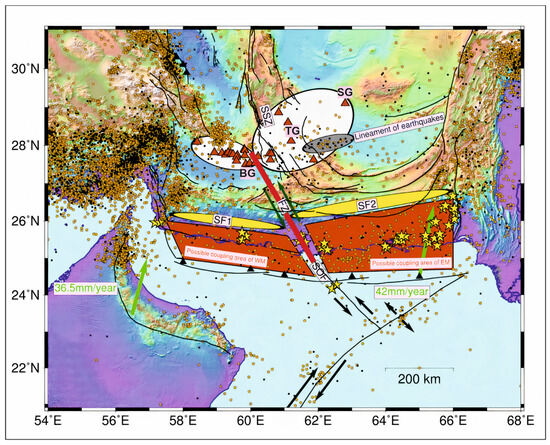
Figure 4.
Background seismicity includes earthquakes from the ISC catalog from 1916 to 2015. These are categorized into deep (≥33 km; dark circles) and shallow (<33 km; light brown circles) events, with ISC’s depth errors considered. Light green vectors represent velocity vectors based on the NUVEL-1 model [98]. Subduction fronts SF1 (western part) and SF2 (eastern part) are marked with yellow ellipses. A zone of shallow and intermediate-depth earthquakes, approximately 250 km long with an ENE orientation, is present north of SF2 in eastern Makran, highlighted by a gray ellipse (lineament of earthquakes). SF1 and SF2 areas may have ESE and ENE orientations, respectively, with SF2 parallel to the gray ellipse. Mud volcanoes along the coast are marked by yellow stars. White ellipses represent the SW and NE elongations of volcanic distributions in the western and eastern regions, respectively. The brown triangles represent the symbols for the Bazman Group (BG), Taftan Group (TG), and Sultan Group (SG) volcanoes. Brown face-to-face polygons (possible coupling areas) and yellow ellipses (subduction fronts) divided by a solid red line indicate a NNW–SSE continental left-lateral fracture zone (FZ) connecting the Sistan Suture Zone (SSZ) and the Sonne Fault (SOF) (modified after Nemati [8]).
In a recent study, Akbarzadeh Aghdam et al. [28] examined a temporary seismic network of 39 stations around the eastern and western Makran borders from June 2016 to November 2019. The seismic activity revealed a pattern of small, shallow earthquakes in the northern part of the accretionary prism, following an NNW–SSE trending alignment at approximately 60° longitude (Figure 5). The earthquakes occur more frequently to the east of this trend, indicating that it may represent the approximate boundary between the western and eastern Makran regions. Their finding depicts that the Jazmurian Depression is a relatively aseismic block, as evidenced by the scarcity of shallow crustal earthquakes within the Depression and the concentration of shallow earthquakes around its periphery.
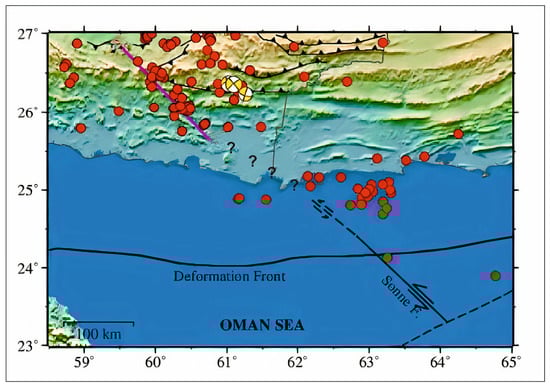
Figure 5.
Red circles indicate the locations of events from June 2016 to November 2019 used to calculate the seismicity parameter (ML < 3.3 and depth < 10 km). The pink line indicates the western border of the broad boundary between western and eastern Makran. Beachballs represent three strike-slip events (modified after Akbarzadeh Aghdam et al. [28]).
4. Coastal Uplift
The Makran coast underwent substantial tectonic activity during the Holocene and Pleistocene, leading to the formation of coastal terraces [30,31,34].
Studies indicated that coastal uplift is significantly higher on the east coast than on the west coast (e.g., [29,30,32,33,34,99]). Uplift rate calculations indicated low to moderate rates along the Iranian Makran coast, ranging from 0.05 to 1.5 mm/yr. However, an exceptionally high uplift rate of up to 5 mm/yr has been recorded in the Pasabander area near the Pakistan border (eastern part) [35,36,37]. In the western part of Makran, Iran, Jask has elevations ranging from 1 to 9 m. Further into the middle of Makran, also in Iran, Konarak has an elevation of approximately 100 m. Further east in Makran, Pakistan, Ormara reaches elevations of about 500 m [30]. The examination of twenty-five terraces along the Makran coast, from east to west [34], revealed that the eastern part of Makran has higher elevations than the western part (Figure 6). Based on the investigation of these terraces, the highest elevation of marine terraces in the Makran region reaches 240 m in Iran and approximately 600 m in Pakistan. Some researchers have argued that coastal uplift is a consequence of large-magnitude earthquakes, suggesting that the uplift observed in Ormara, eastern Makran, was increased as a result of the 1945 event [30,100,101]. However, assuming that coastal uplift is responsible for high-magnitude earthquakes, the entire Makran zone would experience intense seismic activity, and remarkably, no significant earthquakes have occurred in the western part of Makran except the 1483 earthquake, the cause of which remains unclear [10,17,79,102]. According to Rajendran et al. [18], the Makran coast may not have been impacted by large earthquakes nearby in the recent past, as supported by the analysis of historical data. However, the elevated marine terraces on the western Makran and their uplift rates indicate a comparable degree of long-term tectonic activity, especially around Ormara. Offshore data suggest the occurrence of recently active submarine slumps in the eastern part of the Makran, reflecting shaking events due to the 1945 great earthquake. Cheng et al. [24] provided an analysis of plate-coupling dynamics, indicating potential segmentation within the megathrust, characterized by variable coupling intensities from west to east. Nonetheless, their findings do not exclude the possibility that the entire length of the megathrust could fail cohesively during a single seismic event.
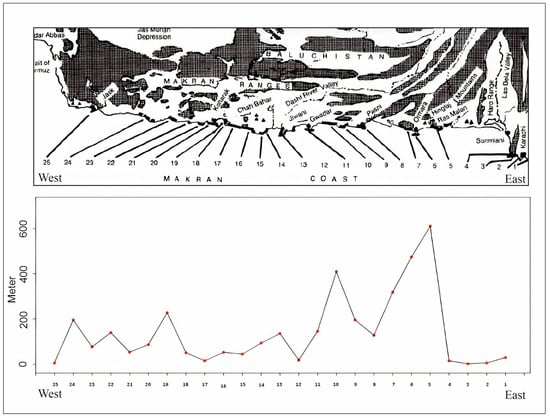
Figure 6.
The elevation of marine terraces and platforms along the Makran coast is based on data from Snead [34].
Ellouz-Zimmermann et al. [103] discuss the geodynamic evolution of the Makran accretionary prism in the Pakistani region, noting that the sediment input in the Makran originated from various sources during Cenozoic times: (1) direct influx from the Indus River, which conveys eroded sediments from the Indian shield or Himalayas; (2) strong erosion of the growing inner prism. The literature survey indicated that the evolution of the Pakistani part of the Makran fold-and-thrust belt shares significant similarities with that of the Iranian Makran, from the Late Cretaceous to the present [104]. Normand et al. [37] indicated the uplift of terraces due to rapid surface uplift in a subduction zone context and the heterogeneous accumulation of deformation in the overriding plate. Haghipour et al. [105] attribute the regional geomorphic differences to Quaternary variations in tectonic regimes, which caused varying uplift rates of the wedge surface.
The research by Normand et al. [35] reveals that the Makran coast’s morphology is influenced by three primary factors: (1) tectonic forces, causing regional relative sea-level fall and juxtaposition of different erodibility units through faulting; (2) surface processes, such as differential erodibility, which lead to isolated headlands and significant sediment deposition along the coast; and (3) coastal processes, which enable wave erosion of marine terraces and the creation of extensive beaches.
Studies emphasize significant variations in coastal uplift rates between the eastern and western parts of the Makran, with notably higher rates observed in the eastern region. The considerable difference in uplift rates between these regions raises questions that remain unresolved.
5. GPS, Velocity Vectors, and Coupling
The GPS measurements in the Makran show an increasing convergence rate, particularly in the eastern part, which has been the subject of many studies (e.g., [22,40,41,43,44,45]). The convergence rate between the western and eastern parts of the subducting margin demonstrates a significant difference of 21% [45]. The presence of a nearby spreading center (the Ormara microplate driven northward by the Murray Ridge (Figure 1)) in the eastern segment likely generates a much larger convergence in this area [17].
The recent study by Khorrami et al. [22] provided a comprehensive and updated GPS velocity field for Iran. This study processed data collected over 10 years (2006–2015) from the Iranian Permanent GNSS Network (IPGN) and combined it with previously published velocity solutions from GPS surveys conducted from 1997 to 2013. The results of their study are consistent with previous geodetic studies (e.g., Vernant et al. [41]).
Khorammi et al. [22] proposed that the Pakistani section of the Makran might exhibit a higher degree of coupling compared with the Iranian segment. They noted that large earthquakes could still strike the Iranian Makran, but with longer recurrence times. This finding contrasts with Frohling and Szeglia [45] and Penney et al. [21], who suggested a more highly coupled subduction interface for the entire Makran.
The study by Ghadimi et al. [23] presented the velocity vectors at GPS stations in the stable Eurasia reference frame [106], along with 95% confidence ellipses based on the authoritative works of [22,45,46,107] (Figure 7). They defined a locked subduction zone versus a steady creeping subduction zone for the western Makran.
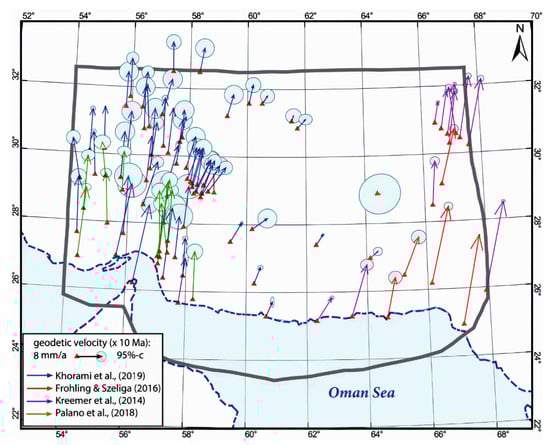
Figure 7.
Horizontal velocities of geodetic benchmarks in the reference frame of stable Eurasia [106], including 95% confidence ellipses [22,45,46,107] (modified after Ghadimi et al. [23]).
Lin et al. [25] analyzed InSAR images from 2003 to 2010 to study the distribution of interseismic coupling on the eastern Makran megathrust. Their research found that the central section of the eastern Makran, where the 1945 earthquake occurred, exhibits high interseismic coupling, and elastic strain has accumulated [25]. In contrast, lower coupling was observed in the subduction zone of the Sonne fault zone. The study suggests that there has been an accumulation of elastic strain since the 1945 earthquake, indicating the potential for future magnitude 7+ earthquakes [25].
Abbasi et al. [58] surveyed to improve the density of GPS vectors. This initiative included the establishment of six new GPS stations by the Department of Earth Sciences at the Institute for Advanced Studies in Basic Sciences (IASBS) in Zanjan, Iran. These newly established GPS stations primarily cover the coastal region of Makran in Iran and extend along north–south profiles from Chabahar to the onshore megathrust zone and further north to Bazman volcano in the Lut block. The velocities of these new vectors were determined for two sets of GPS stations. The first set consists of 11 stations, which benefited from a nationwide network developed by the Iranian National Cartographic Center (NCC) in the mid-2000s, originally intended for Gravity, Leveling, GPS, Astronomy, and Magnetic (GALM) measurements. The second set comprises six stations forming nearly north–south trending profiles, surveyed in January 2017 by IASBS. The existing GPS vectors were complemented by new GPS vectors (Figure 8).
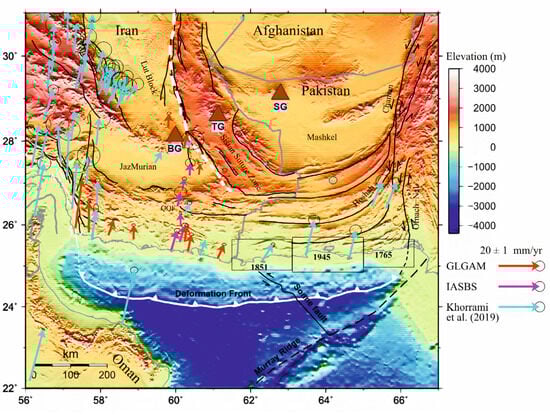
Figure 8.
GPS velocity field relative to the Eurasian fixed frame [22,58]. The brown triangles represent symbols for the Bazman Group (BG), Taftan Group (TG), and Sultan Group (SG) volcanoes (modified after Abbasi et al. [58]).
The results of Abbasi et al. [58] revealed significant disparities between the western and eastern segments of Makran. The ratio of coupling between the Arabian subducting plate and the overriding plate is more than four times smaller in western Makran compared with its eastern counterpart (Figure 9). Furthermore, the maximum rate of interseismic strain accumulation in the onshore megathrust zone of western Makran is nearly seven times smaller than in the eastern region. Consequently, the risk of earthquakes in the western Makran megathrust zone is considerably less than in the eastern region, whereas the earthquake hazard is notably higher in the areas surrounding the Zagros–Makran transition zone (Figure 2).
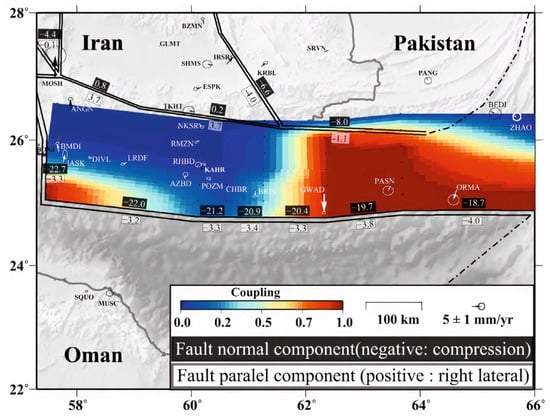
Figure 9.
The coupling ratio of the Makran subduction megathrust fault is depicted on a topographic map. The circles and ellipses indicate discrepancies between observed and modeled GPS velocity vectors. The small labels identify GPS stations, and dashed lines represent free-slip boundaries [58].
In a recent study, Cheng et al. [24] found that the eastern and western segments have coupling rates of around 50% and 60%, respectively. In contrast, the central segment shows a lower coupling rate of approximately 30%.
In order to accurately determine the convergence rate in the expansive Makran region, it is crucial to maintain a well-organized GPS network. This highlights the necessity of conducting further research and collecting data in the area to gain a better understanding of the underlying tectonic processes. To thoroughly investigate plate motion, we reviewed various models, considering their strengths and limitations. Specifically, we evaluated the convergence rate within the longitude range of 57° to 67° and the latitude of 25°, from west to east. These assessments incorporate the research findings of various studies [47,48,49,50,51,52,53,54,55,56,57] (Figure 10). Consistently, these models indicate a higher convergence rate in the eastern regions compared with the western ones. It is important to emphasize that our objective is to observe and analyze trends in convergence rates rather than engage in detailed discussions of these models.
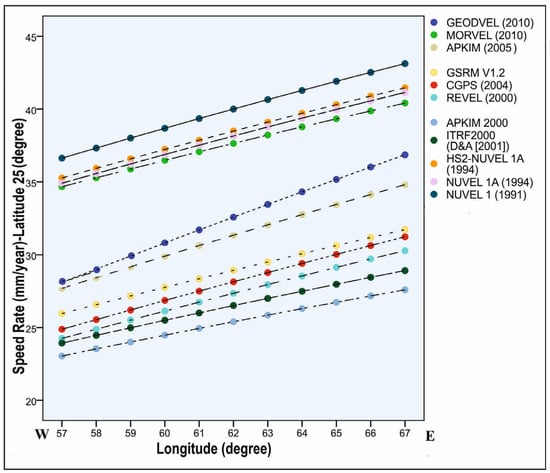
Figure 10.
Convergence rate of the Arabian plate with respect to the Eurasian plate from west to east. The estimates are derived from various plate motion models [47,48,49,50,51,52,53,54,55,56,57]. Data obtained from the UNAVCO plate motion calculator are accessible at https://www.unavco.org/software/geodetic-utilities/plate-motion-calculator/plate-motion-calculator.html, accessed on 15 June 2014.
6. Makran and Lut Block
The large difference between the shortening accommodated by the Zagros and the Makran indicates a significant N–S shear between central Iran and Afghanistan [5,41,98,102,108]. The Lut block exhibits distinctive features characterized by large-scale faulting along its western and eastern boundaries [7,109,110] (Figure 2). These faults extend over a considerable length of 700 km and play a crucial role in shaping the overall structural setting of the Lut block [78]. The differential motion of the Helmand and Lut blocks induces a right-lateral slip of 5.6 ± 0.6 mm/year along the east Lut, with a mean strike of approximately N12° E. Additionally, an extensional component perpendicular to the fault is observed at a rate of 1.4 ± 0.6 mm/year [78]. The right-lateral slip rate remains relatively constant along the fault, ranging from 5.6 ± 0.6 mm/year in the southern part to 5.8 ± 0.7 mm/year in the north [78]. Mattei et al. [77] and Walpersdorf et al. [78] recognized the counterclockwise rotation of the Lut block and N–S trending faults, likely attributed to their prior N–NE orientation (Figure 2). The analysis of strain tensors has revealed that the Makran and the Lut blocks are subjected to common stresses, while the Helmand block is under the influence of the Indian and Eurasian plates, as Zarifi [16] explained in Figure 11. The stress field in the central part of Makran reflects the interaction between Makran and SSZ [111]. When moving from the western to the middle part, the maximum horizontal stress direction shifts significantly from NE–SW to almost E–W [112].
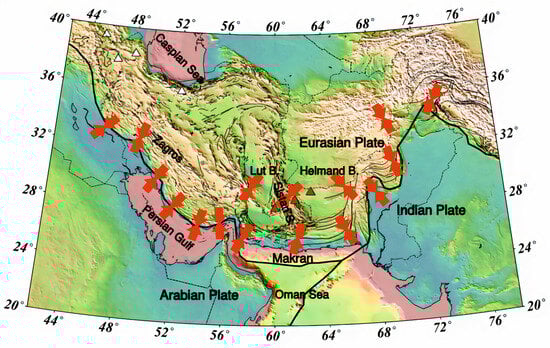
Figure 11.
Shows the maximum horizontal compressional stress, which was determined through focal mechanism stress inversion. The stress state varies from the western to the eastern Makran regions. In the western Makran, the stress field is impacted by the collision between Arabia and Eurasia, while in the eastern Makran, it is influenced by the Indian–Eurasian stress field. The brown triangles represent symbols for the Bazman Group (BG), Taftan Group (TG), and Sultan Group (SG) volcanoes [16].
Pourbeyranvand et al. [113] confirmed that the stress tensor analysis revealed the maximum horizontal stress orientation in the western part of Makran to be 17.6° ± 4, running parallel to the Zagros. This orientation indicates the impact of the continent–continent collision between the Arabian and Eurasian plates. In the central part of Makran, the direction shows a rotation of 38.2° ± 3. The maximum horizontal stress orientation in the eastern part is 157° ± 4, influenced by the collision between the Indian and Eurasian plates.
The significantly lower rate of strain accommodation in the western Makran megathrust zone is linked to the northward motion of the overriding Lut block along the dextral N–S fault of the SSZ, which transfers this northward motion beyond the northern boundary of the Lut block [41,114]. Rashidi et al. [115] indicated an oblique shortening of the SSZ, which could be attributed to the homogeneous direction of strains coinciding with the convergence of the Arabia–Eurasia plates. This supports the effective stress transfer from the active Zagros collision and Makran subduction zones. Ghods et al. [26] revealed that the difference in the number of earthquakes between eastern and western Makran may result from distinct overriding plate dynamics. Specifically, the study indicates that the eastern Makran’s Helmand block and the SSZ show nearly negligible movement relative to Eurasia, while the western Makran overriding plate comprises the Juzmurian Depression and Lut block. The differences in stress conditions at the structural boundaries, particularly at the MZP, OF, and CF, may be responsible for the expansion of the eastern boundary of the Lut block to the Sonne fault (Figure 3, as supported by Nemati [8]). The stress field in central Makran, which reflects the interaction between Makran and the SSZ, contributes to the expansion of the eastern boundary of the Lut block towards Makran. Makran has been proposed to be divided into western and eastern parts based on several perspectives (e.g., [2,8,10,28]). This boundary likely originated in the subducted plate, suggesting an interaction between variations in subduction dip angle and asymmetric pressure.
7. Subduction Angle
Engdahl and Villasenor [59] established a comprehensive digital database of earthquake hypocenters and phase arrival times for the majority of globally detected earthquakes in the 20th century. They indicated that the eastern part of the Makran subducts at a dip angle of about 8°, increasing to approximately 20° as it reaches the asthenosphere. The dip angle of the subducted slab in the western part, where it descends beneath the overlying lithosphere, remains uncertain; however, it enters the asthenosphere at an approximate dip angle of 30°. Zarifi [16] revealed that the positioning of the volcanic arc and forearc setting (Jazmurian and Mashkel Depressions), along with analyzing the gravity anomaly perpendicular to the trench, which is more negative in the west than in the east, suggests that the slab dips more shallowly toward the east. Nemati [8] stated that the spatial and temporal distribution of earthquakes reveals the separation, geometry, and non-characteristic behavior of the subduction zone, which likely indicates an Aleutian type of subduction zone for the eastern part [8].
Motaghi et al. [60] investigated the geometry of subsurface velocity interfaces across the western coastal Makran using teleseismic data. Their findings suggest that the oceanic crust in the western and eastern parts has average dips of approximately 2° and 3°, respectively, before subducting under the overridingplate. The western part is expected to have dips of about 18°, whereas the eastern part should have around 9°. Entezar-Saadat [116] conducted a study on the density and temperature distribution in the lithosphere across Iran, using gravity, geoid, topography, and surface heat flow data for modeling. The study suggested that the lithospheric–asthenospheric boundary (LAB) depth gradually increases until the Jazmurian Depression, then curves at a ~45° angle northward, reaching a depth of approximately 260 km. This significant thickening of the LAB is believed to be the result of the subduction of the oceanic lithosphere beneath the Iranian block. The recent study by Priestley et al. [61] examined the geometry and dip of the subducting plate in the onshore Iranian Makran using a combination of receiver functions and Rayleigh-wave group dispersion curves along an N–S seismic profile. The findings show a very low-angle subducting plate with a dip of approximately 3° between the northern coastline of the Oman Sea and the southern edge of the Jazmurian Depression. Further north of the Jazmurian, the slab dips more steeply at approximately 12.5°. Ghods et al. [26] stated that the Wadati–Benioff zone in eastern Makran indicates a subduction angle of about 15° at depths of roughly 45–80 km, which increases to approximately 45° beyond 80 km depth.
The occurrence of earthquakes in the northern part of Makran with a normal mechanism (Figure 3) may suggest that the asthenosphere, which is in contact with the subducted plate [95,117]. The study of the Khash earthquake (16 April 2013) [95] in southeastern Iran, with a magnitude of Mw 7.8, suggested that the probable driving mechanism was a combination of frictional instability due to dehydration embrittlement in the subducted crust and mantle. This occurred on a normal fault formed before subduction, under extension resulting from slab bending, indicating that the earthquake was likely due to the slab-detachment process [95]. Penney et al. [97] suggested that the dip of the seismogenic zone inferred from the earthquake distribution appears to steepen to the north of the normal-faulting earthquakes and proposed that the normal-faulting events probably represent extension at a hinge in the subducting Arabian plate.
The investigation of earthquake depth distribution reveals that earthquakes in the longitude range of 64–65° tend to occur at greater depths than those in other parts (Figure 3). One possible explanation for this observation is the lower dip angle of subduction in the eastern part. This causes the subducted plate to move a greater distance into the asthenosphere than the western part.
The dip angle of the Makran subduction zone varies significantly between its eastern and western segments, with the western part exhibiting a steeper dip than the eastern part. However, there is a notable lack of specific studies measuring the subduction dip angle across Makran, representing a significant gap in our understanding of the region’s tectonics.
Two distinct dip angles in subduction can occur only when slab tearing or distortion occurs. It can be observed that the western part of the volcanic arc has a higher abundance of volcanoes compared with the eastern part, as shown in Figure 2. A proposed schematic model, illustrated in Figure 12 explains the presence of two distinct dip angles and suggests that the boundary between these two blocks divides Makran into separate regions. Additionally, we propose that this boundary, already observed on the surface (e.g., [2,8,10]), may be due to a detached subducted slab. However, the possibility exists for the formation of more than two distinct regions, exceeding initial expectations.
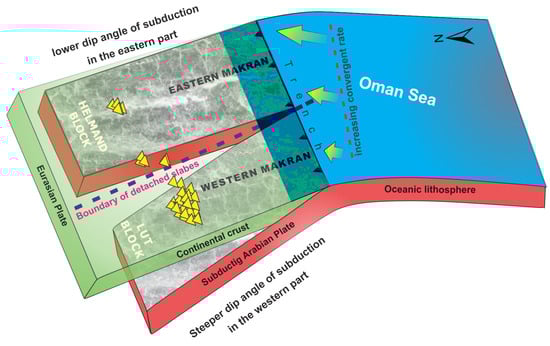
Figure 12.
Schematic model of subduction in the Makran region with two different dip angles. The yellow and green arrows indicate increasing velocity convergence from west to east, highlighting the progressive intensification of plate motion. The blue dashed line marks the prominent boundary between two subducting plates characterized by different dip angles. The yellow triangles represent the symbols for volcanoes.
8. Conclusions and Suggestions
The study investigated the distinct tectonic patterns and deformation processes in the eastern and western segments of the Makran subduction zone, elucidating the key drivers behind these variations. The findings highlight higher seismic activity and stronger plate coupling in the eastern segment, particularly in Pakistan, compared with the western segment in Iran. These differences are likely attributed to variations in subduction dynamics, including asymmetric pressure (with a higher convergence rate in the eastern part compared with the western part), dip angle, and stress field. The stress field in central Makran, potentially influenced by tectonic interactions between the Makran and the SSZ, may contribute to the extension of the Lut block’s eastern boundary toward Makran. The eastern region, characterized by a lower dip angle, may exhibit enhanced coupling between tectonic plates, leading to increased seismic activity and distinct uplift patterns. In contrast, the western region, with a steeper dip angle, might experience lower pressure, reduced coupling, and decreased seismic activity. This disparity could be attributed to varying degrees of interaction between the subducted and overriding plates. Despite the insights gained, several gaps persist in our understanding of the Makran subduction zone. Future research should prioritize measurements of the subduction dip angle and stress fields, particularly in the central Makran region. Additionally, more comprehensive GPS networks and InSAR techniques are essential for accurately monitoring tectonic movements across the entire subduction zone, including both vertical and horizontal displacements. Geophysical modeling, integrating gravity, geoid, topography, and surface heat flow data, along with seismic tomography (which requires more local seismic stations), could provide a deeper understanding of the subduction dip angle. These studies are crucial for improving seismic hazard assessments and understanding the interaction between the Makran subduction zone and surrounding tectonic structures.
Author Contributions
Conceptualization, P.N.; Investigation, P.N.; Project administration, P.N.; Resources, P.N., W.M., S.-H.M.-A., and M.K.; Supervision, P.N.; Validation, P.N.; Writing—original draft, P.N.; Writing—review and editing, P.N., W.M., S.-H.M.-A., and M.K. All authors have read and agreed to the published version of the manuscript.
Funding
This research received no external funding.
Data Availability Statement
Not applicable.
Acknowledgments
We appreciate the valuable feedback from the reviewers, which greatly helped improve this article. This work was part of Peyman Namdarsehat’s PhD dissertation, supported by Wroclaw University of Science and Technology. We acknowledge UNAVCO for the material used in Figure 10. The data can be accessed through the UNAVCO Plate Motion Calculator at https://www.unavco.org/software/geodetic-utilities/plate-motion-calculator/plate-motion-calculator.html (accessed on 15 June 2014).
Conflicts of Interest
The authors declare no conflicts of interest.
References
- Kopp, C.; Fruehn, J.; Flueh, E.; Reichert, C.; Kukowski, N.; Bialas, J.; Klaeschen, D. Structure of the Makran subduction zone from wide-angle and reflection seismic data. Tectonophysics 2000, 329, 171–191. [Google Scholar] [CrossRef]
- Kukowski, N.; Schillhorn, T.; Flueh, E.R.; Huhn, K. Newly identified strike-slip plate boundary in the northeastern Arabian Sea. Geology 2000, 28, 355–358. [Google Scholar] [CrossRef]
- Grando, G.; McClay, K. Morphotectonics domains and structural styles in the Makran accretionary prism, offshore Iran. Sediment. Geol. 2007, 196, 157–179. [Google Scholar] [CrossRef]
- Burg, J.-P.; Dolati, A.; Bernoulli, D.; Smit, J. Structural style of the Makran Tertiary accretionary complex in SE-Iran. In Lithosphere Dynamics and Sedimentary Basins: The Arabian Plate and Analogues; Springer: Berlin/Heidelberg, Germany, 2013. [Google Scholar]
- Berberian, M.; Jackson, J.; Qorashi, M.; Talebian, M.; Khatib, M.; Priestley, K. The 1994 Sefidabeh earthquakes in eastern Iran: Blind thrusting and bedding-plane slip on a growing anticline, and active tectonics of the Sistan suture zone. Geophys. J. Int. 2000, 142, 283–299. [Google Scholar] [CrossRef]
- Berberian, M.; Jackson, J.; Fielding, E.; Parsons, B.; Priestley, K.; Qorashi, M.; Talebian, M.; Walker, R.; Wright, T.; Baker, C. The 1998 March 14 Fandoqa earthquake (Mw 6.6) in Kerman province, southeast Iran: Re-rupture of the 1981 Sirch earthquake fault, triggering of slip on adjacent thrusts and the active tectonics of the Gowk fault zone. Geophys. J. Int. 2001, 146, 371–398. [Google Scholar] [CrossRef]
- Tirrul, R.; Bell, I.; Griffis, R.; Camp, V. The Sistan suture zone of eastern Iran. Geol. Soc. Am. Bull. 1983, 94, 134–150. [Google Scholar] [CrossRef]
- Nemati, M. Seismotectonic and seismicity of Makran, a bimodal subduction zone, SE Iran. J. Asian Earth Sci. 2019, 169, 139–161. [Google Scholar] [CrossRef]
- Platt, J.P.; Leggett, J.K.; Alam, S. Slip vectors and fault mechanics in the Makran accretionary wedge, southwest Pakistan. J. Geophys. Res. Solid Earth 1988, 93, 7955–7973. [Google Scholar] [CrossRef]
- Byrne, D.E.; Sykes, L.R.; Davis, D.M. Great thrust earthquakes and aseismic slip along the plate boundary of the Makran subduction zone. J. Geophys. Res. Solid Earth 1992, 97, 449–478. [Google Scholar] [CrossRef]
- McCall, G.; Kidd, R. The Makran, Southeastern Iran: The anatomy of a convergent plate margin active from Cretaceous to Present. Geol. Soc. Lond. Spec. Publ. 1982, 10, 387–397. [Google Scholar] [CrossRef]
- McCall, G. Ophiolitic and Related Mélanges: Benchmark Papers in Geology/66; Hutchinson Ross Publishing Company: Stroudsburg, PA, USA, 1983; p. xii. [Google Scholar]
- McCall, G. The geotectonic history of the Makran and adjacent areas of southern Iran. J. Asian Earth Sci. 1997, 15, 517–531. [Google Scholar] [CrossRef]
- McCall, G.J. A summary of the geology of the Iranian Makran. Geol. Soc. Lond. Spec. Publ. 2002, 195, 147–204. [Google Scholar] [CrossRef]
- Jacob, K.H.; Quitmeyer, R.; Farah, A.; DeJong, K. The Makran region of Pakistan and Iran: Trench-arc system with active plate subduction. Quittmeyer Richard Charles. In Geodynamics of Pakistan; Farah, A., de Jong, K.A., Eds.; Quetta Geological Survey of Pakistan: Quetta, Pakistan, 1979; pp. 305–317. [Google Scholar]
- Zarifi, Z. Unusual Subduction Zones: Case Studies in Colombia and Iran. Ph.D. Thesis, Faculty of Mathematics and Natural Sciences, The University of Bergen, Bergen, Norway, 2007. Available online: https://bora.uib.no/bora-xmlui/handle/1956/2317 (accessed on 15 June 2024).
- Musson, R. Subduction in the Western Makran: The historian’s contribution. J. Geol. Soc. 2009, 166, 387–391. [Google Scholar] [CrossRef]
- Rajendran, C.; Rajendran, K.; Shah-Hosseini, M.; Beni, A.N.; Nautiyal, C.M.; Andrews, R. The hazard potential of the western segment of the Makran subduction zone, northern Arabian Sea. Nat. Hazards 2013, 65, 219–239. [Google Scholar] [CrossRef]
- Smith, G.L.; McNeill, L.C.; Wang, K.; He, J.; Henstock, T.J. Thermal structure and megathrust seismogenic potential of the Makran subduction zone. Geophys. Res. Lett. 2013, 40, 1528–1533. [Google Scholar] [CrossRef]
- Khaledzadeh, M.; Ghods, A. Estimation of size of megathrust zone in the Makran subduction system by thermal modelling. Geophys. J. Int. 2022, 228, 1530–1540. [Google Scholar] [CrossRef]
- Penney, C.; Tavakoli, F.; Saadat, A.; Nankali, H.R.; Sedighi, M.; Khorrami, F.; Sobouti, F.; Rafi, Z.; Copley, A.; Jackson, J. Megathrust and accretionary wedge properties and behaviour in the Makran subduction zone. Geophys. J. Int. 2017, 209, 1800–1830. [Google Scholar] [CrossRef]
- Khorrami, F.; Vernant, P.; Masson, F.; Nilfouroushan, F.; Mousavi, Z.; Nankali, H.; Saadat, S.A.; Walpersdorf, A.; Hosseini, S.; Tavakoli, P. An up-to-date crustal deformation map of Iran using integrated campaign-mode and permanent GPS velocities. Geophys. J. Int. 2019, 217, 832–843. [Google Scholar] [CrossRef]
- Ghadimi, H.; Khodaverdian, A.; Zafarani, H. Active deformation in the Makran region using geological, geodetic and stress direction data sets. Geophys. J. Int. 2023, 235, 2556–2580. [Google Scholar] [CrossRef]
- Cheng, G.; Barnhart, W.D.; Small, D. Constraints from GPS measurements on plate-coupling within the Makran Subduction Zone and tsunami scenarios in the Western Indian Ocean. Geophys. J. Int. 2024, 237, 288–301. [Google Scholar] [CrossRef]
- Lin, Y.; Jolivet, R.; Simons, M.; Agram, P.; Martens, H.R.; Li, Z.; Lodi, S. High interseismic coupling in the Eastern Makran (Pakistan) subduction zone. Earth Planet. Sci. Lett. 2015, 420, 116–126. [Google Scholar] [CrossRef]
- Ghods, A.; Bergman, E.; Akbarzadeh Aghdam, M.; Khaledzadehi, M. The Geometry of Makran Subducting Plate as Inferred from Relocated Seismicity Map. In Proceedings of the 9th International Conference on Seismology and Earthquake Engineering, Tehran, Iran, 9 May 2024. [Google Scholar]
- Lv, X.; Amelung, F.; Shao, Y. Widespread aseismic slip along the Makran megathrust triggered by the 2013 Mw 7.7 Balochistan earthquake. Geophys. Res. Lett. 2022, 49, e2021GL097411. [Google Scholar] [CrossRef]
- Akbarzadeh Aghdam, M.; Ghods, A.; Sobouti, F.; Motaghi, K.; Priestley, K.; Enayat, M. Seismicity around the boundary between eastern and western Makran. J. Asian Earth Sci. 2024, 259, 105926. [Google Scholar] [CrossRef]
- Little, R. Terraces of the Makran coast of Iran. In Physical Geography of the Makran Coastal Plain of Iran; University of New Mexico: Albuquerque, NM, USA, 1970; pp. 318–372. [Google Scholar]
- Page, W.D.; Alt, J.N.; Cluff, L.S.; Plafker, G. Evidence for the recurrence of large-magnitude earthquakes along the Makran coast of Iran and Pakistan. Tectonophysics 1979, 52, 533–547. [Google Scholar] [CrossRef]
- Vita-Finzi, C.; Ambraseys, N.N.; Melville, C.P. A History of Persian Earthquakes; Cambridge Earth Science Series; Cambridge University Press: Cambridge, UK, 1982. [Google Scholar]
- Reyss, J.; Pirazzoli, P.; Haghipour, A.; Hatte, C.; Fontugne, M. Quaternary marine terraces and tectonic uplift rates on the south coast of Iran. Geol. Soc. Lond. Spec. Publ. 1999, 146, 225–237. [Google Scholar] [CrossRef]
- Vita-Finzi, C. Neotectonics at the Arabian plate margins. J. Struct. Geol. 2001, 23, 521–530. [Google Scholar] [CrossRef]
- Snead, R.J. Uplifted marine terraces along the Makran coast of Pakistan and Iran. In Himalaya to the theSea; Routledge: London, UK, 1993; pp. 225–246. [Google Scholar]
- Normand, R.; Simpson, G.; Bahroudi, A. Pleistocene coastal evolution in the Makran subduction zone. Front. Earth Sci. 2019, 7, 186. [Google Scholar] [CrossRef]
- Normand, R.; Simpson, G.; Bahroudi, A. Extension at the coast of the Makran subduction zone (Iran). Terra Nova 2019, 31, 503–510. [Google Scholar] [CrossRef]
- Normand, R.; Simpson, G.; Herman, F.; Biswas, R.H.; Bahroudi, A.; Schneider, B. Dating and morpho-stratigraphy of uplifted marine terraces in the Makran subduction zone (Iran). Earth Surf. Dyn. 2019, 7, 321–344. [Google Scholar] [CrossRef]
- Gharibreza, M. Evolutionary trend of paleoshorelines in the Coastal Makran zone (Southeast Iran) since the mid-Holocene. Quat. Int. 2016, 392, 203–212. [Google Scholar] [CrossRef]
- Haghipour, N.; Burg, J.-P.; Ivy-Ochs, S.; Hajdas, I.; Kubik, P.; Christl, M. Correlation of fluvial terraces and temporal steady-state incision on the onshore Makran accretionary wedge in southeastern Iran: Insight from channel profiles and 10Be exposure dating of strath terraces. Bulletin 2015, 127, 560–583. [Google Scholar] [CrossRef]
- Nilforoushan, F.; Masson, F.; Vernant, P.; Vigny, C.; Martinod, J.; Abbassi, M.; Nankali, H.; Hatzfeld, D.; Bayer, R.; Tavakoli, F. GPS network monitors the Arabia-Eurasia collision deformation in Iran. J. Geod. 2003, 77, 411–422. [Google Scholar] [CrossRef]
- Vernant, P.; Nilforoushan, F.; Hatzfeld, D.; Abbassi, M.; Vigny, C.; Masson, F.; Nankali, H.; Martinod, J.; Ashtiani, A.; Bayer, R. Present-day crustal deformation and plate kinematics in the Middle East constrained by GPS measurements in Iran and northern Oman. Geophys. J. Int. 2004, 157, 381–398. [Google Scholar] [CrossRef]
- Apel, E.; Bürgmann, R.; Banerjee, P.; Nagarajan, B. Geodetically Constrained Indian Plate Motion and Implications for Plate Boundary Deformation; AGU Fall Meeting Abstracts: Washington, DC, USA, 2006. [Google Scholar]
- Bayer, R.; Chery, J.; Tatar, M.; Vernant, P.; Abbassi, M.; Masson, F.; Nilforoushan, F.; Doerflinger, E.; Regard, V.; Bellier, O. Active deformation in Zagros—Makran transition zone inferred from GPS measurements. Geophys. J. Int. 2006, 165, 373–381. [Google Scholar] [CrossRef]
- Masson, F.; Anvari, M.; Djamour, Y.; Walpersdorf, A.; Tavakoli, F.; Daignieres, M.; Nankali, H.; Van Gorp, S. Large-scale velocity field and strain tensor in Iran inferred from GPS measurements: New insight for the present-day deformation pattern within NE Iran. Geophys. J. Int. 2007, 170, 436–440. [Google Scholar] [CrossRef]
- Frohling, E.; Szeliga, W. GPS constraints on interplate locking within the Makran subduction zone. Geophys. Suppl. Mon. Not. R. Astron. Soc. 2016, 205, 67–76. [Google Scholar] [CrossRef]
- Palano, M.; Imprescia, P.; Agnon, A.; Gresta, S. An improved evaluation of the seismic/geodetic deformation-rate ratio for the Zagros Fold-and-Thrust collisional belt. Geophys. J. Int. 2018, 213, 194–209. [Google Scholar] [CrossRef]
- Gripp, A.E.; Gordon, R.G. Current plate velocities relative to the hotspots incorporating the NUVEL-1 global plate motion model. Geophys. Res. Lett. 1990, 17, 1109–1112. [Google Scholar] [CrossRef]
- Argus, D.F.; Gordon, R.G. No-net-rotation model of current plate velocities incorporating plate motion model NUVEL-1. Geophys. Res. Lett. 1991, 18, 2039–2042. [Google Scholar] [CrossRef]
- DeMets, C.; Gordon, R.G.; Argus, D.F.; Stein, S. Effect of recent revisions to the geomagnetic reversal time scale on estimates of current plate motions. Geophys. Res. Lett. 1994, 21, 2191–2194. [Google Scholar] [CrossRef]
- Drewes, H. Combination of VLBI, SLR and GPS determined station velocities for actual plate kinematic and crustal deformation models. In Geodesy on the Move: Gravity, Geoid, Geodynamics and Antarctica; Springer: Berlin/Heidelberg, Germany, 1998; pp. 377–382. [Google Scholar]
- Drewes, H.; Angermann, D. The actual plate kinematic and crustal deformation model 2000 (APKIM 2000) as a geodetic reference system. In Proceedings of the IAG 2001 Scientific Assembly, Budapest, Hungary, 2–7 September 2001. [Google Scholar]
- Sella, G.F.; Dixon, T.H.; Mao, A. REVEL: A model for recent plate velocities from space geodesy. J. Geophys. Res. Solid Earth 2002, 107, ETG 11-1–ETG 11-30. [Google Scholar] [CrossRef]
- Kreemer, C.; Holt, W.E.; Haines, A.J. An integrated global model of present-day plate motions and plate boundary deformation. Geophys. J. Int. 2003, 154, 8–34. [Google Scholar] [CrossRef]
- Prawirodirdjo, L.; Bock, Y. Instantaneous global plate motion model from 12 years of continuous GPS observations. J. Geophys. Res. Solid Earth 2004, 109, B8. [Google Scholar] [CrossRef]
- Drewes, H. The actual plate kinematic and crustal deformation model APKIM2005 as basis for a non-rotating ITRF. In Proceedings of the Geodetic Reference Frames: IAG Symposium, Munich, Germany, 9–14 October 2006; pp. 95–99. [Google Scholar]
- Argus, D.F.; Gordon, R.G.; Heflin, M.B.; Ma, C.; Eanes, R.J.; Willis, P.; Peltier, W.R.; Owen, S.E. The angular velocities of the plates and the velocity of Earth’s centre from space geodesy. Geophys. J. Int. 2010, 180, 913–960. [Google Scholar] [CrossRef]
- DeMets, C.; Gordon, R.G.; Argus, D.F. Geologically current plate motions. Geophys. J. Int. 2010, 181, 1–80. [Google Scholar] [CrossRef]
- Abbasi, M.; Ghods, A.; Najafi, M.; Abbasy, S.; Amiri, M.; Shabanian, E.; Kheradmandi, M.; Asgari, J. Why does western Makran have a low seismicity rate? Tectonophysics 2023, 869, 230134. [Google Scholar] [CrossRef]
- Engdahl, E.R.; Villaseñor, A. Global Seismicity: 1900–1999. In International Geophysics; Elsevier: Amsterdam, The Netherlands, 2002; Volume 81, pp. 665–690. [Google Scholar]
- Motaghi, K.; Shabanian, E.; Nozad-Khalil, T. Deep structure of the western coast of the Makran subduction zone, SE Iran. Tectonophysics 2020, 776, 228314. [Google Scholar] [CrossRef]
- Priestley, K.; Sobouti, F.; Mokhtarzadeh, R.; Irandoust, M.A.; Ghods, R.; Motaghi, K.; Ho, T. New constraints for the on-shore Makran Subduction Zone crustal structure. J. Geophys. Res. Solid Earth 2022, 127, e2021JB022942. [Google Scholar] [CrossRef]
- Mousavi, N.; Ardestani, V.E.; Moosavi, N. Slab extension and normal faulting in a low-angle subduction-related environment: An example of the Makran subduction zone (Iran–Pakistan). J. Asian Earth Sci. 2022, 233, 105244. [Google Scholar] [CrossRef]
- Afaghi, A.; Salek, M.M. Geological Map of Iran: Teheran; Sheet no. 6, scale 1:1,000,000; National Iranian Oil Company: Tehran, Iran, 1977. [Google Scholar]
- Dykstra, J.; Birnie, R. Segmentation of the Quaternary subduction zone under the Baluchistan region of Pakistan and Iran. Geodyn. Pak. 1979, 319–323. [Google Scholar]
- White, R.S. Active and passive plate boundaries around the Gulf of Oman, north-west Indian Ocean. Deep. Sea Res. Part A Oceanogr. Res. Pap. 1984, 31, 731–745. [Google Scholar] [CrossRef]
- Farhoudi, G.; Karig, D. Makran of Iran and Pakistan as an active arc system. Geology 1977, 5, 664–668. [Google Scholar] [CrossRef]
- Sengor, A.; Altiner, D.; Cin, A.; Ustaomer, T.; Hsu, K. Origin and assembly of the Tethyside orogenic collage at the expense of Gondwana Land. Geol. Soc. Spec. Publ. 1988, 37, 119–181. [Google Scholar] [CrossRef]
- Smith, Gemma Louise. The Structure, Fluid Distribution and Earthquake Potential of the Makran Subduction Zone, Pakistan. Ph.D. Thesis, University of Southampton, Ocean and Earth Science, Southampton, UK. Available online: https://eprints.soton.ac.uk/359131/ (accessed on 15 June 2024).
- Nasri, S.; Kalate, A.N.; Kahoo, A.R.; Monfared, M.S. New insights into the structural model of the Makran subduction zone by fusion of 3D inverted geophysical models. J. Asian Earth Sci. 2020, 188, 104075. [Google Scholar] [CrossRef]
- Enayat, M.; Ghods, A. 3D Shear-Wave Velocity Model of Central Makran Using Ambient-Noise Adjoint Tomography. J. Geophys. Res. Solid Earth 2023, 128, e2023JB026928. [Google Scholar] [CrossRef]
- Ghorbani, M. A Summary of Geology of Iran. In The Economic Geology of Iran. Springer Geology; Springer: Dordrecht, The Netherlands, 2013. [Google Scholar] [CrossRef]
- Afaghi, A.; Salek, M. Geological Map of Iran, South-Central Iran. Sheet no. 5 (1/1,000,000); National Iranian Oil Company, Exploration and Production: Tehran, Iran, 1977. [Google Scholar]
- Ul-Hadi, S.; Khan, S.D.; Owen, L.A.; Khan, A.S. Geomorphic response to an active transpressive regime: A case study along the Chaman strike-slip fault, western Pakistan. Earth Surf. Process. Landf. 2013, 38, 250–264. [Google Scholar] [CrossRef]
- Shad Manaman, N.; Shomali, H.; Koyi, H. New constraints on upper-mantle S-velocity structure and crustal thickness of the Iranian plateau using partitioned waveform inversion. Geophys. J. Int. 2011, 184, 247–267. [Google Scholar] [CrossRef]
- Abdetedal, M.; Shomali, Z.H.; Gheitanchi, M.R. Ambient noise surface wave tomography of the Makran subduction zone, south-east Iran: Implications for crustal and uppermost mantle structures. Earthq. Sci. 2015, 28, 235–251. [Google Scholar] [CrossRef]
- Abdollahi, S.; Ardestani, V.E.; Zeyen, H.; Shomali, Z.H. Crustal and upper mantle structures of Makran subduction zone, SE Iran by combined surface wave velocity analysis and gravity modeling. Tectonophysics 2018, 747, 191–210. [Google Scholar] [CrossRef]
- Mattei, M.; Cifelli, F.; Muttoni, G.; Zanchi, A.; Berra, F.; Mossavvari, F.; Eshraghi, S.A. Neogene block rotation in central Iran: Evidence from paleomagnetic data. Bulletin 2012, 124, 943–956. [Google Scholar] [CrossRef]
- Walpersdorf, A.; Manighetti, I.; Mousavi, Z.; Tavakoli, F.; Vergnolle, M.; Jadidi, A.; Hatzfeld, D.; Aghamohammadi, A.; Bigot, A.; Djamour, Y. Present-day kinematics and fault slip rates in eastern Iran, derived from 11 years of GPS data. J. Geophys. Res. Solid Earth 2014, 119, 1359–1383. [Google Scholar] [CrossRef]
- Ambraseys, N.N.; Melville, C.P. A History of Persian Earthquakes; Cambridge University Press: Cambridge, UK, 2005. [Google Scholar]
- Abbasi, S.; Motaghi, K.; Lucente, F.P.; Bianchi, I. Low-strength shear zone in the western Makran subduction zone, southeastern Iran: Insights from a receiver function analysis. Geophys. J. Int. 2024, 237, 64–74. [Google Scholar] [CrossRef]
- Pacheco, J.F.; Sykes, L.R.; Scholz, C.H. Nature of seismic coupling along simple plate boundaries of the subduction type. J. Geophys. Res. Solid Earth 1993, 98, 14133–14159. [Google Scholar] [CrossRef]
- Dziewonski, A.M.; Chou, T.A.; Woodhouse, J.H. Determination of earthquake source parameters from waveform data for studies of global and regional seismicity. J. Geophys. Res. Solid Earth 1981, 86, 2825–2852. [Google Scholar] [CrossRef]
- Ekström, G.; Nettles, M.; Dziewoński, A. The global CMT project 2004–2010: Centroid-moment tensors for 13,017 earthquakes. Phys. Earth Planet. Inter. 2012, 200, 1–9. [Google Scholar] [CrossRef]
- Engdahl, E.R.; van der Hilst, R.; Buland, R. Global teleseismic earthquake relocation with improved travel times and procedures for depth determination. Bull. Seismol. Soc. Am. 1998, 88, 722–743. [Google Scholar] [CrossRef]
- Laane, J.L.; Chen, W.-P. The Makran earthquake of 1983 April 18: A possible analogue to the Puget Sound earthquake of 1965? Geophys. J. Int. 1989, 98, 1–9. [Google Scholar] [CrossRef]
- Baker, C. The Active Seismicity and Tectonics of Iran; University of Cambridge: Cambridge, UK, 1993. [Google Scholar]
- Maggi, A.; Jackson, J.; Priestley, K.; Baker, C. A re-assessment of focal depth distributions in southern Iran, the Tien Shan and northern India: Do earthquakes really occur in the continental mantle? Geophys. J. Int. 2000, 143, 629–661. [Google Scholar] [CrossRef]
- Walker, R.T. Active Faulting and Tectonics of Eastern Iran; University of Cambridge: Cambridge, UK, 2003. [Google Scholar]
- Engdahl, E.R.; Jackson, J.A.; Myers, S.C.; Bergman, E.A.; Priestley, K. Relocation and assessment of seismicity in the Iran region. Geophys. J. Int. 2006, 167, 761–778. [Google Scholar] [CrossRef]
- Jackson, J.; Bouchon, M.; Fielding, E.; Funning, G.; Ghorashi, M.; Hatzfeld, D.; Nazari, H.; Parsons, B.; Priestley, K.; Talebian, M. Seismotectonic, rupture process, and earthquake-hazard aspects of the 2003 December 26 Bam, Iran, earthquake. Geophys. J. Int. 2006, 166, 1270–1292. [Google Scholar] [CrossRef]
- Nissen, E.; Yamini-Fard, F.; Tatar, M.; Gholamzadeh, A.; Bergman, E.; Elliott, J.; Jackson, J.; Parsons, B. The vertical separation of mainshock rupture and microseismicity at Qeshm island in the Zagros fold-and-thrust belt, Iran. Earth Planet. Sci. Lett. 2010, 296, 181–194. [Google Scholar] [CrossRef]
- Nissen, E.; Tatar, M.; Jackson, J.A.; Allen, M.B. New views on earthquake faulting in the Zagros fold-and-thrust belt of Iran. Geophys. J. Int. 2011, 186, 928–944. [Google Scholar] [CrossRef]
- Talebian, M.; Biggs, J.; Bolourchi, M.; Copley, A.; Ghassemi, A.; Ghorashi, M.; Hollingsworth, J.; Jackson, J.; Nissen, E.; Oveisi, B. The Dahuiyeh (Zarand) earthquake of 2005 February 22 in central Iran: Reactivation of an intramountain reverse fault. Geophys. J. Int. 2006, 164, 137–148. [Google Scholar] [CrossRef]
- Walker, R.; Bergman, E.; Elliott, J.; Fielding, E.; Ghods, A.-R.; Ghoraishi, M.; Jackson, J.; Nazari, H.; Nemati, M.; Oveisi, B. The 2010–2011 South Rigan (Baluchestan) earthquake sequence and its implications for distributed deformation and earthquake hazard in southeast Iran. Geophys. J. Int. 2013, 193, 349–374. [Google Scholar] [CrossRef]
- Barnhart, W.D.; Hayes, G.P.; Samsonov, S.V.; Fielding, E.J.; Seidman, L.E. Breaking the oceanic lithosphere of a subducting slab: The 2013 Khash, Iran earthquake. Geophys. Res. Lett. 2014, 41, 32–36. [Google Scholar] [CrossRef]
- Jolivet, R.; Duputel, Z.; Riel, B.; Simons, M.; Rivera, L.; Minson, S.; Zhang, H.; Aivazis, M.; Ayoub, F.; Leprince, S. The 2013 M w 7.7 Balochistan earthquake: Seismic potential of an accretionary wedge. Bull. Seismol. Soc. Am. 2014, 104, 1020–1030. [Google Scholar] [CrossRef]
- Penney, C.; Copley, A.; Oveisi, B. Subduction tractions and vertical axis rotations in the Zagros–Makran transition zone, SE Iran: The 2013 May 11 M w 6.1 Minab earthquake. Geophys. J. Int. 2015, 202, 1122–1136. [Google Scholar] [CrossRef]
- Jackson, J.; McKenzie, D. Active tectonics of the Alpine—Himalayan Belt between western Turkey and Pakistan. Geophys. J. Int. 1984, 77, 185–264. [Google Scholar] [CrossRef]
- Gaetani, M.; Angiolini, L.; Nicora, A.; Sciunnach, D.; Le Fort, P.; Tanoli, S.; Khan, A. Reconnaissance geology in upper Chitral, Baroghil and Karambar districts (northern Karakorum, Pakistan). Geol. Rundsch. 1996, 85, 683–704. [Google Scholar] [CrossRef]
- Foster Flint, R. Glacial and Quaternary Geology; John Wiley: New York, NY, USA, 1971. [Google Scholar]
- Clark, J.A. Global Sea Level Changes since the Last Glacial Maximum and Sea Level Constraints on the Ice Sheet Disintegration History. Ph. D. Thesis, University of Colorado Boulder, Boulder, CO, USA, 1977. [Google Scholar]
- Berberian, M.; Papastamatiou, D. Khurgu (north Bandar Abbas, Iran) earthquake of March 21, 1977: A preliminary field report and a seismotectonic discussion. Bull. Seismol. Soc. Am. 1978, 68, 411–428. [Google Scholar] [CrossRef]
- Ellouz-Zimmermann, N.; Deville, E.; Müller, C.; Lallemant, S.; Subhani, A.B.; Tabreez, A.R. Impact of Sedimentation on Convergent Margin Tectonics: Example of the Makran Accretionary Prism (Pakistan); Springer: Berlin/Heidelberg, Germany, 2007; pp. 327–350. [Google Scholar]
- Burg, J.-P. Geology of the onshore Makran accretionary wedge: Synthesis and tectonic interpretation. Earth Sci. Rev. 2018, 185, 1210–1231. [Google Scholar] [CrossRef]
- Haghipour, N.; Burg, J.-P. Geomorphological analysis of the drainage system on the growing Makran accretionary wedge. Geomorphology 2014, 209, 111–132. [Google Scholar] [CrossRef]
- Altamimi, Z.; Rebischung, P.; Métivier, L.; Collilieux, X. ITRF2014: A new release of the International Terrestrial Reference Frame modeling nonlinear station motions. J. Geophys. Res. Solid Earth 2016, 121, 6109–6131. [Google Scholar] [CrossRef]
- Kreemer, C.; Blewitt, G.; Klein, E.C. A geodetic plate motion and Global Strain Rate Model. Geochem. Geophys. Geosystems 2014, 15, 3849–3889. [Google Scholar] [CrossRef]
- Berberian, M.; Jackson, J.; Qorashi, M.; Khatib, M.; Priestley, K.; Talebian, M.; Ghafuri-Ashtiani, M. The 1997 May 10 Zirkuh (Qa’enat) earthquake (M w 7.2): Faulting along the Sistan suture zone of eastern Iran. Geophys. J. Int. 1999, 136, 671–694. [Google Scholar] [CrossRef]
- Nowroozi, A.A.; Mohajer-Ashjai, A. Fault movements and tectonics of eastern Iran: Boundaries of the Lut plate. Geophys. J. Int. 1985, 83, 215–237. [Google Scholar] [CrossRef]
- Walker, R.; Jackson, J. Active tectonics and late Cenozoic strain distribution in central and eastern Iran. Tectonics 2004, 23. [Google Scholar] [CrossRef]
- Mostafazadeh, M.; Mahshadnia, L. Investigation of Seismic Stress Changes in the Makran Subduction Zone. J. Seismol. Earthq. Eng. 2021, 23, 9–30. [Google Scholar] [CrossRef]
- Sabahi, M.; Khatib, M.M.; Djamour, Y. Spatial and temporal changes of b-value, fractal analysis and stress tensor inversion in the Sistan and Makran zones, Eastern and Southeastern Iran. J. Asian Earth Sci. 2024, 264, 106038. [Google Scholar] [CrossRef]
- Pourbeyranvand, S.; Shomali, Z.H. Determination of stress tensor based on Inversion of earthquake focal mechanisms and implementation in Makran region. Iran. J. Geophys. 2012, 6, 1–19. [Google Scholar]
- Farbod, Y.; Bellier, O.; Shabanian, E.; Abbassi, M.R. Geomorphic and structural variations along the Doruneh Fault System (central Iran). Tectonics 2011, 30, 6. [Google Scholar] [CrossRef]
- Rashidi, A.; Kianimehr, H.; Yamini-Fard, F.; Tatar, M.; Zafarani, H. Present stress map and deformation distribution in the NE Lut Block, eastern Iran: Insights from seismic and geodetic strain and moment rates. Pure Appl. Geophys. 2022, 179, 1887–1917. [Google Scholar] [CrossRef]
- Entezar-Saadat, V.; Motavalli-Anbaran, S.-H.; Zeyen, H. Lithospheric structure of the Eastern Iranian plateau from integrated geophysical modeling: A transect from Makran to the Turan platform. J. Asian Earth Sci. 2017, 138, 357–366. [Google Scholar] [CrossRef]
- Kundu, B.; Nankali, H.; Malik, P.; Yadav, R.; Gahalaut, V. Coseismic offsets due to intermediate depth 16 April 2013 southeast Iran earthquake (M w 7.8). Bull. Seismol. Soc. Am. 2014, 104, 1562–1566. [Google Scholar] [CrossRef]


Disclaimer/Publisher’s Note: The statements, opinions and data contained in all publications are solely those of the individual author(s) and contributor(s) and not of MDPI and/or the editor(s). MDPI and/or the editor(s) disclaim responsibility for any injury to people or property resulting from any ideas, methods, instructions or products referred to in the content. |
© 2024 by the authors. Licensee MDPI, Basel, Switzerland. This article is an open access article distributed under the terms and conditions of the Creative Commons Attribution (CC BY) license (https://creativecommons.org/licenses/by/4.0/).