Article

Biogenic Origin of Fe-Mn Crusts from Hydrothermal Fields of the Mid-Atlantic Ridge, Puy de Folles Volcano Region

by
Elena S. Sergienko
1,2,*,
Elena R. Tarakhovskaya
1,3,
Oleg V. Rodinkov
1,
Svetlana Yu. Yanson
1,
Dmitrii V. Pankin
1,
Valery S. Kozlov
4,
Kamil G. Gareev
2,5,
Alexander N. Bugrov
6 and
Petr V. Kharitonskii
2
1
Saint Petersburg State University, 199034 Saint Petersburg, Russia
2
Ioffe Institute, 194064 Saint Petersburg, Russia
3
Vavilov Institute of General Genetics, Saint Petersburg Branch, Russian Academy of Sciences, 199034 Saint Petersburg, Russia
4
Petersburg Nuclear Physics Institute Named by B.P. Konstantinov of National Research Centre “Kurchatov Institute”, 188300 Gatchina, Russia
5
Department of Micro and Nanoelectronics, Saint Petersburg Electrotechnical University “LETI”, 197022 Saint Petersburg, Russia
6
Department of Physical Chemistry, Saint Petersburg Electrotechnical University “LETI”, 197022 Saint Petersburg, Russia
*
Author to whom correspondence should be addressed.
Geosciences 2024, 14(9), 240; https://doi.org/10.3390/geosciences14090240
Submission received: 26 July 2024 / Revised: 21 August 2024 / Accepted: 3 September 2024 / Published: 6 September 2024
(This article belongs to the Special Issue Geochemistry in the Development of Geothermal Resources)

Abstract

:
Ferromanganese formations are widespread in the Earth’s aquatic environment. Of all the mechanisms of their formation, the biogenic one is the most debatable. Here, we studied the Fe-Mn crusts of hydrothermal fields near the underwater volcano Puy de Folles (rift valley of the Mid-Atlantic Ridge). The chemical and mineralogical composition (optical and electron microscopy with EDX, X-ray powder diffraction, X-ray fluorescence analysis, Raman and FTIR spectroscopy, gas chromatography—mass spectrometry (GC-MS)) and the magnetic properties (static and resonance methods, including at cryogenic temperatures) of the samples of Fe-Mn crusts were investigated. In the IR absorption spectra, based on hydrogen bond stretching vibrations, it was concluded that there were compounds with aliphatic (alkane) groups as well as compounds with double bonds (possibly with a benzene ring). The GC-MS analysis showed the presence of alkanes, alkenes, hopanes, and steranes. Magnetically, the material is highly coercive; the blocking temperatures are 3 and 13 K. The main carriers of magnetism are ultrafine particles and X-ray amorphous matter. The analysis of experimental data allows us to conclude that the studied ferromanganese crusts, namely in their ferruginous phase, were formed as a result of induced biomineralization with the participation of iron-oxidizing and iron-reducing bacteria.

1. Introduction

Ferromanganese formations (FMF, Fe-Mn) are ubiquitous in both aquatic environments (from oceans to small lakes) and soils.
In the aquatic environment, the formation and growth of FMF occurs in a complex interrelated system of hydrodynamic, physicochemical, and microbiological processes in the water-bottom boundary zone [1,2]. Combinations of the main Fe-Mn morphological types are widespread here: nodules, crusts, and outgrowths, as well as strata and lenticular deposits [3,4,5,6,7,8,9].
To date, several processes responsible for the origin of FMF have been established: sedimentation (terrigenous, chemogenic, and biogenic), hydrothermal, and halmyrolytic. Moreover, the formation mechanisms are often mixed. The most controversial of them is considered to be the biogenic mechanism, since existing technologies do not give an unambiguous answer about the nature of this process [10]. It is based on different geochemical behavior of metal ions during their interaction with microorganisms.
The idea of potential biological involvement in the genesis of ferromanganese nodules and crusts dates back to the 1920s [11]. Studies have revealed the significant influence of biomineralization processes on the formation and growth of these deposits in various marine environments, especially in the Arctic and deep-sea regions [10,12,13]. To date, two approaches to obtaining conclusive evidence for the biogenic hypothesis have been emphasized. The first approach is the detection of visually distinguishable microorganisms (identified by in situ analysis) and high-resolution microscopic studies [14,15,16,17,18,19,20]. Thus, a study of the FMF of the South China Sea and the Pacific Ocean by microscopic and X-ray methods showed that the microfossils present in these rocks are represented by various types of diatom algae, coccoliths, and bacteria [21,22]. Biosilica/calcite skeletons and biofilms may have served as matrices for mineral deposition. The authors [21,22] suggested that the activity of microorganisms and chemical oxidation could simultaneously lead to the formation of Fe-Mn nodules and crusts, and the contribution of microorganisms could be predominant.
The second approach is DNA sequencing of microorganisms inhabiting Fe-Mn formations. Microbial mats and biosignatures play a significant role in mineralization processes, contributing to the formation of rhythmic-zonal iron–manganese deposits [10]. Microbial communities with specific taxa involved in metal oxidation and reduction processes have been identified in low-temperature Fe-, Si-, and Mn-rich hydrothermal fields. In addition, microbial diversity in Arctic ferromanganese deposits is characterized by positive selection of metal-reducing, iron-oxidizing, and iron-uptake taxa, indicating unique redox micro-niches within nodules [23]. A study reporting microbial diversity in Fe-Mn substrates from the deep Atlantic Ocean was conducted in samples collected from the Rio Grande Rise uplands [24]. This study showed that the Fe-Mn field of the Rio Grande Rise crust contains a unique deep-sea microbiome. The microbial communities show differences depending on the location and depth of sampling, influenced by circulation and water composition and the presence of organic matter.
Despite significant progress in the study of the biogenic origin of Fe-Mn formations, this issue remains a matter of debate. In particular, it remains unclear how much of a role biogenic versus abiogenic processes play. Thus, some studies (e.g., [25]) suggest that chemical deposition from seawater is significantly dominant, while other works (e.g., [10]) show that microorganisms play a key role in the formation of ore deposits, particularly Fe-Mn rocks. In general, it can be concluded that the exact mechanisms and the extent of their involvement in the origin of Fe-Mn formations are not fully understood, indicating the need for more detailed studies to unravel these processes [26].
In this paper, Fe-Mn crust samples from hydrothermal zones in the area of the submarine volcano Puy de Folles, rift valley of the Mid-Atlantic Ridge (hereafter, abbreviated as Fe-Mn Puy de Folles) were investigated. Rift valleys of mid-ocean ridges play a crucial role in bottom topography, representing the spreading axes along which the oceanic crust is formed [27]. These areas are characterized by high heat flow, increased seismicity, and intense magmatism. All this contributes to the creation of a new oceanic crust [28]. Hydrothermal activity characterized by “black smokers” occurs on ridge axes, with temperatures ranging from 2–4 °C to several hundred degrees Celsius. In particular, the hydrothermal systems of the Mid-Atlantic Ridge have temperatures of 290–350 °C [29]. Studies have shown that hydrothermal activity occurs not only near the ridge but can extend up to 10 km from its axis. The chemical exchange between seawater and new oceanic crusts in these regions is facilitated by hydrothermal circulation [30,31,32,33]. Thus, unique conditions are created there for the formation of mineral associations and biological communities [34,35]. Biomineralization processes are active in these areas, in which microorganisms play a crucial role in the formation of minerals such as iron oxyhydroxides and silicates [36].
This paper presents a different approach to solving the problem of the biogenic origin of FMF. The evidence is based on a study of the specific magnetic properties of Fe-Mn crusts and analysis of organic matter extracted from them. These experiments are preceded by a detailed study of the morphology and the chemical and mineral composition of the samples.

2. Materials and Methods

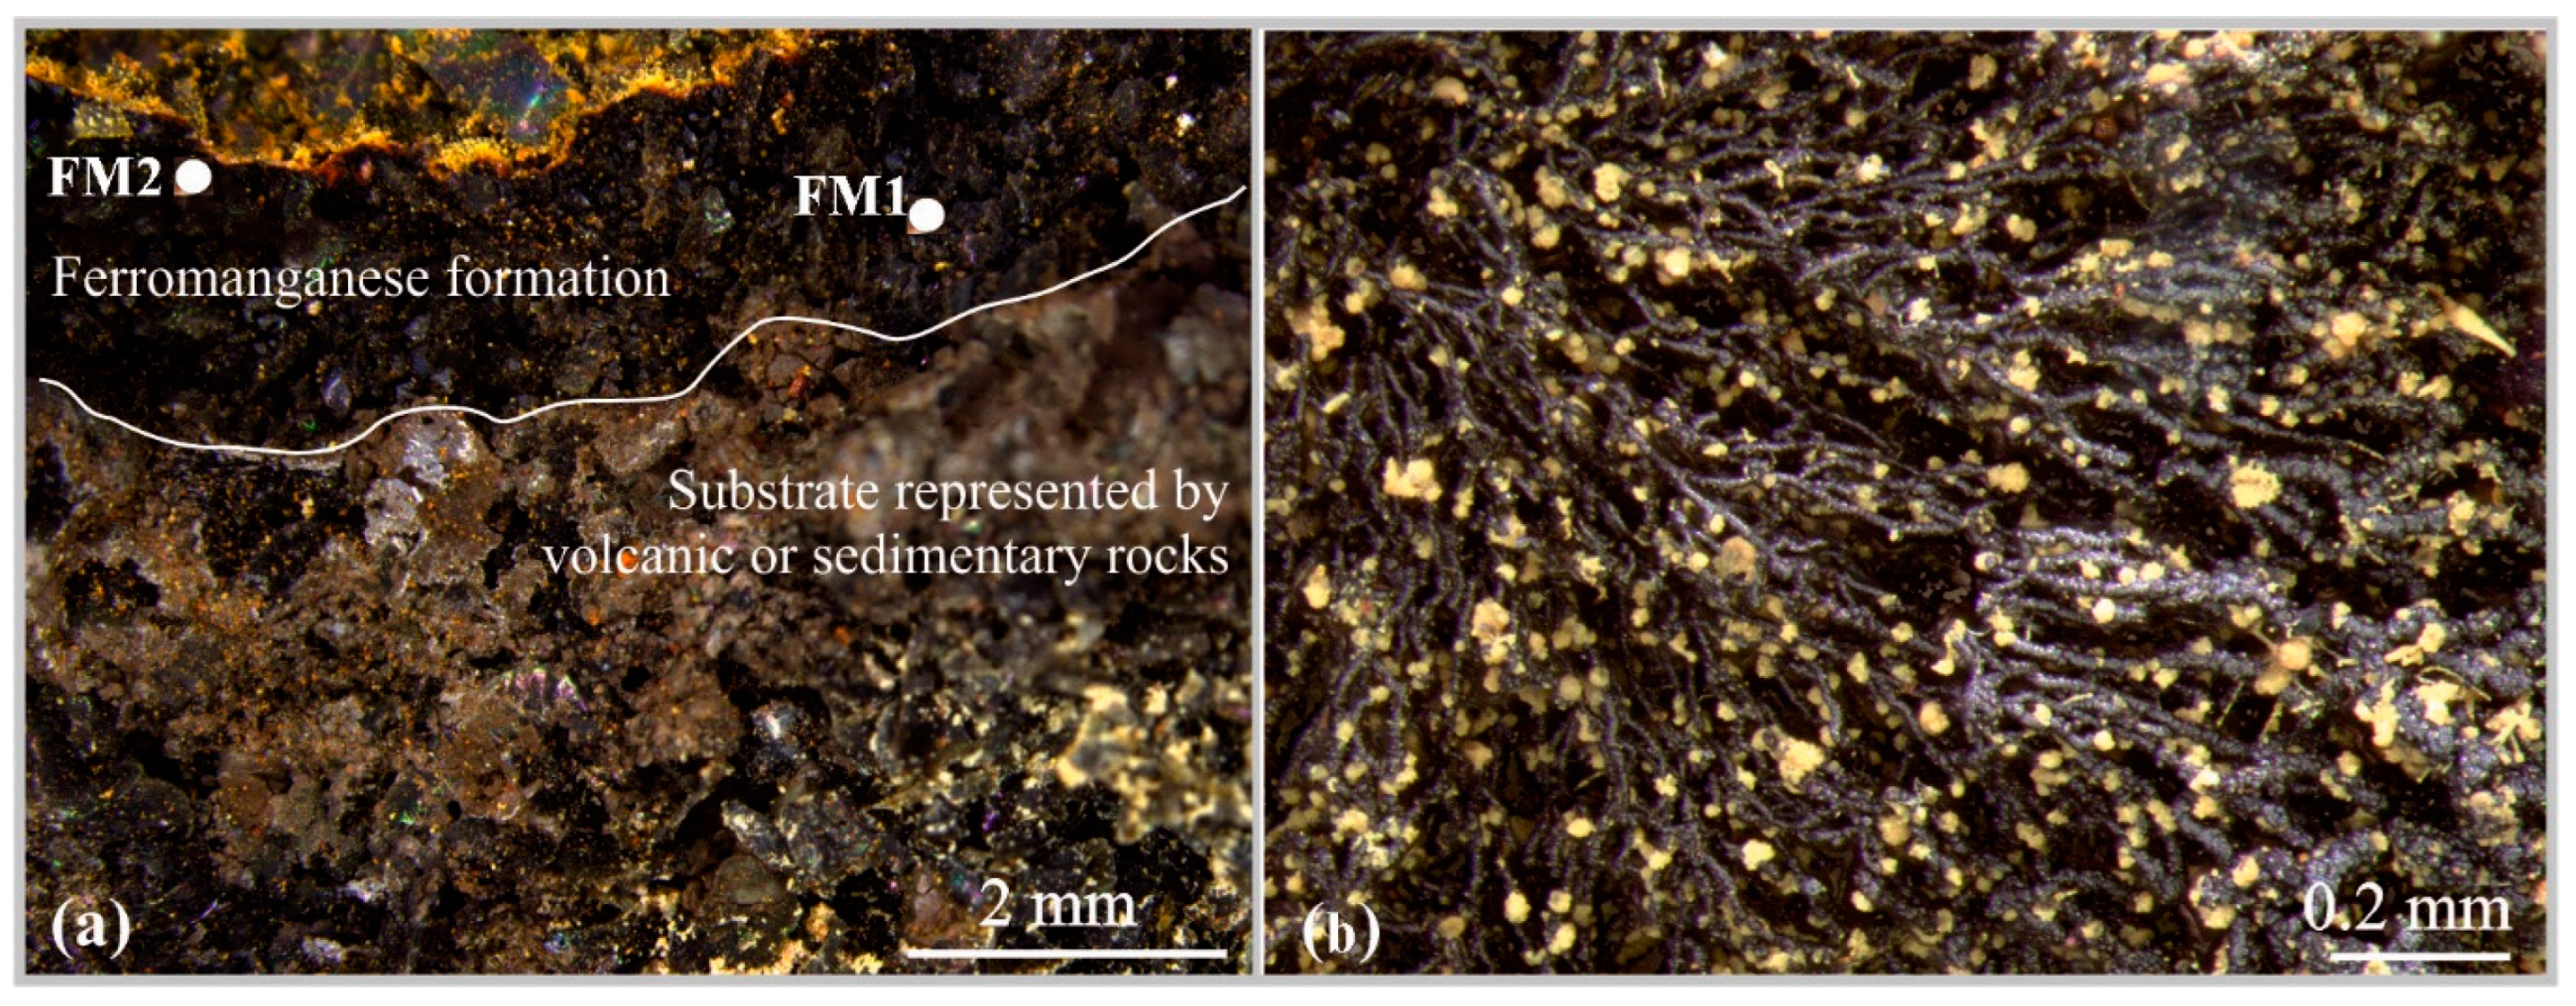
2.1. Ferromanganese Crust: Samples and Sample Location

Iron–manganese crusts (Figure 1b) were sampled in 2023 in the area of the Puy de Folles submarine volcano in the Russian exploration region (RER) of the Mid-Atlantic Ridge (MAR) rift valley (Figure 1a) during the expedition of the research vessel Professor Logachev. Multiple degassing channels are visible in the sampling area, confirming modern hydrothermal activity (Figure 1c,d). The age of the studied samples corresponds to the modern stage of hydrothermal activity [37].
Geologic sampling was conducted using a box sampler, TV grab, and rock dredge. Directly on the deck of the ship, the crusts were packed in such a way as to restrict access to oxygen. In the laboratory, the samples were broken apart and samples for research were taken from the inside of the crusts and placed in Eppendorf tubes. All necessary precautions were taken to avoid additional oxidation of the crust substance and minimize the introduction of laboratory contamination.

2.2. Optical Microscopy

Images of the samples were obtained using a Leica M205 C stereomicroscope (Leica, Mannheim, Germany) in reflected light mode with a magnification of 7.8–1280×.

2.3. Scanning Electron Microscopy (SEM), Energy-Dispersive X-ray Spectroscopy (EDS)

Electron microscopic studies were performed on a QUANTA 200 3D focused electron and ion probe system (FEI, Eindhoven, The Netherlands) and a Pegasus 4000 analytical system (EDAX Corporation, Mahwah NJ, USA). A Zeiss Merlin scanning electron microscope (Zeiss, Oberkochen, Germany) with a field emission cathode and an INCAx-act 5 X-ray microanalysis attachment (Oxford Instruments, Oxfordshire, UK) was used. SEM images were acquired from polished and bulk samples in reflected and secondary electron modes. Electron probe microanalyses were performed under high-vacuum conditions. Analytical spectra and distribution maps of chemical elements were obtained from the polished surface of the carbon-coated sample at accelerating voltages of 15 and 20 kV. The results of the EDX analysis were calculated using compound and pure element standards. Distribution maps of chemical elements were made with standardless method. The error of the method when analyzing from a polished surface is up to 0.1 wt %; when analyzing from a volumetric sample, it is 1 wt % or more.

2.4. Methods of Analyzing the Composition of Matter

X-ray diffraction (XRD) to determine the mineral composition of crust samples was performed on a benchtop powder diffractometer with a copper anode Bruker D2 Phaser (Bruker, Billerica, MA, USA) and on a diffractometer with a chromium anode XRD-9510 (Ekroshim, St. Petersburg, Russia). The phases were identified using the PDF-2 database (International Center for Diffraction Data, 2011). The quantitative phase composition was calculated by the Rietveld method in the Profex program [38]. To evaluate the amorphous phase content, the sample was mixed with well-oxygenated α-Al2O3 at a ratio of 1:1 by weight, and quantitative phase analysis was performed with an internal standard.
The elemental composition of the crusts was determined by X-ray fluorescence (XRF) on an energy-dispersive X-ray fluorescence spectrometer EDX-800P (Shimadzu, Kyoto, Japan) based on silicon drift detectors with thermoelectric cooling.
Raman spectra were obtained using a Raman spectrometer Senterra (Bruker, Billerica, MA, USA) in backscattering geometry. In this device, the spectrometer part is conjugated with an Olympus BX 51 microscope. Moreover, with the aid of a precise motorized stage, it is possible to obtain information from several-micrometer-sized areas in the focal plane. The solid-state lasers with 532 and 785 nm wavelengths were used to excite Raman scattering. The laser radiation was focused via 20× objective with 0.4 numerical aperture. The actual laser power under the objective was 0.06 and 0.1 mW for the 532 and 785 nm lasers, correspondingly. The spectra acquisition was performed with 400 L/mm diffraction grating. The rectangular aperture was 25 × 1000 μm. The detector was a silicon CCD camera with Peltier cooling. In the case of the 785 nm laser excitation, the actual spectral region was 80–3700 cm−1; in the case of the 532 nm laser excitation, the actual spectral region was 45–4400 cm−1. The accumulation time was 150 s with 6–10 repetitions. For clarity, the piecewise linear baseline correction was performed with [0, 1] spectra normalization. The spectra were processed using OriginPro2021b (9.85) software (OriginLab Co., Northampton, MA, USA). For this analytical method, the reproducibility of the results obtained was confirmed by examining 16 areas with dark and orange colors for each sample by Raman spectroscopy.
In the MIR region, the absorbance spectra were obtained with a Nicolet 8700 FTIR spectrometer (Thermo Fisher Scientific; Waltham, MA, USA) with attenuated total reflectance (ATR) accessory. The ATR crystal was diamond. The absorbance spectra were obtained in the 650–4000 cm−1 region. The spectral resolution was 4 cm−1. An MCT-A detector with liquid nitrogen cooling was used. The aperture was 80%. The number of scans was 150 items. The Blackman–Harris apodizing apodization function [39] and phase correction according to the Mertz method [40] were used. For this method, the reproducibility of the results obtained was confirmed by examining 30 particles from each sample by FTIR spectroscopy.

2.5. Extraction of Organic Compounds

The most common method for the extraction of organic compounds from geological samples is liquid–liquid extraction [41]. The traditional Soxhlet apparatus, although widely used, has a number of limitations, particularly in terms of time efficiency and suitability for low-volatility organic compounds. In addition, Soxhlet extraction is not considered a “green” method due to the high consumption of hazardous and flammable solvents such as toluene. Currently, the so-called QuEChERS technique (from “Quick, Easy, Cheap, Effective, Rugged, Safe”), which involves the use of an organic extractant to extract analytes in a centrifuge tube followed by purification of the extract, is increasingly used. Ultrasound is often used to intensify the extraction process [42].
For the extraction of organic compounds, 200 mg of powder obtained by grinding the crusts under study were placed in 10 mL glass centrifuge tubes, and 5 mL of organic extractant was added. The tubes were sealed with glass stoppers and shaken vigorously by hand for 2 min. Then, the tubes were subjected to ultrasound with a power of 180 W and a frequency of 40 kHz for 20 min at a temperature of 45 °C in an ultrasonic bath 6DT (Stegler, China). Next, the organic extract was separated from the sample solids by centrifugation on a CM-12 laboratory centrifuge (Tagler, Moscow, Russia) at 5000 min−1 for 5 min. The clear supernatant was passed through a 0.45 μm pore-size filter to purify from sample microparticles. The described sample preparation procedure is now generally accepted for the analysis of soil and sediment samples [43,44,45,46]. For screening assessment of the total concentration of organic compounds in the extract and expediency of further analysis, the optical density of the extract relative to the pure extractant was measured in the near-ultraviolet region of the spectrum on a UVmini-1240 single-beam spectrophotometer (Shimadzu, Kyoto, Japan). The optical density was measured at λ = 254 nm, which is transmitted by all selected extractants. The theoretical justification for the optimal conditions for the extraction of analytes from various objects is given, for example, in the IUPAC report [47]. The selected extractant should dissolve analytes well and be suitable, first of all, for further chromatographic analysis. Taking into account that organic compounds with different polarities may be present in the crusts under study, we investigated 5 solvents with different polarities suitable for subsequent GC-MS analysis as extractants. The relative dielectric constant ε of the extractants was taken as a measure of polarity.

2.6. GC-MS Analysis

Samples of organic material extracted from the Fe-Mn crusts were transferred to glass vial micro-inserts and subjected to GC-MS analysis on a GCMS-QP2010 Ultra gas chromatograph–mass spectrometer (Shimadzu, Duisburg, Germany) with standard electron impact ionization (70 eV). Separation was accomplished on a MEGA-5MS capillary column (MEGA S.r.l., Legnano, Italy; 30 m × 0.32 mm ID and 0.25 µm film) at 2.5 mL/min carrier gas flow (He 6.0) after splitless injection at 280 °C. The temperature regime was as follows: initial temperature of 40 °C was kept for 1 min, then increased at 10 °C/min to 300 °C and kept for 9 min. The temperature of the ion source was 250 °C. Peak deconvolution was accomplished using AMDIS 2.66. GMD (Golm metabolome database, GMD_20100614_VAR5_ALK [48] and NIST14 (National Institute of Standards and Technology, Gaithersburg, MD, USA) were used for identification of the peaks based on spectra comparison.

2.7. Static Methods of Magnetometry

To clarify the types of iron-bearing minerals, the field dependencies of magnetization (hysteresis loops and breakdown curves of residual magnetization obtained in the maximum achievable field) were measured. To clarify the type of carriers of residual magnetization (SIRM), its temperature dependences in the range of 2–300 K were measured according to the following scheme: (i) measurement of LT-SIRM created in the 5 T field during heating at initial cooling in zero field, ZFC; (ii) measurement of LT-SIRM created in the 5 T field during heating at initial cooling in the presence of field, FC; and (iii) measurement of SIRM created in the 5 T field in the cooling–heating cycle, RT-SIRM. Temperature dependences of the LT-SIM inductive magnetization in the heating–cooling cycle (FC-ZFC) in the range of 1.8–300 K in a 10 mT field were also measured.
For magnetic measurements, we used the following: (1) a complex for automated measurements of magnetic properties of materials in a wide range of magnetic fields and temperatures MPMS SQUID VSM (Quantum Design, San Diego, CA, USA); measurement of magnetic moment in the temperature range of 1.8–1000 K; magnetic field magnitude of up to ±7 T; sensitivity of 10−11 A·m2 at 0 T; (2) Lake Shore 7410 vibrating magnetometer (LakeShore Cryotronics, Inc., Westerville, OH, USA); magnetic moment measurement in the temperature range of 4.4–450 K; magnetic field magnitude of up to ±1.8 T; sensitivity of 10−8 A·m2 at 0 T.

2.8. Resonance Methods of Magnetometry

Mössbauer spectra of Fe-Mn crust samples were recorded on a Wissel spectrometer (WissEl, Starnberg, Germany) in the constant acceleration mode with a 57Co (Rh) source at an absorber temperature of 300 K in the velocity range ±12 mm/s and the velocity range ±4.5 mm/s. Isomeric shifts and velocity scale calibration were performed relative to a commonly used α-Fe standard. Mössbauer spectra were processed in the MOSSFIT program assuming a Lorentzian line shape. The samples were prepared by pressing a certain amount of the investigated substance with a neutral filler (powdered sugar) in the form of tablets with a thickness of about 0.7 mm.

3. Results

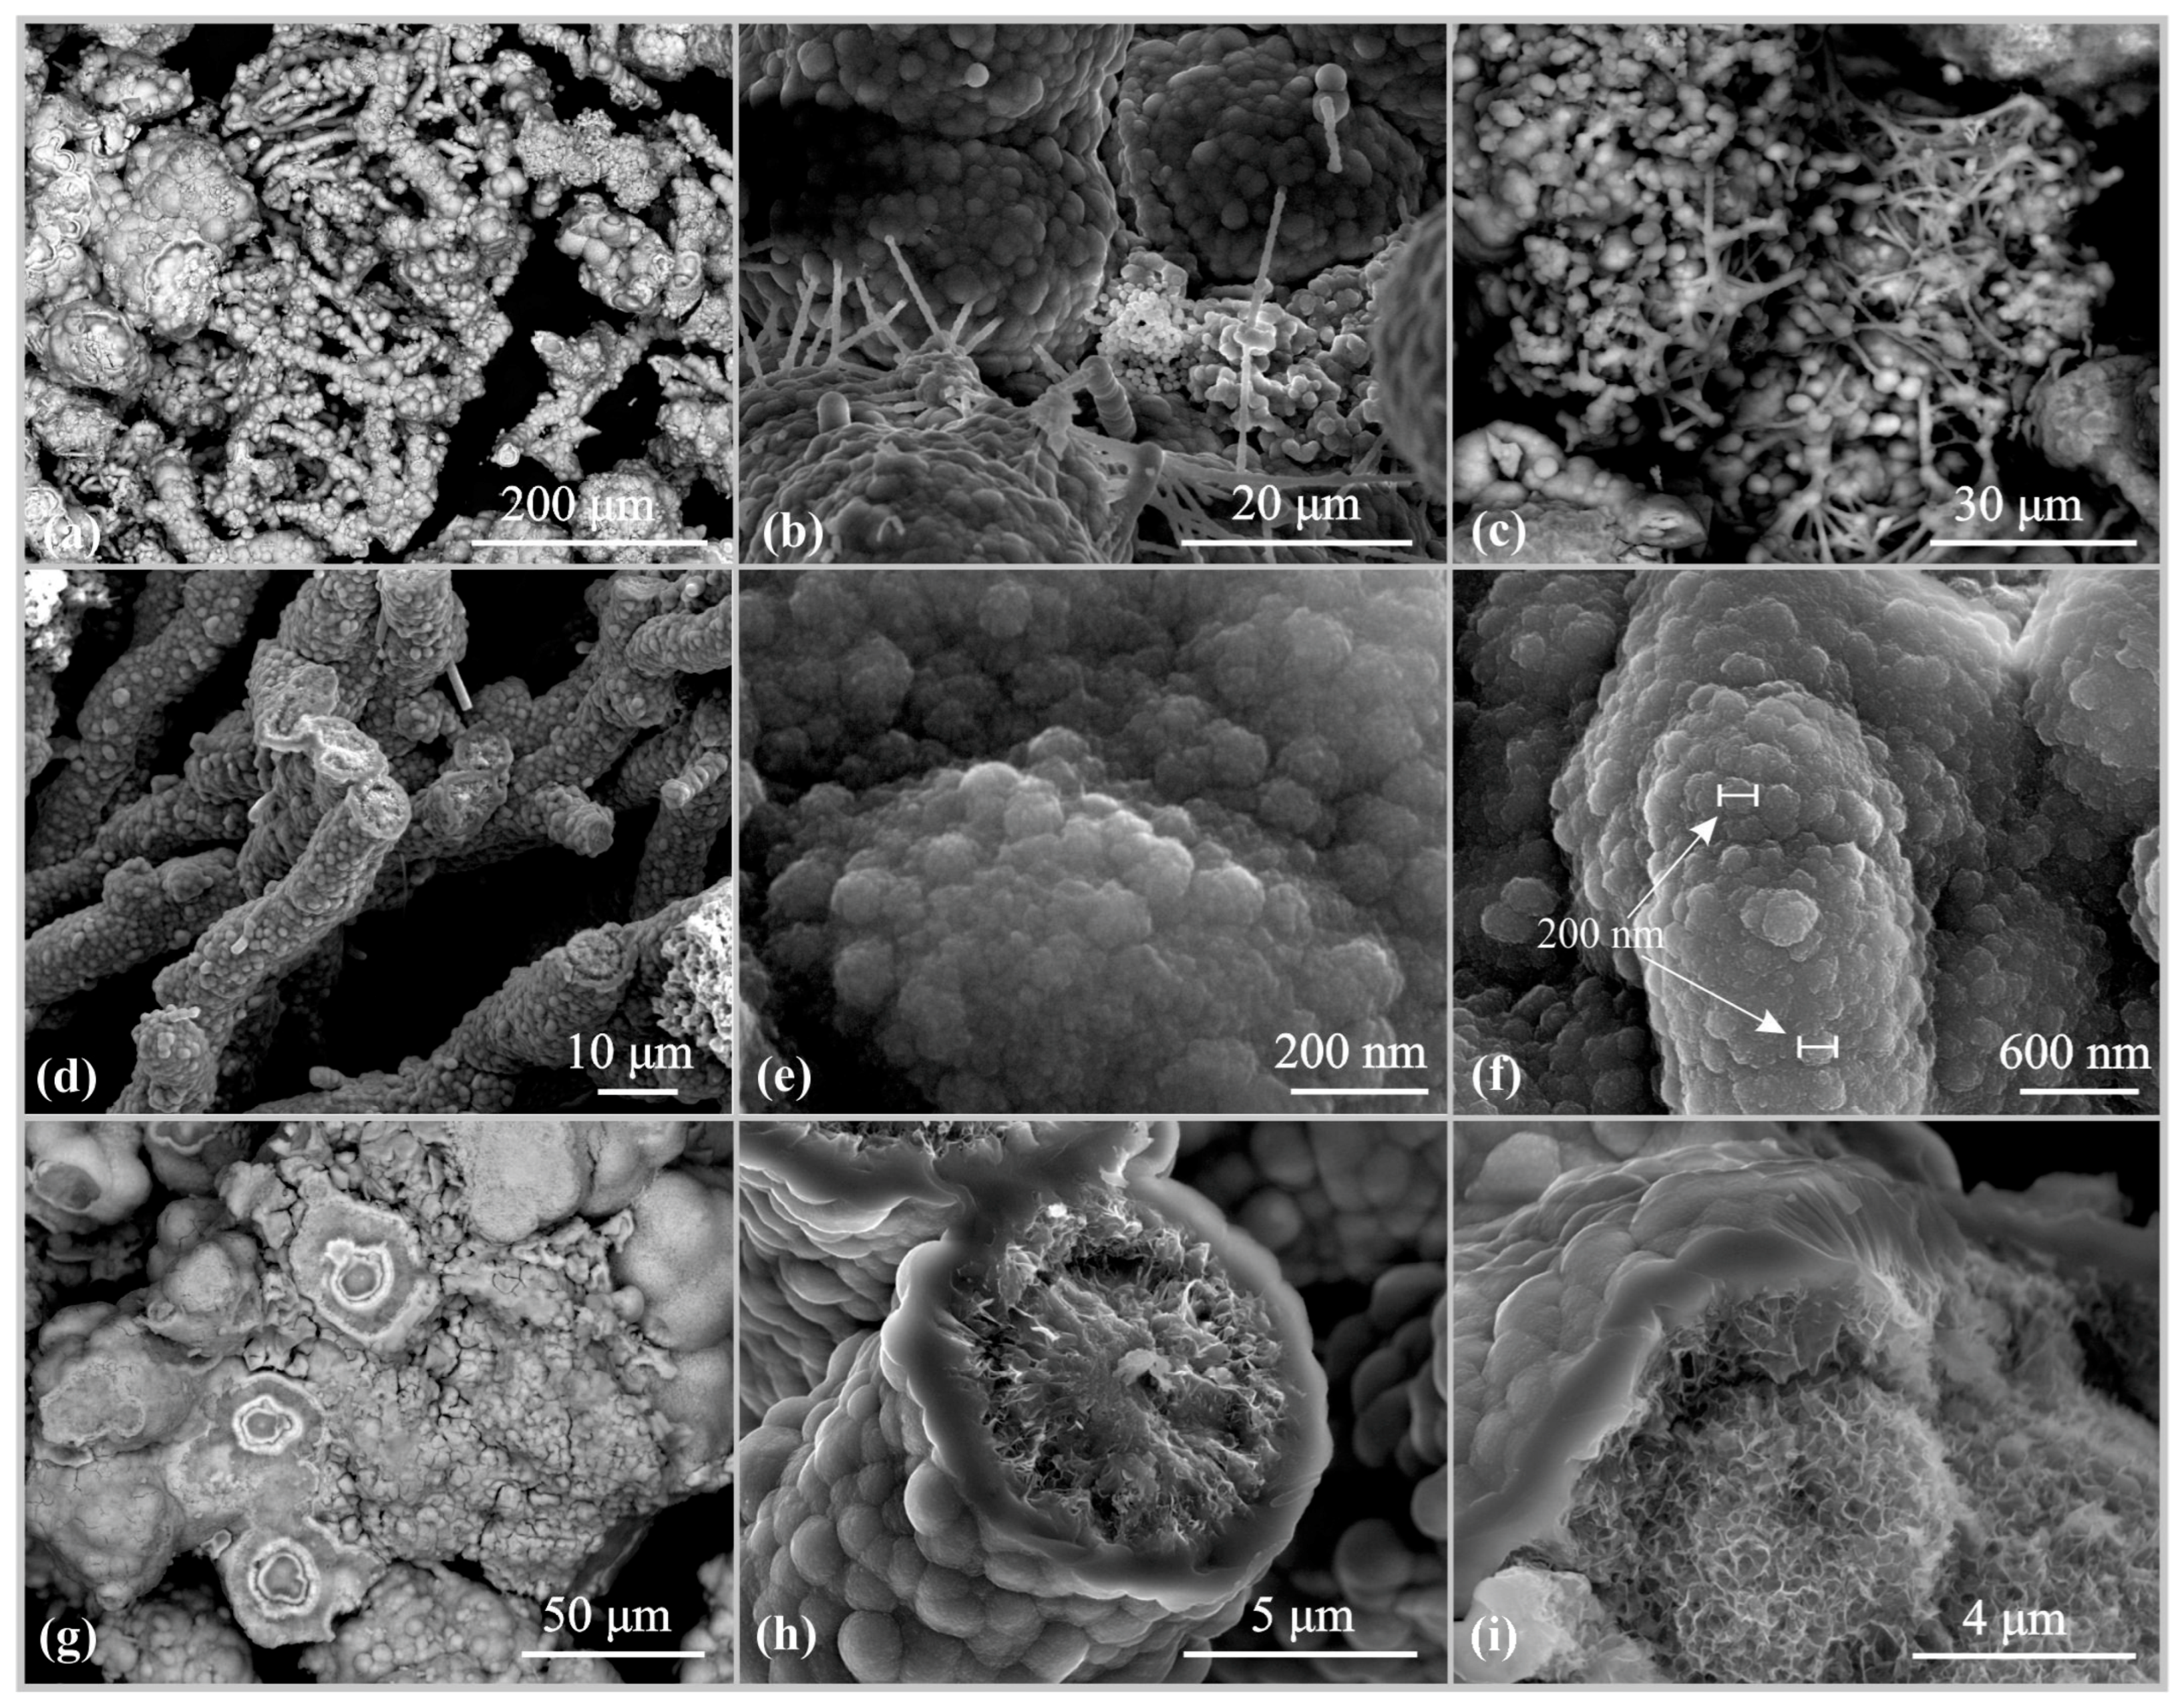
3.1. Analysis of Morphology and Chemical and Mineralogical Composition

Macroscopically studied samples of Fe-Mn Puy de Folles are represented by weakly cemented and loose aggregates of brown color. On the surface, there are earthy formations of a mixture of secondary minerals of yellow-red color (limonite). We assume the presence of limonite (a collective name for mineral aggregates that are mixtures of iron hydroxides) by morphology and color, because in this case, the exact phase composition cannot be determined by optical microscopy. Under magnification, the layering is clearly visible (Figure 2a): the denser lower layer contains numerous inclusions of volcanic glass fragments, while the upper layer is represented by dendrite-like, branching, and bunched aggregates (Figure 2b). Figure 2a marks the sampling points for further studies: FM1 and FM2. They were chosen so as to record the differences between the areas “closer to and farther” from the secondary altered crust surface.
Electron microscopy confirmed that on the layer containing cemented volcanic glass fragments, branching-tubular aggregates of collomorphic-globular structure are formed (Figure 3a–c). The cross-section of the latter reveals the globular structure of only the outer layer, the “case”. It is clearly seen that larger spheroids (sizes about 200 nm) are composed of small globules (~10 nm and less) (Figure 3d–f). The inner space of the “case” has a concentric-zonal and radial–radial structure (Figure 3g–i). The analysis of element distribution maps (Figure 4) shows the chemical heterogeneity of the layers: essentially, silicate substrate cementing the fragments of glasses altered in the periphery and an iron–manganese layer developing on its surface. Iron and manganese are differentiated in the latter, with globular formations containing iron and silicon and radial–radial and concentric-zonal aggregates containing manganese. The visible correlation of potassium and manganese indicates the possible presence of cryptomelane and birnessite in the mineral association.
Table 1 shows the content of the main chemical elements in the samples obtained by XRF method. Also, Mg, Cl, Ca, K, P, Zn, S, Sr, Sb, and Ru are present in insignificant quantities.
XRD studies on a Bruker “D2 Phaser” diffractometer with a copper anode revealed manganese minerals (Figure S3): birnessite (DB card number 00-043-1456) and todorokite (DB card number 01-087-0389). Measurements on an XRD-9510 with chromium anode (Figure S3) showed the presence of the same crystalline manganese phases. The peaks in the diffractograms are characterized by a large half-width, indicating poor crystallinity. As follows from quantitative analysis with an internal standard, the sample consists of more than 70% of one or more X-ray amorphous phase, most likely related to the iron-bearing component.
Further, samples FM1 and FM2 were studied by Raman and FTIR spectroscopy. A common feature for both samples is the presence of peaks characteristic of the mineral birnessite (also associated with δ-MnO2) in the Raman spectra [49] (Figure S3a). The most intense peak in these spectra has a frequency of about 645 cm−1 and is interpreted as a vibrational mode corresponding to v2(Mn-O) in MnO6 [50]. Also, significant but variable from point-to-point in intensity is the peak at 568 cm−1, interpreted as a vibrational mode corresponding to v3(Mn-O) in MnO6. The other peaks appear as relatively weak and broad bands at 730, 507, 410, 380, 174, and between 280 and 310 cm−1. Similar peaks were observed in other studies as well [50,51,52]. The variability of these peaks may be a consequence of the manifestation of different degrees of disorder, including doping with single-valence metal ions (e.g., Na+, K+). In addition, the presence of other contributions cannot be excluded, which will be discussed below.
The contribution from birnessite was also confirmed when the samples were studied by FTIR spectroscopy and X-ray diffraction. Thus, a close match for the peaks at 763, 1405, and 1630 cm−1 was observed when compared with the spectrum given by Chukanov and Chervonnyi [53]. In addition, a typical broad peak from stretching vibrations in OH groups with maxima at 3170–3230 cm−1 was present. It is dragged towards lower wave numbers, indicating the presence of relatively strong hydrogen bonds with OH groups [54,55,56]. It should be noted that the peak at 1630 cm−1 may also relate to bending vibrations in water and/or CHO groups [57,58,59]. The peak at 1480 cm−1 is in the region typical for the antisymmetric vibrational mode v3 in CO32−; additionally, the contribution of hydrogen bending vibrations in CH2 and/or CH3 and/or CCH groups is possible in the region [54,55].
However, the absence of intense bands in the region of stretching hydrogen vibrations, such as the 2800–3000 cm−1 range for methyl and methylene groups, allows us to attribute the 1480 cm−1 peak to stretching vibrations in the carbonate ion. The interpretation of the 965 cm−1 peak has two options. On the one hand, the frequency of this peak is in the region typical for single C-C and C-O [57,58] bonds. The high activity in the IR spectrum of this band points in favor of belonging to the more polar vibration in C-O bonds. On the other hand, this band is quite broad, which together with the determination of sufficient silicon by elemental analysis may indicate stretching vibrations in Si-O bonds. Individual regions with a preferential contribution from polysilicates were detected by FTIR spectroscopy; Figure S3b is an example of this. It should be noted that for FM2 with a relatively small band contribution around 1000 cm−1, the presence of peaks typical of organic compounds was observed in the IR absorption spectra. An example of a spectrum from such a region is given in Figure S3c.
The identification of the presence of organic compounds was primarily determined by the presence of peaks in the region of various stretching hydrogen vibrations in the range 2800–3200 cm−1. In the range 2800–3000 cm−1, there is a complex spectral contour made up of several peaks. This region is typical for hydrogen stretching vibrations at carbon with sp3 hybridization. The peaks at 2847 and 2922 cm−1 are interpreted as symmetric and antisymmetric stretching hydrogen vibrations at methylene groups [54,55]. The peaks at 2847 and 2922 cm−1 are interpreted as symmetric and antisymmetric stretching hydrogen vibrations at methylene groups. The peaks at 2867 and 2966 cm−1 refer to symmetric and antisymmetric stretching hydrogen vibrations in methyl groups. The peaks in the range 3000–3100 cm−1 are typical of stretchinghydrogen vibrations at carbon with sp2 hybridization (i.e., =C-H). That is, the peaks at 3049 and 3071 cm−1 are characteristic of unsaturated hydrocarbons with double bonds, particularly for stretching hydrogen vibrations in benzene rings. Despite the overlap with the range of vibrations typical for the mineral birnessite, when considering the region 1000–1750 cm−1, a number of features are also noted in favor of the presence of organic compounds (Figure S3c). For example, the most intense peak has a frequency of 1620 cm−1, which is less than that of the typical birnessite peak at around 1630 cm−1. This shift may be a manifestation of the amide I peak in protein-type organic compounds [57,60,61]. The 1270 and 1515 cm−1 peaks, located in the region typical of the amide III and amide II peaks, may also be in favor of the presence of a contribution from the protein environment (Figure S3c).
The manifestation of a weak contribution from the organic component in the range 2800–3100 cm−1 was also observed during the study of FM2 by MS method: 532 nm excitation against the background of a broad band of stretching vibrations in OH groups with a maximum around 3420 cm−1. In addition, the presence of iron-bearing minerals was noted for the orange regions (Figure S3e). Goethite (α-FeOOH) was identified by the most intense band at 392 cm−1, as well as by a series of weakly intense peaks at 304, 480, and 543 cm−1, which are close to the peaks given for goethite in [62,63].
An intense, broad band with a maximum at 695 cm−1 was also observed in the spectrum. It is close, on the one hand, to the characteristic peak of 710 cm−1 for 6-line ferrihydrite (Fe3+10O14(OH)2) and, on the other hand, to 700 cm−1 for feroxyhyte (δ’-FeOOH) [64,65]. Moreover, as in our case for the spectra of these two minerals, the presence of a band of complex shape in the region of 1200–1650 cm−1 is noted. In Figure S3e, the maximum of this band is around 1360 cm−1, with a high-frequency shoulder around 1574 cm−1. There are several versions of the interpretation of this band:
(1)
It may be amorphous carbon formed from organic compounds as a result of heating, respectively D and G peaks. This is consistent with the detection of a relatively weak signal from the organic component in both FTIR and MS spectra, as well as the shift of the goethite band to the region of higher wave numbers from 385 to 392 cm−1 [59] and the shift of the maximum of the ferrihydrite band to the region of lower wave numbers [66];
(2)
The range 1200–1650 cm−1 could potentially be a second-order region, because even when obtaining spectrum at low laser powers, peaks in this range were observed (see [66]). The orange coloring of this region, as well as the presence of a rather significant contribution from OH groups, also indirectly supports the second-order version.
In the case of the dark regions near the orange, the presence of peaks at 147, 511, and 574 cm−1 (Figure S3f), typical of the pure mineral romanechite (Ba,H2O)2(Mn4+,Mn3+)5O10) [67], is noted. A band with a broad maximum at 660–667 cm−1 is also observed in the spectrum. The position of the maximum in this region is quite close to the most intense peak of the mineral pyrolusite (MnO2), which may be present in the mixture with romanechite [64,68]. In general, the resulting contour for the mixture of the two minerals is close to that observed in other studies [65] for pyrolusite/romanechite ratios of 4 to 1. In contrast to the orange region, much weaker peak intensities in the region of stretching vibrations of OH groups were also observed for the dark regions. For the orange regions, significantly fewer Fe-bearing compounds were observed (Figure S3g), which apparently leads to the presence of a contribution characteristic of both goethite (identified by the peak at 388 cm−1 [59]) and a mixture of pyrolusite and romanechite. In the cases of both particle types, the Raman spectra with 532 nm excitation showed a broad band corresponding to stretching vibrations in OH groups, as well as a relatively large intensity of the 960 cm−1 peak and a band in the 1200–1750 cm−1 region (Figure S3e,g). In FM1, a qualitatively similar composition was observed for the dark regions as for FM2. The spectra showed peaks typical of a mixture of pyrolusite and romanechite (see Figure S3h).

3.2. Diagnosis of Organic Substances

The obtained results of measuring the optical density of the extracts (Table 2) indicate that the most efficient extraction of organic compounds is provided by the least polar extractant hexane.
Acetonitrile cannot serve as an extractant of organic substances from the studied crusts; negative D values in this case may indicate that the studied crusts adsorb some impurities from acetonitrile that absorb light at the selected wavelength. Ethanol cannot be recommended for extraction either, as it is significantly inferior to hexane. This applies both to the non-polar organic compounds that hexane extracts and to the polar compounds that are transferred from the crusts to the aqueous phase by ultrasound and heating. Considering the analytical capabilities of chromatographic methods, it can be expected that hexane extracts will be the most informative for further studies by GC-MS. Based on the obtained values of optical densities of the extracts and the ratio of phase volumes, the approximate content of organic compounds, primarily aromatic and opaque for λ = 254 nm, is several hundred ppm.
GC-MS analysis allowed the annotation of several classes of organic compounds in the hexane extracts of the Fe-Mn crusts. The most confidently identified compounds were alkanes C13–C20. An exemplarily chromatogram and a mass-spectrum analysis of the dominant alkane peak are shown in Figure S4. Besides alkanes, we can also suggest the presence of small amounts of alkenes, hopanes, and steranes based on low-intensity signals at characteristic m/z values (55, 177, and 217, respectively).

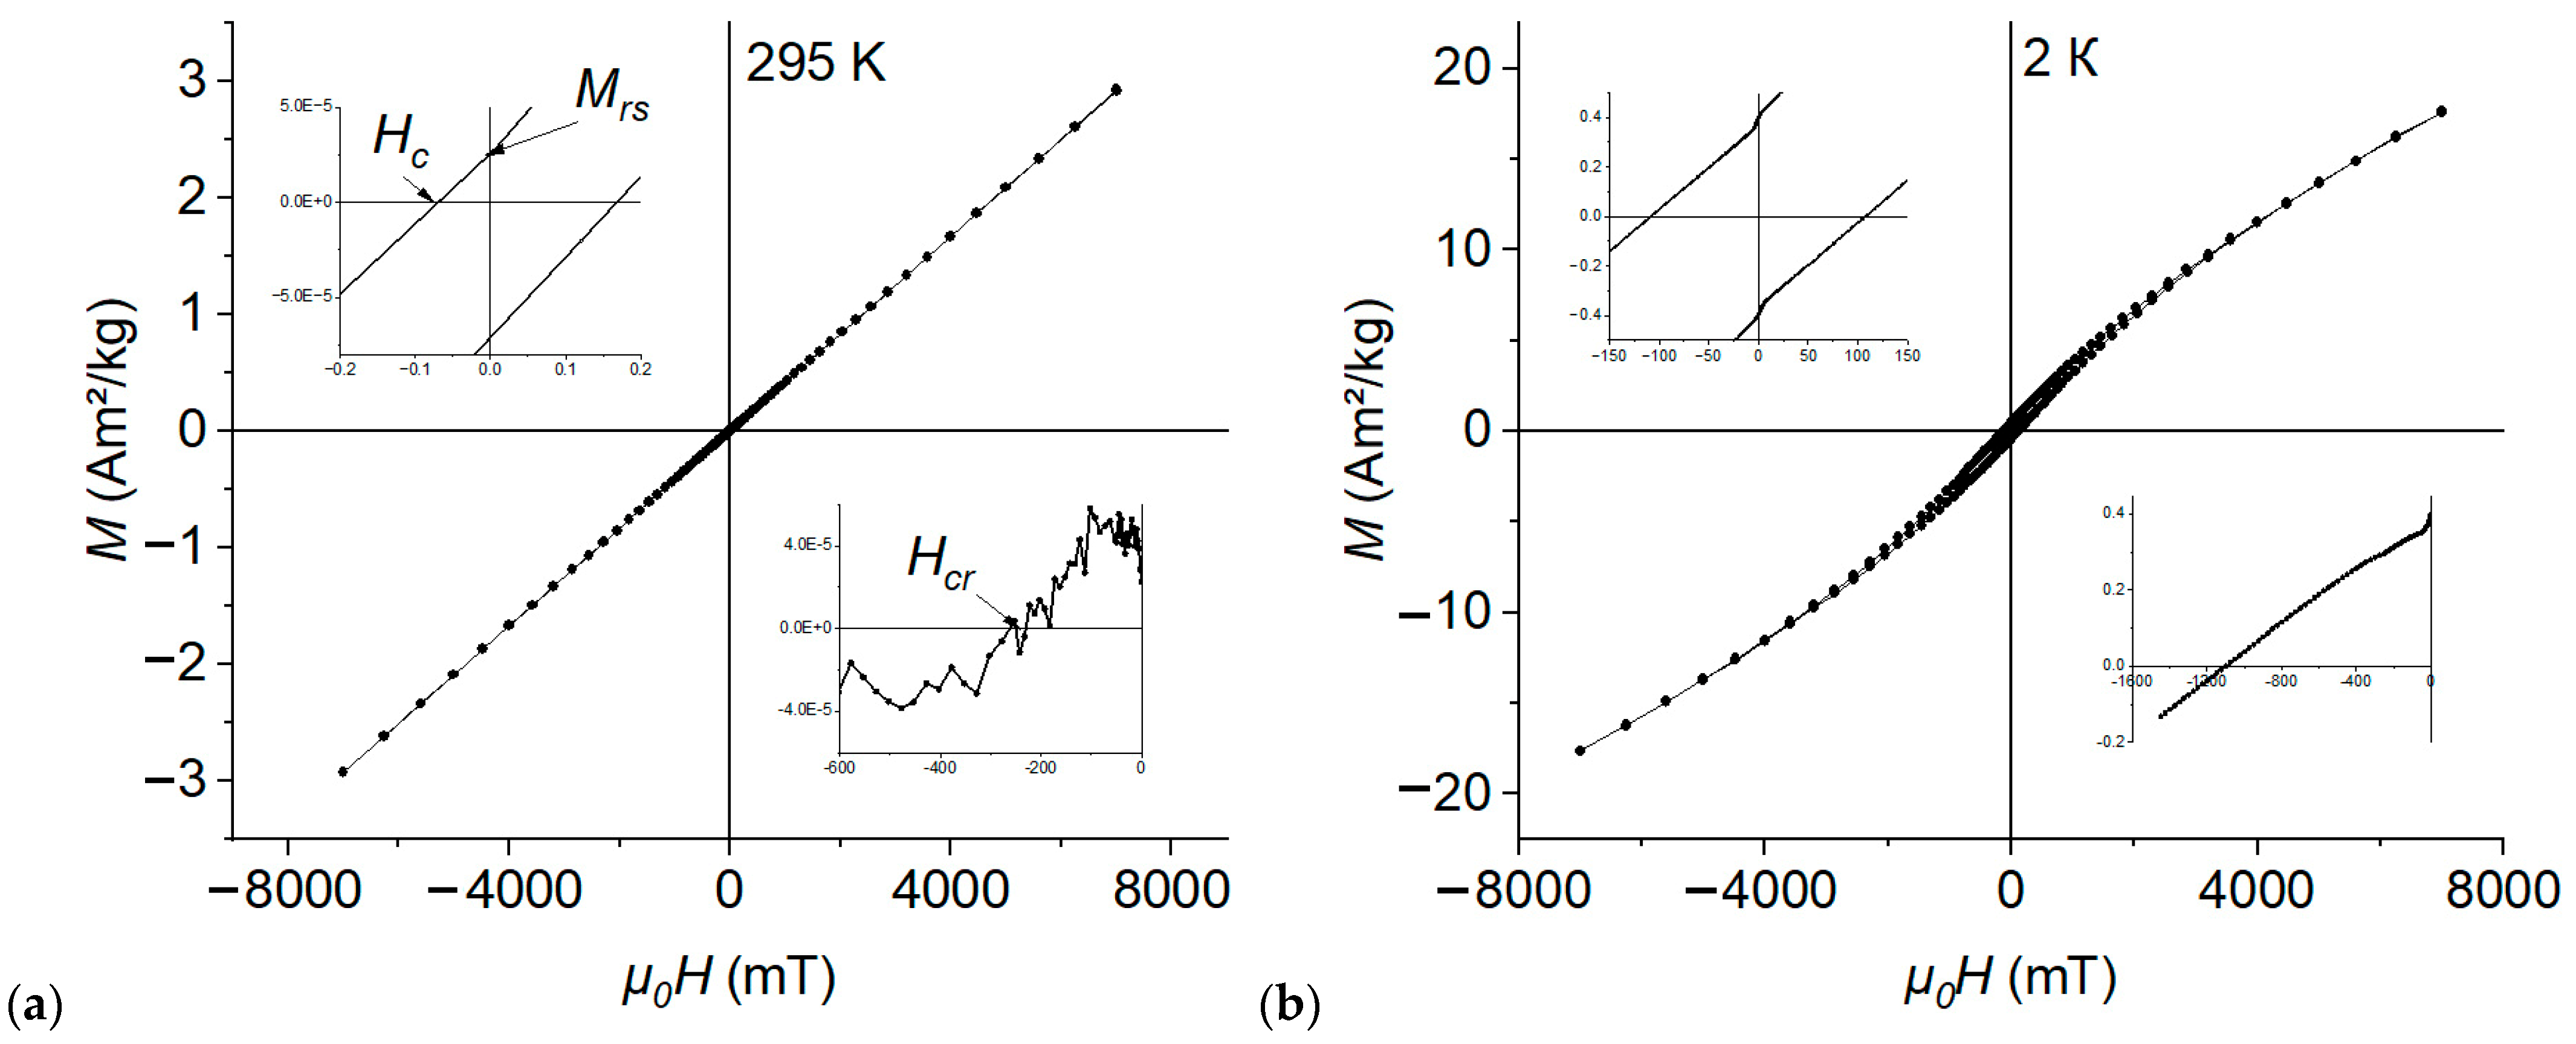
3.3. Magnetic Properties

Unlike X-ray diffraction methods, Mössbauer spectroscopy provides reliable information on phase composition and near-order, both in crystalline samples and in amorphous, ultradisperse phases.
The results of the processed Mössbauer spectra obtained in the range ±12 mm/s for two samples are shown in Figure 5a. The paramagnetic part of the spectrum is represented by a doublet with a line width of 0.56 mm/s. The approximation of the spectrum by two doublets resulted in a decrease of χ2 (the sum of squares of deviations of the chosen approximation model from the experimental values of the spectrum) and line width in the doublets (Table 2). At the same time, the Mössbauer parameters of the two samples coincided with the accuracy of the measurement error, which may indicate the identity of iron-bearing phases in the composition of samples FM1 and FM2. The data for sample FM1 are presented below. Comparison of the parameters of the two doublets in the velocity range of 12 mm/s agree well with the Mössbauer parameters of nontronite [69] and ferrihydrite [70].
For a more detailed analysis of this sample, a Mössbauer spectrum was obtained in the velocity range ± 4.5 mm/s (Figure 5b). The experimental spectrum is a quadrupole doublet of strongly broadened lines. The analysis of the quadrupole splitting distribution (Figure 5c) suggests the presence of at least two non-equivalent iron positions in this sample. The processing of the spectrum into 4, 5, and 6 doublets was based on the criterion of the minimum number of doublets, taking into account the χ2 value, the line width (approximately like that of pure α-Fe), and the free variation of the whole set of hyperfine parameters. These conditions were best met by the decomposition of the experimental spectrum into five subspectra (Table 3), which can be correlated with the five non-equivalent crystallographic positions of iron cations in the ferrihydrite phase.
The hysteresis loops for FM1 obtained at temperatures of 295 K and 2 K in the ± 7 T field are shown in Figure 6. Table 4 shows the corresponding values of magnetization and coercivity. At both temperatures, the contribution of the paramagnetic component is significant, and saturation in the maximum possible field is not achieved. However, both at 2 K and at 295 K it is possible to estimate the parameters of the constructed loops: coercivity Hc, remanent mass magnetization Mr, and residual coercivity Hcr from the fracture curve Mr created in the maximum field of 7 T. This indicates the presence of magnetically ordered phases in the sample, even at room temperature. The large values of residual coercivity, 230.0 (at 295 K) and 1100.0 mT (at 2 K), indicate a high degree of magnetic stiffness. A peculiarity of the magnetization behavior in weak fields at 2 K is the presence of a noticeable “shift” of the hysteresis loop.
Figure 7 shows the temperature dependences of the inductive and residual magnetizations measured according to the protocol described in Section 2. In the case of the LT-SIM inductive magnetization, the FC and ZFC plots show a reversible character up to the temperature range of 2–15 K, where a local maximum of ZFC is observed (Figure 7a). For a more reliable determination of the extremum temperature, the derivative dZFC/dT was plotted and further smoothed using the moving average method with a smoothing period length of 100 points. The obtained special points at 3 K and 13 K can be related to phase transitions, blocking of magnetic moments (Tb), etc. The residual magnetization of LT-SIRM drops sharply to almost zero with increasing temperature (Figure 7b): ZFC in the range of 1.8–13 K, FC in the range of 1.8–25 K, which is characteristic of ultradisperse particles in the superparamagnetic state [71]. Here, no signs of phase transitions are detected. A local minimum is observed on the RT-SIRM cycle at a temperature of about 9 K, both on the forward and reverse courses. The demagnetization of SIRM induced at room temperature by cooling and subsequent zero-field heating characterizes minerals that are carriers of residual magnetization. That is, the phase transition in the 9 K region also characterizes the material responsible for the residual magnetization at room temperature.

4. Discussion

The results of the study of ferromanganese crusts sampled from a depth of about 2 km in the zone of hydrothermal activity in the area of the Puy de Folles submarine volcano of the rift valley of the Mid-Atlantic Ridge allow us to provide some evidence for the biogenic origin of their iron-bearing component.
SEM and EDS analyses showed that the studied samples are characterized by typical “bacterial” microforms [72]: dendrite-like, branching, and bunch-like.
The differentiation of iron and silicon with manganese in biomineral formations has been noted in a number of publications (see, for example, [73]). Iron and silicon typically constitute globules, while manganese is associated with radial–radial concentric-zonal aggregates. “Footings” with an outer iron-silicate shell have been attributed to the activity of, for example, cyanobacteria. In particular, picocyanobacteria can biomineralize Fe-rich amorphous silicates [74]. In this case, globules are formed, surrounded by an organic, probably polysaccharide shell, arranged in the form of rings around the dividing partition of the cell.
According to XRF data, it is possible to estimate the values of Mn/Fe and Al/(Al + Fe + Mn) ratios. These ratios are highly variable and are affected by both biological and chemical processes. Although it is controversial, some researchers show that the lower the Mn/Fe ratio, the more likely it is that microorganisms are involved in the formation of ferromanganese rocks [23]. The distribution and concentration of dissolved aluminum also depend on biological activity [75]. For the studied samples, the first parameter is ~2.0 (with a range from 0.2 to 4.2 for hydrothermal zones [76]), and the second parameter is ~0.01 (with a range from 0.003 to 0.540 for hydrothermal zones [77]).
The following minerals were detected by Raman and FTIR spectroscopy: birnessite, a mixture of romaneschite and pyrolusite, a mixture of ferrihydrite and ferroxygite, and goethite. Also, a characteristic contribution of carbonate ion and silicate materials was noted in the vibrational region in FTIR absorption spectra. The latter is possibly related to nontronite. This mineral is also identified by magnetometric methods. The XRD method identifies birnessite and todorokite. The iron-bearing phase (various Fe-oxyhydroxides) according to XRD data is represented by X-ray amorphous material, the content of which is ~70 wt.%. All this agrees well with the literature data on the hydrothermal zones of the Mid-Atlantic Ridge hydrothermal zones [78,79,80]. Although todorokite is not specifically mentioned in the publications, it may be present, by analogy with that described in the works [81,82]. For the identified iron-bearing minerals Si-Fe oxyhydroxide, ferrihydrite, and nontronite, biomineralization processes may play a crucial role in their formation.
Ferrihydrite Fe3+10O14(OH)2 is a natural iron oxyhydroxide mineral. It is characterized by a weakly crystalline structure and a large relative surface area of nanoparticles, with sizes ranging from less than 2 to ~5 nm, which contributes to its reactivity and ability to adsorb various cations and anions. Ferrihydrite exists in varying degrees of structural disorder; the two extremes are the so-called 2-line and 6-line ferrihydrites (characterized by powder X-ray diffraction). It is formed by weathering processes and the hydrolysis of iron-bearing minerals, often in the presence of organic matter [83]. This mineral is an intermediate state in the transformation of iron into more stable oxides such as hematite and goethite. It is also the core of ferritin, a complex protein complex that serves as the main intracellular iron store in living organisms [84].
Nonthronite Na0.3Fe3+2[(Si,Al)4O10](OH)2·nH2O, a fine-grained, layered, iron-rich member of the smectite group, has a complex crystal structure that varies with redox conditions. The origin of nontronite is described as the result of weathering processes and hydrothermal alteration of iron-bearing minerals such as olivine and pyroxene. It forms under low-temperature conditions and neutral-to-slightly-acidic pH, often in the presence of water. This mineral is found in soils, sediments, and hydrothermal systems, where it plays an important role in geochemical processes [85]. Hydrothermal processes contribute to the formation of biogenic ultradisperse nontronite [86,87]. Associations of nontronite and poorly crystallized Si-Fe oxyhydroxides occur in deep-sea environments. The hydrothermal deposits of the South Atlantic Ridge show a paragenetic sequence between nontronite, Mn oxide, and Fe oxyhydroxide. Microbial communities associated with biologically induced mineralization have been identified. The dominant bacterial types include Proteobacteria, Chloroflexi, Actinobacteria, and Bacteroidetes. Iron-oxidizing bacteria can also contribute to the formation of Si-Fe oxyhydroxides containing nontronite by oxidizing Fe(II) from hydrothermal fluids. These oxyhydroxides may also contain opal and weakly crystalline ferrihydrite [4,88]. Samples of similar rocks collected from hydrothermal deposits near the Galapagos Islands have been examined [89]. SEM studies demonstrate branching filamentous aggregates of nonthronite with higher Si content compared to Fe, spiderweb-like structures of Fe-oxides, hollow microspheres rich in Fe oxide, and filamentous structures of iron oxide with spreading elongated microspheres departing from the filaments. Residual microbial structures were found: filaments, globular aggregates, flattened microspheres, and elongated tubes. Lubetkin et al. [89] hypothesize that these structures indicate that microbes were involved in mineral formation. Iron-oxidizing bacteria can form Si-Fe oxyhydroxides on the outside of the oxygen-rich tubes. Over time, these turn into nontronite [87].
The next step in the chain of evidence for the biogenic origin of Fe-Mn Puy de Folles in our study is the data from the organic matter composition analysis. Thus, the IR absorption spectra showed a characteristic contribution in the vibrational region of carbonate ion and silicate materials. The latter is possibly related to nontronite. In addition, hydrogen valence vibrations showed the presence of compounds with aliphatic (alkane) groups, as well as compounds with double bonds (possibly with a benzene ring). In the region 1200–1700 cm−1, for individual particles of the sample, the presence of a protein component identified by the peaks of amide I, amide II, and amide III was noted.
The results of spectrophotometry and GC-MS analysis of hexane extracts obtained from ferromanganese crust samples show the presence of organic compounds in the samples. According to the literature data, saturated hydrocarbons (alkanes, steranes, pristanes, etc.) are predominantly present in such samples, while unsaturated compounds (aromatic hydrocarbons, alkenes, derivatives of isoprenoids, and porphyrins) are much less common [90,91,92]. This is fully consistent with our findings that the dominant class of organic compounds in ferromanganese crusts are alkanes. The presence of trace amounts of other groups of compounds in the samples is also interesting because, unlike alkanes, these substances can potentially be used as biomarkers, indicating traces of vital activity of living organisms belonging to certain taxonomic groups (e.g., hopanoids are biomarkers attributed to bacteria, while different types of isoprenoids indicate the presence of planktonic microalgae [93]). Raman and FTIR spectroscopy methods also recognized the iron-associated presence of the organic component in the samples in the form of compounds with an aliphatic part (based on the significant contribution from methyl and methylene groups); compounds with double bonds, including benzene rings (based on valence hydrogen vibrations at carbon in sp2 hybridization); and compounds characteristic of the protein environment, with a pronounced signal in the spectral region typical of the amide group.
Finally, convincing evidence for the participation of microorganisms in the formation of the iron-containing fraction can be obtained by investigating the magnetic properties of Fe-Mn Puy de Folles.
Mössbauer studies on ferrihydrite of various origins are presented in numerous papers, e.g., [94,95,96]. On the basis of neutronographic studies, a model of the ferrihydrite structure as a random sequence of defect-free and defective phases was proposed and tested using Mössbauer spectroscopy [97]. Four octahedral non-equivalent Fe(III) positions were found: two of them—Fe1 and Fe2—have a small degree of distortion of local symmetry and are referred to by the authors as ferrihydrite-like, and two strongly distorted positions—Fe3 and Fe4—are referred to as hematite-like. The parameters of the last two positions are characteristic of the nanoscale superparamagnetic state of hematite [98].
For the samples studied in our work, the IS values of all five doublets are in the range of 0.36–0.37 mm/s, while the quadrupole splitting varies over a wider range, from 0.46 to 1.55 mm/s (Table 3), which agrees well with the data of the review [96], based on which D1–D5 doublets were identified as ferrihydrite of bacterial origin. Doublets D1 and D2 correspond to cubic and hexagonal packing of ligands, with occupancy of iron cations of 20.2% and 33.5%. The occupancy of positions D3–D4 is much lower and decreases to 6.2% in D5. This may be an indicator of disordered ferrihydrite. Positions D3–D5 may correspond to interlayer hematite-like positions and also reflect the contribution from variations of local ordering in the second coordination sphere of the absorbing iron atom [99]. This behavior is characteristic of ultradisperse and X-ray amorphous materials. In addition, the presence of nanostructured iron hydroxide particles in the superparamagnetic (SPM) state cannot be excluded. In [100] the study of synthesized samples of feroxyhyte with dimensionality from 5 to 150 nm was carried out. It is shown that particles smaller than 100 nm behave as paramagnetic and have Mössbauer spectra as a doublet. At liquid nitrogen temperature, the magnetic structure begins to appear in particles 20–50 nm, although particles 5–7 nm remain in the superparamagnetic state. It is possible that doublets D3–D5, corresponding to interlayer hematite-like positions in the Mössbauer spectrum of FM1, may be responsible for the superparamagnetic state of iron oxyhydroxide particles with an estimated dimensionality of less than 100 nm.
Our static magnetometry data show that the samples are magnetically ordered at room temperature. In ferrihydrite, both antiferromagnetic and ferromagnetic phases can be present. The latter is due to the presence of uncompensated spins on the surface of ultradisperse particles [101,102,103,104,105,106,107]. The presence of silicon can stabilize the structure of ferrihydrite [108]. Nontronite exhibits antiferromagnetic properties in the oxidized state. However, under microbiological reduction, in particular, under the influence of Shewanella species, its magnetic properties can be transformed from antiferromagnetic to ferromagnetic [109,110,111].
The blocking temperature Tb depends on the average particle size [112] and the magnetostatic interaction between them (see, e.g., [113,114]). When the average size and interaction intensity decrease, the Tb value also decreases. High coercivity can be related to heterophase and anisotropy of the shape of particles and their aggregates. According to the literature data, there are significant differences in magnetic properties for ferrihydrite obtained by chemical precipitation methods, bacterial ferrihydrite, and ferrihydrite as ferritin core. Namely:
(1)
For “strong-interacting” synthetic ferrihydrite particles, Tb was determined to be in the range of 40–110 K or more, μ0Hc = 250–350 mT (at 4 K) [115,116,117,118,119];
(2)
The characteristic blocking temperature of bacterial ferrihydrite was determined for particles synthesized by Klebsiella oxytoca; it is equal to 23–25 K. A shift of the hysteresis loop is observed, and the coercive force is equal to 150 mT at a temperature of 4.2 K [120];
(3)
For ferritin, where the interaction between particles is weakened by the presence of a protein shell, the coercivity is 200 mT (at 4 K) and Tb is 6–12 K [121,122].
Possibly, the value of Tb = 13 K, which we observed in the LT-SIM curves, may correspond to ultradisperse biogenic ferrihydrite, whose particles interact weakly. The value Tb = 3 K may correspond to nontronite, the magnetic ordering temperature for which varies from 1.3 to 4.2 K [123]. The value of μ0Hc = 104 mT for Fe-Mn Puy de Folles is lower than that observed for bacterial ferrihydrite. This can be explained by the fact that, firstly, the hysteresis loops were obtained at a lower temperature (2 K) than in the works of other authors [115,116,117,118,119]. And, secondly, by the fact that we are not dealing with pure substances, but with a mixture of different minerals. The interaction between particles in Fe-Mn Puy de Folles may be influenced by the silicon phase, which plays the role of a capsule for magnetic grains, by analogy with the protein shell of ferritin.
Thus, in this work of Rumpf et al. [124], a system was studied where porous silicon served as a matrix for magnetite nanoparticles. It was shown that by adjusting the pore size of the silicon matrix and the concentration of magnetic particles, it is possible to strongly weaken the magnetic interactions, which leads to a decrease in the value of the blocking temperature.
The characteristic temperature of 9 K in the construction of RT-SIRM curves probably reflects the behavior of the residual magnetization across all iron-containing phases.
The analysis of the specific magnetic properties of Fe-Mn Puy de Folles suggests the existence of a paragenetic sequence of Si-Fe oxyhydroxides, ferrihydrite, and nontronite of bacterial origin. These minerals, represented by ultradisperse particles and X-ray amorphous matter, are formed as a result of the biological activity of iron-oxidizing and iron-reducing bacteria.
Iron-oxidizing bacteria may be microorganisms of the class Zetaproteobacteria that inhabit hydrothermal zones of the Mid-Atlantic Ridge rift valley. These bacteria are an integral part of the global iron cycle and are often found in iron-rich environments such as hydrothermal vents, where they thrive near the chimneys of black smokers [125]. At the same time, they have unique morphologies, such as tubular iron oxide shells [126]. These bacteria utilize Fe(II) iron as electron donors, indicating a metabolic capacity that enables their survival in these dynamic environments. Iron-reducing bacteria also play an important role in the biogeochemical iron cycle in the rift zones of the Mid-Atlantic Ridge. They are able to utilize Fe(III) iron as an electron acceptor in their metabolic processes. For example, the thermophilic anaerobic bacterium Deferribacter autotrophicus, isolated from the Ashadze hydrothermal field (about 150 km south from the Puy de Folles volcano), reduces Fe(III) using molecular hydrogen as an electron donor, which provides its chemolithoautotrophic capabilities in deep waters [127]. The formation of ferromanganese crusts by iron-oxidizing and iron-reducing bacteria follows the pattern of induced biomineralization [128]. In this process, microorganisms alter the redox conditions and pH of the medium, resulting in mineral precipitation.

5. Conclusions

The purpose of this study of ferromanganese crusts sampled from a depth of about 2 km in a zone of hydrothermal activity in the area of the Puy de Folles submarine volcano of the Mid-Atlantic Ridge rift valley was to prove their biogenic origin. This topic is of interest from several points of view: (1) understanding geochemical processes; (2) obtaining information about ancient ecosystems and the conditions under which they existed, which is important for reconstructing climatic and environmental changes in the past; (3) ferromanganese crusts are an important source of metals such as iron, manganese, cobalt, and nickel, i.e., understanding their origin may help in developing methods for their extraction and processing; (4) biogenic crusts may contain biomarkers, organic molecules that indicate the presence and microbial activity; and finally, (5) the study of biogenic processes on Earth can help in the search for life on other planets and satellites where similar conditions may exist [129].
A comprehensive analysis of the chemical and mineral composition of the Fe-Mn Puy de Folles samples was carried out. The main manganese minerals of the samples are birnessite and todorokite. The Fe-containing phase is represented by a paragenetic sequence of magnetic minerals of Si-Fe oxyhydroxides, ferrihydrite, and nontronite in the form of ultradisperse particles and X-ray amorphous matter. The main results are the following: the organic component of the samples was separated and analyzed, and it was shown that the samples have specific magnetic properties characteristic of iron minerals of biogenic origin. Thus, convincing evidence for the origin of an Fe-containing phase in the Fe-Mn Puy de Folles samples in the process of induced biomineralization with the participation of bacteria has been obtained. The hypothesis that iron-reducing and iron-oxidizing bacteria may be involved in the formation of iron-bearing phases of the studied samples is proposed. Further studies are required to identify bacterial species and to establish the distribution of their roles in the formation of these rocks.

Supplementary Materials

The following supporting information can be downloaded at: https://www.mdpi.com/article/10.3390/geosciences14090240/s1. Figure S1: FM1 sample diffractogram at measurements with copper anode. Figure S2: FM1 sample diffractogram at measurements with cobalt anode. Figure S3: Typical Raman and FTIR spectra. Figure S4: GC-MS data showing presence of alkanes in the extract of the Fe-Mn crusts.

Author Contributions

Conceptualization, methodology, E.S.S. and E.R.T.; original draft preparation, E.S.S.; writing—review and editing, E.S.S., E.R.T., K.G.G., P.V.K., O.V.R., V.S.K., S.Y.Y., D.V.P. and A.N.B.; investigation, S.Y.Y., O.V.R., E.R.T., V.S.K. and D.V.P.; manuscript design, project administration, E.S.S. All authors have read and agreed to the published version of the manuscript.

Funding

This research received no external funding.

Data Availability Statement

Data are contained within the article.

Acknowledgments

Scientific research were performed at the Research Park of St. Petersburg State University: “Center for diagnostics of functional materials for medicine, pharmacology and nanoelectronics”, “Nanotechnology”, “Geomodel”, “Microscopy and microanalysis”, “X-ray diffraction methods of research”, “Magnetic resonance methods of research”, “Innovative technologies of composite nanomaterials”, “Methods of analysis of substance composition”, “Center for optical and laser materials research”, and “Nanoconstruction of photoactive materials”. The measurements in Research Park resource centers were conducted with St. Petersburg State University support (project AAAA-A19-119082790069-6). The authors would like to thank Irina Dobretsova, mineralogist of the Polar Marine Geosurvey Expedition, for providing samples and photo materials; Anatoly Korneev (SPbU) for X-ray phase analysis; and Vladimir Karpinsky (SPbU) for his assistance in the design of the graphic materials. Mössbauer spectroscopy was realized in the Petersburg Nuclear Physics Institute named by B.P. Konstantinov of the National Research Center “Kurchatov Institute”.

Conflicts of Interest

The authors declare no conflicts of interest.

References

  1. Glasby, G.P. Manganese in the marine environment. Oceanogr. Mar. Biol. Annu. Rev. 1984, 22, 164. [Google Scholar]
  2. Cronan, D.S. (Ed.) Handbook of Marine Mineral Deposits; CRC Press: Boca Raton, FL, USA, 1999; Volume 18. [Google Scholar]
  3. Heath, G.R. Ferromanganese Nodules of the Deep Sea. In Seventy-Fifth Anniversary Volume; Economic Geology Publishing Company: McLean, VA, USA, 1981; pp. 736–765. [Google Scholar] [CrossRef]
  4. Toth, J.R. Deposition of submarine crusts rich in manganese and iron. Geol. Soc. Am. Bull. 1980, 91, 44. [Google Scholar] [CrossRef]
  5. Hein, J.R.; Ahn, J.H.; Wong, J.C.; Kang, J.K.; Smith, V.K.; Yoon, S.H.; Smith, H. Geology, Geophysics, Geochemistry, and Deep-Sea Mineral Deposits, Federated States of Micronesia: KORDI-USGS RV Farnella Cruise F11-90-CP (No. 92-218); US Geological Survey: Reston, VA, USA, 1992. [Google Scholar] [CrossRef]
  6. Hein, J.R.; Hsueh-Wen, Y.; Gunn, S.H.; Gibbs, A.E.; Chung-ho, W. Composition and origin of hydrothermal ironstones from central Pacific seamounts. Geochim. Cosmochim. Acta 1994, 58, 179–189. [Google Scholar] [CrossRef]
  7. Hein, J.R.; Gibbs, A.E.; Clague, D.A.; Torresan, M. Hydrothermal mineralization along submarine rift zones, Hawaii. Mar. Georesources Geotechnol. 1996, 14, 177–203. [Google Scholar] [CrossRef]
  8. Tebo, B.M.; Clement, B.G.; Dick, G.J. Biotransformations of Manganese. In Manual of Environmental Microbiology; Wiley: Hoboken, NJ, USA, 2007; pp. 1223–1238. [Google Scholar] [CrossRef]
  9. Hein, J.R.; Koschinsky, A. Deep-Ocean Ferromanganese Crusts and Nodules. In Treatise on Geochemistry; Elsevier: Amsterdam, The Netherlands, 2014; pp. 273–291. [Google Scholar] [CrossRef]
  10. Polgári, M.; Gyollai, I. Comparative Study of Formation Conditions of Fe-Mn Ore Microbialites Based on Mineral Assemblages: A Critical Self-Overview. Minerals 2022, 12, 1273. [Google Scholar] [CrossRef]
  11. Ehrlich, H.L. Ocean manganese nodules: Biogenesis and bioleaching possibilities. Min. Metall. Explor. 2000, 17, 121–128. [Google Scholar] [CrossRef]
  12. Shulga, N.; Abramov, S.; Klyukina, A.; Ryazantsev, K.; Gavrilov, S. Fast-growing Arctic Fe–Mn deposits from the Kara Sea as the refuges for cosmopolitan marine microorganisms. Sci. Rep. 2022, 12, 21967. [Google Scholar] [CrossRef]
  13. Lyu, J.; Yu, X.; Jiang, M.; Cao, W.; Saren, G.; Chang, F. The Mechanism of Microbial-Ferromanganese Nodule Interaction and the Contribution of Biomineralization to the Formation of Oceanic Ferromanganese Nodules. Microorganisms 2021, 9, 1247. [Google Scholar] [CrossRef]
  14. Lizeng, B.; Chengyi, L.; Fusheng, Z.; An, D.D.; Jianlin, C.; Huadi, S. Pelagic Manganese Nodules—A New Type of Oncolites. Acta Geol. Sin. Engl. Ed. 1997, 71, 43–48. [Google Scholar] [CrossRef]
  15. Villalobos, M.; Toner, B.; Bargar, J.; Sposito, G. Characterization of the manganese oxide produced by pseudomonas putida strain MnB1. Geochim. Cosmochim. Acta 2003, 67, 2649–2662. [Google Scholar] [CrossRef]
  16. Wang, S.H.; Yan, W.; Song, H.B. Mapping the thickness of the gas hydrate stability zone in the South China Sea. Terr. Atmos. Ocean. Sci. 2006, 17, 815–828. [Google Scholar] [CrossRef]
  17. Wang, X.; Müller, W.E.G. Marine biominerals: Perspectives and challenges for polymetallic nodules and crusts. Trends Biotechnol. 2009, 27, 375–383. [Google Scholar] [CrossRef] [PubMed]
  18. Wang, X.; Schröder, H.C.; Wiens, M.; Schloßmacher, U.; Müller, W.E.G. Manganese/polymetallic nodules: Micro-structural characterization of exolithobiontic- and endolithobiontic microbial biofilms by scanning electron microscopy. Micron 2009, 40, 350–358. [Google Scholar] [CrossRef] [PubMed]
  19. Wang, X.; Peine, F.; Schmidt, A.; Schröder, H.C.; Wiens, M.; Schloßmacher, U.; Müller, W.E.G. Concept of Biogenic Ferromanganese Crust Formation: Coccoliths as Bio-seeds in Crusts from Central Atlantic Ocean (Senghor Seamount/Cape Verde). Nat. Prod. Commun. 2011, 6, 1934578X1100600. [Google Scholar] [CrossRef]
  20. Wang, X.; Gan, L.; Wiens, M.; Schloßmacher, U.; Schröder, H.C.; Müller, W.E.G. Distribution of Microfossils Within Polymetallic Nodules: Biogenic Clusters within Manganese Layers. Mar. Biotechnol. 2012, 14, 96–105. [Google Scholar] [CrossRef] [PubMed]
  21. Jiang, X.-D.; Gong, J.-L.; Ren, J.-B.; Liu, Q.-S.; Zhang, J.; Chou, Y.-M. An interdependent relationship between microbial ecosystems and ferromanganese nodules from the Western Pacific Ocean. Sediment. Geol. 2020, 398, 105588. [Google Scholar] [CrossRef]
  22. Jiang, X.-D.; Sun, X.-M.; Guan, Y. Biogenic mineralization in the ferromanganese nodules and crusts from the South China Sea. J. Asian Earth Sci. 2019, 171, 46–59. [Google Scholar] [CrossRef]
  23. Hu, M.; Li, F.; Lei, J.; Fang, Y.; Tong, H.; Wu, W.; Liu, C. Pyrosequencing revealed highly microbial phylogenetic diversity in ferromanganese nodules from farmland. Environ. Sci. Process. Impacts 2015, 17, 213–224. [Google Scholar] [CrossRef]
  24. Bergo, N.M.; Bendia, A.G.; Ferreira, J.C.N.; Murton, B.J.; Brandini, F.P.; Pellizari, V.H. Microbial Diversity of Deep-Sea Ferromanganese Crust Field in the Rio Grande Rise, Southwestern Atlantic Ocean. Microb. Ecol. 2021, 82, 344–355. [Google Scholar] [CrossRef]
  25. Nakamura, K.; Horinouchi, K.; Shimomura, R.; Machida, S.; Yasukawa, K.; Fujinaga, K.; Nozaki, T.; Kato, Y. Geochemical insights into secular changes in the depositional environment of ferromanganese nodules in the western North Pacific. Deep Sea Res. Part I Oceanogr. Res. Pap. 2024, 203, 104227. [Google Scholar] [CrossRef]
  26. Knaack, D.R.; Leybourne, M.I.; Layton-Matthews, D.; Hein, J.R.; Stern, R.J.; Wysoczanski, R.; Faure, K.; Usui, A.; Al, T.; McDonald, A.; et al. The role of depositional environment and chemical composition on the triple oxygen isotope ratios of ferromanganese precipitates and their endmember components. Chem. Geol. 2023, 642, 121785. [Google Scholar] [CrossRef]
  27. Escartín, J.; Olive, J.-A. Mid-Ocean Ridges and Their Geomorphological Features. In Treatise on Geomorphology; Elsevier: Amsterdam, The Netherlands, 2022; pp. 847–881. [Google Scholar] [CrossRef]
  28. van Avendonk, H.J.A.; Hayman, N.W.; Harding, J.L.; Grevemeyer, I.; Peirce, C.; Dannowski, A. Seismic structure and segmentation of the axial valley of the Mid-Cayman preading Center. Geochem. Geophys. Geosyst. 2017, 18, 2149–2161. [Google Scholar] [CrossRef]
  29. Sudarikov, S.; Narkevsky, E.; Petrov, V. Identification of Two New Hydrothermal Fields and Sulfide Deposits on the Mid-Atlantic Ridge as a Result of the Combined Use of Exploration Methods: Methane Detection, Water Column Chemistry, Ore Sample Analysis, and Camera Surveys. Minerals 2021, 11, 726. [Google Scholar] [CrossRef]
  30. Yue, X.; Li, H.; Ren, J.; Tao, C.; Zhou, J.; Wang, Y.; Lü, X. Seafloor hydrothermal activity along mid-ocean ridge with strong melt supply: Study from segment 27, southwest Indian ridge. Sci. Rep. 2019, 9, 9874. [Google Scholar] [CrossRef] [PubMed]
  31. Huang, X.; Chen, S.; Zeng, Z.; Pu, X.; Hou, Q. The influence of seafloor hydrothermal activity on major and trace elements of the sediments from the South Mid-Atlantic Ridge. J. Ocean Univ. China 2017, 16, 775–780. [Google Scholar] [CrossRef]
  32. Pan, A.; Yang, Q.; Zhou, H.; Ji, F.; Wang, H.; Pancost, R.D. Geochemical impacts of hydrothermal activity on surface deposits at the Southwest Indian Ridge. Deep Sea Res. Part I Oceanogr. Res. Pap. 2018, 139, 1–13. [Google Scholar] [CrossRef]
  33. Von Damm, K.L. Seafloor hydrothermal activity: Black smoker chemistry and chimneys. Annu. Rev. Earth Planet. Sci. 1990, 18, 173–204. [Google Scholar] [CrossRef]
  34. Ilyin, A.V. Origin and development of the morphological structure of the rift zone of slow-spreading mid-ocean ridges. Oceanology 2010, 50, 240–253. [Google Scholar] [CrossRef]
  35. Orcutt, B.N.; D’Angelo, T.; Wheat, C.G.; Trembath-Reichert, E. Microbe-mineral biogeography from multi-year incubations in oceanic crust at North Pond, Mid-Atlantic Ridge. Environ. Microbiol. 2021, 23, 3923–3936. [Google Scholar] [CrossRef]
  36. Sun, Z.; He, Y.; Li, J.; Qi, C.; Li, J.; Liu, W. The recent progress of submarine hydrothermal biomineralization. Mar. Geol. Quat. Geol. 2011, 31, 123–132. [Google Scholar] [CrossRef]
  37. Kuznetsov, V.Y.; Tabuns, E.V.; Kuksa, K.A.; Cherkashov, G.A.; Bel’tenev, V.E.; Arslanov, K.A.; Maksimov, F.E.; Lazareva, L.I.; Zhuravleva, A.I.; Petrov, A.Y.; et al. Chronology of Hydrothermal Activity within the Yubileynoye Ore Field (Mid-Atlantic Ridge, 20°08′ N). Dokl. Earth Sci. 2018, 480, 700–704. [Google Scholar] [CrossRef]
  38. Doebelin, N.; Kleeberg, R. Profex: A graphical user interface for the Rietveld refinement program BGMN. J. Appl. Crystallogr. 2015, 48, 1573–1580. [Google Scholar] [CrossRef] [PubMed]
  39. Prabhu, K.M.M. Window Functions and Their Applications in Signal Processing; CRC Press: Boca Raton, FL, USA, 2018. [Google Scholar] [CrossRef]
  40. Porter, C.D.; Tanner, D.B. Correction of phase errors in fourier spectroscopy. Int. J. Infrared Millim. Waves 1983, 4, 273–298. [Google Scholar] [CrossRef]
  41. Brinco, J.; Guedes, P.; Gomes da Silva, M.; Mateus, E.P.; Ribeiro, A.B. Analysis of pesticide residues in soil: A review and comparison of methodologies. Microchem. J. 2023, 195, 109465. [Google Scholar] [CrossRef]
  42. Dzah, C.S.; Dzigbor, A. Ultrasound assisted extraction: A relook at solvent to material ratio, its effects on process efficiency and how it can be exploited for different uses. J. Food Process Eng. 2023, 46, e14339. [Google Scholar] [CrossRef]
  43. Temerdashev, Z.A.; Musorina, T.N.; Ovsepyan, S.K.; Korpakova, I.G. Determination of Polycyclic Aromatic Hydrocarbons in Soils and Bottom Sediments by Gas Chromatography–Mass Spectrometry with QuEChERS Sample Preparation. J. Anal. Chem. 2022, 77, 595–603. [Google Scholar] [CrossRef]
  44. Santana-Mayor, Á.; Socas-Rodríguez, B.; Herrera-Herrera, A.V.; Rodríguez-Delgado, M.Á. Current trends in QuEChERS method. A versatile procedure for food, environmental and biological analysis. TrAC Trends Anal. Chem. 2019, 116, 214–235. [Google Scholar] [CrossRef]
  45. Perestrelo, R.; Silva, P.; Porto-Figueira, P.; Pereira, J.A.M.; Silva, C.; Medina, S.; Câmara, J.S. QuEChERS—Fundamentals, relevant improvements, applications and future trends. Anal. Chim. Acta 2019, 1070, 1–28. [Google Scholar] [CrossRef]
  46. Temerdashev, Z.A.; Ovsepyan, S.K.; Musorina, T.N.; Vasileva, L.V.; Vasilev, A.M.; Korpakova, I.G. QuEChERS Extraction of PAHs from Various Soils and Sediments Followed by Chromatographic Determination. J. Anal. Chem. 2023, 78, 1159–1173. [Google Scholar] [CrossRef]
  47. Poole, C.; Mester, Z.; Miró, M.; Pedersen-Bjergaard, S.; Pawliszyn, J. Extraction for analytical scale sample preparation (IUPAC Technical Report). Pure Appl. Chem. 2016, 88, 649–687. [Google Scholar] [CrossRef]
  48. Kopka, J.; Schauer, N.; Krueger, S.; Birkemeyer, C.; Usadel, B.; Bergmuller, E.; Dormann, P.; Weckwerth, W.; Gibon, Y.; Stitt, M.; et al. [email protected]: The Golm Metabolome Database. Bioinformatics 2005, 21, 1635–1638. [Google Scholar] [CrossRef] [PubMed]
  49. Cremonezzi, J.M.d.O.; Tiba, D.Y.; Domingues, S.H. Fast synthesis of δ-MnO2 for a high-performance supercapacitor electrode. SN Appl. Sci. 2020, 2, 1689. [Google Scholar] [CrossRef]
  50. Julien, C. Raman spectra of birnessite manganese dioxides. Solid State Ion. 2003, 159, 345–356. [Google Scholar] [CrossRef]
  51. Bernardini, S.; Bellatreccia, F.; Casanova Municchia, A.; della Ventura, G.; Sodo, A. Raman spectra of natural manganese oxides. J. Raman Spectrosc. 2019, 50, 873–888. [Google Scholar] [CrossRef]
  52. Lavra, T.C.C.; Silva, L.A.; Cavalcante, K.S.B.; Marinho, K.L.L.; Figueira, B.A.M.; Mercury, J.M.R. Microwave radiation influence on the thermal and spectroscopic properties of Na-birnessite-type material. Cerâmica 2019, 65, 547–553. [Google Scholar] [CrossRef]
  53. Chukanov, N.V.; Chervonnyi, A.D. Infrared Spectroscopy of Minerals and Related Compounds; Springer International Publishing: Berlin/Heidelberg, Germany, 2016. [Google Scholar] [CrossRef]
  54. Abd El-Mageed, H.R.; Abd El-Salam, H.M.; Abdel-Latif, M.K.; Mustafa, F.M. Preparation and spectroscopic properties, density functional theory calculations and nonlinear optical properties of poly (acrylic acid-co-acrylamide)-graft-polyaniline. J. Mol. Struct. 2018, 1173, 268–279. [Google Scholar] [CrossRef]
  55. Hansen, P.E.; Spanget-Larsen, J. NMR and IR Investigations of Strong Intramolecular Hydrogen Bonds. Molecules 2017, 22, 552. [Google Scholar] [CrossRef]
  56. Pankin, D.; Povolotckaia, A.; Smirnov, M.; Borisov, E.; Gulyaev, A.; Dorochov, A.; Novikov, V.; Kuznetsov, S.; Noy, O.; Belousov, S.; et al. Theoretical Investigation of Anhydrofusarubin: Structural and Optical Properties. Crystals 2023, 13, 1556. [Google Scholar] [CrossRef]
  57. Mayo, D.W.; Miller, F.A.; Hannah, R.W. Course Notes on the Interpretation of Infrared and Raman Spectra; John Wiley & Sons: Hoboken, NJ, USA, 2004. [Google Scholar]
  58. Socrates, G. Infrared and Raman Characteristic Group Frequencies: Tables and Charts; John Wiley & Sons: Hoboken, NJ, USA, 2004. [Google Scholar]
  59. Pankin, D.; Povolotckaia, A.; Borisov, E.; Belyakov, M.; Borzenko, S.; Gulyaev, A.; Moskovskiy, M. Theoretical modelling of structure, vibrational and UV–vis absorbance spectra of rubrofusarin molecule. Spectrochim. Acta Part A Mol. Biomol. Spectrosc. 2023, 293, 122469. [Google Scholar] [CrossRef]
  60. Vandenabeele, P.; Wehling, B.; Moens, L.; Edwards, H.; de Reu, M.; van Hooydonk, G. Analysis with micro-Raman spectroscopy of natural organic binding media and varnishes used in art. Anal. Chim. Acta 2000, 407, 261–274. [Google Scholar] [CrossRef]
  61. Pankin, D.; Povolotckaia, A.; Borisov, E.; Rongonen, S.; Mikhailova, A.; Tkachenko, T.; Dovedova, N.; Rylkova, L.; Kurochkin, A. Investigation of wafers used as paper binding in the academician von Struve manuscripts. J. Cult. Herit. 2021, 51, 125–131. [Google Scholar] [CrossRef]
  62. Hanesch, M. Raman spectroscopy of iron oxides and (oxy)hydroxides at low laser power and possible applications in environmental magnetic studies. Geophys. J. Int. 2009, 177, 941–948. [Google Scholar] [CrossRef]
  63. Prokuratov, D.S.; Davtian, A.S.; Vereshchagin, O.S.; Kurganov, N.S.; Samokhvalov, A.A.; Pankin, D.V.; Povolotckaia, A.V.; Shimko, A.A.; Mikhailova, A.A.; Somov, P.A.; et al. Laser cleaning of archaeologically corroded iron objects with inlays. Opt. Quantum Electron. 2020, 52, 113. [Google Scholar] [CrossRef]
  64. Bellot-Gurlet, L.; Neff, D.; Réguer, S.; Monnier, J.; Saheb, M.; Dillmann, P. Raman Studies of Corrosion Layers Formed on Archaeological Irons in Various Media. J. Nano Res. 2009, 8, 147–156. [Google Scholar] [CrossRef]
  65. Pollard, R.J.; Pankhurst, Q.A. Ferrimagnetism in fine feroxyhite particles. J. Magn. Magn. Mater. 1991, 99, L39–L44. [Google Scholar] [CrossRef]
  66. Mazzetti, L.; Thistlethwaite, P.J. Raman spectra and thermal transformations of ferrihydrite and schwertmannite. J. Raman Spectrosc. 2002, 33, 104–111. [Google Scholar] [CrossRef]
  67. Post, J.E.; McKeown, D.A.; Heaney, P.J. Raman spectroscopy study of manganese oxides: Tunnel structures. Am. Mineral. 2020, 105, 1175–1190. [Google Scholar] [CrossRef]
  68. Reiche, I.; Coquinot, Y.; Trosseau, A.; Maigret, A. First discovery of charcoal-based prehistoric cave art in Dordogne. Sci. Rep. 2023, 13, 22235. [Google Scholar] [CrossRef]
  69. Murad, E.; Cashion, J. Mössbauer Spectroscopy of Environmental Materials and Their Industrial Utilization; Springer Science & Business Media: Secaucus, NJ, USA, 2004. [Google Scholar] [CrossRef]
  70. Murad, E. The Mössbauer spectrum of “well”-crystallized ferrihydrite. J. Magn. Magn. Mater. 1988, 74, 153–157. [Google Scholar] [CrossRef]
  71. Insight into Superparamagnetism in Magnetic Nanoparticles. In Magnetic Nanoparticles; Wiley: Hoboken, NJ, USA, 2022; pp. 219–232. [CrossRef]
  72. Ta, K.; Peng, X.; Chen, S.; Xu, H.; Li, J.; Du, M.; Hao, J.; Lin, Y. Hydrothermal nontronite formation associated with microbes from low-temperature diffuse hydrothermal vents at the South Mid-Atlantic Ridge. J. Geophys. Res. Biogeosci. 2017, 122, 2375–2392. [Google Scholar] [CrossRef]
  73. Benzerara, K.; Elmaleh, A.; Ciobanu, M.; de Wever, A.; Bertolino, P.; Iniesto, M.; Jézéquel, D.; López-García, P.; Menguy, N.; Muller, E.; et al. Biomineralization of amorphous Fe-, Mn- and Si-rich mineral phases by cyanobacteria under oxic and alkaline conditions. Biogeosciences 2023, 20, 4183–4195. [Google Scholar] [CrossRef]
  74. Baines, S.B.; Twining, B.S.; Brzezinski, M.A.; Krause, J.W.; Vogt, S.; Assael, D.; McDaniel, H. Significant silicon accumulation by marine picocyanobacteria. Nat. Geosci. 2012, 5, 886–891. [Google Scholar] [CrossRef]
  75. Mackenzie, F.T.; Stoffyn, M.; Wollast, R. Aluminum in Seawater: Control by Biological Activity. Science 1978, 199, 680–682. [Google Scholar] [CrossRef]
  76. Akhmetzhanov, T.F.; Labutin, T.A.; Zaytsev, S.M.; Drozdova, A.N.; Popov, A.M. Determination of the Mn/Fe Ratio in Ferromanganese Nodules Using Calibration-Free Laser-Induced Breakdown Spectroscopy. Opt. Spectrosc. 2019, 126, 316–320. [Google Scholar] [CrossRef]
  77. Ta, K.; Wu, Z.; Peng, X.; Luan, Z.; Chen, S. Formation and origin of Fe–Si oxyhydroxide deposits at the ultra-slow spreading Southwest Indian Ridge. Deep Sea Res. Part I Oceanogr. Res. Pap. 2021, 170, 103491. [Google Scholar] [CrossRef]
  78. Baturin, G.N.; Dubinchuk, V.T. Mineralogy and chemistry of ferromanganese crusts from the Atlantic Ocean. Geochem. Int. 2011, 49, 578–593. [Google Scholar] [CrossRef]
  79. Dubinin, A.V.; Rimskaya-Korsakova, M.N.; Berezhnaya, E.D.; Uspenskaya, T.U.; Dara, O.M. Ferromanganese Crusts in the South Atlantic Ocean: Compositional Evolution and Specific Features of Ore Formation. Geochem. Int. 2018, 56, 1093–1108. [Google Scholar] [CrossRef]
  80. Dekoninck, A.; Bernard, A.; Barbarand, J.; Saint-Bezar, B.; Missenard, Y.; Lepretre, R.; Saddiqi, O.; Yans, J. Detailed mineralogy and petrology of manganese oxyhydroxide deposits of the Imini district (Morocco). Miner. Depos. 2015, 51, 13–23. [Google Scholar] [CrossRef]
  81. Zhao, H.; Liang, X.; Yin, H.; Liu, F.; Tan, W.; Qiu, G.; Feng, X. Formation of todorokite from “c-disordered” H+-birnessites: The roles of average manganese oxidation state and interlayer cations. Geochem. Trans. 2015, 16, 8. [Google Scholar] [CrossRef]
  82. Liu, F.; Qiu, G.-G.; Tan, W.; Chen, X.-H.; Cui, G.-J.; Feng, X. Progress in the Study of Todorokite. Adv. Earth Sci. 2009, 24, 1084–1093. [Google Scholar] [CrossRef]
  83. Cornell, R.M.; Schwertmann, U. The Iron Oxides: Structure, Properties, Reactions, Occurrences and Uses; Wiley-VCH: Hoboken, NJ, USA, 2003. [Google Scholar]
  84. Harrison, P.M.; Arosio, P. The Ferritins: Molecular Properties, Iron Storage Function and Cellular Regulation. Biochim. Biophys. Acta 1996, 1275, 161–203. [Google Scholar] [CrossRef] [PubMed]
  85. Brindley, G.W.; Brown, G. Crystal Structures of Clay Minerals and Their X-ray Identification; The Mineralogical Society of Great Britain and Ireland: London, UK, 1980. [Google Scholar]
  86. Köhler, B.; Singer, A.; Stoffers, P. Biogenic Nontronite from Marine White Smoker Chimneys. Clays Clay Miner. 1994, 42, 689–701. [Google Scholar] [CrossRef]
  87. Cole, T.G.; Shaw, H.F. The nature and origin of authigenic smectites in some recent marine sediments. Clay Miner. 1983, 18, 239–252. [Google Scholar] [CrossRef]
  88. Sun, Z.; Li, J.; Huang, W.; Dong, H.; Little, T.S.; Li, J. Generation of hydrothermal Fe-Si oxyhydroxide deposit on the Southwest Indian Ridge and its implication for the origin of ancient banded iron formations. J. Geophys. Res. Biogeosci. 2015, 120, 187–203. [Google Scholar] [CrossRef]
  89. Lubetkin, M.; Carey, S.; Kelley, K.A.; Robert, G.; Cornell, W.; Raineault, N.; Balcanoff, J.; Ballard, R.D.; Salinas-de-León, P. Nontronite-bearing tubular hydrothermal deposits from a Galapagos seamount. Deep Sea Res. Part II Top. Stud. Oceanogr. 2018, 150, 181–194. [Google Scholar] [CrossRef]
  90. Mueller, E.; Philp, R.P. Extraction of high molecular weight hydrocarbons from source rocks: An example from the Green River Formation, Uinta Basin, Utah. Org. Geochem. 1998, 28, 625–631. [Google Scholar] [CrossRef]
  91. Konn, C.; Charlou, J.L.; Donval, J.P.; Holm, N.G.; Dehairs, F.; Bouillon, S. Hydrocarbons and oxidized organic compounds in hydrothermal fluids from Rainbow and Lost City ultramafic hosted vents. Chem. Geol. 2009, 258, 299–314. [Google Scholar] [CrossRef]
  92. Morgunova, I.P.; Ivanov, V.N.; Litvinenko, I.V.; Petrova, V.I.; Stepanova, T.V.; Cherkashev, G.A. Geochemistry of organic matter in bottom sediments of the Ashadze hydrothermal field. Oceanology 2012, 52, 345–353. [Google Scholar] [CrossRef]
  93. Simoneit, B.R.T. A review of current applications of mass-spectrometry for biomarker/molecular tracer elucidations. Mass Spectrom. Rev. 2005, 24, 719–765. [Google Scholar] [CrossRef]
  94. Wade, M.L.; Agresti, D.G.; Wdowiak, T.J.; Armendarez, L.P.; Farmer, J.D. A Mössbauer investigation of iron-rich terrestrial hydrothermal vent systems: Lessons for Mars exploration. J. Geophys. Res. Planets 1999, 104, 8489–8507. [Google Scholar] [CrossRef]
  95. Oshtrakh, M.I.; Milder, O.B.; Semionkin, V.A.; Malakheeva, L.I.; Prokopenko, P.G. Analysis of iron storage proteins in chicken liver and spleen tissues in comparison with human liver ferritin by Mössbauer spectroscopy. J. Radioanal. Nucl. Chem. 2006, 269, 671–677. [Google Scholar] [CrossRef]
  96. Stolyar, S.V.; Bayukov, O.A.; Gurevich, Y.L.; Ladygina, V.P.; Iskhakov, R.S.; Pustoshilov, P.P. Mössbauer study of bacterial ferrihydrite. Inorg. Mater. 2007, 43, 638–641. [Google Scholar] [CrossRef]
  97. Stolyar, S.V.; Bayukov, O.A.; Ishkakov, R.S.; Gurevich, Y.L.; Ladygina, V.P. Mössbauer investigation of iron-producing bacteria Kleb. Oxytoca. Bull. Russ. Acad. Sci. Phys. 2007, 71, 1286–1290. [Google Scholar] [CrossRef]
  98. Stolyar, S.V.; Bayukov, O.A.; Iskhakov, R.S.; Ishchenko, L.A.; Yakovchuk, V.Y.; Piksina, O.E.; Pozdnyakov, A.I.; Ladygina, V.P.; Dobretsov, K.G. Mössbauer investigation of temperature transformations in bacterial ferrihydrite. Phys. Solid State 2011, 53, 100–104. [Google Scholar] [CrossRef]
  99. Ershov, N.V.; Kleĭnerman, N.M.; Lukshina, V.A.; Pilyugin, V.P.; Serikov, V.V. Specific features of the local atomic structure of a Fe-Si alloy in the α area of the phase diagram. Phys. Solid State 2009, 51, 1236–1242. [Google Scholar] [CrossRef]
  100. Chukhrov, F.V.; Zvyagin, B.B.; Gorshkov, A.I.; Yermilova, L.P.; Korovushkin, V.V.; Rudnitskaya, Y.S.; Yakubovskaya, N.Y. Feroxyhyte, a new modification of FeOOH. Int. Geol. Rev. 1977, 19, 873–890. [Google Scholar] [CrossRef]
  101. Balaev, D.A.; Stolyar, S.V.; Knyazev, Y.V.; Yaroslavtsev, R.N.; Pankrats, A.I.; Vorotynov, A.M.; Krasikov, A.A.; Velikanov, D.A.; Bayukov, O.A.; Ladygina, V.P.; et al. Role of the Surface Effects and Interparticle Magnetic Interactions in the Temperature Evolution of Magnetic Resonance Spectra of Ferrihydrite Nanoparticle Ensembles. Results Phys. 2022, 35, 105340. [Google Scholar] [CrossRef]
  102. Stolyar, S.V.; Balaev, D.A.; Ladygina, V.P.; Dubrovskiy, A.A.; Krasikov, A.A.; Popkov, S.I.; Bayukov, O.A.; Knyazev, Y.V.; Yaroslavtsev, R.N.; Volochaev, M.N.; et al. Bacterial Ferrihydrite Nanoparticles: Preparation, Magnetic Properties, and Application in Medicine. J. Supercond. Nov. Magn. 2018, 31, 2297–2304. [Google Scholar] [CrossRef]
  103. Balaev, D.A.; Krasikov, A.A.; Stolyar, S.V.; Iskhakov, R.S.; Ladygina, V.P.; Yaroslavtsev, R.N.; Bayukov, O.A.; Vorotynov, A.M.; Volochaev, M.N.; Dubrovskiy, A.A. Change in the Magnetic Properties of Nanoferrihydrite with an Increase in the Volume of Nanoparticles During Low-Temperature Annealing. Phys. Solid State 2016, 58, 1782–1791. [Google Scholar] [CrossRef]
  104. Stolyar, S.V.; Kolenchukova, O.A.; Boldyreva, A.V.; Kudryasheva, N.S.; Gerasimova, Y.V.; Krasikov, A.A.; Yaroslavtsev, R.N.; Bayukov, O.A.; Ladygina, V.P.; Birukova, E.A. Biogenic Ferrihydrite Nanoparticles: Synthesis, Properties In Vitro and In Vivo Testing and the Concentration Effect. Biomedicines 2021, 9, 323. [Google Scholar] [CrossRef]
  105. Balaev, D.A.; Krasikov, A.A.; Dubrovskiy, A.A.; Semenov, S.V.; Popkov, S.I.; Stolyar, S.V.; Iskhakov, R.S.; Ladygina, V.P.; Yaroslavtsev, R.N. Specific features of magnetic properties of ferrihydrite nanoparticles of bacterial origin: A shift of the hysteresis loop. Phys. Solid State 2016, 58, 287–292. [Google Scholar] [CrossRef]
  106. Balaev, D.A.; Krasikov, A.A.; Dubrovskii, A.A.; Semenov, S.V.; Bayukov, O.A.; Stolyar, S.V.; Iskhakov, R.S.; Ladygina, V.P.; Ishchenko, L.A. Magnetic properties and the mechanism of formation of the uncompensated magnetic moment of antiferromagnetic ferrihydrite nanoparticles of a bacterial origin. J. Exp. Theor. Phys. 2014, 119, 479–487. [Google Scholar] [CrossRef]
  107. Balaev, D.A.; Krasikov, A.A.; Dubrovskiy, A.A.; Popkov, S.I.; Stolyar, S.V.; Iskhakov, R.S.; Ladygina, V.P.; Yaroslavtsev, R.N. Exchange bias in nano-ferrihydrite. J. Appl. Phys. 2016, 120, 183903. [Google Scholar] [CrossRef]
  108. Schulz, K.; ThomasArrigo, L.K.; Kaegi, R.; Kretzschmar, R. Stabilization of Ferrihydrite and Lepidocrocite by Silicate during Fe(II)-Catalyzed Mineral Transformation: Impact on Particle Morphology and Silicate Distribution. Environ. Sci. Technol. 2022, 56, 5929–5938. [Google Scholar] [CrossRef] [PubMed]
  109. Wang, P.; Shi, T.; Mehta, N.; Yang, S.; Wang, H.; Liu, D.; Zhu, Z. Changes in Magnetic Properties of Magnetite Nanoparticles Upon Microbial Iron Reduction. Geochem. Geophys. Geosyst. 2022, 23, e2021GC010212. [Google Scholar] [CrossRef]
  110. Jeong, M.; Kim, Y.; Roh, Y. Biogenesis of Magnetite Nanoparticles Using Shewanella Species Isolated from Diverse Regions. J. Nanosci. Nanotechnol. 2019, 19, 963–966. [Google Scholar] [CrossRef]
  111. Liu, D.; Dong, H.; Zhao, L.; Wang, H. Smectite Reduction by Shewanella Species as Facilitated by Cystine and Cysteine. Geomicrobiol. J. 2014, 31, 53–63. [Google Scholar] [CrossRef]
  112. Néel, L. Théorie du traînage magnétique des ferromagnétiques en grains fins avec application aux terres cuites. Ann. Géophysique 1949, 5, 99–136. [Google Scholar]
  113. Kharitonskii, P.; Sergienko, E.; Ralin, A.; Setrov, E.; Sheidaev, T.; Gareev, K.; Ustinov, A.; Zolotov, N.; Yanson, S.; Dubeshko, D. Superparamagnetism of Artificial Glasses Based on Rocks: Experimental Data and Theoretical Modeling. Magnetochemistry 2023, 9, 220. [Google Scholar] [CrossRef]
  114. Afremov, L.L.; Anisimov, S.; Iliushin, I. Blocking Temperature of a System of Core/Shell Nanoparticles. Solid State Phenomena 2020, 312, 270–274. [Google Scholar] [CrossRef]
  115. Guyodo, Y.; Banerjee, S.K.; Penn, R.L.; Burleson, D.; Berquo, T.S.; Seda, T.; Solheid, P. Magnetic properties of synthetic six-line ferrihydrite nanoparticles. Phys. Earth Planet. Inter. 2006, 154, 222–233. [Google Scholar] [CrossRef]
  116. Carta, D.; Casula, M.F.; Corrias, A.; Falqui, A.; Navarra, G.; Pinna, G. Structural and magnetic characterization of synthetic ferrihydrite nanoparticles. Mater. Chem. Phys. 2009, 113, 349–355. [Google Scholar] [CrossRef]
  117. Punnoose, A.; Seehra, M.S.; van Tol, J.; Brunel, L.C. High-frequency electron magnetic resonance and magnetic studies of ferrihydrite nanoparticles and evidence of a phase transition. J. Magn. Magn. Mater. 2005, 288, 168–172. [Google Scholar] [CrossRef]
  118. Punnoose, A.; Phanthavady, T.; Seehra, M.S.; Shah, N.; Huffman, G.P. Magnetic properties of ferrihydrite nanoparticles doped with Ni, Mo, and Ir. Phys. Rev. B 2004, 69, 054425. [Google Scholar] [CrossRef]
  119. Silva, N.J.O.; Amaral, V.S.; Carlos, L.D.; Rodríguez-González, B.; Liz-Marzán, L.M.; Millan, A.; de Zea Bermudez, V. Structural and magnetic studies in ferrihydrite nanoparticles formed within organic-inorganic hybrid matrices. J. Appl. Phys 2006, 100, 054301. [Google Scholar] [CrossRef]
  120. Komogortsev, S.V.; Balaev, D.A.; Krasikov, A.A.; Stolyar, S.V.; Yaroslavtsev, R.N.; Ladygina, V.P.; Iskhakov, R.S. Magnetic hysteresis of blocked ferrihydrite nanoparticles. AIP Adv. 2021, 11, 015329. [Google Scholar] [CrossRef]
  121. Makhlouf, S.A.; Parker, F.T.; Berkowitz, A.E. Magnetic hysteresis anomalies in ferritin. Phys. Rev. B 1997, 55, R14717–R14720. [Google Scholar] [CrossRef]
  122. Dubiel, S.M.; Zablotna-Rypien, B.; Mackey, J.B.; Williams, J.M. Magnetic properties of human liver and brain ferritin. Eur. Biophys. J. 1999, 28, 263–267. [Google Scholar] [CrossRef]
  123. Cardile, C.M.; Johnston, J.H.; Dickson, D.P.E. Magnetic Ordering At 4.2 And 1.3 K in Nontronites of Different Iron Contents: A 57Fe Mössbauer Spectroscopic Study. Clays Clay Miner. 1986, 34, 233–238. [Google Scholar] [CrossRef]
  124. Rumpf, K.; Granitzer, P.; Morales, P.; Poelt, P.; Reissner, M. Variable blocking temperature of a porous silicon/Fe3O4 composite due to different interactions of the magnetic nanoparticles. Nanoscale Res. Lett. 2012, 7, 445. [Google Scholar] [CrossRef]
  125. Scott, J.J.; Breier, J.A.; Luther, G.W.; Emerson, D. Microbial Iron Mats at the Mid-Atlantic Ridge and Evidence that Zetaproteobacteria May Be Restricted to Iron-Oxidizing Marine Systems. PLoS ONE 2015, 10, e0119284. [Google Scholar] [CrossRef] [PubMed]
  126. Hribovšek, P.; Olesin Denny, E.; Dahle, H.; Mall, A.; Øfstegaard Viflot, T.; Boonnawa, C.; Reeves, E.P.; Steen, I.H.; Stokke, R. Putative novel hydrogen- and iron-oxidizing sheath-producing Zetaproteobacteria thrive at the Fåvne deep-sea hydrothermal vent field. MSystems 2023, 8, e00543-23. [Google Scholar] [CrossRef] [PubMed]
  127. Slobodkina, G.B.; Kolganova, T.V.; Chernyh, N.A.; Querellou, J.; Bonch-Osmolovskaya, E.A.; Slobodkin, A.I. Deferribacter autotrophicus sp. nov., an iron(III)-reducing bacterium from a deep-sea hydrothermal vent. Int. J. Syst. Evol. Microbiol. 2009, 59, 1508–1512. [Google Scholar] [CrossRef] [PubMed]
  128. Konhauser, K.O. Introduction to Geomicrobiology; Wiley-Blackwell: Hoboken, NJ, USA, 2007. [Google Scholar]
  129. Dehouck, E.; McLennan, S.M.; Sklute, E.C.; Dyar, M.D. Stability and fate of ferrihydrite during episodes of water/rock interactions on early Mars: An experimental approach. J. Geophys. Res. 2017, 122, 358–382. [Google Scholar] [CrossRef]
Figure 1. Sampling of ferromanganese crusts in the Puy de Folles volcano area: (a) sampling site; (b) ferromanganese formation, depth is indicated on the left; (c,d) degassing channels.
Geosciences 14 00240 g001
Figure 2. Optical images obtained in reflected light of the Fe-Mn Puy de Folles sample: (a) layered structure and sampling locations for further studies; (b) dendrite-like, branching, and bunched Fe-Mn aggregates.
Geosciences 14 00240 g002
Figure 3. SEM images of Fe-Mn Puy de Folles. General view: branching-tubular, bunched aggregates of collomorphic-globular structure (ac). “Footwall-like” tubes, globular structure of Fe-Mn formations (d,e), globule size (f). Internal structure of tubes. Cross section: globular structure of the outer layer and concentric-zonal, radial–radial aggregates inside (gi).
Geosciences 14 00240 g003
Figure 4. EDS elemental mapping results: (a) SEM image; (b) phase composition map: volcanic glass fragments with altered periphery (yellow), carbon-silicate substrate cementing glass fragments (blue), iron-silicate phase constituting globular tubes (red), Mn-containing concentric-zonal and radial-array aggregates (green); (cf) distribution of chemical elements.
Geosciences 14 00240 g004
Figure 5. Mössbauer spectra: (a) FM1 and FM2 in the velocity range ±12 mm/s; (b) FM1 in the velocity range ±4.5 mm/s; (c) distribution of quadrupole splittings. Blue, red, cyan, and violet show the different modes of decomposition of the spectra.
Geosciences 14 00240 g005
Figure 6. Hysteresis loops measured in fields ± 7 T. In the insets: central part of the loop (top left), destruction curve of the residual magnetization created in a field of 7 T (bottom right); (a) at 295 K; (b) at 2 K.
Geosciences 14 00240 g006
Figure 7. Temperature dependences of (a) inductive (the inset shows the differentiated ZFC curve and its smoothing by the moving average method), and (b) residual magnetization (the blue curve corresponds to SIRM in the “cooling–heating” cycle; the inset shows it in the temperature range of 2–14 K).
Geosciences 14 00240 g007
Table 1. Content of main chemical elements according to XRF data.
Oxi. (wt %)FM1FM2
MnOtot57.536.2
FeOtot25.022.6
SiO29.926.5
Al2O30.81.1
Other elements6.813.6
Σ100100
Table 2. Optical densities (D) of extracts for different extractants; ε is the relative dielectric constant of the extractants.
Extractantε (25 °C)D (λ = 254 nm)
FM1FM2
n-Hexane1.90.2350.150
Chloroform4.90.1270.102
Ethanol24.60.0780.082
Acetonitrile37.5−0.003−0.021
Water78.60.1150.080
Table 3. Parameters of the Mössbauer spectrum of sample FM1 in the velocity range ±12 mm/s and the velocity range ±4.5 mm/s: line width W, isomeric chemical shift IS, quadrupole splitting QS, position occupancy S.
Velocity Range (mm/s)Spectral ComponentW (mm/s)IS (mm/s)QS (mm/s)S (%)
±12D10.33 ± 0.020.37 ± 0.010.61 ± 0.0248.46
D20.39 ± 0.020.36 ± 0.011.02 ± 0.0251.54
±4.5D10.27 ± 0.020.37 ± 0.030.46 ± 0.0320.16
D20.29 ± 0.080.37 ± 0.020.69 ± 0.0433.54
D30.29 ± 0.070.36 ± 0.020.93 ± 0.0528.06
D40.24 ± 0.090.37 ± 0.031.20 ± 0.0312.08
D50.27 ± 0.060.36 ± 0.041.55 ± 0.076.17
Table 4. Magnetic hysteresis parameters at temperatures of 2 K and 295 K.
Temperature, Kμ0Hc, mTμ0Hcr, mTMrs, A·m2/kg
2104.01100.00.4
2950.1230.04.0 × 10−5
Disclaimer/Publisher’s Note: The statements, opinions and data contained in all publications are solely those of the individual author(s) and contributor(s) and not of MDPI and/or the editor(s). MDPI and/or the editor(s) disclaim responsibility for any injury to people or property resulting from any ideas, methods, instructions or products referred to in the content.

