Abstract
Hydraulic fracturing is a crucial technology for resource development, such as shale gas, and its optimization is necessary to enhance development efficiency. However, evaluating fracture shapes involves technical uncertainties. Japan Organization for Metals and Energy Security (JOGMEC) and Kyoto University have conducted laboratory-scale hydraulic fracturing experiments using coagulable fluorescent resin as the injection fluid (resin fracturing test) to visualize hydraulic fractures and investigate their relationship with acoustic emissions (AEs) generated during fracturing. Since lab-scale experiments can only examine the phenomena near the injection hole owing to size limitations, we designed an experiment to apply the visualization method to the outcrop scale. This paper presents the results from an in situ, outcrop-scale hydraulic fracturing experiment conducted at the Kamioka Mine, Gifu Prefecture, Japan, from 2022 to 2023, with goals similar to those of the laboratory experiments. A resin fracturing borehole (RF1) with a diameter of 76 mm was core-drilled to a depth of approximately 10 m for the resin fracturing tests. AEs were observed in five boreholes drilled around RF1 at the same depth. Resin fracturing tests were performed at two different depths, with breakdown confirmed at both. A core of a larger diameter (205 mm) was recovered by coaxial overcoring around RF1, and resin-filled fractures were observed under black light on the core surfaces. After the resin fracturing experiment, two analyses were performed using the acquired core and AE data to predict the fracture extension and the mechanism of AE occurrence. We compared the distribution of AE events and visualized fractures in the core. Additionally, we compared the stress direction estimated from failure mechanism analysis using AE data with the maximum stress direction estimated from hydraulic fracturing. Our analysis provided several insights into fracture extension. The distribution of AE hypocenters was consistent with the direction of the hydraulic fractures confirmed by coring after the resin fracturing test. The failure mechanisms are classified based on the polarity of the first P-wave motion of the AE waveform. However, the actual scale of oil fields is significantly larger than that considered in this study. Discussing visible fractures created by hydraulic fracturing is deemed meaningful. We expect that the results of this study will provide valuable information for the precise estimation of hydraulic fractures.
1. Introduction
Hydraulic fracturing has been widely used to increase reservoir productivity in unconventional resources such as tight and shale oil/gas reservoirs. Oil and gas are stored in low-porosity impermeable reservoirs. To enhance the productivity of tight reservoirs, compressed fluid is injected into the reservoirs to create induced fractures [1]. Induced fractures increase the complexity associated with the existence of natural fractures, vertical layer continuity and diversity, faults, and geological settings [2]. Estimating fracture geometry is crucial for optimizing allocation and completion design. However, hydraulic fracturing is operated in the field at depths of 3000–4000 m below the surface and direct observation is not possible under subsurface conditions. Microseismic images are widely used to estimate fracture direction, length, and volume when a fracture network called stimulated volume develops (e.g., refs. [3,4]). During hydraulic fracturing, the main fractures are created by the tensile mechanism [5]. However, microseismic events observed in several fields are dominated by a shear mechanism [6], which causes a paradox between microseismic and hydraulic fractures. When a hydraulic fracture meets a pre-existing natural fracture, shear deformation occurs, resulting in shear microseismic events, which can be one of the reasons for the paradox [7]. Although the theoretical understanding of hydraulic fracture network creation has been advanced by microseismic monitoring and consideration of geomechanical scenarios, experimental data to examine visible hydraulic fractures to confirm scenarios are limited.
Various laboratory-scale hydraulic fracturing experiments have been attempted. Early HF experiments are found in Haimson and Fairhurst, 1969 [8], and Cheung and Haimson, 1989 [9]. They examined the validity of breakdown pressure and shut-in pressure for HF stress measurement for 125 × 125 × 140 mm blocks of hydrostones and Niagara dolomite of similar size. Guo et al. investigated the effect of specimen size on breakdown pressure [10], leak-off phenomena [11], and communication of two wells [12] using gypstone block. In 1996, Morita et al. [13] conducted HF experiments to investigate the sealing mechanism of the drilling mud. In 2008, Bunger and Detournay [14] used 200 × 200 × 150 mm transparent polymethyl methacrylate and borosilicate glass blocks to investigate fluid-driven fracture extension behavior. To visualize the fractures and understand the mechanism of hydraulic fracture creation, laboratory-scale hydraulic fracturing experiments have been conducted using a coagulable fluorescence resin as the injection fluid (e.g., [15,16,17]). In 2018, Naoi et al. [17] found that the resin penetration area does not always correspond to the AE hypocenter distribution. In other words, fractures may propagate even if no AE has occurred. The results indicated that, in such cases, it is possible to recover more oil and gas than those expected by the distribution of microseismic activity. These experiments investigate the relationship between extremely small seismic events, called acoustic emissions (AEs), generated by hydraulic fracturing and induced actual cracks. The experiment is useful for understanding the fracture propagation process and its relationship with microscopic rock characteristics. However, the propagation of fractures can only be captured in the vicinity of the injection hole owing to the limitation of sample size in laboratories. Oil and gas fields are quite large, on the order of kilometers; therefore, large-scale gaps exist between laboratory-scale and actual fields, along with natural fractures, bedding, anisotropy, and stress changes in actual fields. To bridge these gaps, we have designed a visualization of the hydraulic fracture experiments at the outcrop-scale (in the order of meters). Several experiments have been conducted to perform hydraulic fracturing and AE observations at the outcrop-scale [18,19]. In 2009, Ishida et al. [18] conducted a hydraulic fracturing experiment using a borehole approximately 10 m deep and estimated the failure mechanism by analyzing the observed AE. They [19] also conducted hydraulic fracturing experiments using supercritical CO2 as the fracturing fluid and compared the hypocenter distribution of AE with induced fractures observed in coaxial large-diameter overcored cores. In these outcrop-scale experiments, it was not possible to clearly distinguish between pre-existing fractures and fractures newly generated by hydraulic fracturing.
This study is designed to clearly visualize the newly created fractures from hydraulic fracturing by using coagulable resin mixed with a fluorescent agent as the fracturing fluid, based on the fracturing system of Ishida et al. 2019 [18].
2. Materials and Methods
2.1. Location and Geology
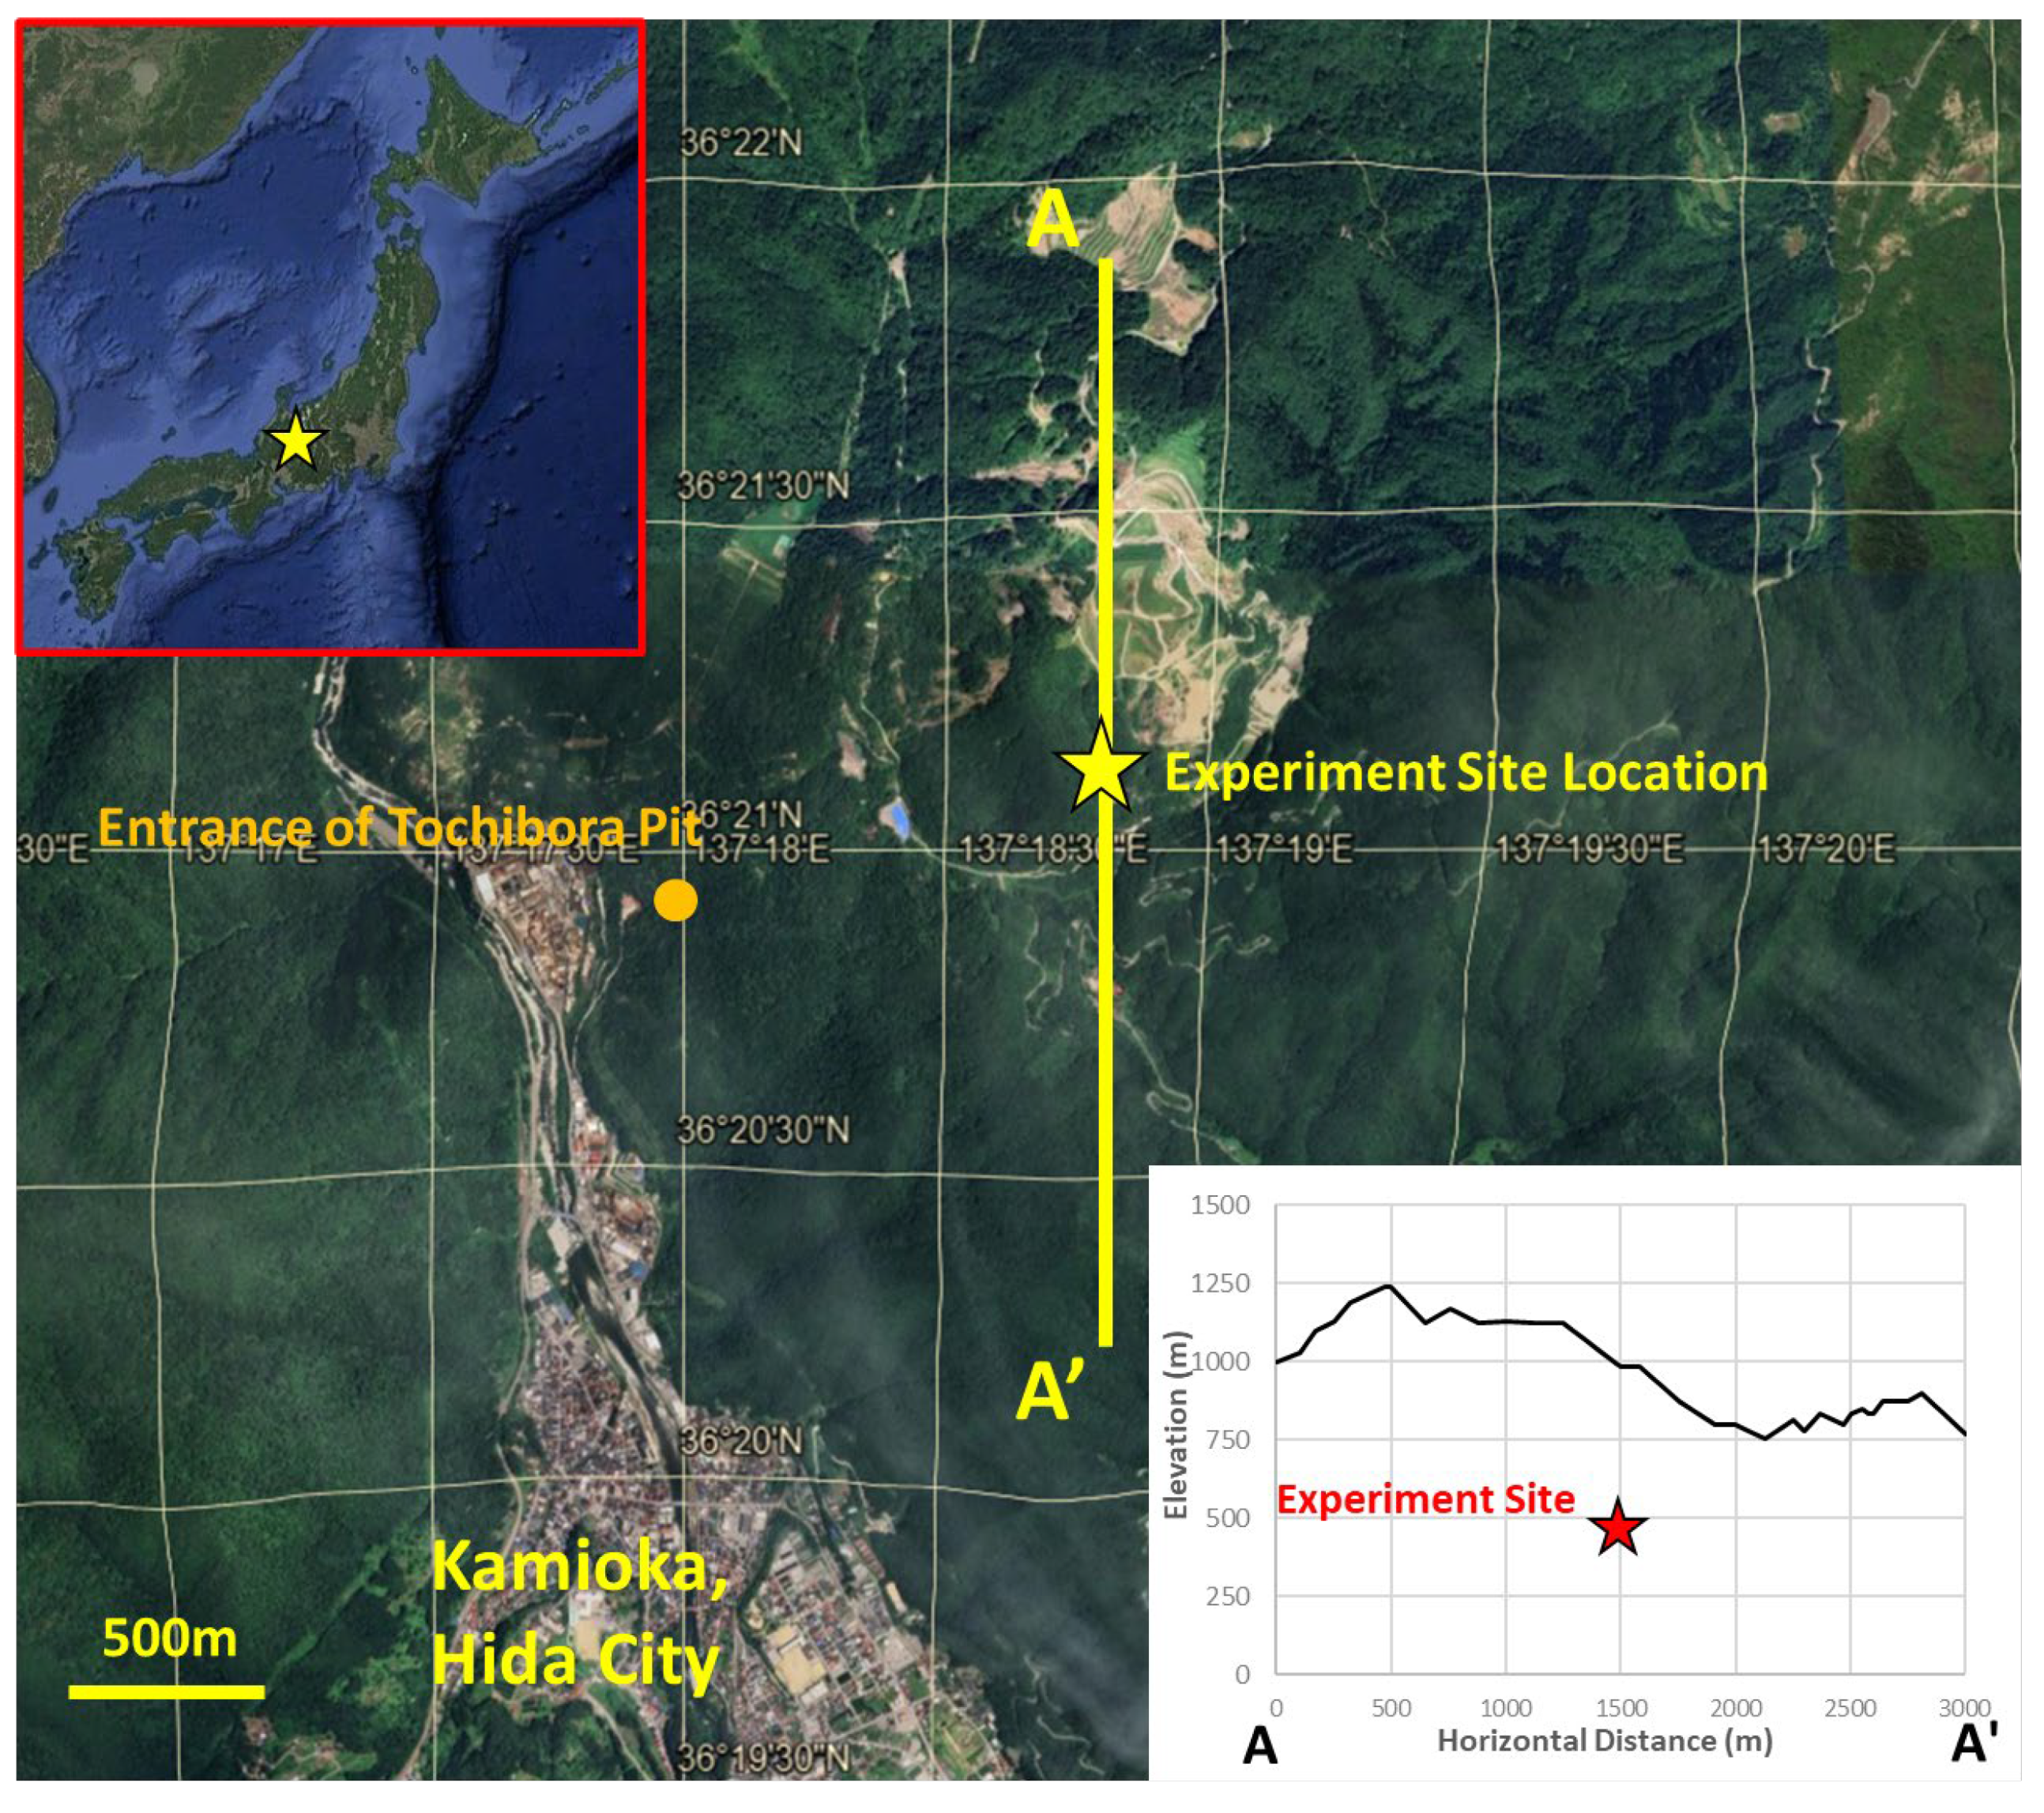
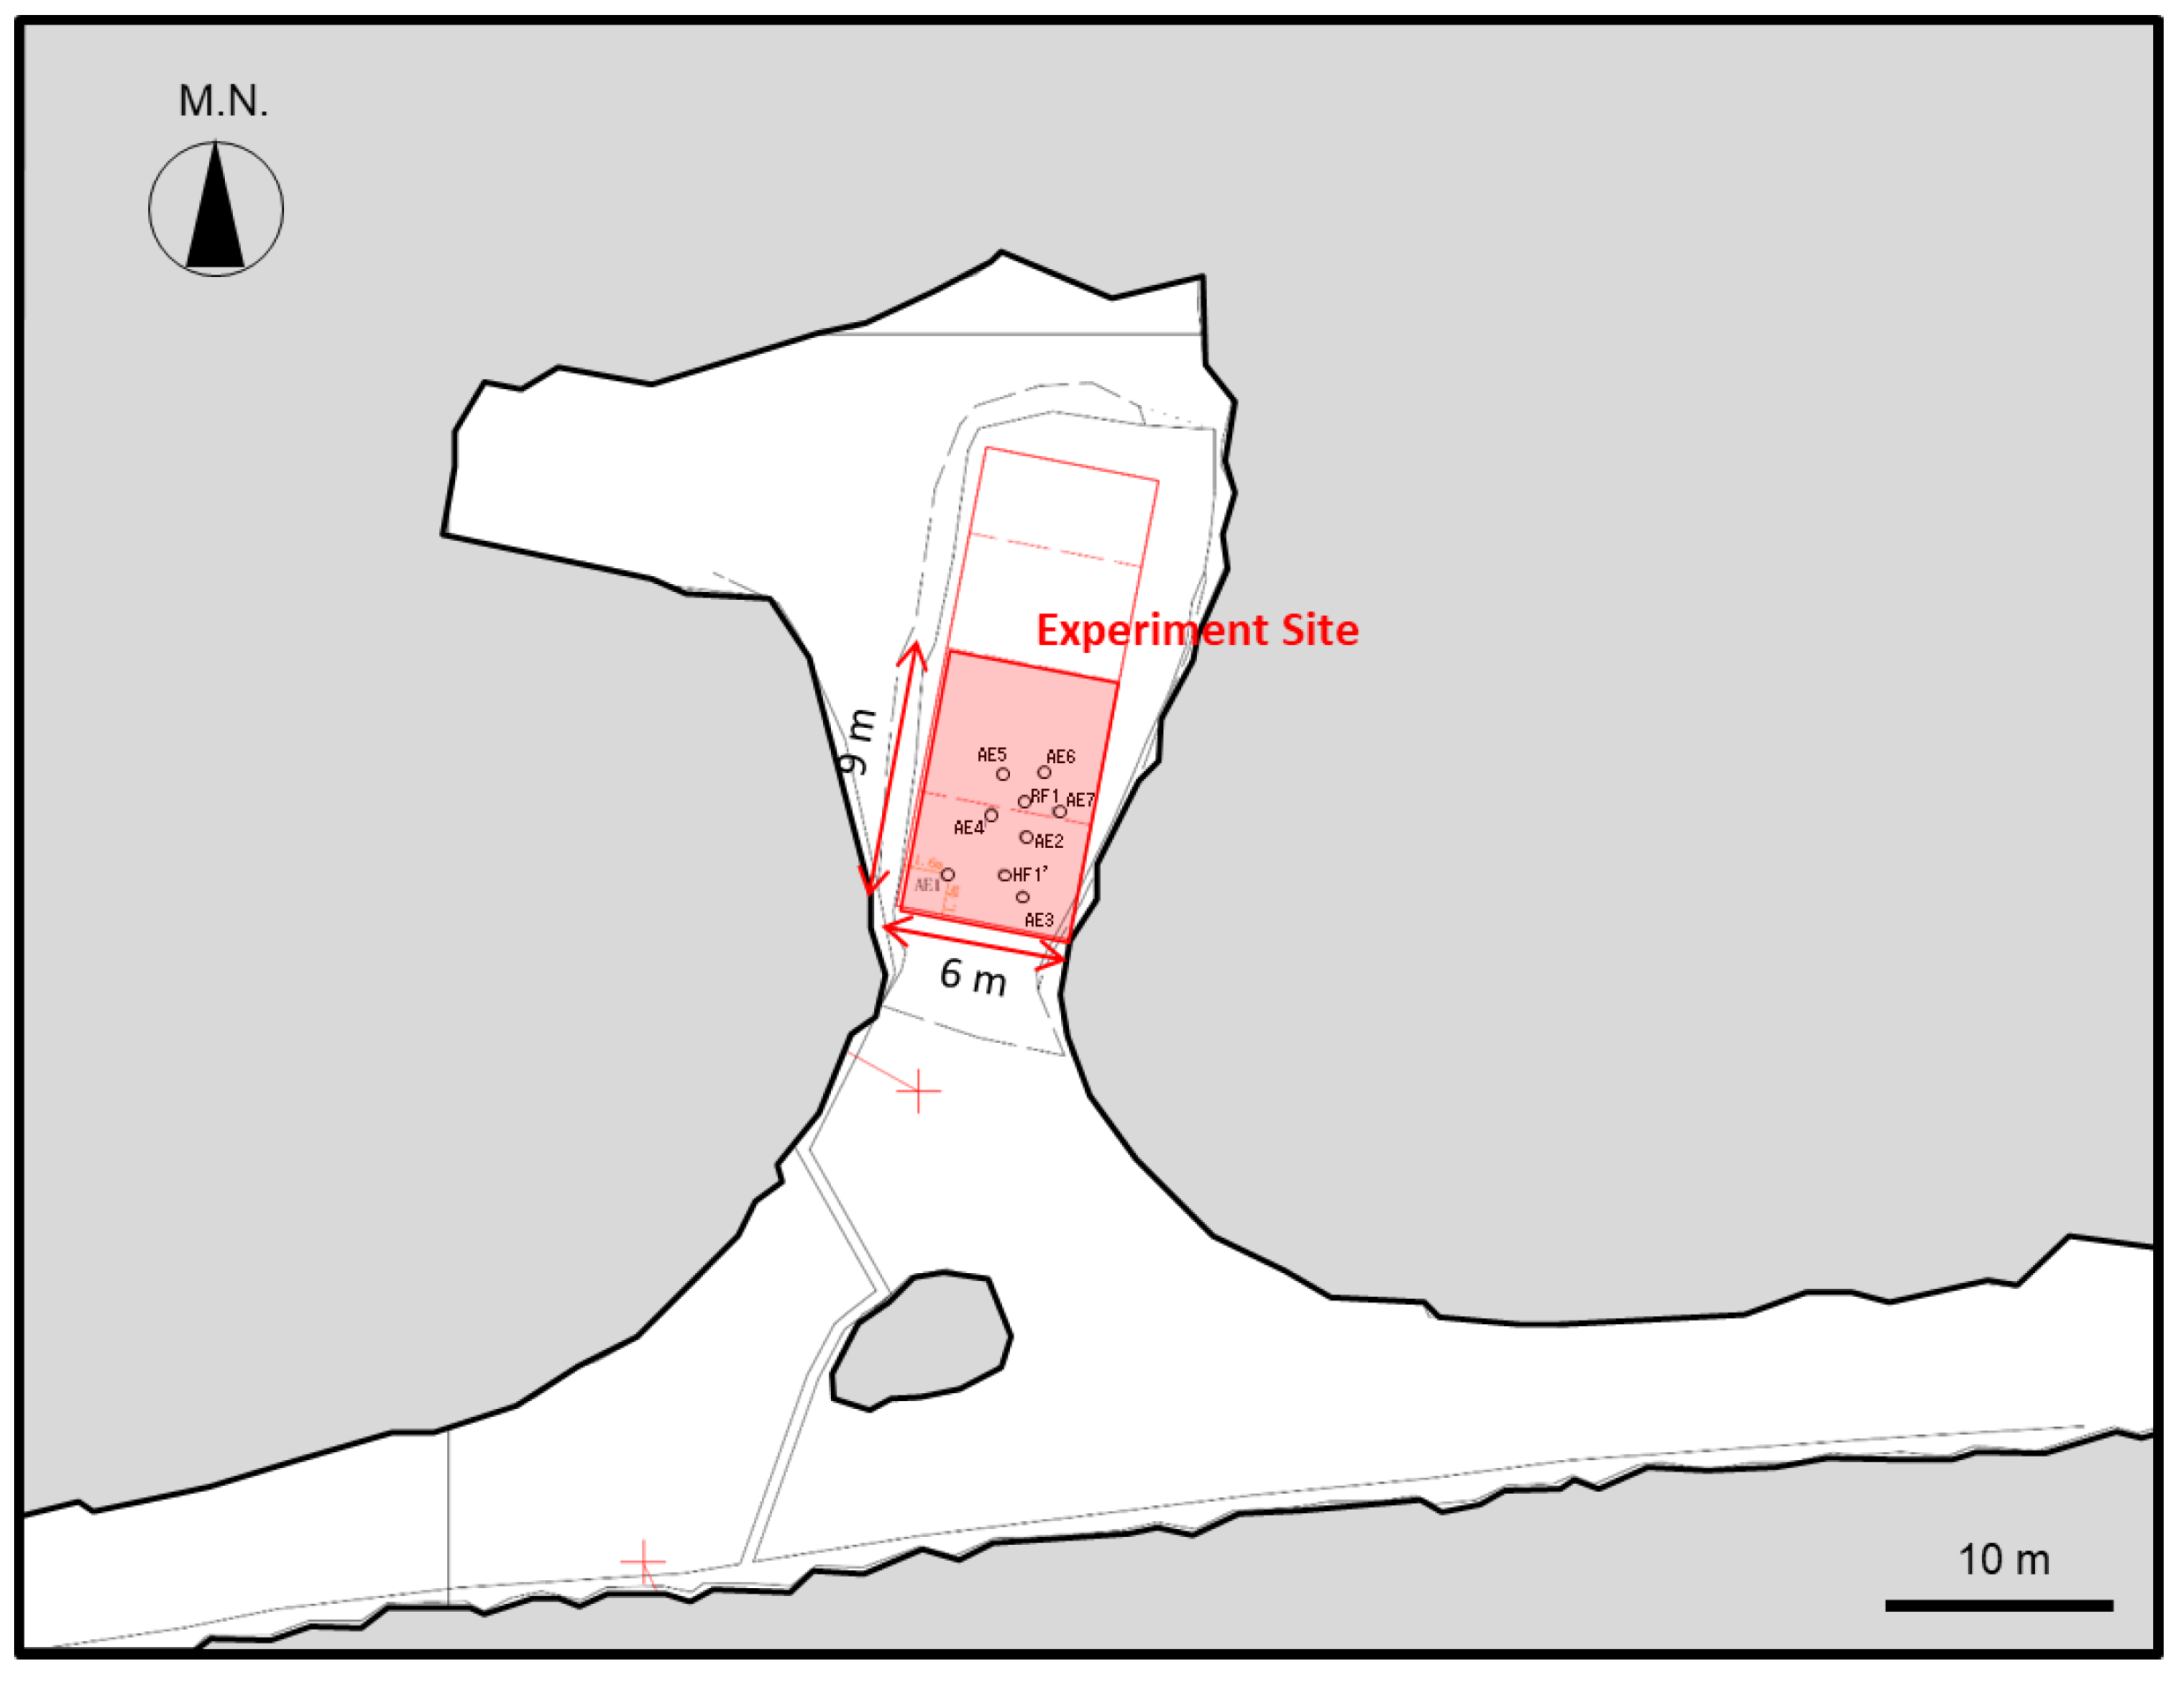
In the Tochibora pit of the Kamioka Mine in Hida City, Gifu Prefecture, central Japan (Figure 1), the experiment was conducted inside a branch of the mine drift. The experimental site floor was elevated at 520 m, the elevation of the top surface at the experimental site was 985 m, and the overburden was estimated at 465 m. The experimental site was set up in an open space in the branch of the mine drift, with area dimensions of 6, 9, and 5 m in width, length, and height, respectively (Figure 2).
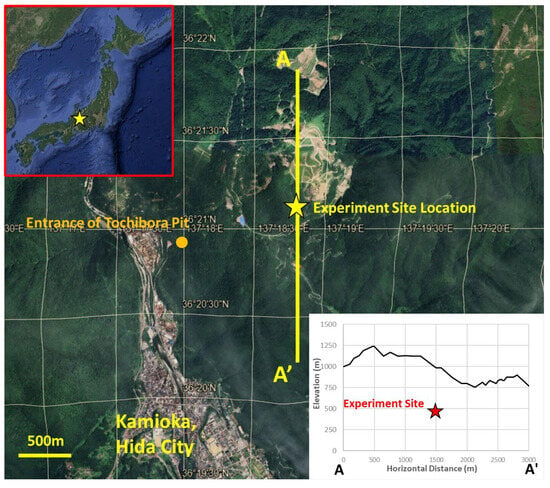
Figure 1.
Location map.
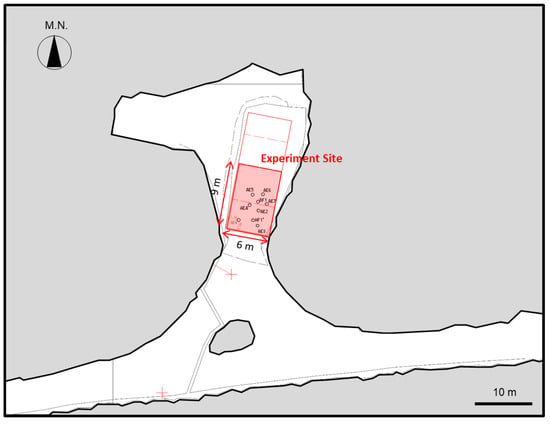
Figure 2.
Map of experimental site on plan view.
The Kamioka mine is located within the central body of the Hida Metamorphic Belt. The geology of the site comprises gneissic rocks, migmatites, and limestone. The Hida Metamorphic Belt falls under the geological group that distributes around the middle part of Japan, comprising gneiss, metamorphic rocks, migmatite, and plutonic rocks. Neutrality to basic complex rock bodies called “metabasite” are elongated in a north–south trend in this mining area, and folding gneisses are distributed on the wing. The type of migmatite called “Inishi rock” is distributed on the wing of a metabasite complex accompanied by metamorphosed limestone. Intrusive rocks, including fine-grain granite, granite porphyry, aplite, lamprophyre, and porphyrite, intrude the main rock body. The major rock types observed in the Tochibora pit include gneisses, Inishi rock, skarn, and aplite. Open natural fractures were observed in the cores recovered during the experiment of this study.
2.2. Fracturing Fluid and Equipment for the Experiments
2.2.1. Coagulable Resin
We selected a type of resin that offered a pot-life of more than 2 h and coagulated approximately 18 h after mixing the two liquids. The resins used in the resin fracturing test included “rock detectors C2-A1 (Liquid A) and C2-B5 (Liquid B)”, provided by Toagosei Co., Ltd. The coagulating mechanism of the resins involved the following: the coagulating initiator in “Liquid A” generated radicals upon mixing with the hardening agent in “Liquid B” or upon contact with metals. Then, 2-hydroxyethyl methacrylate (HEMA) coagulated. The two liquids (resins) began to coagulate when mixed in a 1:1 volume ratio. The viscosities of both liquids before mixing were six to seven centipoises (cP), and the density after mixing was 1.01 g/cm3. The resin included a fluorescent agent that emitted light under black light. We designed the equipment to send liquids A and B to a double packer while pressurizing at the same volume rate.
2.2.2. Double Packer
A special packer was used for the resin fracturing experiments. As mentioned above, the resin used in the outcrop experiment was coagulated by mixing the two liquids in equal amounts. The experimental equipment was designed to feed the same amount of the two liquids into the packer through separate flow lines, mix them in the packer, and discharge them through a static mixer set at the outlet. Figure 3 shows the internal structure of the double packer. The packer (Inflatable Packers International Pty Ltd. (IPI), Sharjah, United Arab Emirates) had four lines to flow the liquids, two lines to send the resins, and two lines to send water to expand the upper and lower packers. The lines for the resins are connected to the static mixer outside. The injection interval was 475 mm, and the pressure resistance was 50 MPa. The liquid flow pressure and packer pressure were measured using a pressure measuring box (OYO Geo-monitoring Service Corporation, Kawaguchi-shi, Japan), which was installed in the upper part of the packer.

Figure 3.
Internal structure of the double packer (made by IPI).
2.3. Method of the Experiment
2.3.1. Borehole Allocation and Workflow of the Experiment
Two types of fracturing tests were conducted: normal hydraulic fracturing using water and another using coagulable fluorescent resin as the injection fluid (resin fracturing test). Normal hydraulic fracturing tests were conducted to understand the degree of AE attenuation through the bedrock and obtain rock stress information at the experimental site.
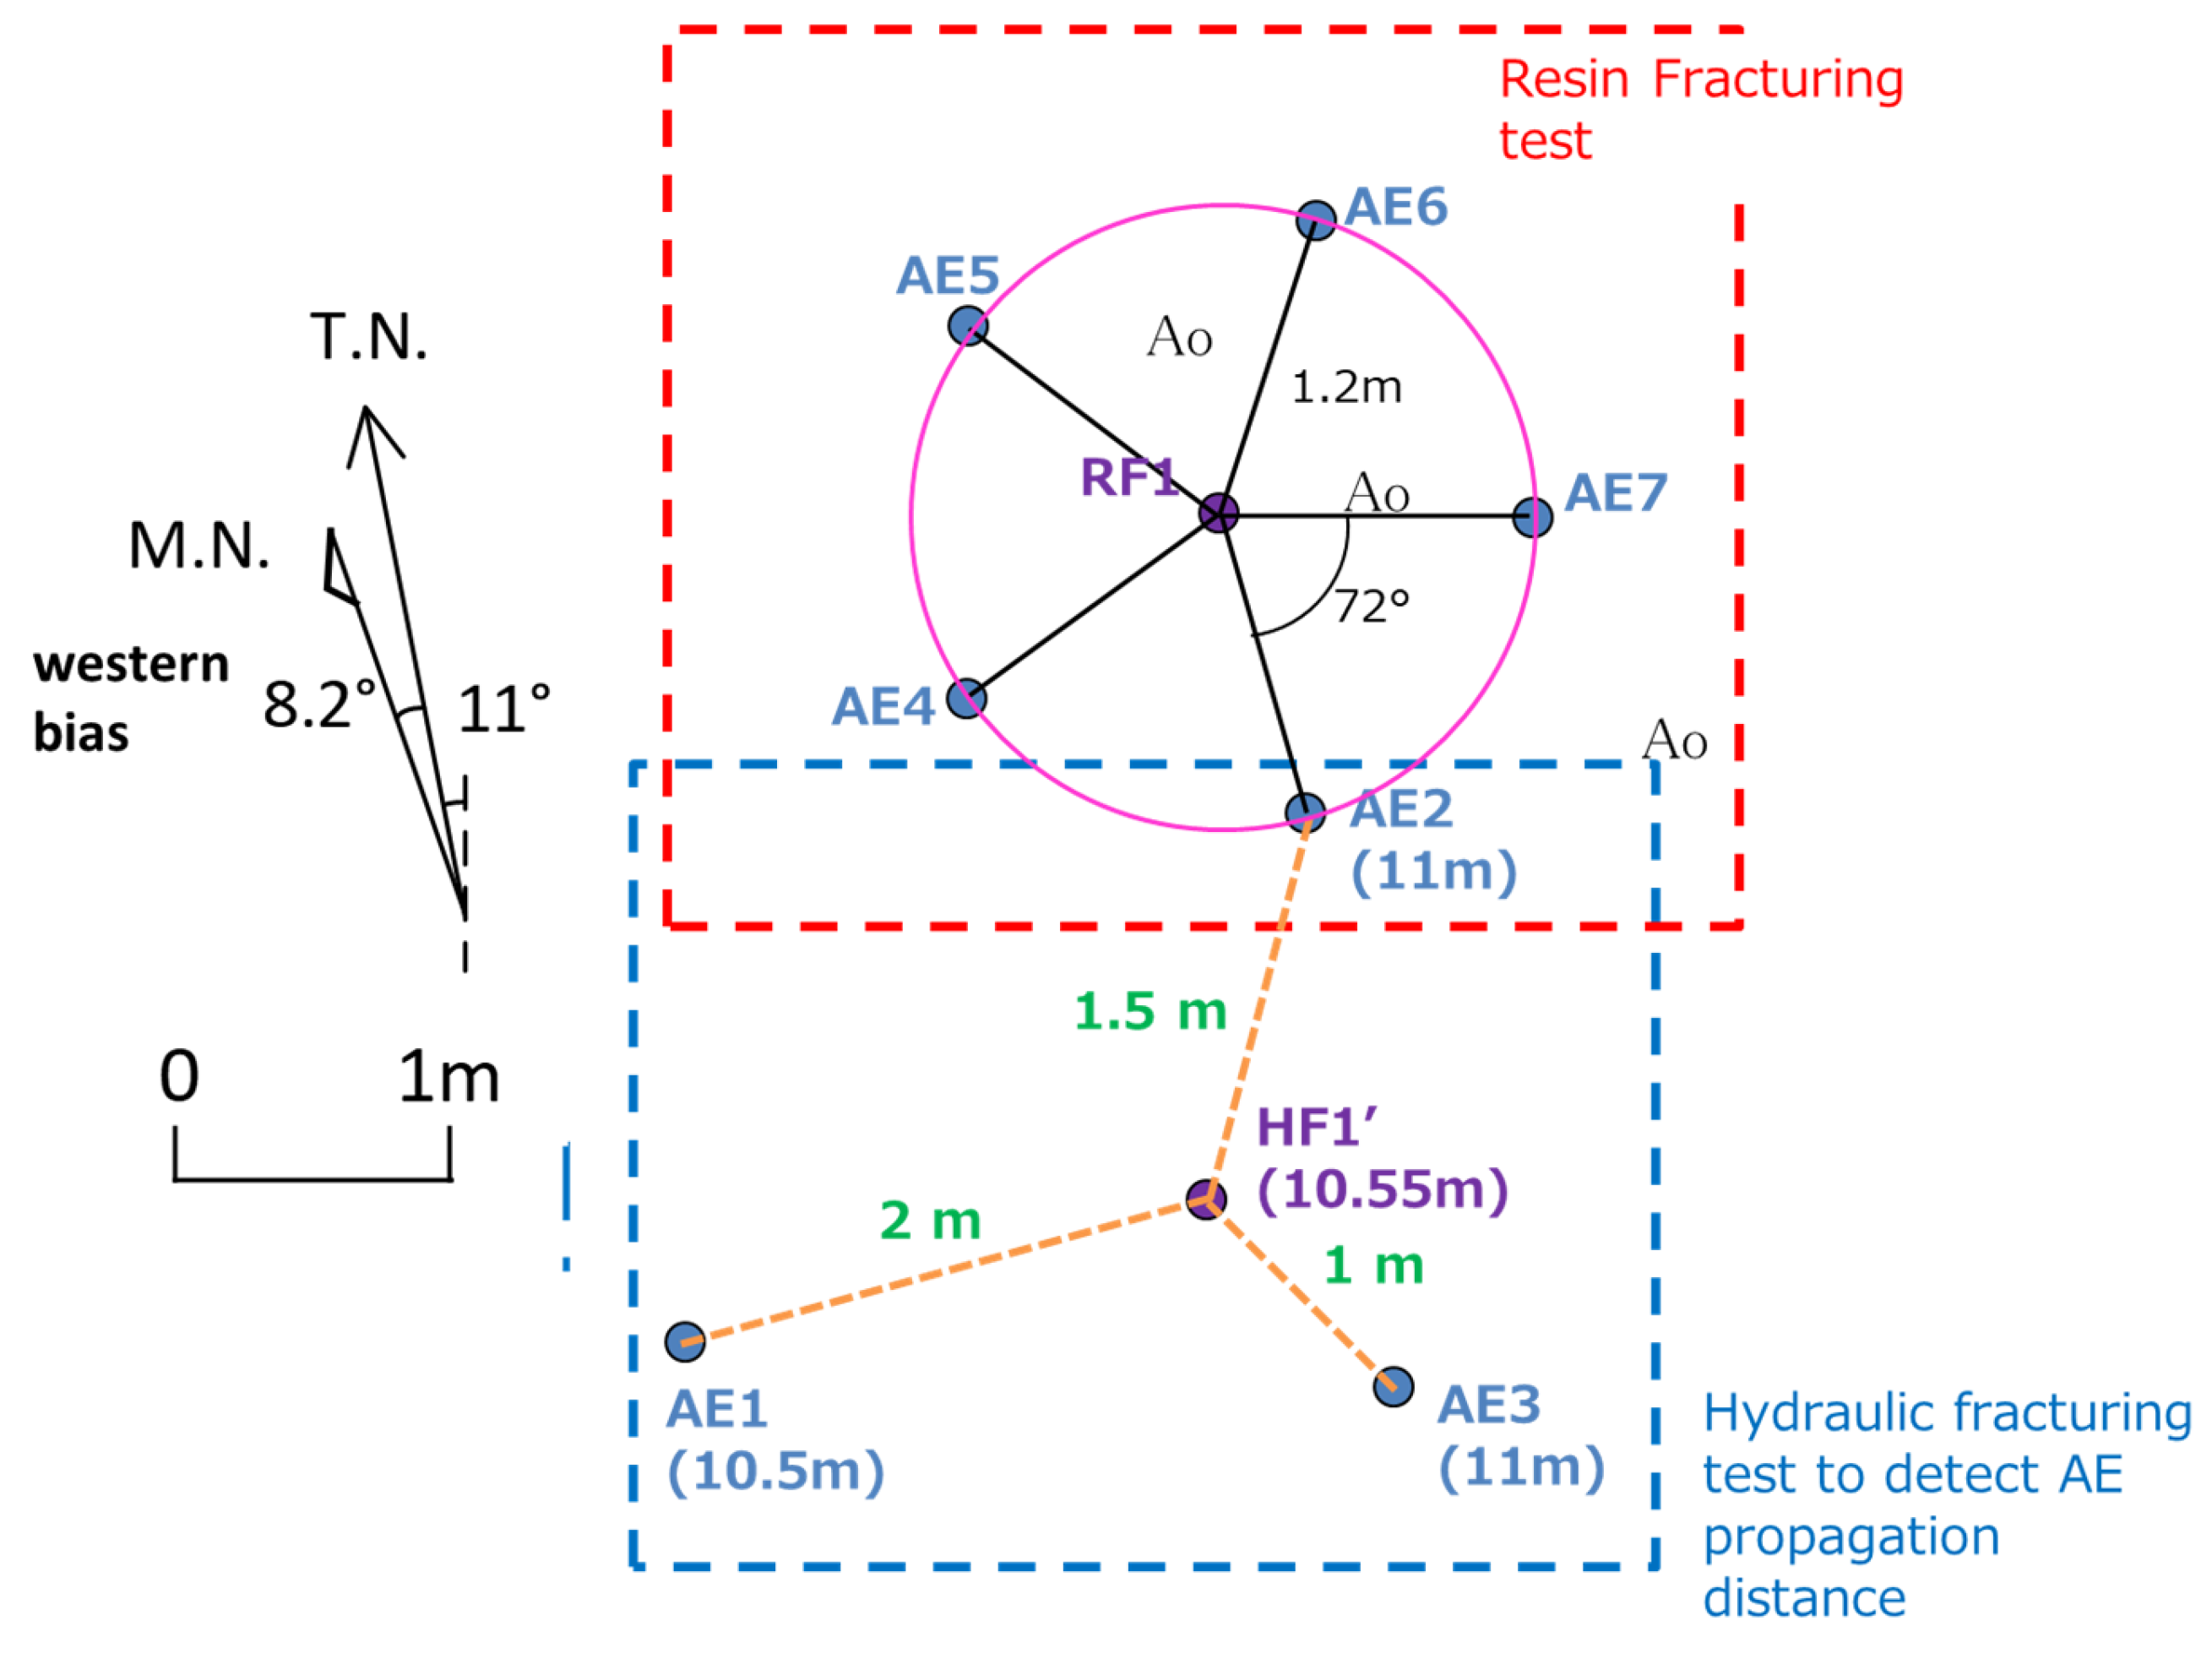
Recording several AE waveforms with large amplitudes was necessary to read the exact time of the first P-wave arrival and determine the event locations. However, AE is affected by anelastic and geometrical spreading attenuation as it propagates through the rocks; its amplitude decreases exponentially with propagation distance. Therefore, hydraulic fracturing tests using water were conducted to examine the degree of AE attenuation in advance and plan the arrangement of AE observation boreholes for resin fracturing tests. For the hydraulic fracturing test using water, a hydraulic fracturing borehole (HF1′) and three AE observation boreholes (AE1–AE3) were drilled vertically to a depth of approximately 11 m, with coring performed using a 76 mm diameter hole. Each AE observation borehole was spaced 1, 1.5, and 2.0 m from the HF1′ and spaced approximately 120° rotation around HF1′ (Figure 4). Based on the hydraulic fracturing test, the optimal AE sensor distance from the hydraulic fracturing hole was determined to be 1.0 m.
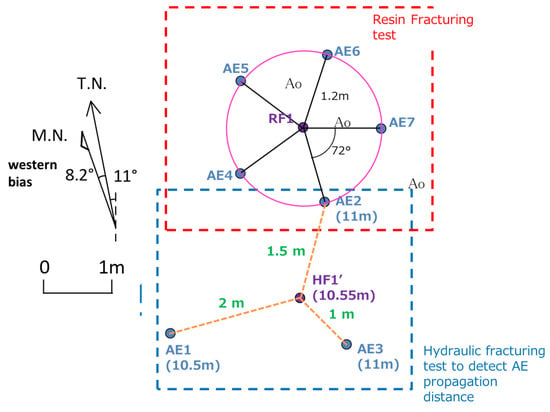
Figure 4.
Borehole allocation in this experimental workflow.
The resin fracturing test was conducted to visualize the fracture induced by hydraulic fracturing. One resin fracturing borehole (RF1) and four AE observation boreholes (AE4–AE7), each with a 76 mm diameter, were drilled for the resin fracturing tests. AE2 was reused as an AE observation borehole for the resin fracturing tests. As mentioned before, the best AE sensor distance from the hydraulic fracturing hole was determined to be 1.0 m. However, owing to the limitations imposed by the placement of the drilling equipment, each AE observation borehole was spaced 1.2 m from RF1 and rotated approximately 72° around RF1 (Figure 4). The resin fracturing experiment was conducted at intervals where no fractures occurred between the packers (475 mm). Two sections of RF1 (center depths of 2.10 and 3.30 m) were selected as fracturing sections based on inspection of the recovered core.
2.3.2. AE Measuring Method
An AE sensor with a resonance frequency of 70 kHz was used. Five AE sensors were placed in each AE observation borehole (except in AE4, where four sensors were used), totaling 24 AE sensors. The sensors were placed at 500 mm intervals, and the total length of a single sensor array was 2 m. Each AE sensor was pressed against the observation hole wall using a small hydraulic jack set placed behind the sensor. Table 1 lists the conditions used for the AE measurements. P-wave velocities were measured before each resin fracturing test. Vibrations were emitted towards each AE sensor in five directions of the AE holes at both depths for the resin fracturing tests.

Table 1.
Conditions used for the AE measurements.
3. Results
3.1. Evaluation of Local Rock Stress
After a normal hydraulic fracturing test using water, a principal stress evaluation was conducted at the experimental site. Reopening pressure (Pr) and shut-in pressure (Ps) were estimated from the results of the reopening test conducted after the hydraulic fracture experiment at four depths (3.55 and 5.55 m for HF1′ and 8.75 and 9.80 m for AE3), where breakdown during water injection was observed. The estimation was based on the Japanese Geotechnical Society Standard (JGS3761-2017) [20]. We calculated the maximum horizontal principal stress (SH) and minimum horizontal principal stress (Sh) using the estimated values of Pr and Ps. The directions of SH were determined from the direction of the induced vertical fractures, which were confirmed by the traces of the impression packer after hydraulic fracturing. Table 2 shows the results of horizontal stress estimations.

Table 2.
Estimation of the horizontal stress based on hydraulic fracturing results.
Comparatively, SH and Sh were estimated to be 11.2 and 5.5 MPa, respectively, at a depth of 3.55 m. Conversely, SH was estimated from 20.7 to 22.1 MPa, while Sh was estimated from 8.8 to 10.2 MPa at depths of 5.55, 8.75, and 9.80 m. The direction of SH showed an NE-SW trend at a depth of 3.55 m, an ENE-WSW trend at depths of 5.55 and 9.80 m, and an NW-SE trend at a depth of 8.75 m.
The stress measured at shallow depths did not reflect the regional stress because the stress was released due to tunnel excavation. The result at 3.55 m was expected to be significantly different from the regional stress at the experimental site. The height of the tunnel at the experimental site was approximately 5 m. Therefore, SH and Sh estimated at 5.55, 8.75, and 9.80 m were expected to be different from regional stress. But these values could be close to the local stress because similar SH and Sh values were obtained at all three depths, and the directions at 5.55 and 9.80 m indicated a similar trend (ENE-WSW trend). Thus, the effect of stress release appeared to be reduced at depths greater than 5 m. Considering the resin experiment depths (2.10 and 3.30 m), the results at a depth of 3.55 m was considered as a reference for local stress.
The breakdown pressure of hydraulic fracturing was ~9.9–15.8 MPa, which increased as the measured depth increased. These breakdown pressures were higher than Sh, indicating that the breakdown pressure represented the tensile strength of the rock. In contrast, the uniaxial compressive strength of the gneiss rock sample from Kamioka Mine ranged from 211 to 227 MPa. Generally, the tensile strength of rock is one-tenth to one-twentieth of its compressive strength; therefore, the expected tensile strength of Kamioka rock was 11–22 MPa.
3.2. Resin Fracturing Test and Overcoring
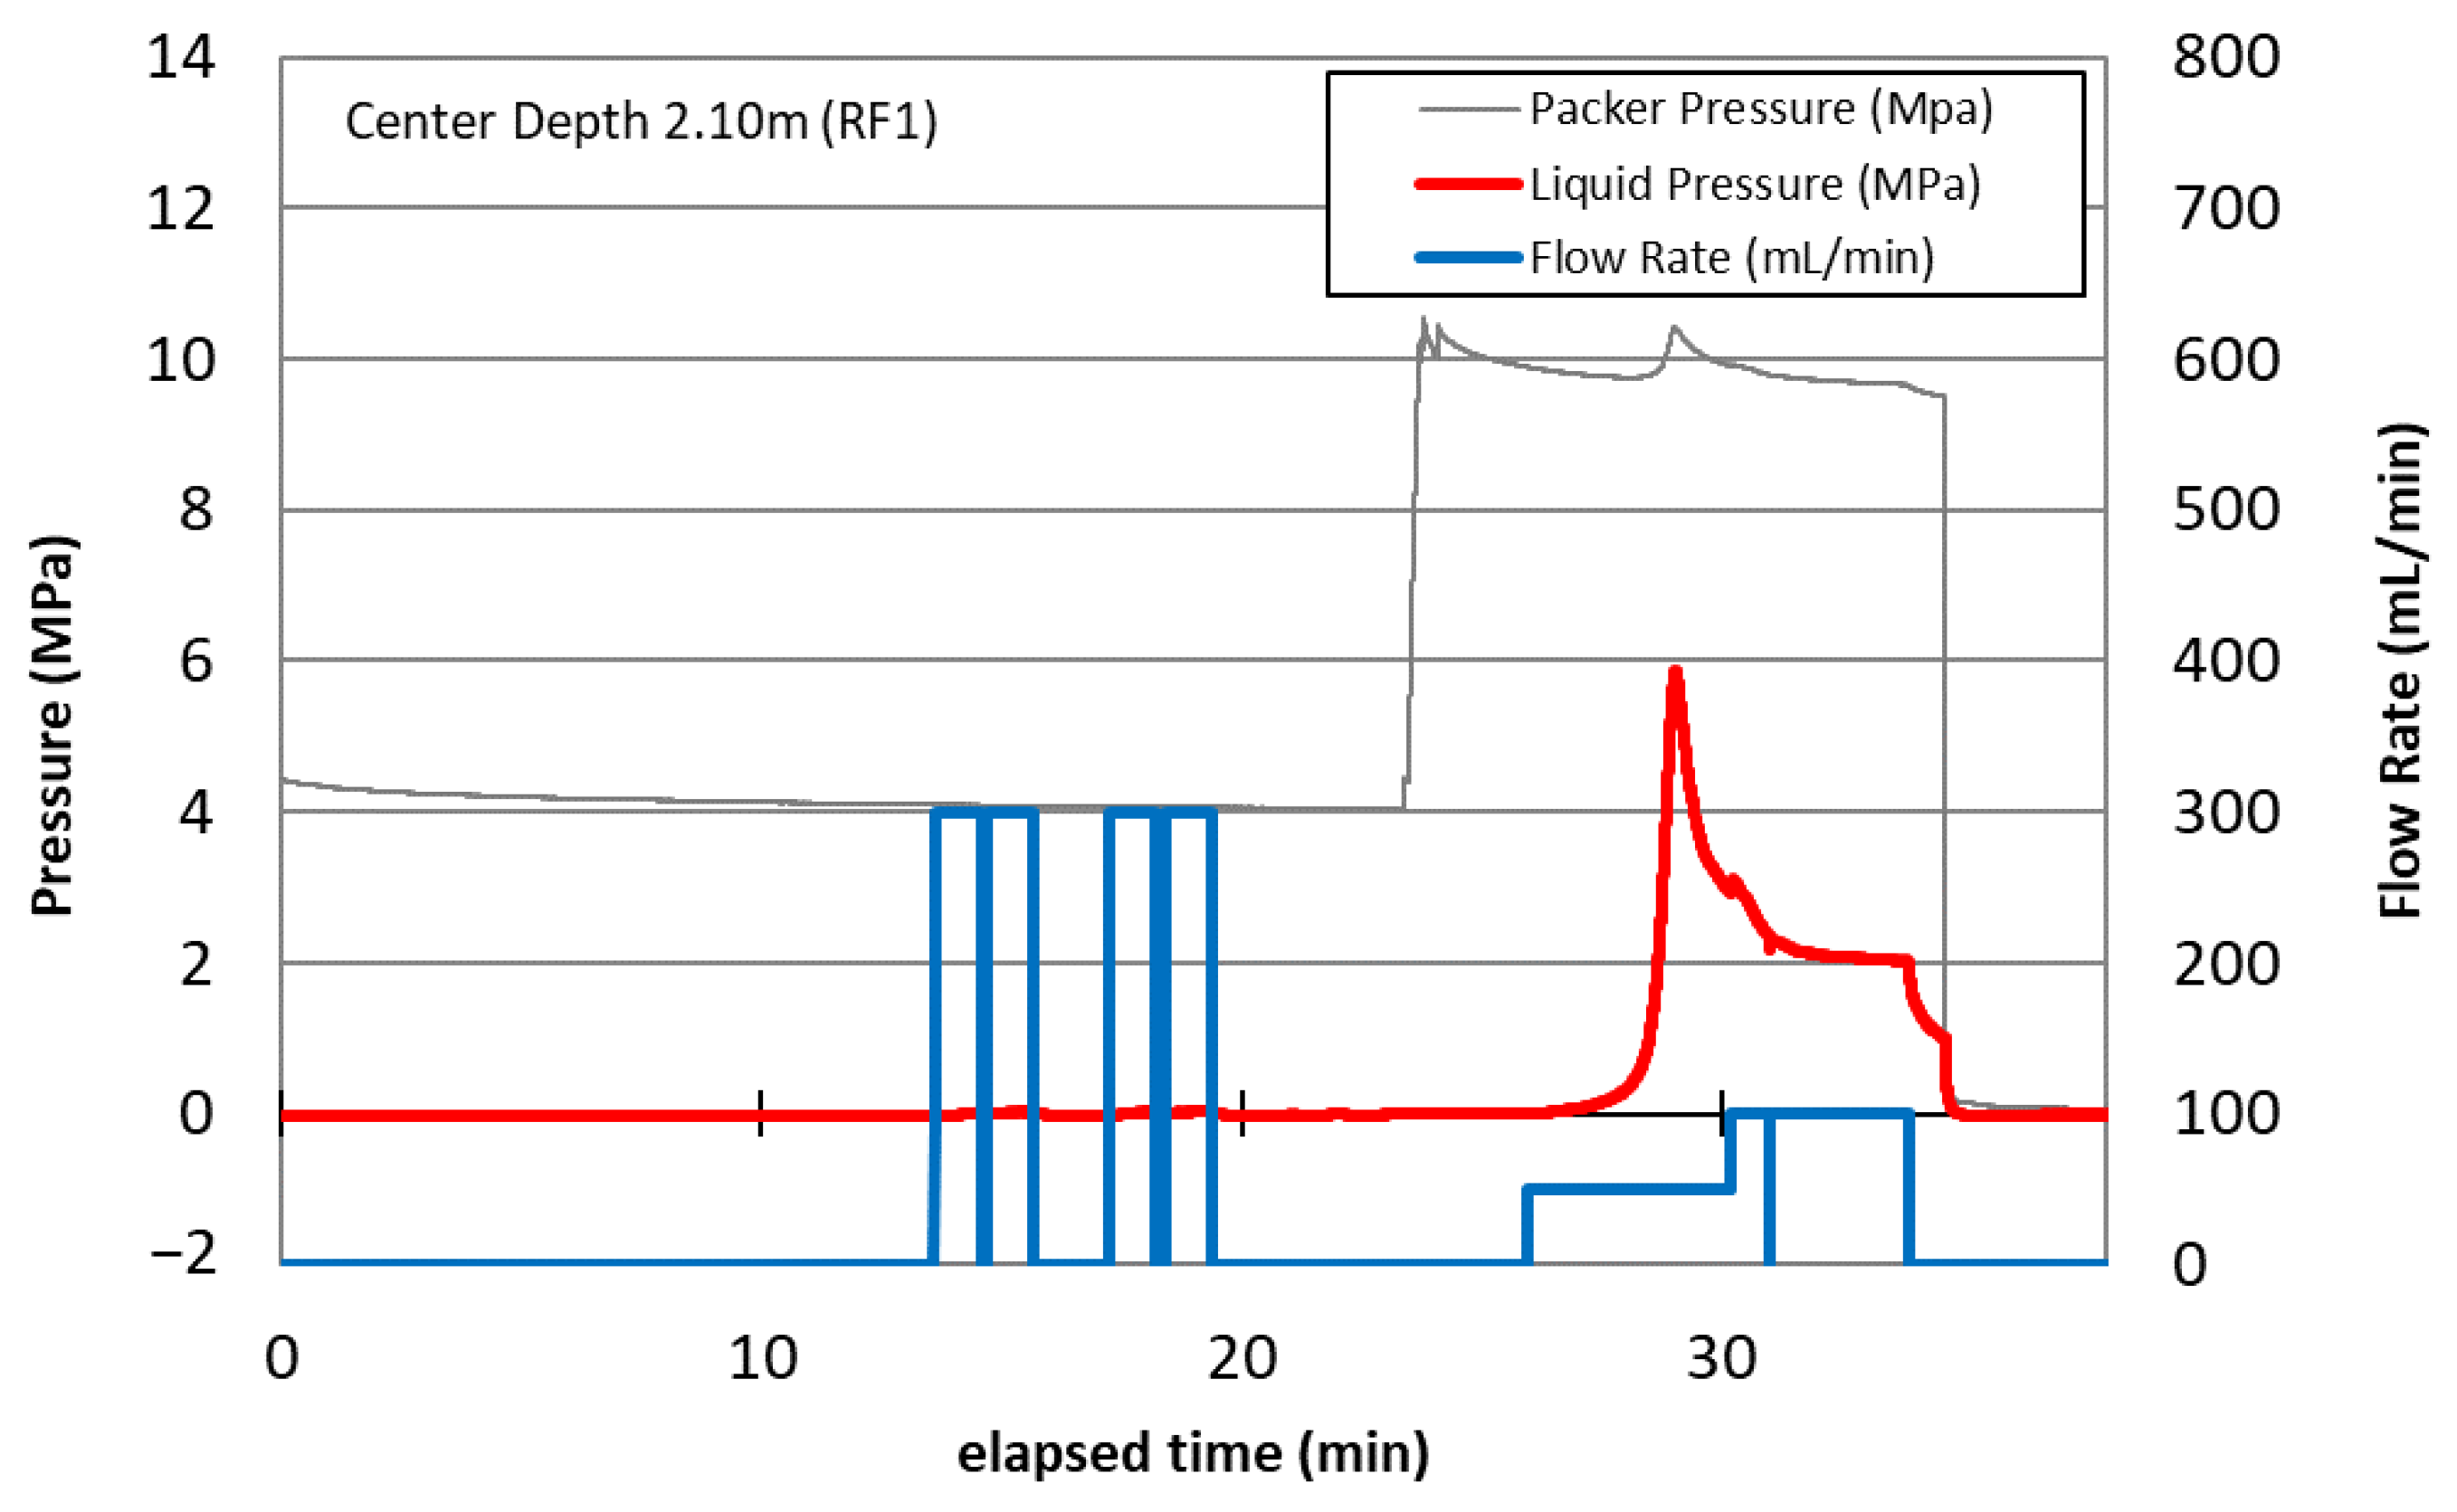
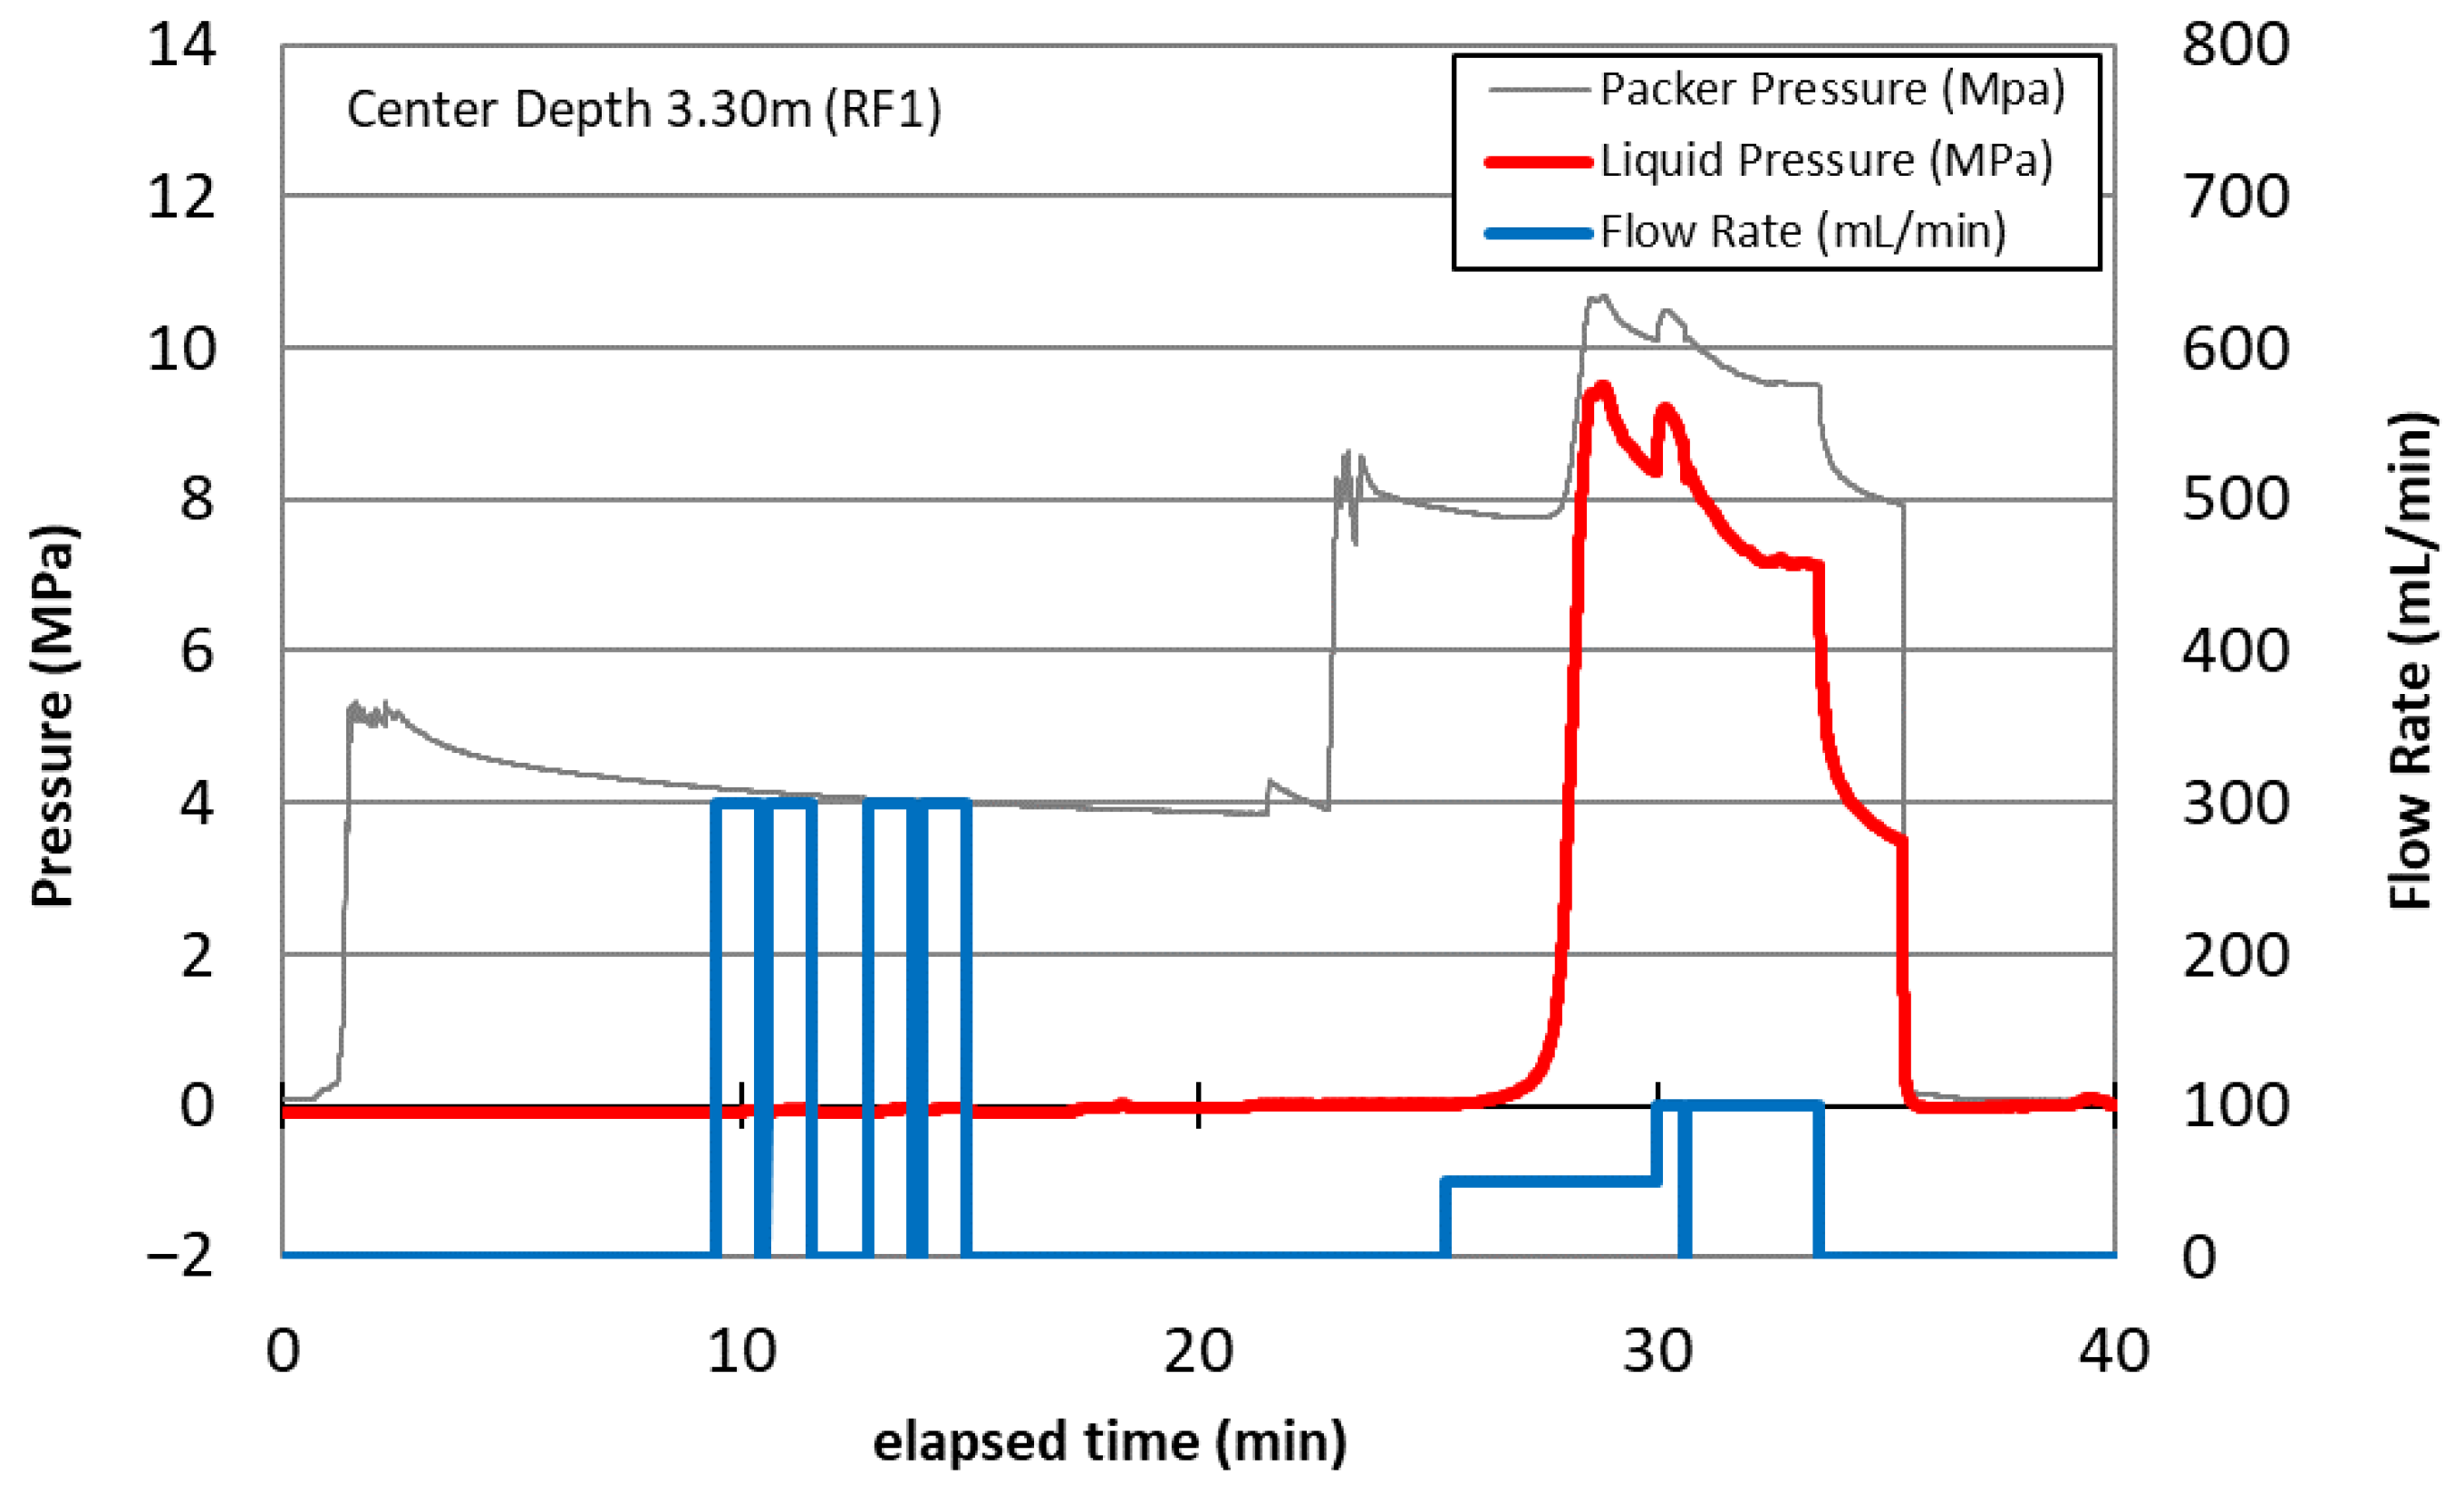
Resin fracturing tests were conducted at two depths, 2.10 and 3.30 m. Figure 5 and Figure 6 show liquid pressure, flow rate, and packer pressure during the experiment at the two depths. Figure 5 shows the behavior of pressure and flow rate during resin injection at a depth of 2.10 m. The experiment started by expanding the lower packer, and then 1.3 L of resin was filled in the injection interval, which was sealed by expanding the upper packer. The resin was injected with an initial flow rate of 50 mL/min at 26 min in the elapsed time for fracturing; then, a rapid decrease in liquid pressure indicated the occurrence of breakdown at 3 min and 5 s after the start of resin injection, when the liquid pressure reached 5.86 MPa. The flow rate was increased to 100 mL/min, 1 min after breakdown, and resin injection continued for 3 min and 43 s. The total injected resin volume was 600 mL, and the total injection time was 7 min and 57 s. The initial flow rate of 50 mL/min was chosen to slowly generate hydraulic fractures, allowing for accurate observation of AE events that occur during fracture propagation. Subsequently, we increased the flow rate to 100 mL/min to gradually expand the hydraulic fractures.
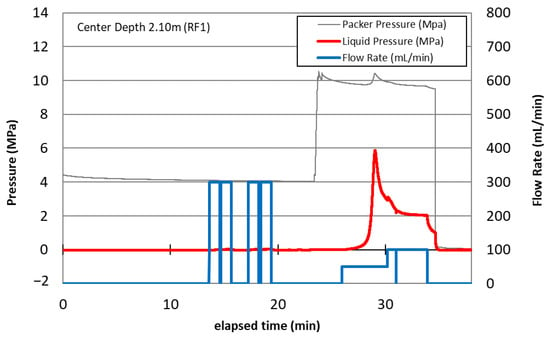
Figure 5.
Pressure behavior during resin fracturing test (center depth of 2.10 m).
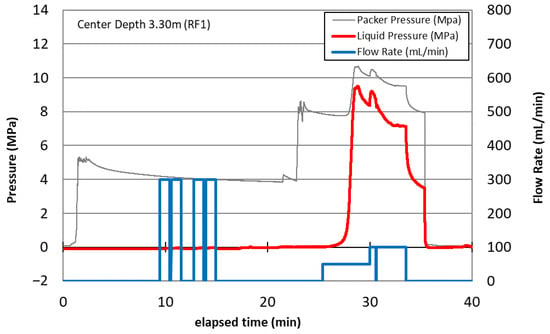
Figure 6.
Pressure behavior during resin fracturing test (center depth of 3.30 m).
Following the same procedure as at a depth of 2.10 m, resin was injected at an initial flow rate of 50 mL/min 25 min into the elapsed time for fracturing at a depth of 3.30 m, as shown in Figure 6. Breakdown occurred 3 min and 26 s after the start of resin injection, indicating a breakdown pressure of 9.50 MPa. The flow rate was increased to 100 mL/min for 1 min and 10 s after breakdown, and resin injection continued for 3 min and 33 s. The total injected resin volume was 600 mL, and the total injection time was 8 min and 9 s.
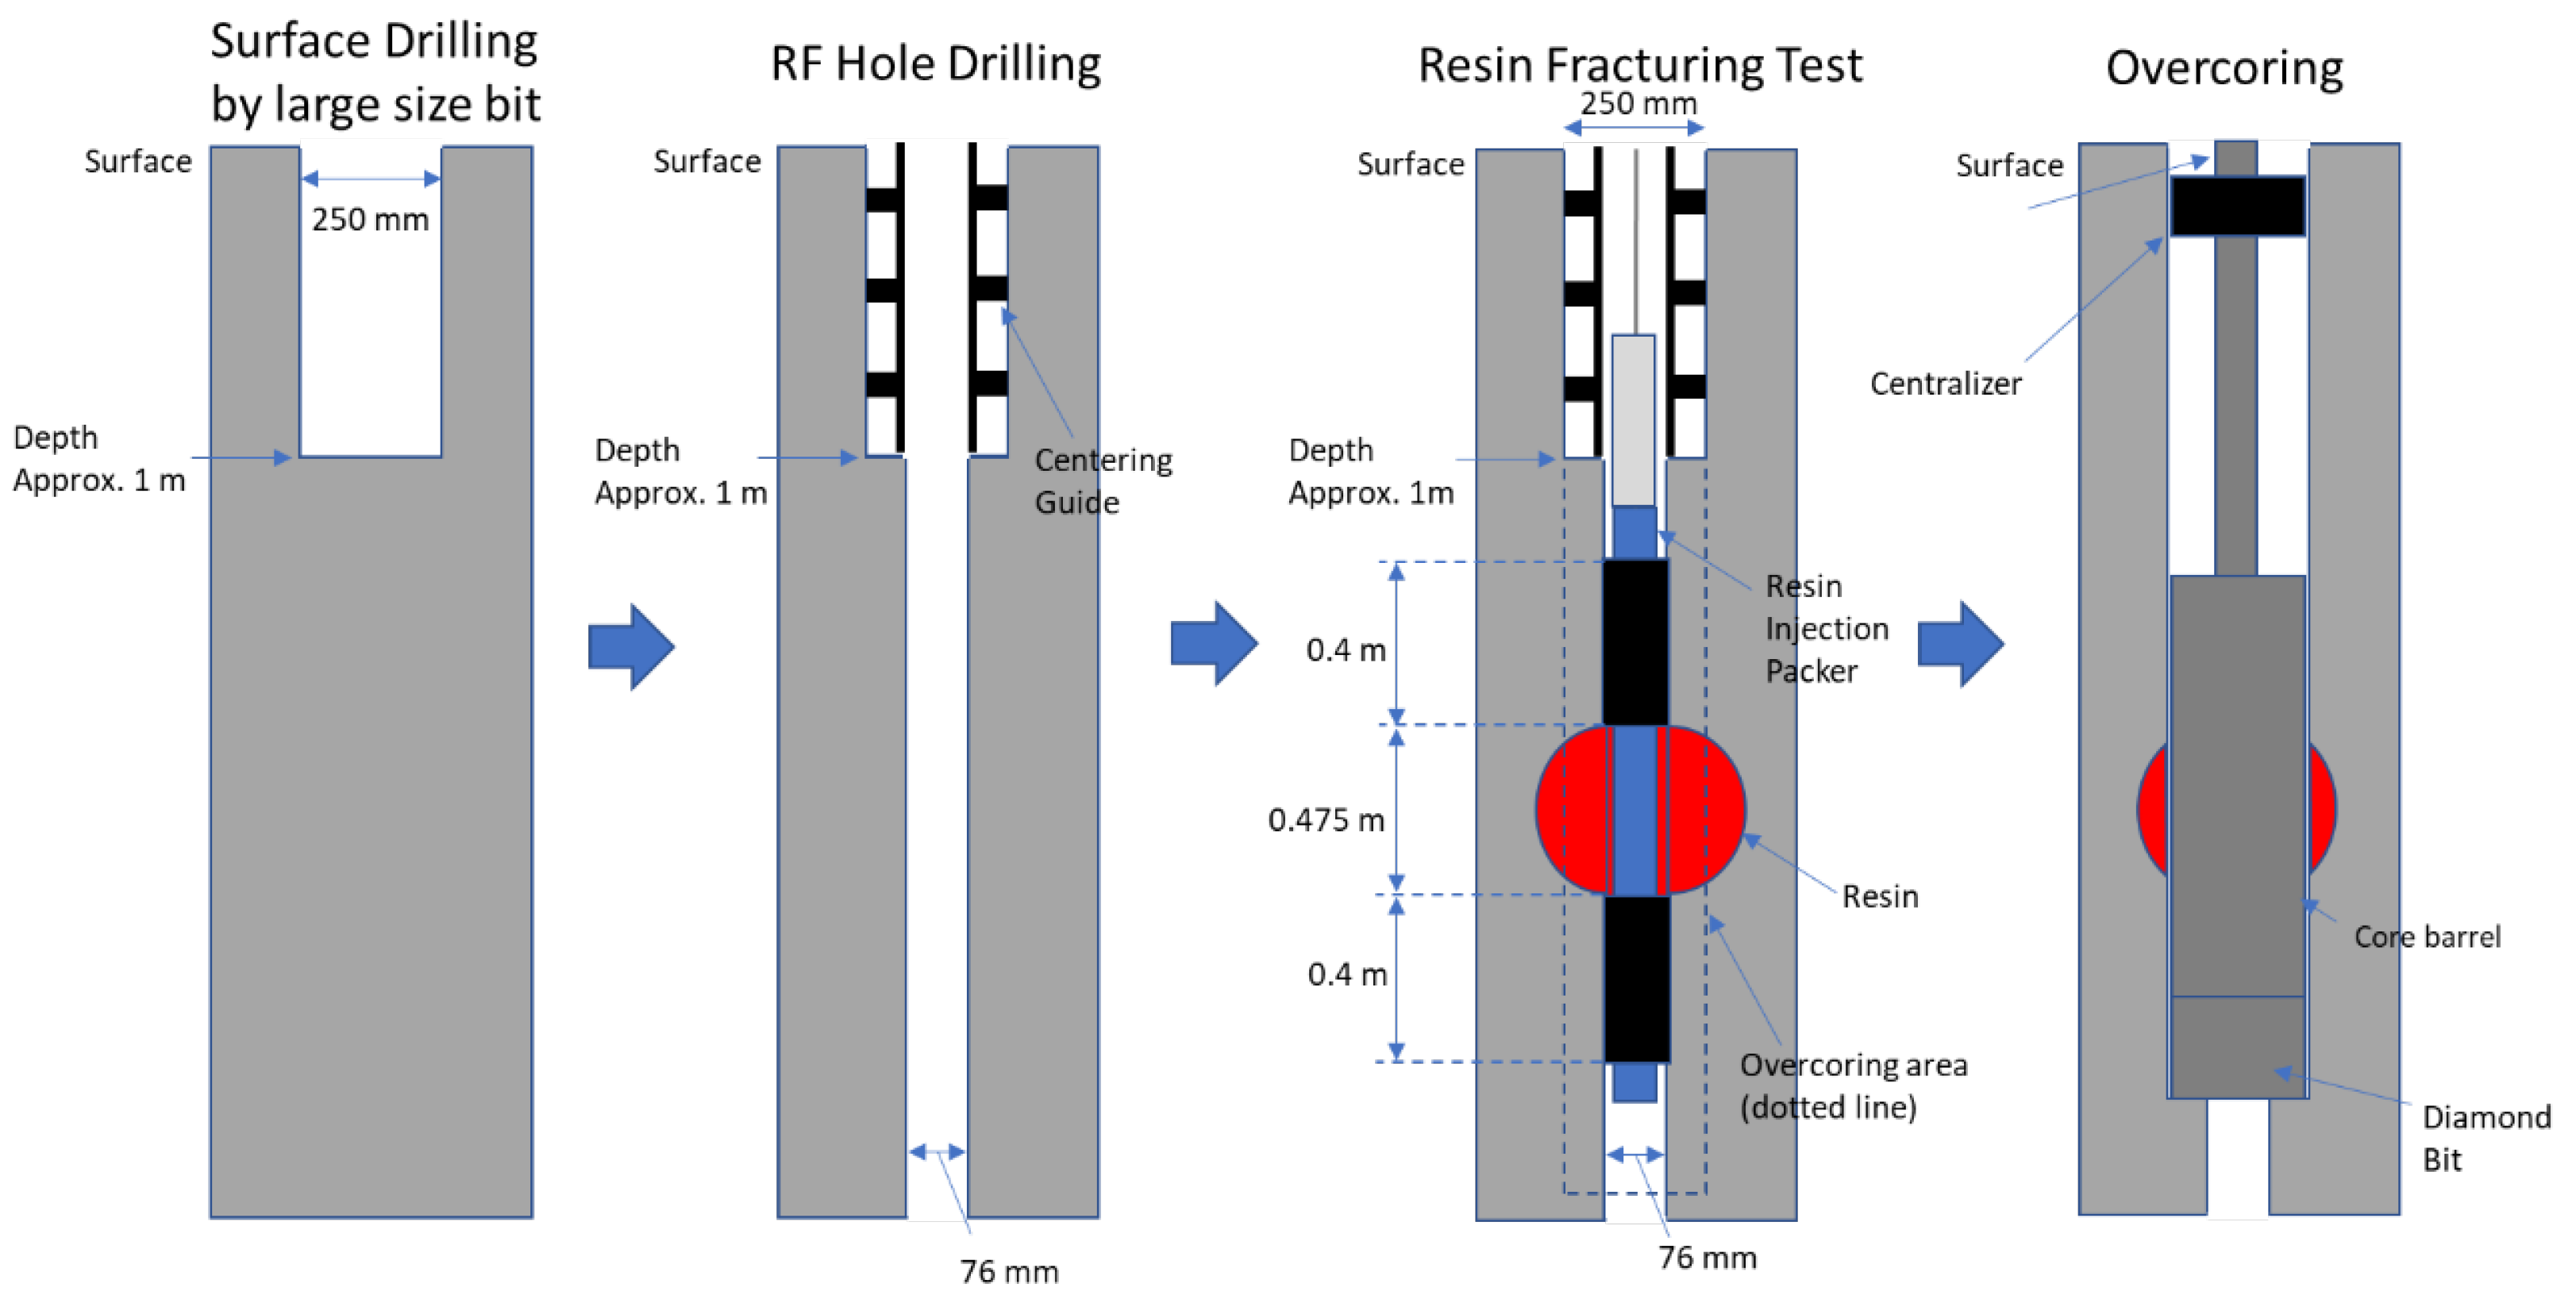
After the resin fracturing test, a 205 mm diameter core was recovered by drilling coaxially around RF1, that is, overcoring, as illustrated in Figure 7. We selected the 205 mm core size for the following reasons: (1) to recover a larger core than a meter-sized core, (2) to be able to handle the core on-site, and (3) because we had prior experience recovering cores of this size for rock stress measurement using stress relief with overcoring. The procedure was as follows:
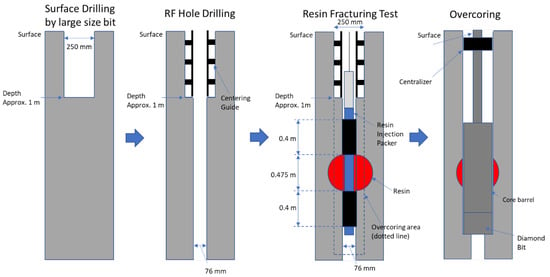
Figure 7.
Procedure of overcoring.
- A large hole (250 mm diameter) was drilled from the ground floor to a depth of 1 m.
- A resin fracturing hole (76 mm diameter) was drilled at the bottom of the 250 mm central hole to a depth of 9 m.
- Resin fracturing tests were conducted at depths of 2.1 and 3.3 m.
- After the resin fracturing test, a 205 mm diameter core was recovered by drilling coaxially around the RF1 or overcoring.
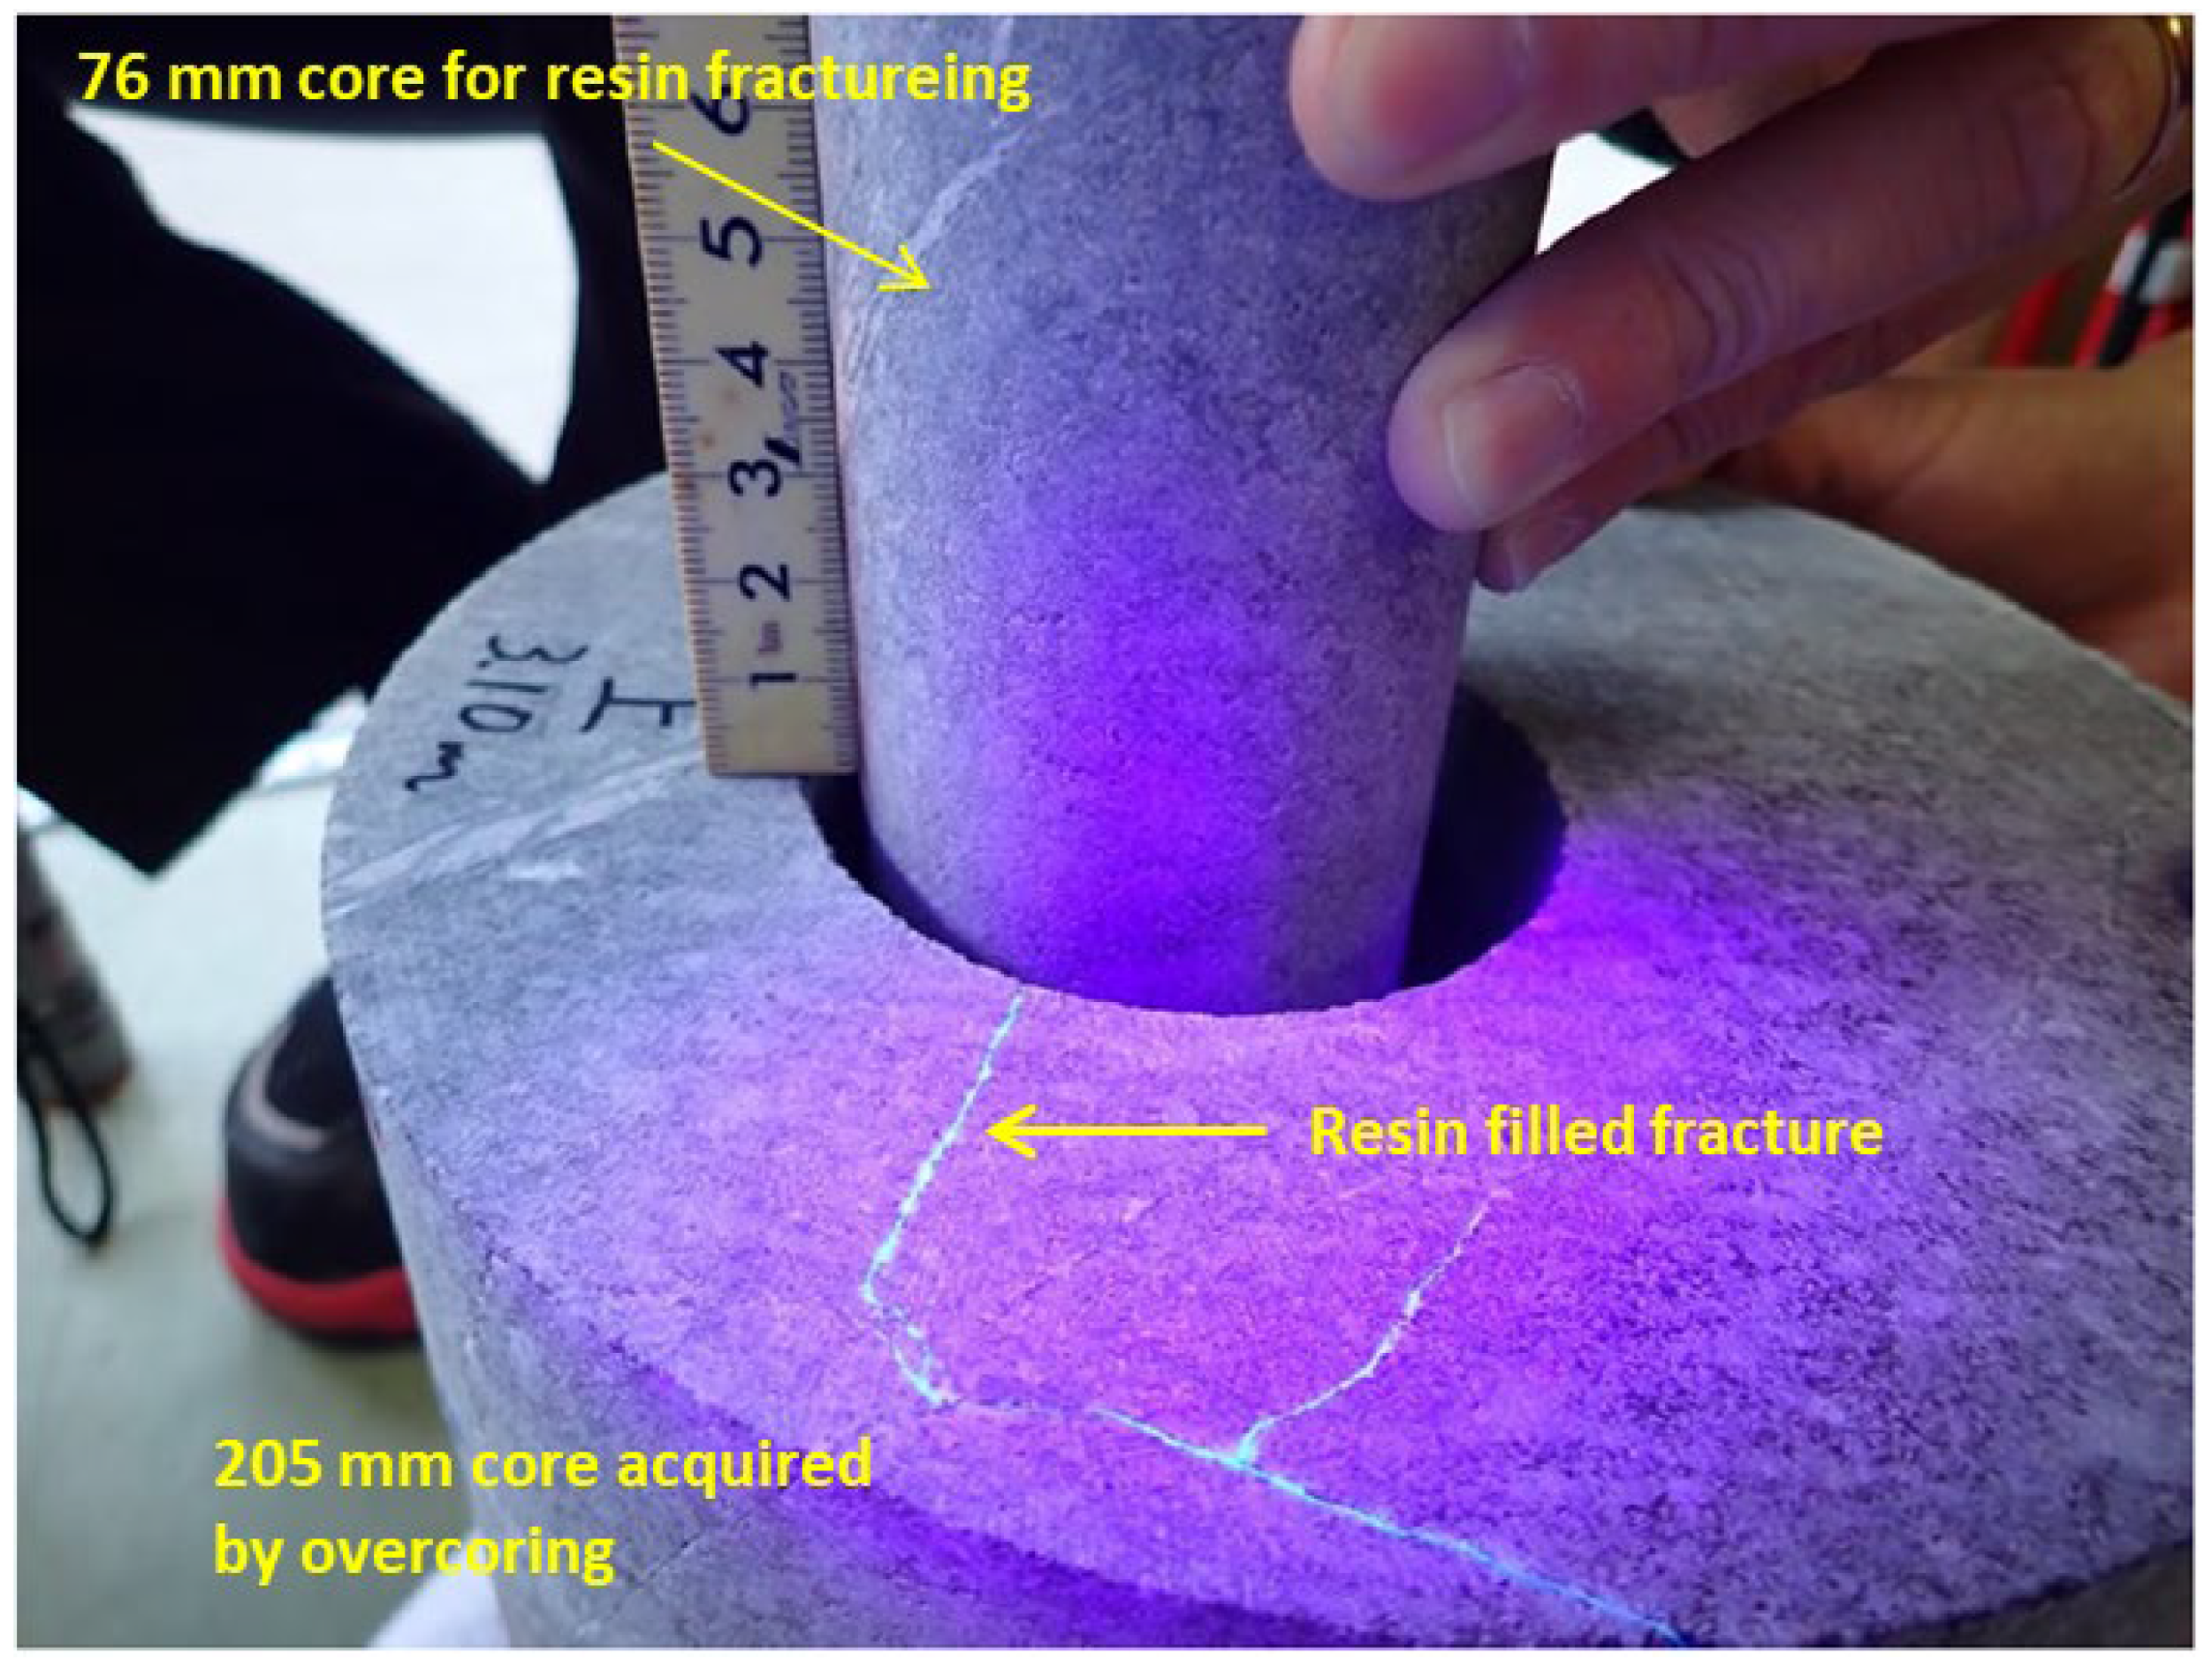
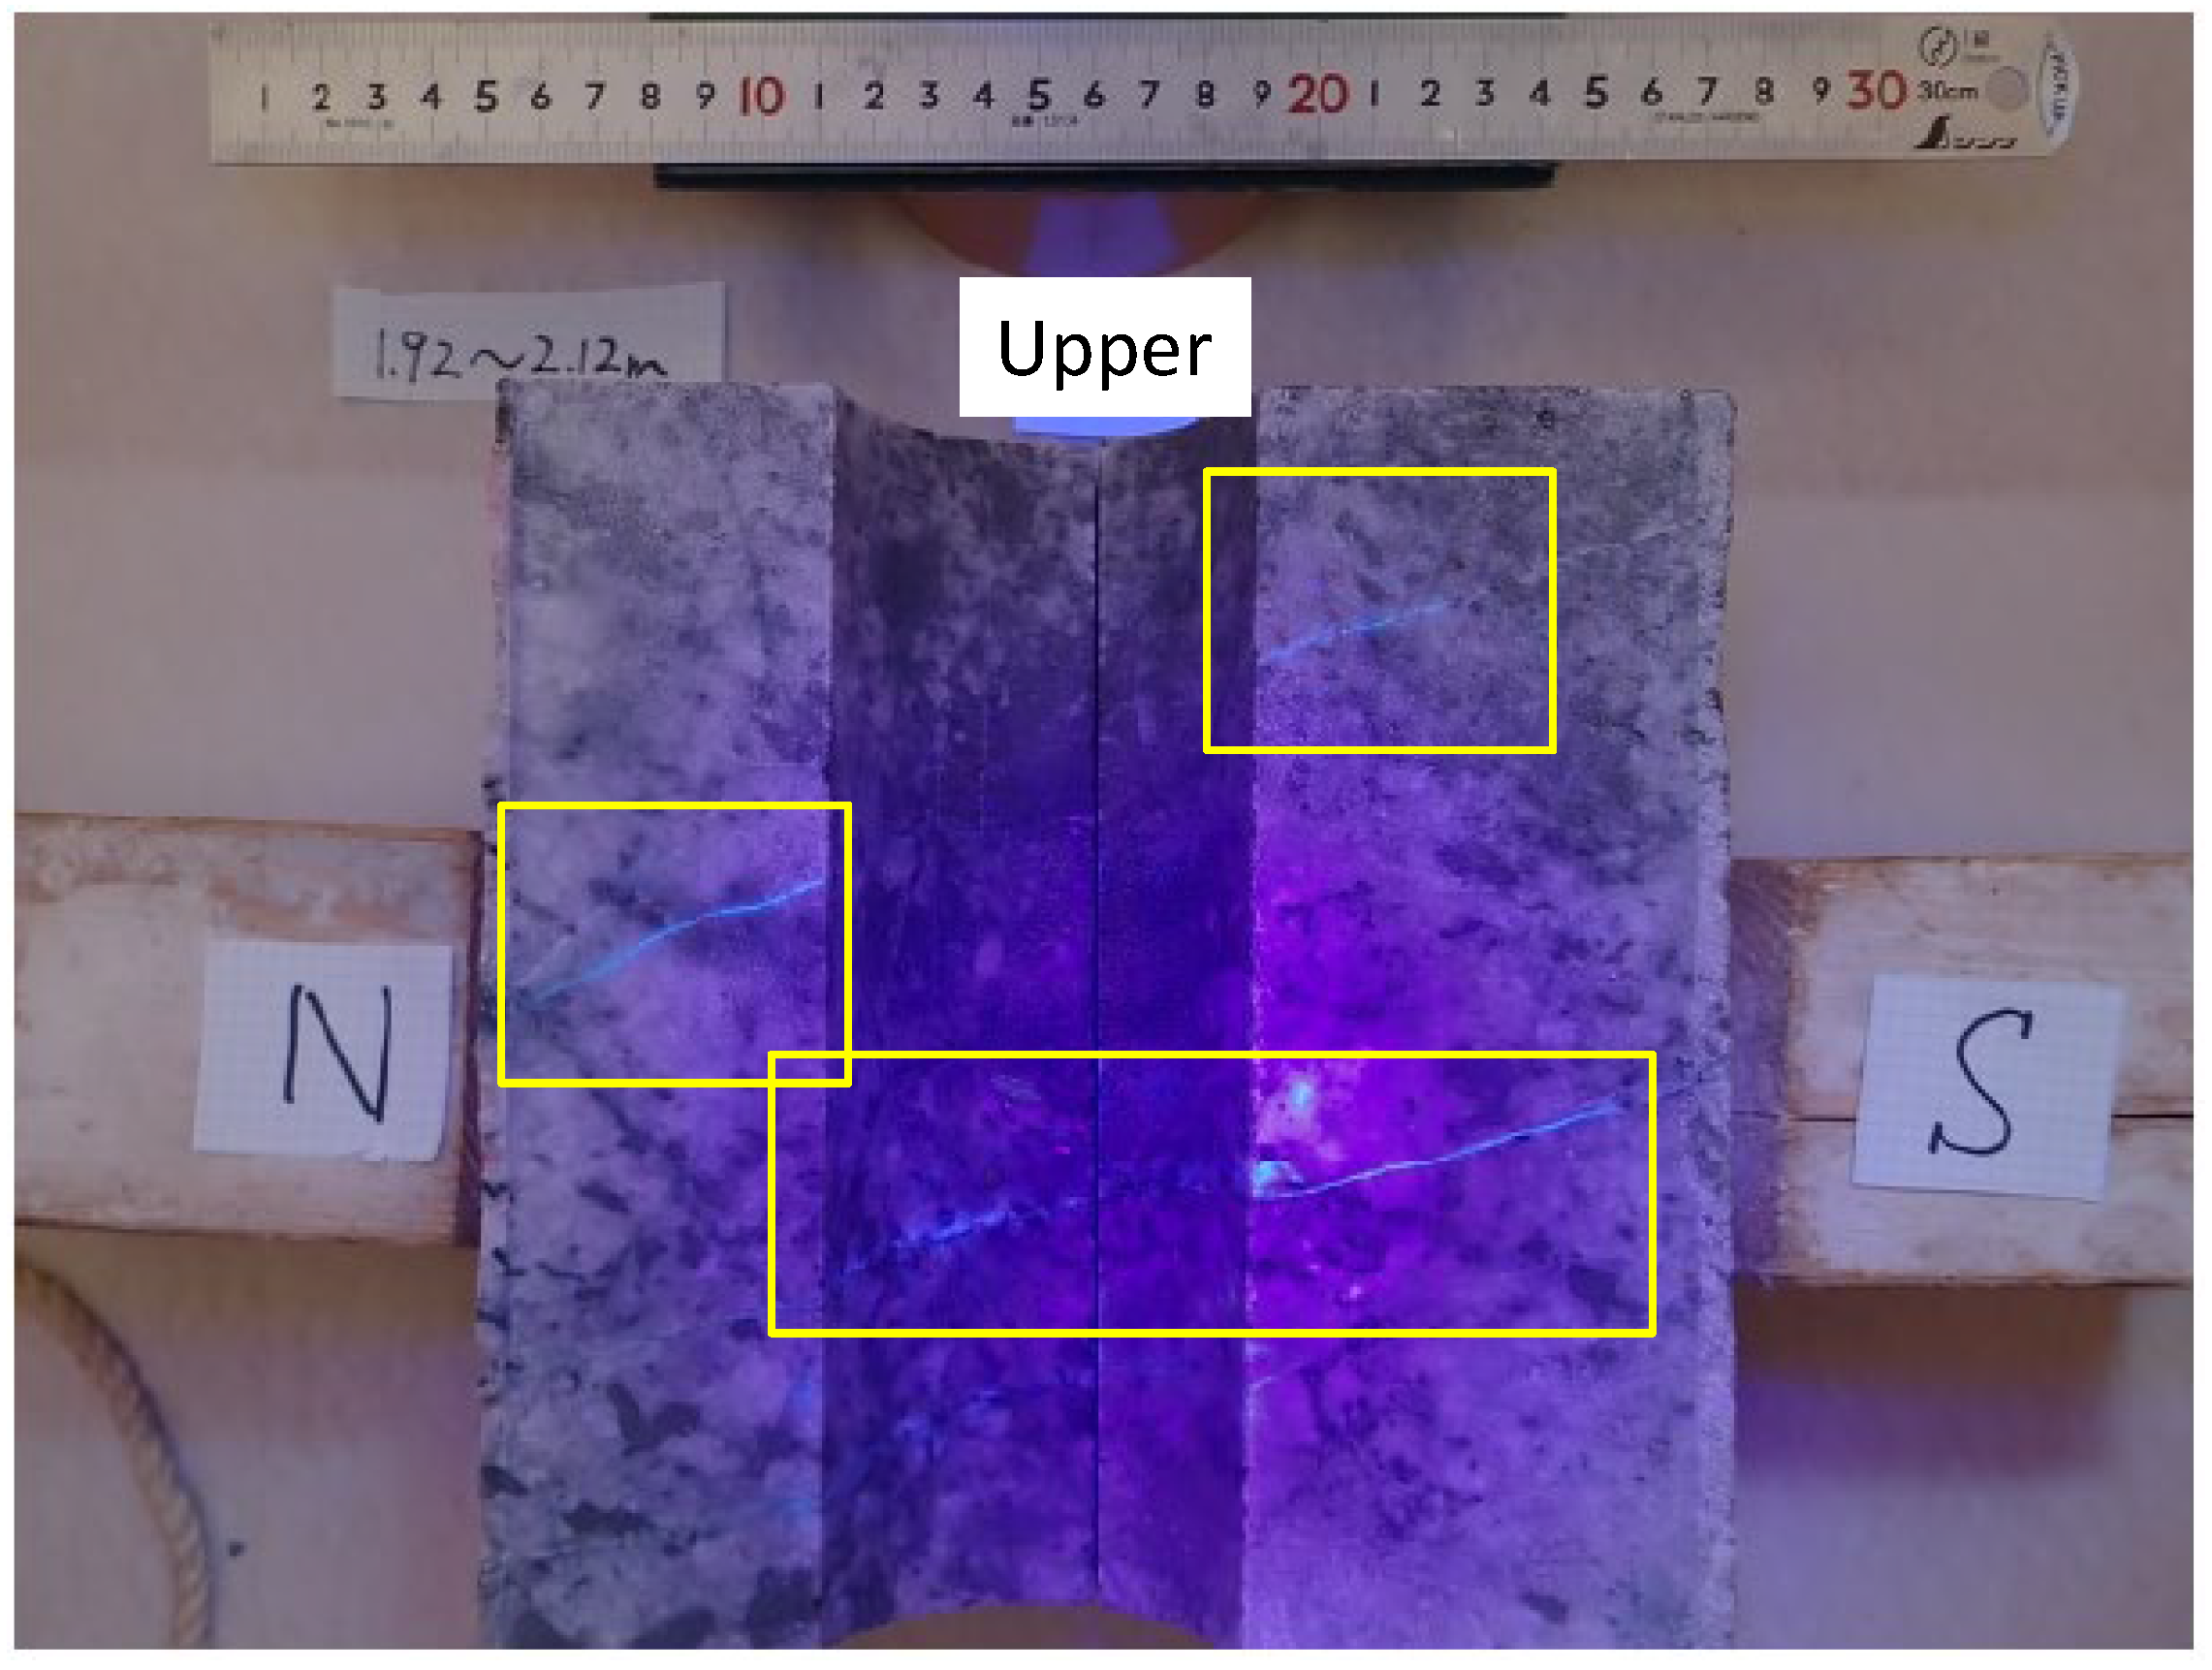
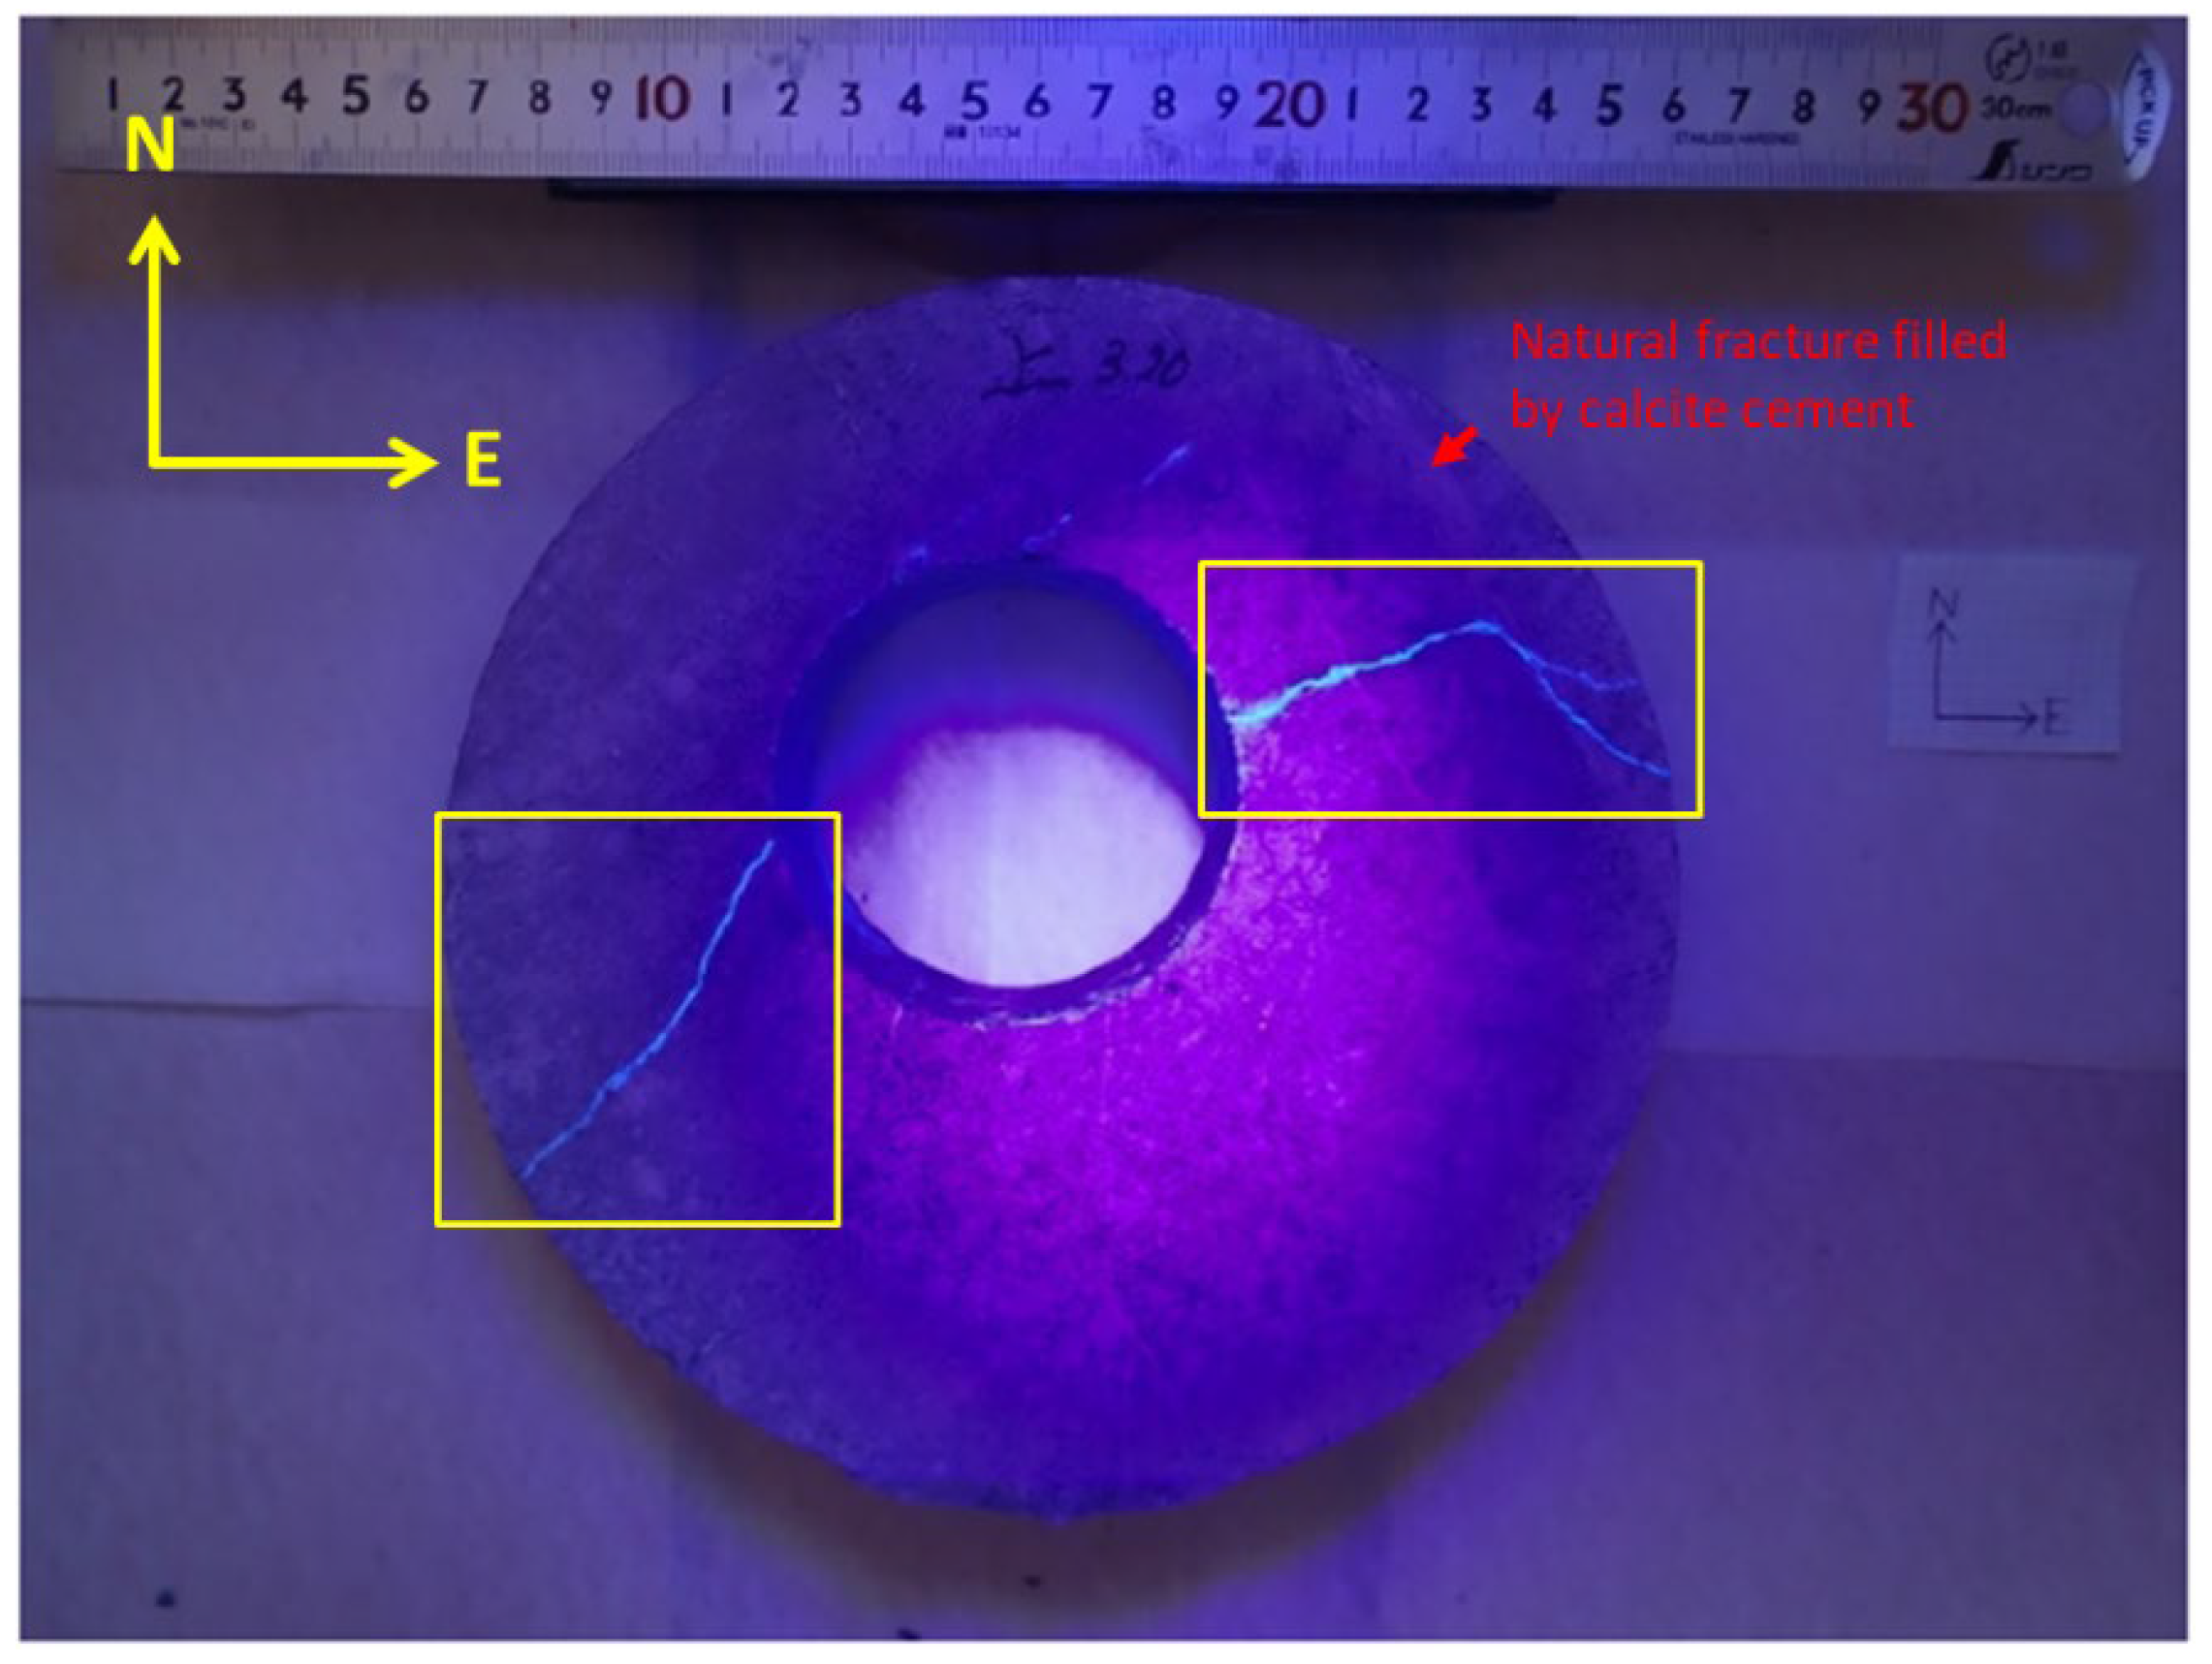
When the surfaces of the collected cores were irradiated with black light, the resin-filled fractures exhibited fluorescence (Figure 8). To observe the extent of resin filling, a transparent sheet was wrapped around the surface of the core, and the fractures showed a fluorescent reaction. After observing the core surfaces, the cores were cut along the direction where the features of the fracture extension could be observed. The observations clarified that horizontal fractures gently dipped northward at a center depth of 2.10 m (Figure 9). In contrast, bi-wing vertical fractures extending in the NE-SW direction were created, which changed direction when they met the natural fractures at a center depth of 3.30 m (Figure 10).
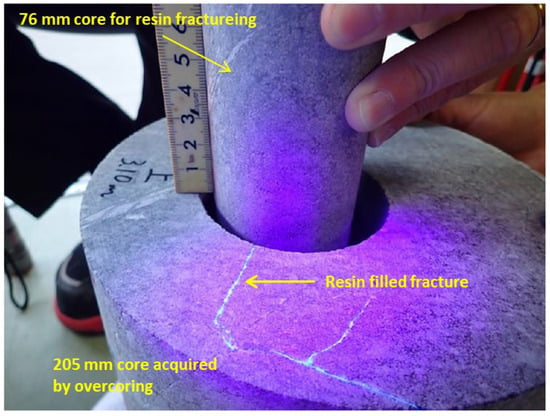
Figure 8.
Photograph of recovered core after resin fracturing test under black light (3.10 m).
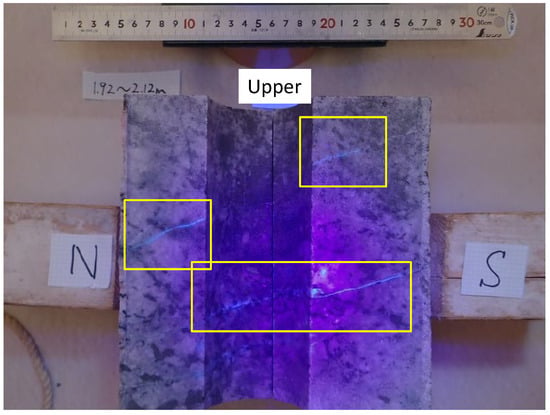
Figure 9.
Cross-section of 205 mm core (from 1.92 to 2.12 m).
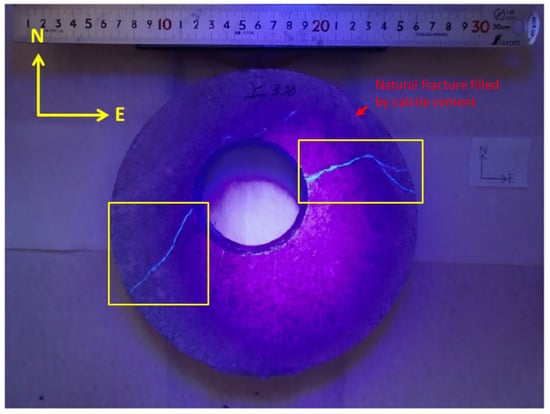
Figure 10.
Cross-section of 205 mm core (3.20 m depth).
3.3. Distribution of AE Hypocenters
Although AE data were recorded during the resin fracturing experiment at the two depths, the analytical results of AE data recorded only at 3.30 m were considered for this study because the data at 2.10 m required further analyses. The hypocenters of the AE events were located at 3.30 m. The details of this procedure are described below.
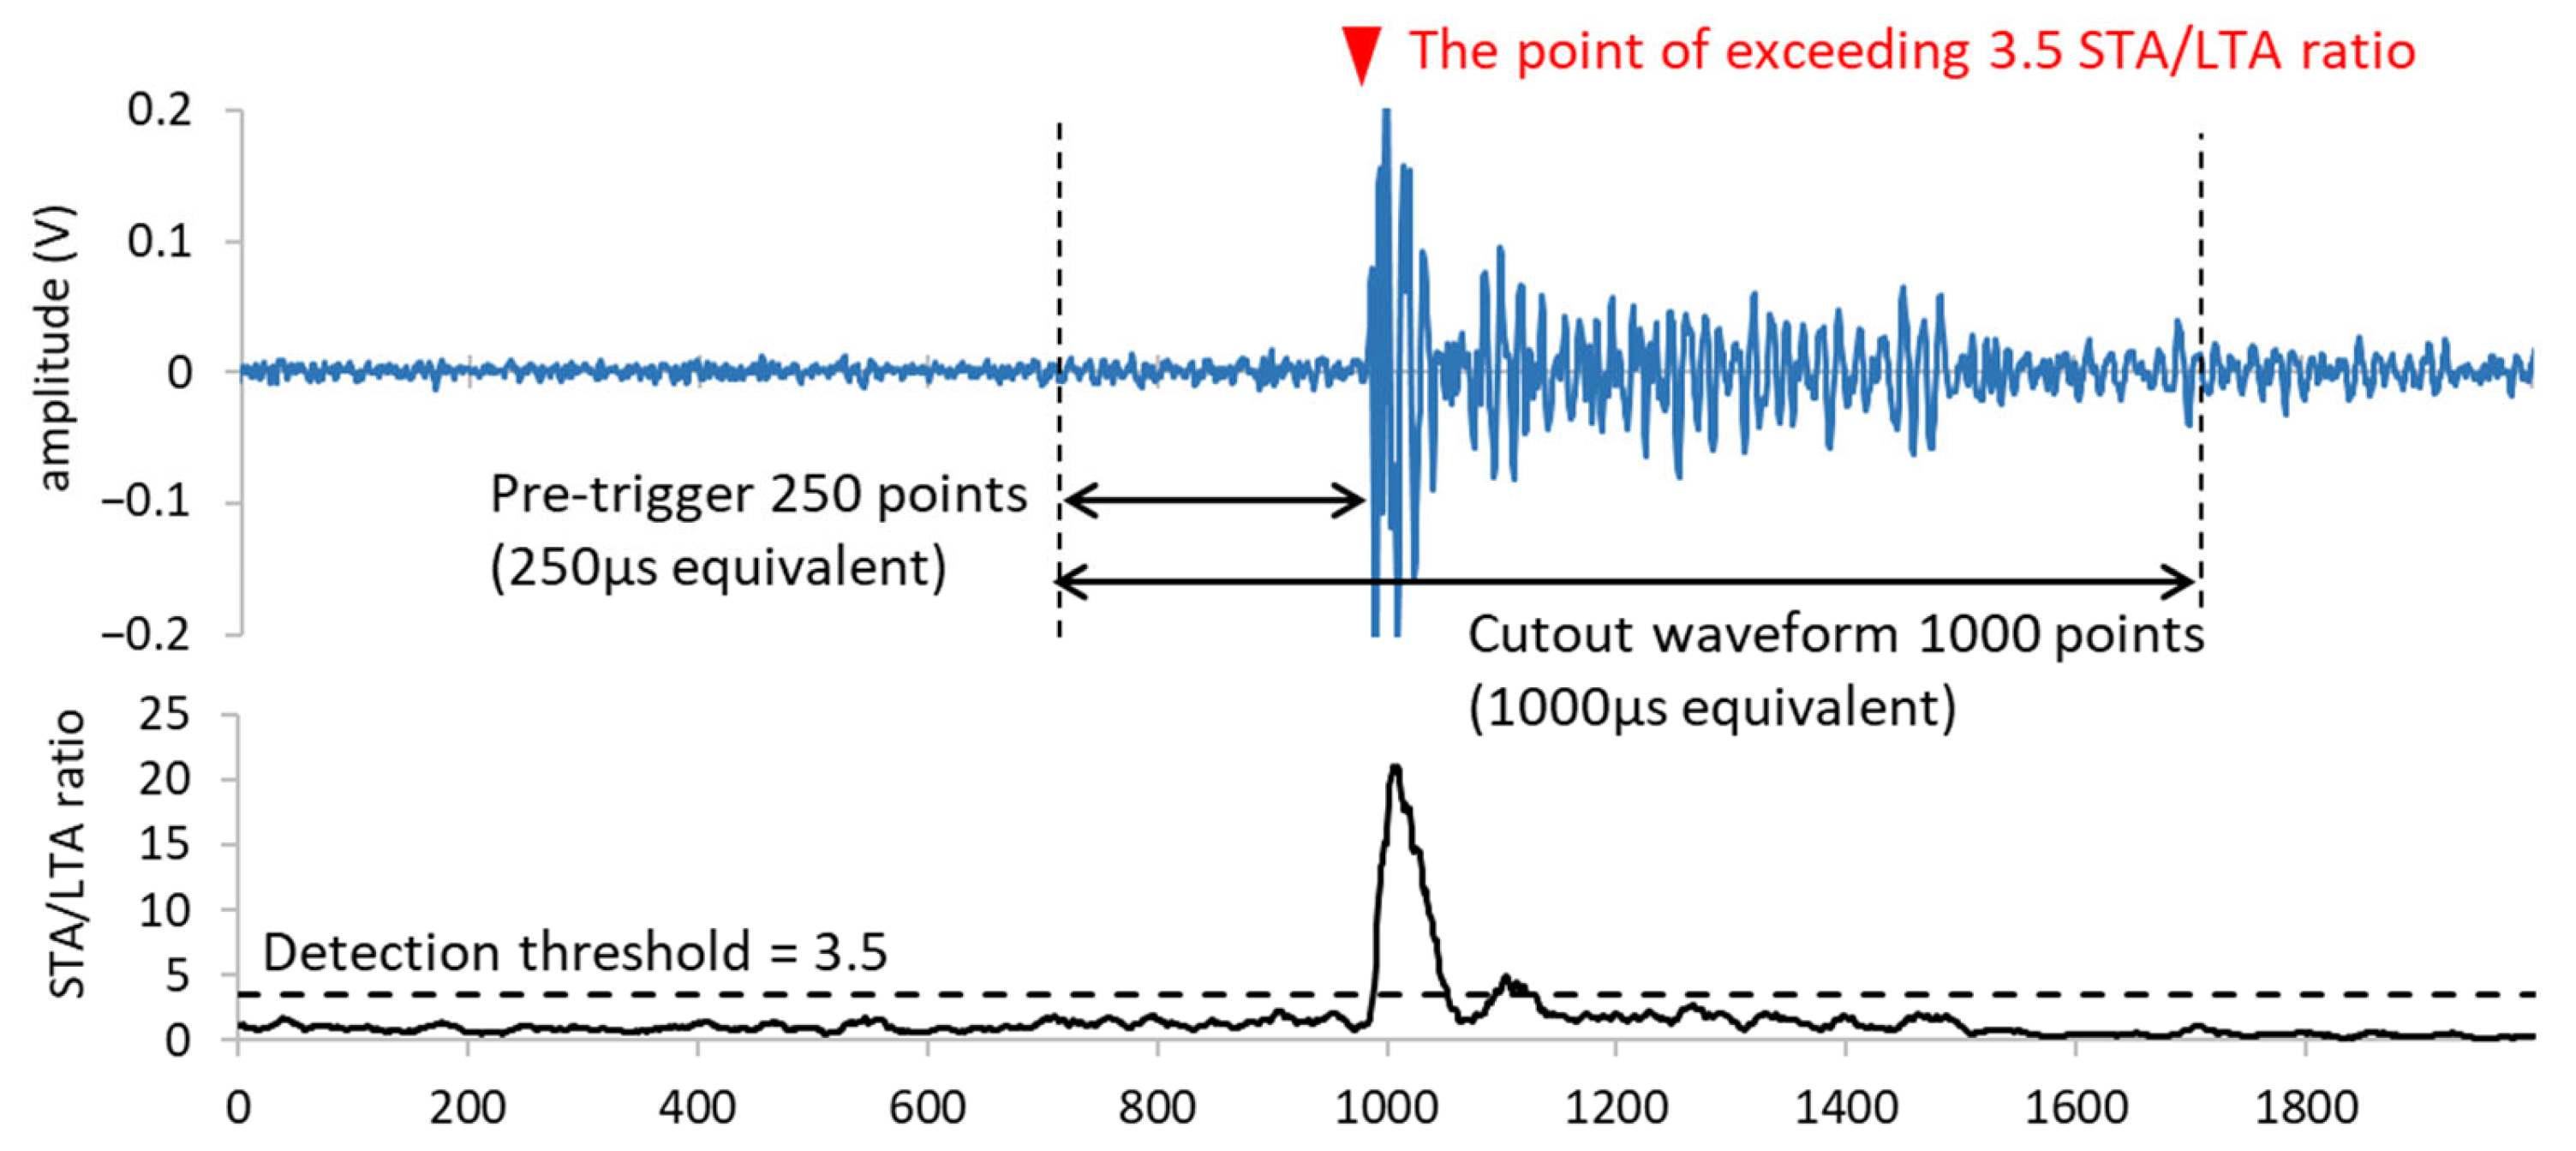
First, AE events were extracted from the recorded continuous waveforms using the short-term average/long-term average (STA/LTA) ratio detection method described by Naoi et al. 2018 [17]. We calculated the STA for 20 points and the LTA for 1000 points of the continuous waveform, searching for a “trigger point” where the STA/LTA ratio exceeded 3.5. The AE waveform, 1000 points in length, was then cut from the continuous waveform starting at 250 points before the trigger point (Figure 11). This process was repeated until the continuous waveform was obtained for all 24 sensors. AE was defined as a group of temporally close trigger points across multiple sensors. Thus, we considered trigger points within 1000 μs at each sensor as a single AE event.
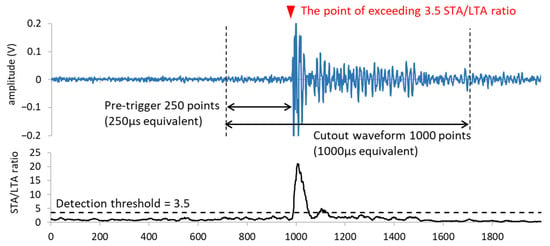
Figure 11.
Method of AE waveform extraction from recorded continuous waveform.
After extracting the AE events, the first arrival time of the P-wave was estimated using an algorithm based on the auto-regressive Akaike information criterion (AR-AIC) method [21] for each sensor and AE event. The hypocenters of these AE events were located using a non-linear least-squares method based on the obtained first arrival times of the P-wave, P-wave velocities, and coordinates of the AE sensors. The P-wave velocities at the test site were measured prior to the resin fracturing test with values of 5.88 km/s. We applied these velocities to the calculation assuming that the P-wave velocity at the site was homogeneous. The coordinates of the AE sensors were calculated based on the coordinates of the hole head and measurement data of the hole trajectory.
We considered a hypocenter location to be successful when the error was within 0.03 m. The error was evaluated by multiplying the P-wave velocity with the root mean square (RMS) of residuals of the first arrival time at each sensor. The residual was defined as the difference between the selected first arrival time and the back-calculated first arrival time. When the error was larger than 0.03 m, we attempted to improve the accuracy of the hypocenter location by recalculating it while rejecting the P-wave first arrival time from the sensor with the largest residual in the AE event. This process was repeated until the error was less than 0.03 m or the number of remaining sensors dropped to 10. If the error remained above the criterion despite using only 10 channels, or if the spatial distribution of the remaining sensors was biased, that is, if the remaining sensors were distributed across fewer than four boreholes, we rejected the AE event data. Finally, 4077 hypocenters were located within the error criteria.
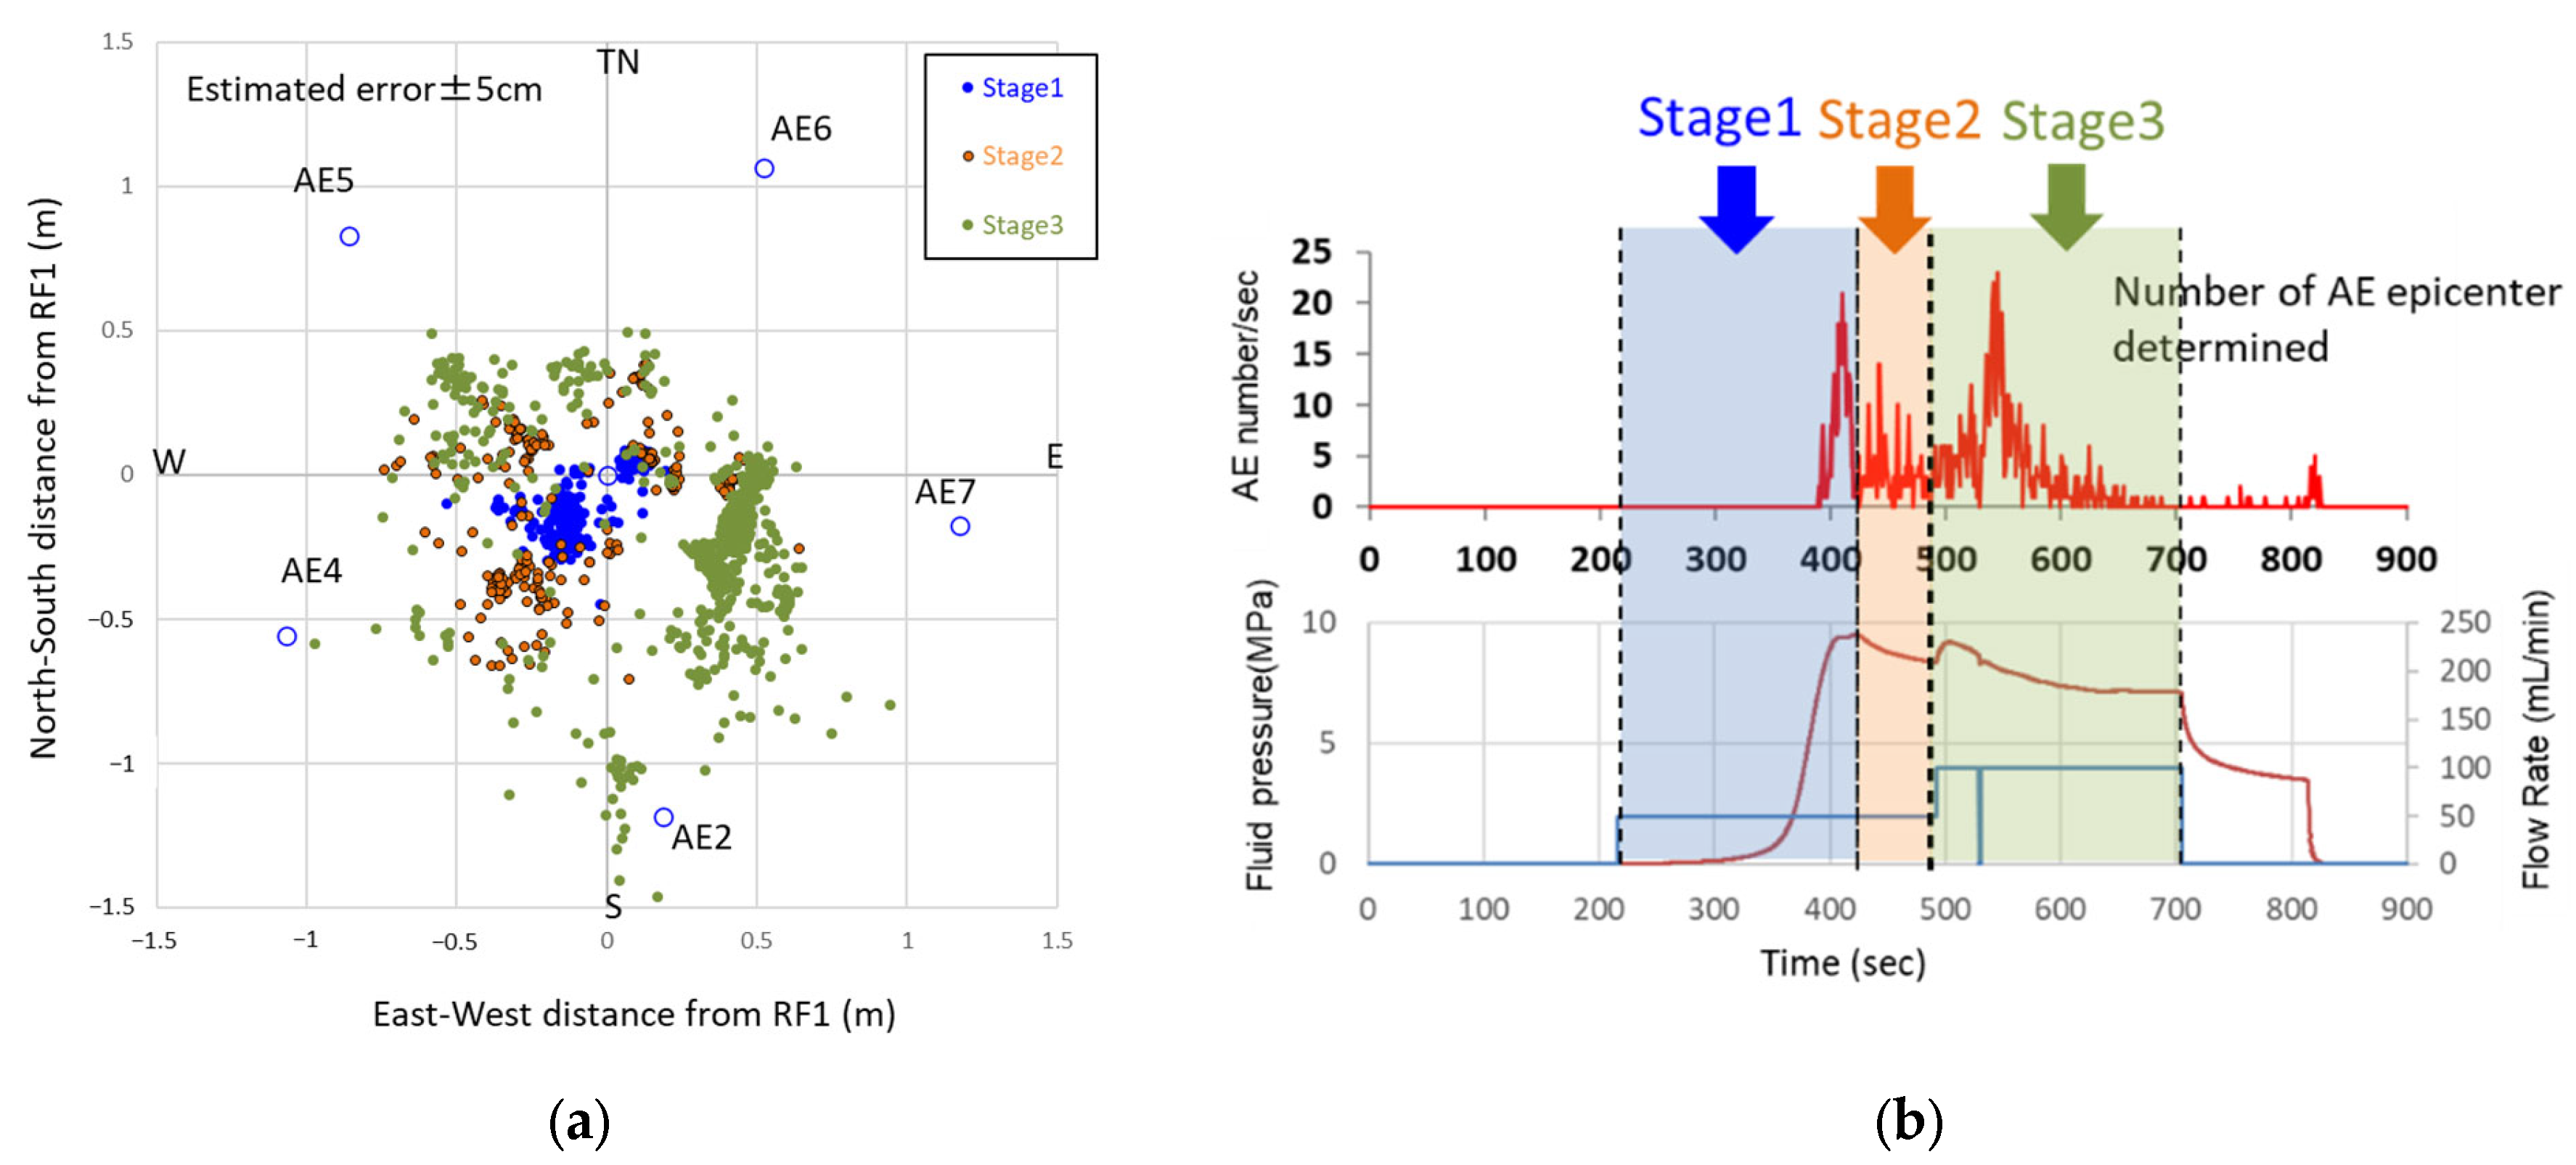
The distribution of the located AE hypocenters during fracturing at a center depth of 3.30 m is shown on the left of Figure 12. The AE hypocenters were colored based on the stages of the resin injection process. Stage 1 is the period from the start of fluid injection to the first breakdown, Stage 2 is the period from the first breakdown to the end of the 50 mL/min flow rate, and Stage 3 is the period of 100 mL/min flow rate, including the second breakdown. In Stage 1, AE extended in the NE-SW direction, which was consistent with the direction of the fracture extension observed in the core. In Stage 2, the number of AEs decreased, but they spread to the surrounding area. The number of located AEs increased and spread further in Stage 3. An enclave cluster was observed in the eastern to southeastern area of RF1. This cluster occurred at a depth shallower than the injection depth (3.30 m) and appeared to dip southward (Figure 12).
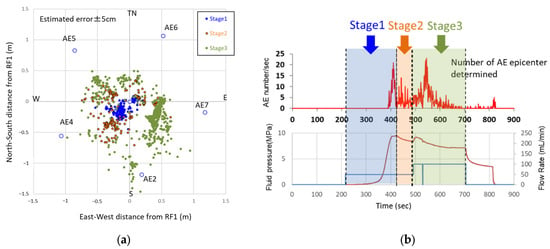
Figure 12.
(a) Distribution of AE hypocenters during the fracturing at the center depth of 3.30 m. (b) Stages of fluid injection.
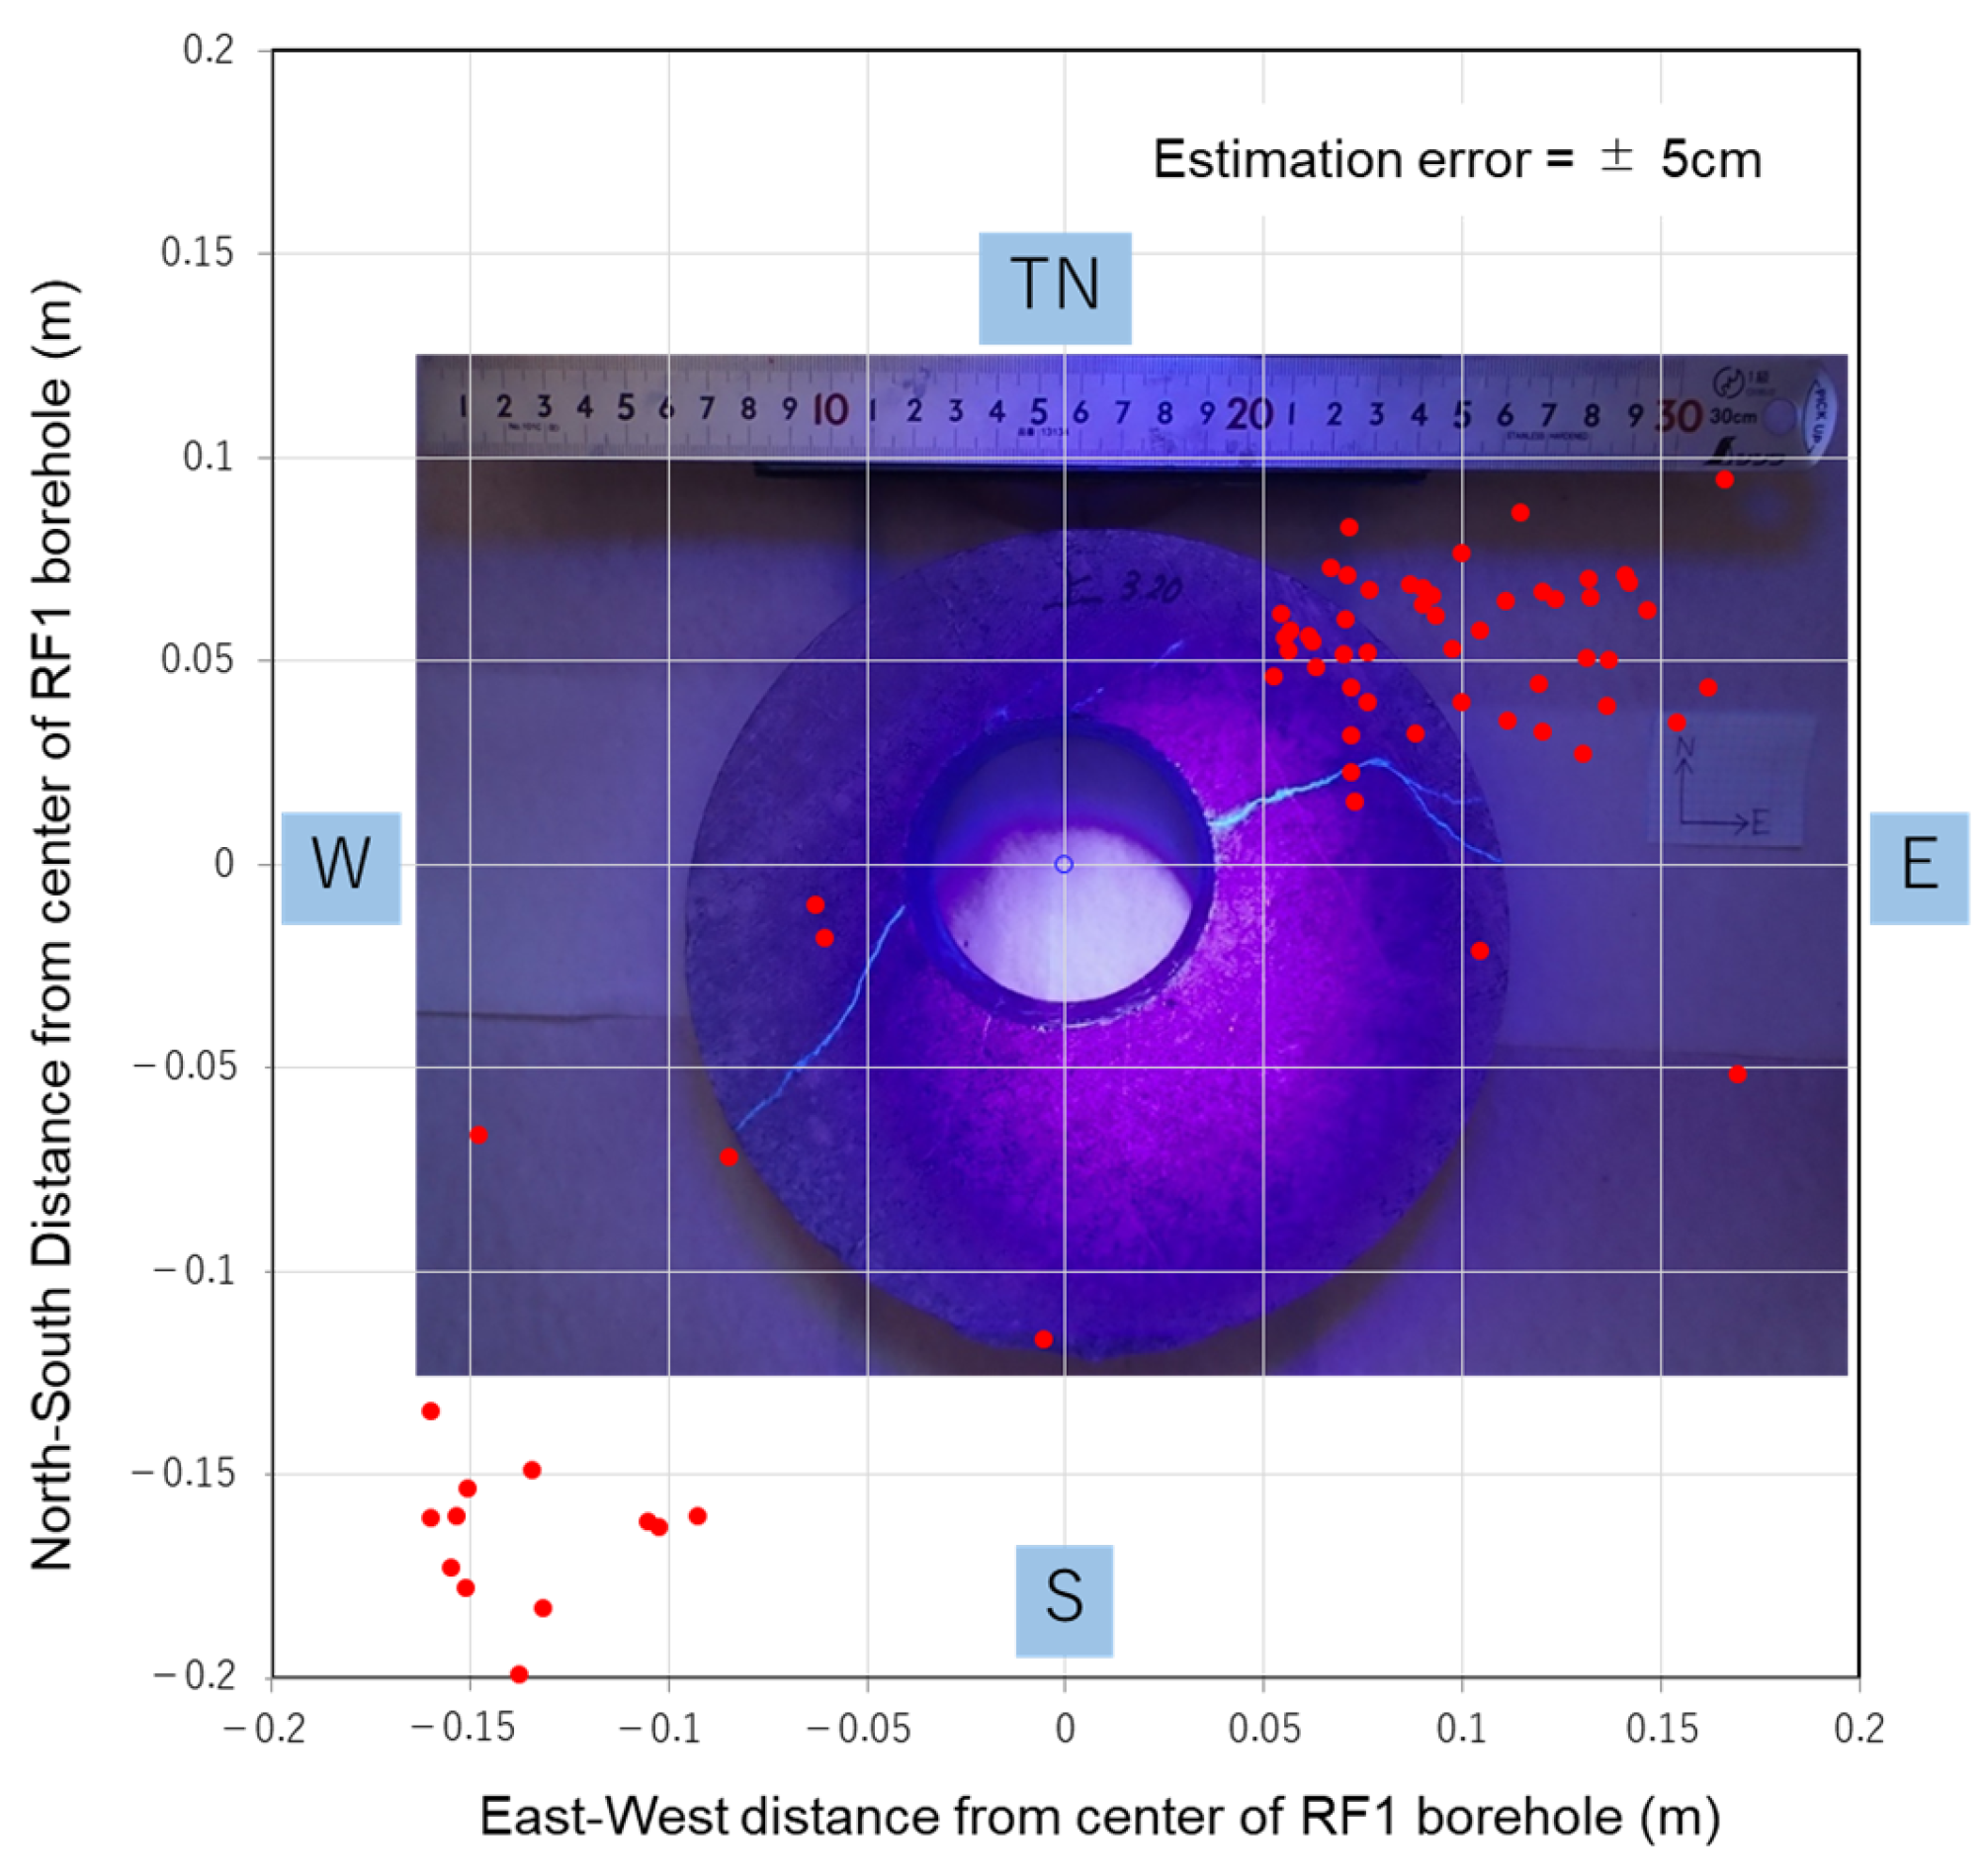
The AE event locations observed at the time of breakdown were distributed in the NE-SW direction, generally aligning with the direction of the fracture extension (Figure 13).
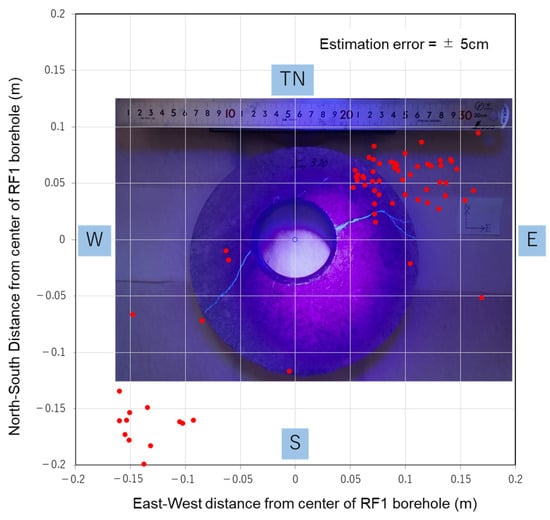
Figure 13.
Acoustic emission event locations on the 205 mm core section (at 3.30 m).
3.4. Analysis of Failure Mechanisms
The failure mechanism was analyzed using the polarity of the first P-wave motion of the AE waveform. The first motion emitted by the tensile failure was compressional around the hypocenter, mainly because it pushed the medium from the fracture plane. Conversely, the first motion from shear failure includes both compression and dilatation because shear failure is accompanied by compressional and extensional regions. Based on this principle, failure mechanisms were estimated in this study using first-motion polarities. AE events must have a high signal-to-noise (S/N) ratio to accurately extract the first-motion polarities. A total of 375 AE events with high S/N ratios were identified, based on the criteria outlined in Table 3.

Table 3.
Criteria for selecting acoustic emission events for extracting first-motion polarities.
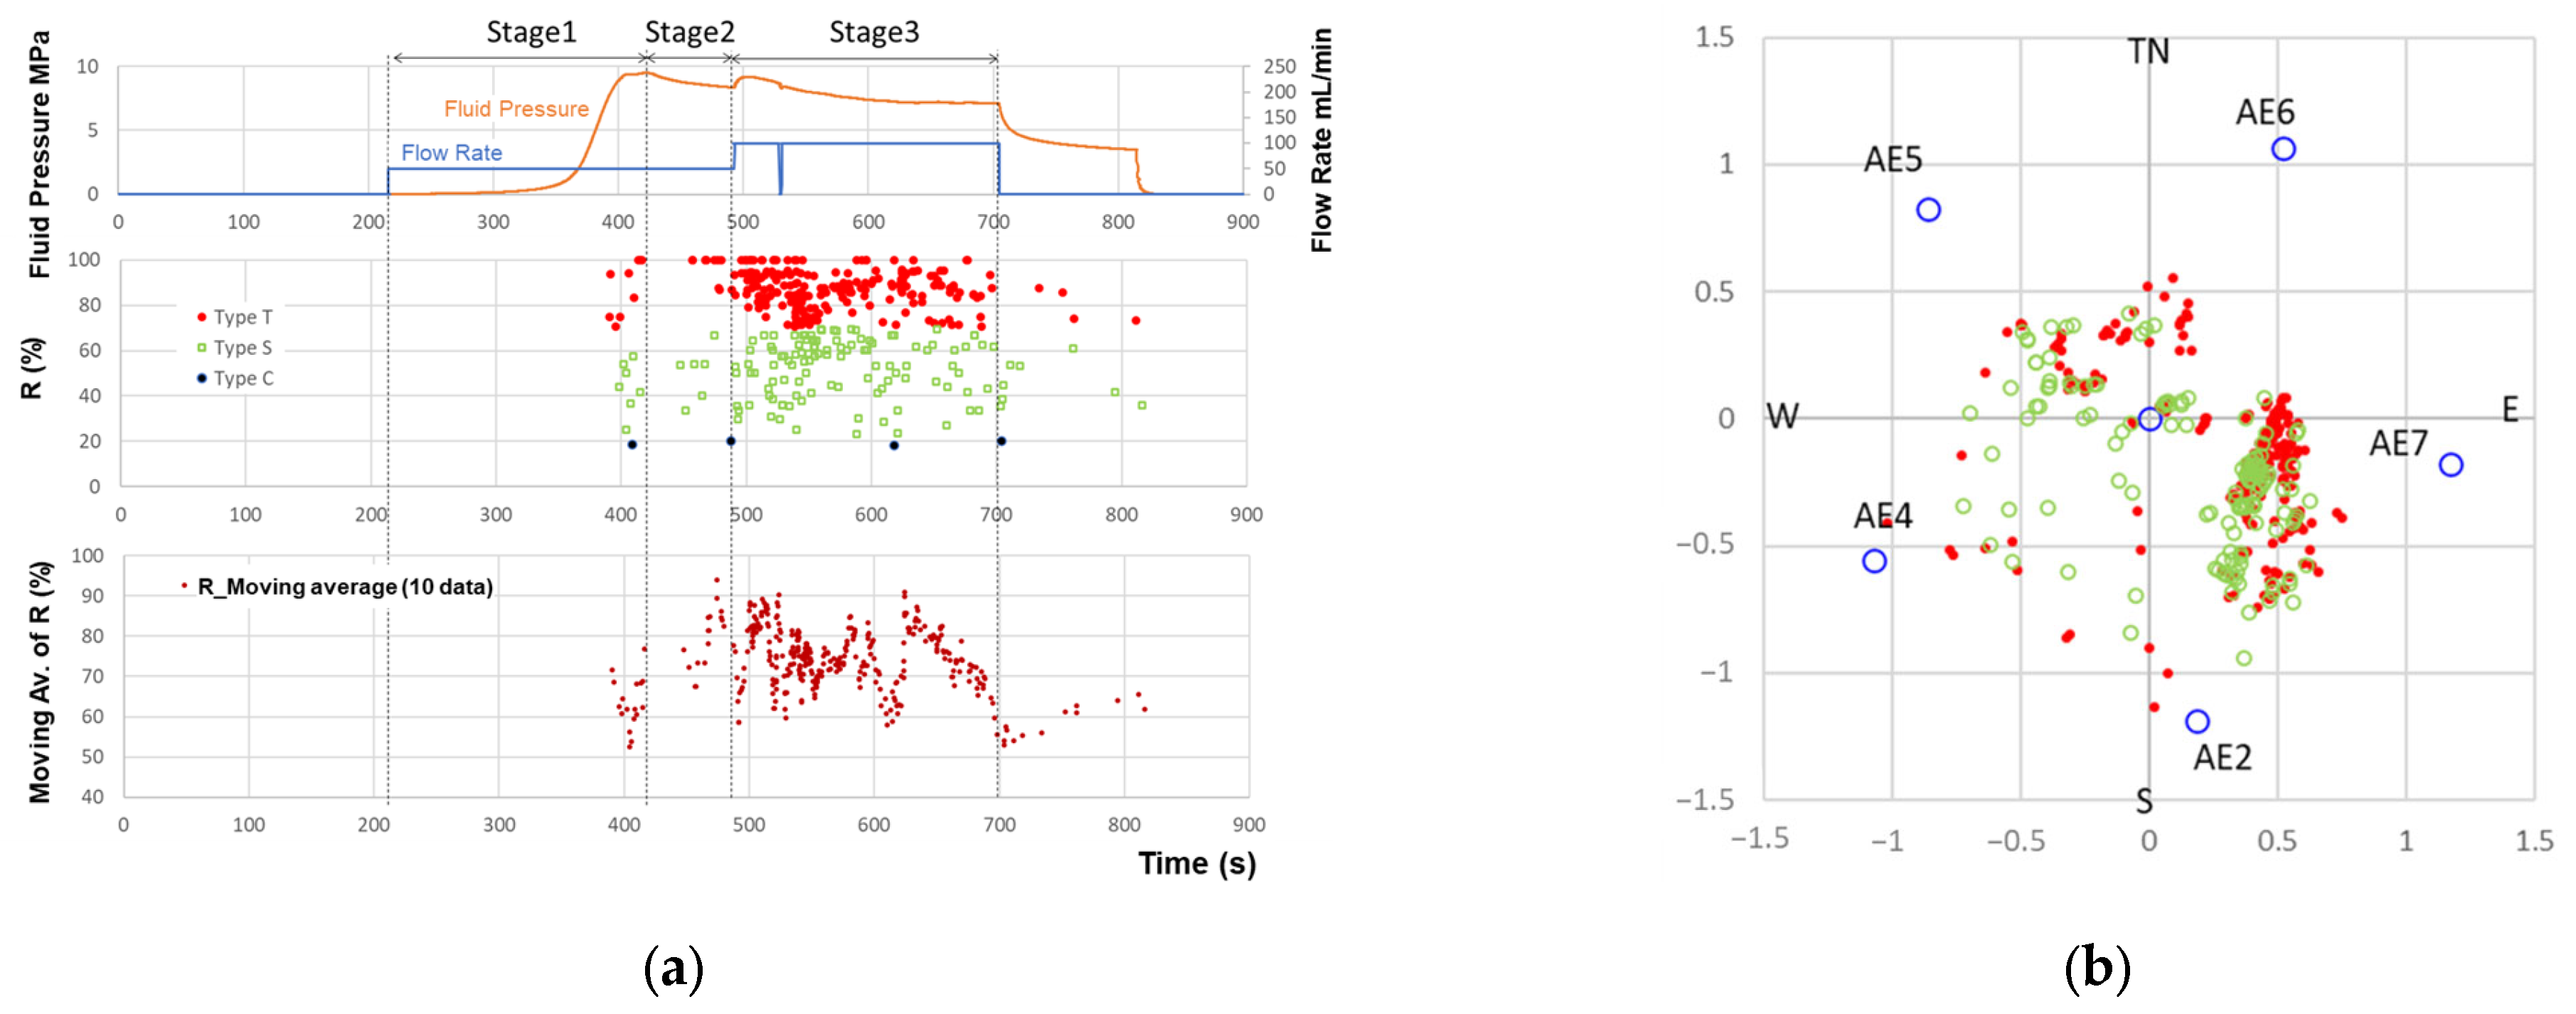
The AE events were then classified into tensile failure, shear failure, and fracture closing based on the ratio of the number of first compressional motions to the total number of polarities that could be distinguished by all sensors (R-value), following Ishida et al. 2021 [19]. In this study, the AE events were classified as follows: tensile (Type T), R-values greater than or equal to 80%; shear (Type S), R-values between 20% and 80%; and closure (Type C), R-values less than 20% (Figure 14). Examining the occurrence times of each type, Type T was predominant immediately after the breakdown, followed by Type S in Stage 1. The moving average of the R-value showed periodicity, indicating that Type T occurred first when the AE activity area expanded, followed by Type S. The horizontal distribution of the hypocenters showed several clusters of AE events. Each cluster exhibited a pattern in which Type T events were predominantly distributed in the outer part of the cluster, whereas Type S events were concentrated in the inner part.
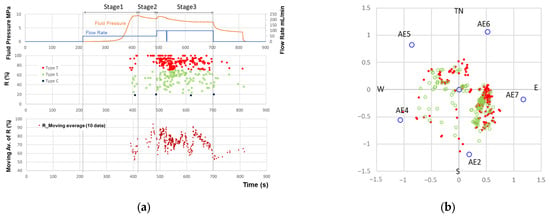
Figure 14.
Classification of failure mechanism for resin fracturing at the central depth of 3.30 m. (a) The time series of fluid pressure, flow rate, and R-value; (b) horizontal distribution of Type T and Type S.
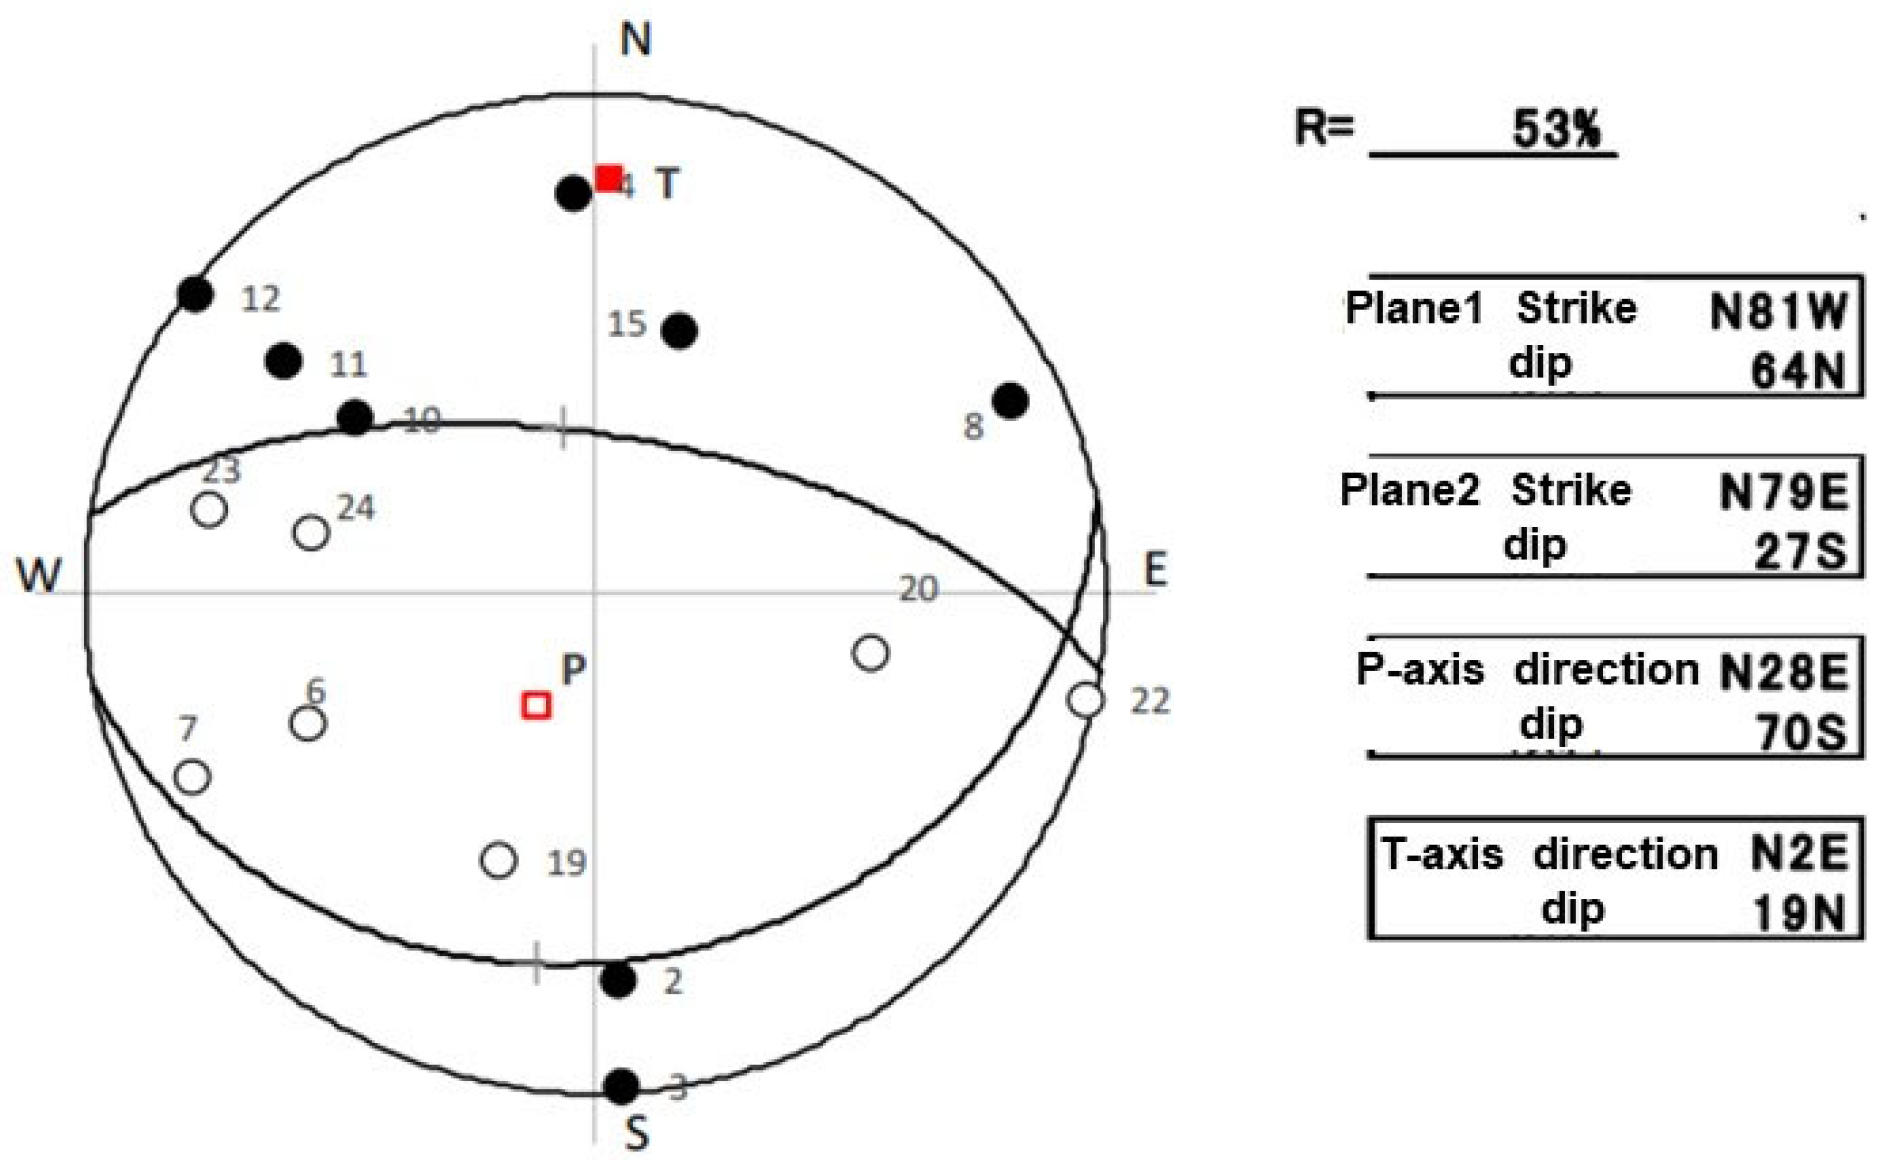
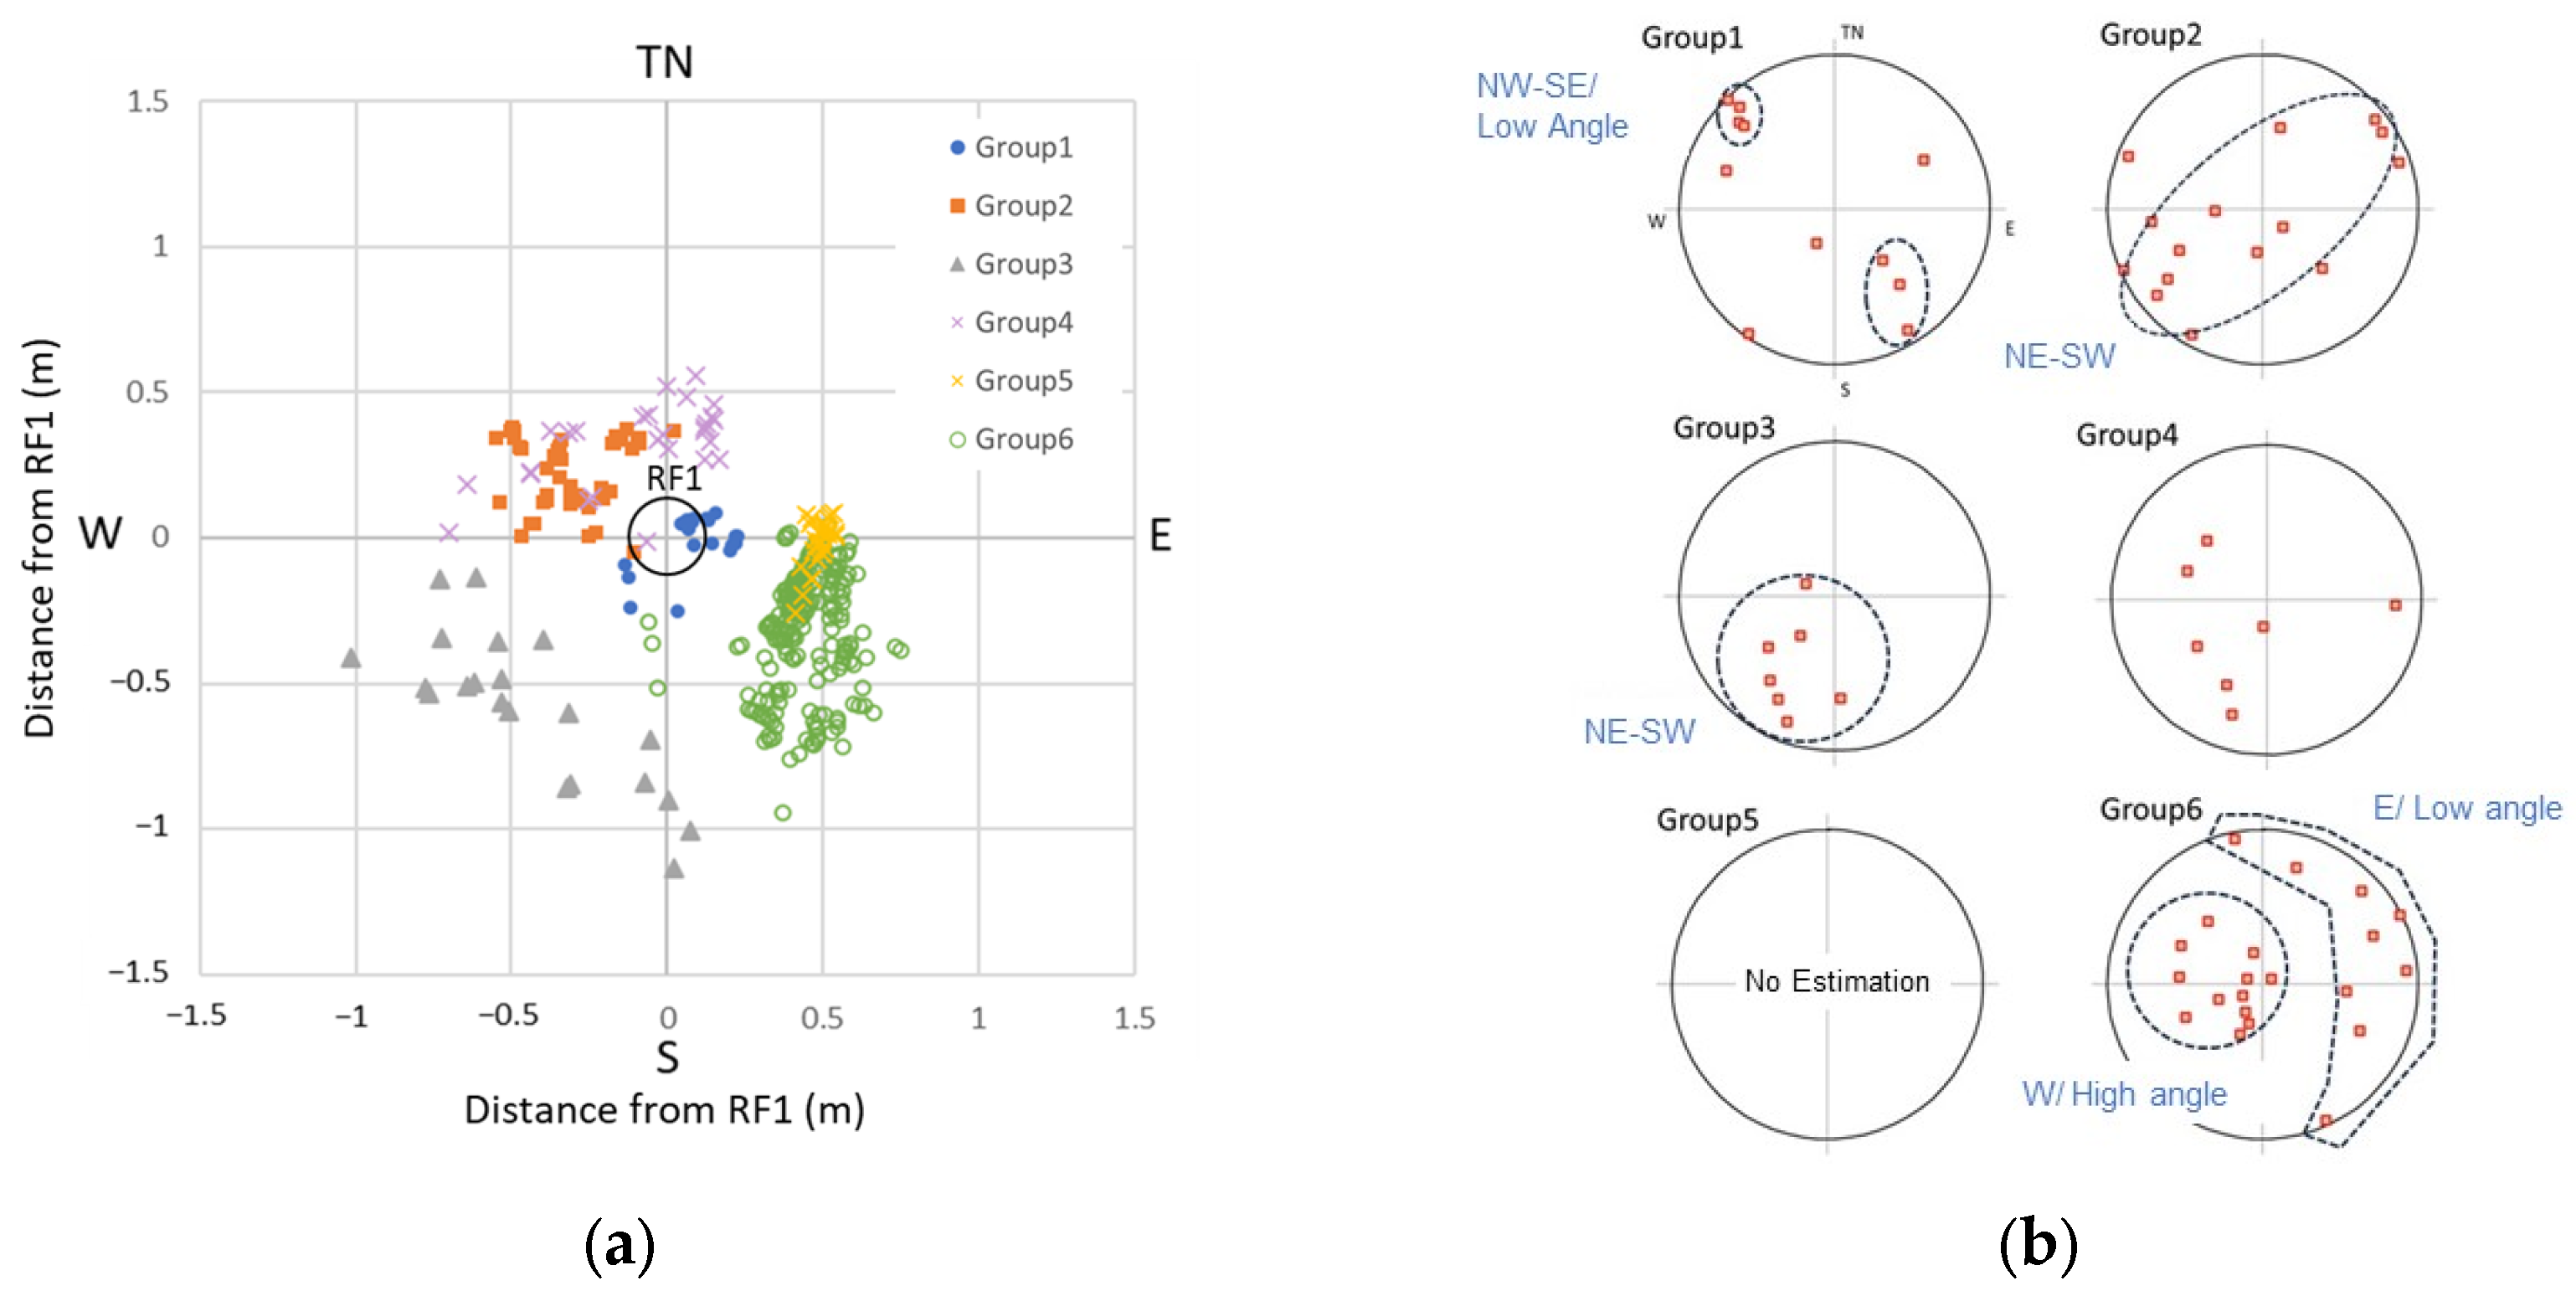
We performed fault plane analysis for Type S events exhibiting a clear first motion in the waveforms (Figure 15). A total of 130 AE events were classified as Type S and observed from Stage 1 to Stage 3, and 59 fault plane solutions of these events were obtained based on the distribution of the compressional and dilatational first motions on a Schmidt net projection. The AE events were further grouped into five clusters based on their locations and times of occurrence, and the pressure axes (P-axes) were plotted in the lower hemisphere of the Schmidt net for each group (Figure 16). The Schmidt net projection of Group 1 showed that seven P-axes were distributed in the N45W direction with low dip angles. The other P-axes did not show any direction or dipping trends. The P-axes of Groups 2 and 3 exhibited a NE-SW directional trend. No trends were observed in Group 4. The P-axes of Group 6 exhibited two distinct trends: in the west direction, with high dip angles, and in the east direction, with low dip angles.
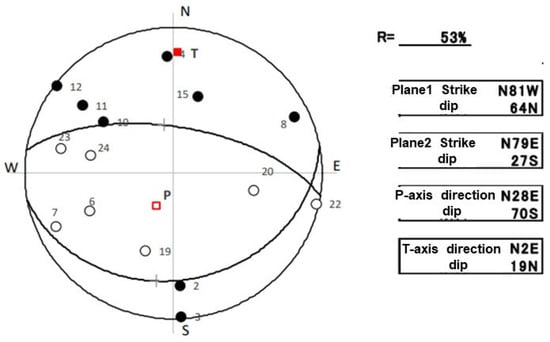
Figure 15.
Example of fault plane analysis (lower hemisphere of Schmidt net projection).
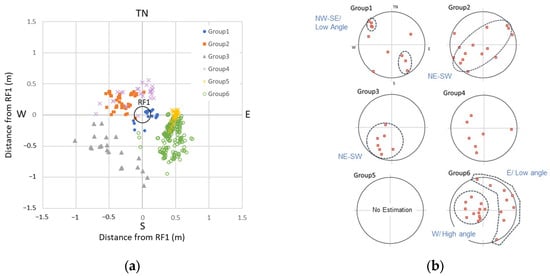
Figure 16.
(a) Grouping of acoustic emission events; (b) distribution of P-axis for each group.
4. Discussion
The fractures created at a depth of 2.10 m were tilted horizontally along existing fractures or weak surfaces (Figure 9). The breakdown pressure of 5.98 MPa (Figure 5) was lower than the breakdown pressures of prior hydraulic fracturing conducted at other holes (approximately 10 MPa, Table 1). Thus, the low-angle natural fractures were created by the resin injections because the vertical stress was small at this depth. Conversely, bi-wing vertical fractures were created at 3.30 m (Figure 10), and the breakdown pressure reached close to 10 MPa (Figure 6). This indicates that the influence of the horizontal stress on the fracture direction was larger at 3.30 m.
Comparing the direction of the resin-filled fracture and the distribution of AE hypocenters, the distribution of the hypocenters in the area very close to RF1 showed an ENE-WSW trend, consistent with the direction of the resin-filled fracture on the recovered core (Figure 13). The direction of the maximum principal stress, which was estimated from hydraulic fracturing, mainly followed a WSW to NE-SW trend (Table 1). The direction of the resin-filled fractures is consistent with this result. Therefore, the maximum principal stress direction at this depth was presumed to follow an ENE-WSW trend, and the direction of the resin-filled fracture was reflected in the local stress during the initial stage. However, the AE hypocenters at a depth of approximately 1 m from RF1 were distributed along the NEN-SWS trend following the long axis (left of Figure 12). This result indicates that fracture extension is affected by changes in stress conditions, natural fractures, and the heterogeneity of the bedrock.
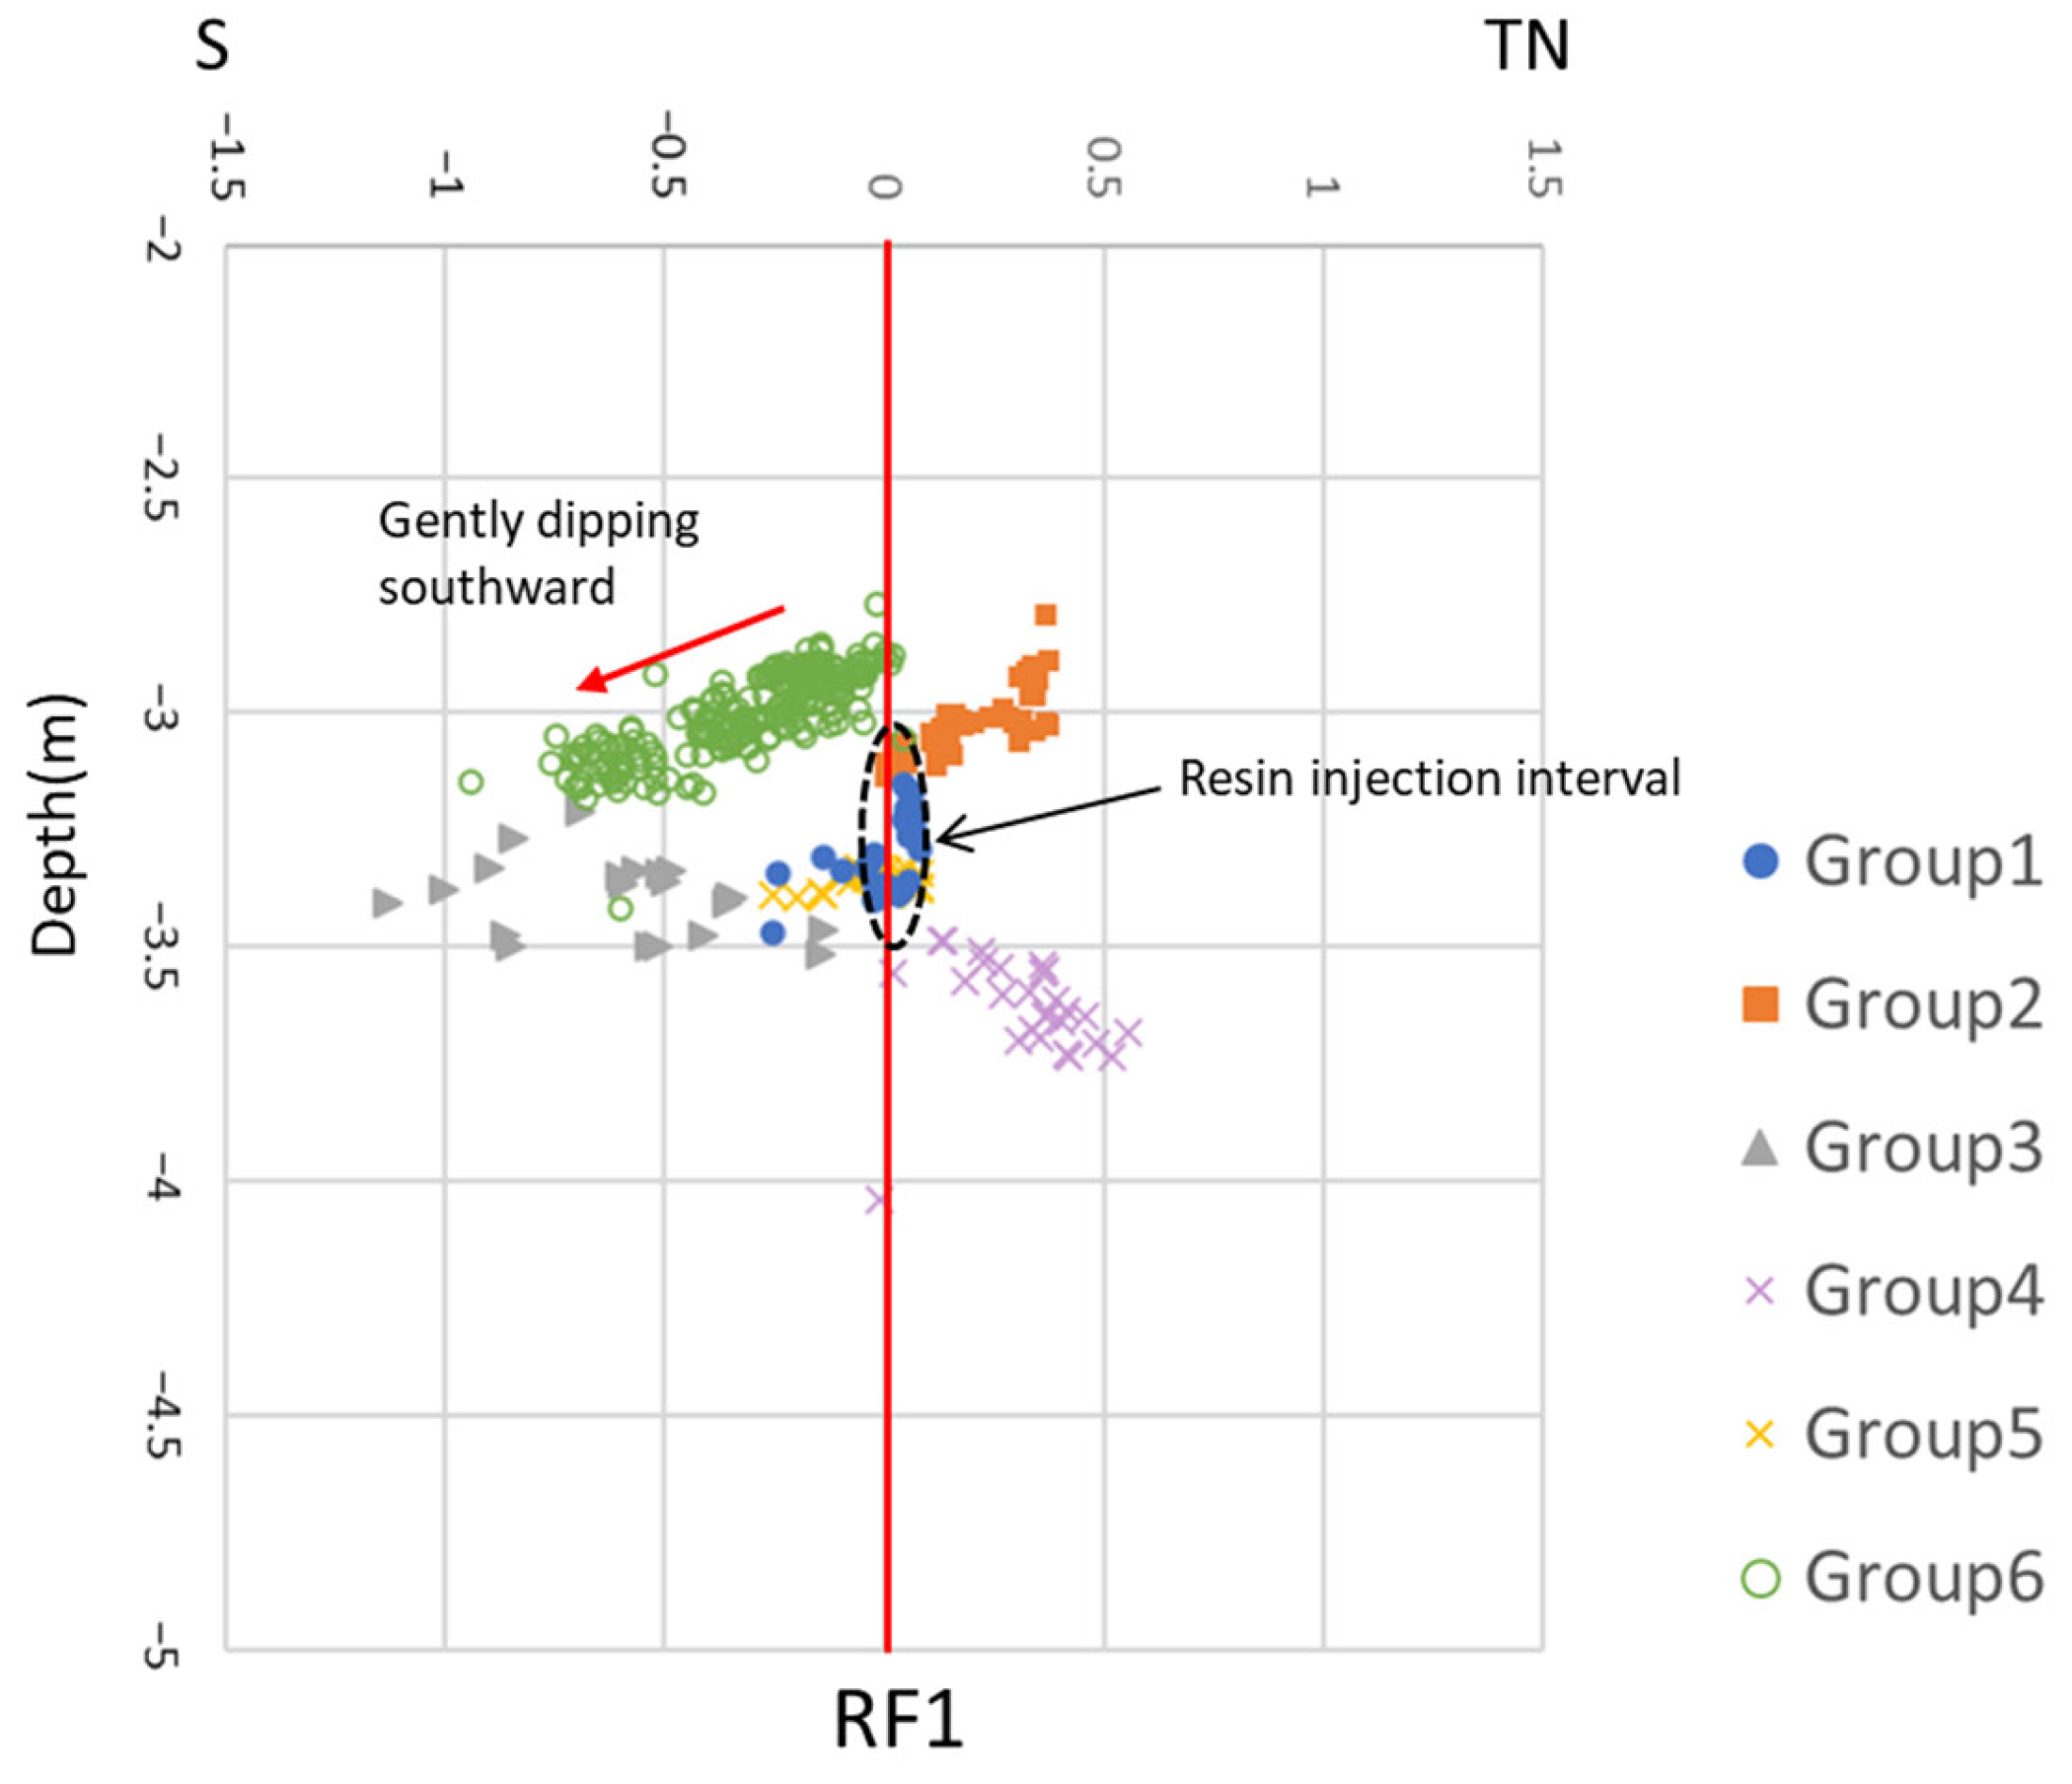
Failure mechanism estimation and categorization of AE were performed as described in Section 3.4. In the fluid injection time series, Type T (tensile) and Type S (shear) events occurred at every stage (Figure 14). In theory, Type T should occur intensively just after breakdown, and Type S follows thereafter because Type T events are assumed to occur when hydraulic fractures are opened by the injected fluid, although such a trend was not observed. In addition, the distribution of Type T fractures did not represent a clear outline of fracture growth. This suggests that fracture growth is a complex mechanism. The directions of the stress axes that caused shear failure (Type S events) were estimated using fault plane analysis. The P-axis direction of Group 1, distributed in the AE clusters near the RF1 area, was estimated to have an NW-SE trend (Figure 16). The direction was perpendicular to the direction of the resin-filled fracture on the cross-section of the core at 3.30 m (ENE-WSW trend). Therefore, the Type S AE event of Group 1 is expected to occur owing to the compressional stress caused by the pushing of the bedrock due to the opening of the induced fracture. The P-axis directions of Groups 2–5 show various trends; therefore, it is difficult to consider the mechanisms of the AE that occurred at this time. Group 6 was a characteristic cluster generated in a remote area southwest of the RF1. The AE cluster of Group 6 resembled a plane gently dipping southward in the vertical cross-section (Figure 17). The characteristics of this gently tilted horizontal plane are similar to those of the resin-filled fractures created by resin fracturing at a depth of 2.10 m. Group 6 fractures occur at a shallower depth than the resin injection interval (Figure 17), which indicates that the resin reached a shallow depth and the stress condition became similar to that at 2.10 m, leading to the creation of a horizontal fracture. However, the AE distribution of Group 6 extended in the north–south direction rather than spreading across the area (Figure 16). This suggests the presence of natural fractures with an N-S strike trend. The P-axes of Group 6 exhibited two distinct trends: in the west direction with high dip angles and the east direction with low dip angles. Considering the above, the AE events of Group 6 were generated by a combination of reactivating N-S trend natural fractures with a high angle and reopening low-angle natural fractures due to low vertical stress.
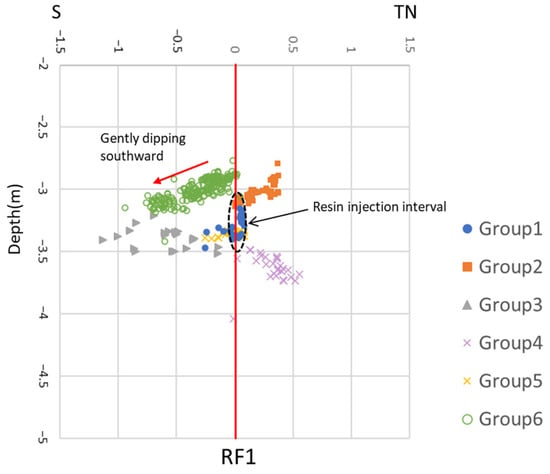
Figure 17.
AE distribution on the south–north cross-section.
There may be several limitations to this study. The first issue is that the scale is different from actual oil fields. Another limitation is that hydraulic fracturing in actual oil fields uses proppants to fill fractures and enhance productivity; however, this study does not discuss the extent to which proppants fill these fractures. Additionally, the bedrock at this experimental site consists of metamorphic rocks, which differ from the sedimentary rocks that form tight oil reservoirs. Finally, due to constraints of the research budget, only a limited portion of the resin-filled fractures could be recovered through large-diameter drilling. Despite these limitations, the advantage of this study is that it allows us to discuss the relationship between fracture propagation and AE occurrence using visible fractures that are actually formed.
5. Conclusions
Hydraulic fracturing tests using a fluorescent resin were conducted at the Kamioka Mine in Gifu Prefecture. We succeeded in visualizing hydraulic fractures in the outcrop using our experimental method. Two resin fracturing tests were conducted at two different depths of 2.10 and 3.30 m. Breakdowns were observed during resin injection at both depths. Although AE was recorded during the resin fracturing experiment at both depths, only the AE data recorded at 3.30 m were analyzed and discussed.
AE hypocenters were distributed in the ENE-WSW direction in the early stage of resin fracturing, which was consistent with the direction of the hydraulic fractures confirmed by coring after the resin fracturing test. Failure mechanisms were classified based on the R-value using AE events with high S/N ratios. The direction of the principal stress acting on the failure was estimated by determining the fault plane solution for shear-type AE events.
In the future, we plan to recover additional cores continuously in the lateral direction from the resin fracturing hole to confirm the fracture propagation. Through this experiment, we confirmed the shape of the actual fractures generated by hydraulic fracturing and compared the recorded AE data with other geomechanical data, including the direction of pre-existing natural fractures and the rock stress conditions measured by the hydraulic fracturing method. Further understanding of the relationship between AE occurrence and fracture geometry can be achieved through an integrated analysis using additional cores continuously recovered in the lateral direction from the resin fracturing hole, which is planned for our next work.
Author Contributions
Conceptualization, T.T.; methodology, T.I., T.D. and T.Y.; formal analysis, T.T., A.F., R.I., T.I., T.D., T.Y. and H.F.; investigation, T.T., A.F., R.I., T.I., T.D., T.Y. and H.F.; writing—original draft preparation, T.T.; writing—review and editing, T.I., A.F., R.I., T.I., T.D., T.Y. and H.F.; visualization, T.T., T.D. and H.F.; supervision, T.T. All authors have read and agreed to the published version of the manuscript.
Funding
This research received no external funding.
Data Availability Statement
The original contributions presented in the study are included in the article, further inquiries can be directed to the corresponding authors.
Conflicts of Interest
Tsuyoshi Ishida and Takashi Danjo were employed by the company OYO Corporation. Hirokazu Fujii was employed by the company LAZOC Inc. The remaining authors declare that the research was conducted in the absence of any commercial or financial relationships that could be construed as a potential conflict of interest.
References
- Li, Q.; Li, Y.; Cheng, Y.; Li, Q.; Wang, F.; Wei, J.; Liu, Y.; Zhang, C.; Song, B.; Yan, C.; et al. Numerical simulation of fracture reorientation during hydraulic fracturing in perforated horizontal well in shale reservoirs. Energy Sources Part A Recovery Util. Environ. Eff. 2018, 40, 1807–1813. [Google Scholar] [CrossRef]
- Cipolla, C.L.; Warpinski, N.R.; Mayerhofer, M.J. Hydraulic Fracture Complexity: Diagnosis, Remediation, and Exploitation. In Proceedings of the SPE Asia Pacific Oil & Gas Conference and Exhibition, Perth, Australia, 20–22 October 2008; p. SPE-115771-MS. [Google Scholar]
- Maxwell, S.C.; Urbancic, T.I.; Steinsberger, N.; Zinno, R. Microseismic Imaging of Hydraulic Fracture Complexity in the Barnett Shale. In Proceedings of the SPE Annual Technical Conference and Exhibition, San Antonio, TX, USA, 29 September–2 October 2002; p. SPE-77440-MS. [Google Scholar]
- Mayerhofer, M.J.; Lolon, E.P.; Warpinski, N.R.; Cipolla, C.L.; Walser, D.; Rightmire, C.M. What is Stimulated Reservoir Volume (SRV)? In Proceedings of the SPE Shale Gas Production Conference, Fort Worth, TX, USA, 16–18 November 2008; p. SPE-119890-MS. [Google Scholar]
- Hubbert, M.K.; Willis, D.G. Mechanics of hydraulic fracturing. Pet. Trans. AIME 1957, 210, 153–168. [Google Scholar] [CrossRef]
- Talebi, S.; Cornet, F.H. Analysis of the microseismicity induced by a fluid injection in a granitic rock mass. Geophys. Res. Lett. 1987, 14, 227–230. [Google Scholar] [CrossRef]
- Maxwell, S.C.; Cipolla, C.L. What does microseismicity tell us about hydraulic fracturing? In Proceedings of the SPE Annual Technical Conference and Exhibition, Denver, CO, USA, 30 October–2 November 2011; p. SPE-146932-MS. [Google Scholar]
- Haimson, B.; Fairhurst, C. Hydraulic fracturing in porous-permeable materials. J. Pet. Technol. 1969, 21, 811–817. [Google Scholar] [CrossRef]
- Cheung, L.S.; Haimson, B.C. Laboratory study of hydraulic fracturing pressure data—How valid is their conventional interpretation? Int. J. Rock Mech. Min. Sci. Geomech. Abstr. 1989, 26, 595–604. [Google Scholar] [CrossRef]
- Guo, F.; Morgenstern, N.R.; Scott, J.D. An experimental investigation into hydraulic fracture propagation—Part 1. Experimental facilities. Int. J. Rock Mech. Min. Sci. Geomech. Abstr. 1993, 30, 177–188. [Google Scholar] [CrossRef]
- Guo, F.; Morgenstern, N.R.; Scott, J.D. An experimental investigation into hydraulic fracture propagation—Part 2. Single well tests. Int. J. Rock Mech. Min. Sci. Geomech. Abstr. 1993, 30, 189–202. [Google Scholar] [CrossRef]
- Guo, F.; Morgenstern, N.R.; Scott, J.D. An experimental study of well communication by hydraulic fracturing. Int. J. Rock Mech. Min. Sci. Geomech. Abstr. 1993, 30, 203–218. [Google Scholar] [CrossRef]
- Morita, N.; Black, A.D.; Fuh, G.F. Borehole breakdown pressure with drilling fluids—1. Empirical results. Int. J. Rock Mech. Min. Sci. Geomech. Abstr. 1996, 33, 39–51. [Google Scholar] [CrossRef]
- Bunger, A.P.; Detournay, E. Experimental validation of the tip asymptotics for a fluid-driven fracture. J. Mech. Phys. Solids 2008, 56, 3101–3115. [Google Scholar] [CrossRef]
- Chen, Y.; Naoi, M.; Akai, T.; Tanaka, H.; Takagi, S.; Ishida, T. Method for Visualizing Fractures Induced by Laboratory-Based Hydraulic Fracturing and Its Application to Shale Samples. Energies 2018, 11, 1976. [Google Scholar] [CrossRef]
- Naoi, M.; Chen, Y.; Yamamoto, K.; Morishige, Y.; Imakita, K.; Energies Tsutumi, N.; Kawakata, H.; Ishida, T.; Tanaka, H.; Arima, Y.; et al. Tensile-dominant fractures observed hydraulic fracturing laboratory experiment using eagle ford shale. Geophys. J. Int. 2020, 222, 769–780. [Google Scholar] [CrossRef]
- Naoi, M.; Chen, Y.; Nishihara, K.; Yamamoto, K.; Yano, S.; Watanabe, S.; Morishige, Y.; Kawakata, H.; Akai, T.; Kurosawa, I.; et al. Monitoring hydraulically-induced fractures in the laboratory using acoustic emissions and the fluorescent method. Int. J. Rock Mech. Min. Sci. 2018, 104, 53–63. [Google Scholar] [CrossRef]
- Ishida, T.; Fujito, W.; Yamashita, H.; Naoi, M.; Fuji, H.; Suzuki, K.; Matsui, H. Crack Expansion and Fracturing Mode of Hydraulic Refracturing from Acoustic Emission Monitoring in a Small-Scale Field Experiment. Rock Mech. Rock Eng. 2019, 52, 543–553. [Google Scholar] [CrossRef]
- Ishida, T.; Desaki, S.; Kishimoto, Y.; Naoi, M.; Fujii, H. Acoustic emission monitoring of hydraulic fracturing using carbon dioxide in a small-scale field experiment. Int. J. Rock Mech. Min. Sci. 2021, 141, 104712. [Google Scholar] [CrossRef]
- JGS3761-2017; Method for Initial Stress Measurement by Hydraulic Fracturing Technique. Japanese Geotechnical Society Standard: Osaka, Japan, 2020.
- Takanami, T.; Kitagawa, G. A new efficient procedure for the estimation of onset times of seismic waves. J. Phys. Earth 1988, 36, 267–290. [Google Scholar] [CrossRef]
Disclaimer/Publisher’s Note: The statements, opinions and data contained in all publications are solely those of the individual author(s) and contributor(s) and not of MDPI and/or the editor(s). MDPI and/or the editor(s) disclaim responsibility for any injury to people or property resulting from any ideas, methods, instructions or products referred to in the content. |
© 2025 by the authors. Licensee MDPI, Basel, Switzerland. This article is an open access article distributed under the terms and conditions of the Creative Commons Attribution (CC BY) license (https://creativecommons.org/licenses/by/4.0/).

