Article

Evidence of High-Shear-Velocity Anomalies Inside the Pacific LLSVP

by
Rafael Abreu
*,
Mariano S. Arnaiz-Rodríguez
and
Chahana Nagesh
Institut de Physique du Globe de Paris, CNRS, Université de Paris, 75005 Paris, France
*
Author to whom correspondence should be addressed.
Geosciences 2025, 15(3), 102; https://doi.org/10.3390/geosciences15030102
Submission received: 27 December 2024 / Revised: 28 February 2025 / Accepted: 10 March 2025 / Published: 14 March 2025
(This article belongs to the Special Issue Seismology of the Dynamic Deep Earth)

Abstract

:
We present the evidence of high-velocity regions within the Pacific Large Low Seismic Velocity Province (LLSVP), uncovered using the Virtual Receiver Approach (VRA), a novel seismic imaging method that allows us to determine local absolute velocity values of a non-reflecting body wave that are independent of any assumed Earth model. Our results reveal a complex dynamics of high- and low-velocity regions within the Pacific LLSVP. While low-shear-wave velocities dominate, consistent with the traditionally understood nature of LLSVPs, we identify distinct high-velocity anomalies—an observation not previously reported in this region. We interpret these anomalies as lateral compositional variations within the LLSVP. Petrological modeling suggests that high-velocity regions are associated with low FeO content, potentially linked to the inclusion of post-perovskite material driven by mantle convection. Alternatively, remnants of subducted oceanic crust (e.g., Mid-Ocean Ridge Basalts) could also explain the observed features. Conversely, low-velocity anomalies correspond to FeO-rich compositions. Our findings highlight the thermochemical heterogeneity of the LLSVP, revealing a more complex internal structure than previously thought. The application of the VRA is able to resolve fine-scale structures that have remained as some of the biggest challenges in global tomographic models.

1. Introduction

Mantle convection is a fundamental process in Earth’s geodynamics. It is strong enough to drive the vigorous plate tectonics shaping the planet’s surface while being slow enough to retain heat trapped in the core [1,2,3]. Understanding its dynamics is still a challenge and a large number of questions remain unanswered. Decades of research have provided a broad understanding of Earth’s lower mantle [4,5,6,7,8,9,10]. This region, spanning from the transition zone (410 km to 670 km) to the core–mantle boundary (CMB) at 2891 km depth, exhibits relatively smooth seismic velocity and density gradients compared to the highly heterogeneous crust [4,8,11], largely due to the stability of magnesium–silicate perovskite under extreme temperature and pressure [6,12,13]. Near the CMB, the propagation of elastic waves becomes more complex, leading to the observed variations in seismic wave velocities, with abrupt increases attributed to a phase transition to the post-perovskite phase and pronounced thermal and chemical heterogeneity in the boundary layer above the CMB, known as the D″ region [14,15,16]. However, much remains to be learned about this deep region of Earth.
Large low-seismic-velocity provinces (LLSVPs) are distinctive structures of the lowermost mantle [8,17,18,19,20,21,22,23] that span thousands of kilometers laterally and possibly extend up to 1000 km vertically from the CMB [24]. They are characterized by reduction in S-wave and P-wave velocities and sharp edges [20,25,26,27,28], corresponding to the base of deep mantle plumes [21,29,30,31]
Furthermore, LLSVPs may contain ultra-low-velocity zones (ULVZs), characterized by extreme reductions in seismic velocities (up to −30% for S-waves and −10% for P-waves) and likely increases in density [32,33,34,35,36,37]. These ULVZs lie near the CMB with variable shapes, widths, and distributions [22,38,39,40,41,42]. They are challenging to detect and characterize through global tomographic studies [18,43,44,45].
Currently, the structure, origin, and convective nature of the LLSVPs and ULVZs are still a matter of debate. Different possible origins have been proposed: (i) compositional in nature [18,46]; (ii) thermochemical [47,48]; and (iii) lithospheric subducted material [49,50]. LLSVPs seem to be compositionally subdivided into two domains: a primordial bottom domain near the core–mantle boundary (serving as an isolated reservoir with distinctive isotopic compositions [29], and a basaltic shallow (perhaps thermally buoyant; [51,52]) domain that extends from 1100 to 2300 km depth [53]. ULVZs may be part of internal convection mechanisms within the larger velocity anomalies [22,54]. In any case, it is clear that, to properly understand the convection system of the lower mantle, it is important to comprehend the origin, composition, physical properties, and role that LLSVPs and ULVZs play. To achieve this, it is of primary importance to illuminate and image the structures in Earth’s lower mantle.
One of the most powerful tools for imaging Earth’s interior is seismic tomography. Emerging in the 1970s, this method revolutionized our understanding of the 3D distribution of physical properties affecting seismic wave propagation, such as elasticity, anelasticity, anisotropy, and density. Seminal studies by [4,55,56] laid the foundation for this field. While Aki and colleagues focused on regional-scale structures, Dziewonski and his team produced the first images of the lower mantle, revealing early on the existence of the two LLSVPs (originally referred to as “superplumes”). Since then, tomographic models have often played a critical role in the analysis of the subsurface, aiding in the estimation of lithology, temperature, and fluid content while providing a snapshot of present-day mantle dynamics. Seismic tomography usually presents results in terms of velocity anomalies that are conditioned on the initial model used, parametrization of the studied space, inverse method used, and seismological theory employed (ray theory, finite frequency, or full waveform). The interpretation of seismic velocity anomalies can be misleading. For example, high-shear-velocity regions, like shields, can appear as cold and sinking but are actually chemically buoyant. Stronger S-wave velocity reductions in the deep mantle may suggest chemical differences, melt, or high temperatures. This is why it becomes important to try to estimate the lower mantle’s absolute velocity values.
In this study, we present a new method, the Virtual Receiver Approach (VRA), that allows us to sample the velocity field at depth from teleseismic travel time data recorded at neighboring stations. We will show that our VRA is replicable, efficient, accurate, robust, and easy to implement. We begin by laying the fundamentals of our approach and validating it. We proceed to test it to probe the lower mantle beneath the Pacific Ocean, aiming to estimate the absolute shear wave velocity of the Pacific LLSVPs. Finally, we attempt to interpret these results in terms of compositional anomalies and temperature conditions.

2. Methodology: The Virtual Receiver Approach (VRA)

We introduce an imaging methodology that we call Virtual Receiver Approach based on the concept of the slowness vector u defined as follows [57]
u = 1 v app = sin ( i ) v 0 ,
where v app is the apparent velocity, i is the angle of incidence of the ray, and v 0 is the velocity of the medium (see Figure 1a).
The slowness u (Equation (1)) is constant along the ray path and it is equal to the inverse of the medium velocity v 0 when sin ( i ) = 1 , i.e., when the wave does not reflect at an interface and travels horizontally ( i d = 90 ) , at the deepest point of the ray (see Figure 1a). Therefore, the velocity of the medium at the deepest point of the ray v d is equal to the inverse of the slowness v d = 1 / u [57,58].
If we consider a 1D isotropic layered medium, the slowness u in Equation (1) can be approximated as follows [59,60]
u ( x 0 ) t 2 t 1 d 2 d 1 = Δ t Δ d ,
where t 1 , t 2 are the arrival times of the wave of interest at two stations 1 and 2 located at positions x 1 , x 2 , respectively, and with epicentral distances d 1 , d 2 .
Equation (2) can be understood in three (fundamental) different ways depending on the interpretation of the location x 0 : If one assumes that x 0 = x 1 and/or x 0 = x 2 , then Equation (2) becomes a first-order, forward and backward, finite-difference approximation of the slowness u, respectively, as follows
u ( x 0 = x 1 ) = t 2 t 1 d 2 d 1 + O Δ d forward approximation , u ( x 0 = x 2 ) = t 1 t 2 d 2 d 1 + O Δ d backward approximation .
Note that we have assumed that d 2 > d 1 . In contrast, if one assumes that x 0 is the middle point between x 1 and x 2 , then Equation (2) becomes a second-order centered finite difference approximation of the slowness u, as follows
u ( x 0 = ( x 1 + x 2 ) / 2 ) = t 2 t 1 Δ d + O Δ d 2 centered approximation ,
which means that the slowness evaluated at the center point x 0 between x 1 , x 2 can be approximated (up to second-order accuracy) by dividing the arrival travel time of the wave of interest and the difference between epicentral distance of the stations (see Figure 1b,c).
Equation (4) brings a different physical interpretation since in fact, we are not measuring travel times at the center of the two stations. We, however, are computing a second-order approximation to a slowness value located at the virtual receiver located at the mid point between the two stations.
If we consider the calculation of the slowness in a spherical Earth, we can write the velocity of the medium at the deepest point of the ray v d as follows [57]
v d = 1 u r d r earth
where r earth is the radius of the Earth, and r d is the radius r of the turning (deepest) point of the (non-bouncing) ray.

3. Validation

3.1. Theory

We validate the accuracy of Equation (4), for which we will assume, like in the rest of the paper, that x 0 is the middle location between x 1 and x 2 . We assume that the observed slowness ( u observed ) can be written as the predicted slowness using certain Earth model ( u model ) plus a slowness perturbation/deviation ( δ u ) as follows
u observed ( x 0 ) = u model ( x 0 ) + δ u , u model ( x 0 ) + Δ t 2 Δ t 1 Δ d , Δ t observed Δ d ,
where we have used the notation ( Δ t 1 , Δ t 2 ) = Δ t 1 , 2 and with Δ t 1 , 2 = t 1 , 2 observed t 1 , 2 model .
Note that the slowness variation δ u is simply given by the difference time anomalies Δ t 1 , Δ t 2 measured at the two stations and divided by Δ d , that is,
δ u = Δ t 2 Δ t 1 Δ d .
Equation (7) means that any error in the slowness calculations will arise from travel time measurements only. If we assume a linear dependence between the model and observations we can write observed travel times ( t 1 , 2 observed ) as follows
t 1 , 2 observed = ( 1 + α 1 , 2 ) t 1 , 2 model , with α 1 , 2 R ,
where α 1 , 2 are non-dimensional real parameters. Equation (8) implies that both rays should see the same (anomalous) structure (see Figure 1c; otherwise, we will not be able to correctly image a structure). This means that the non-dimensional parameters ( α 1 , 2 ) should be the same at both receivers, i.e., α 1 = α 2 = α . We thus can write Equation (6) as follows
u observed ( x 0 ) Δ t observed Δ d = t 2 model t 1 model Δ d 1 + α .
In practice, however, α 1 α 2 and therefore we must allow some error ( ϵ ) , i.e.,
| α 1 α 2 | < ϵ , with ϵ R + .

3.2. Numerical Results

For travel time and slowness calculations we use the TauP toolkit [61] implemented in Obspy [62].
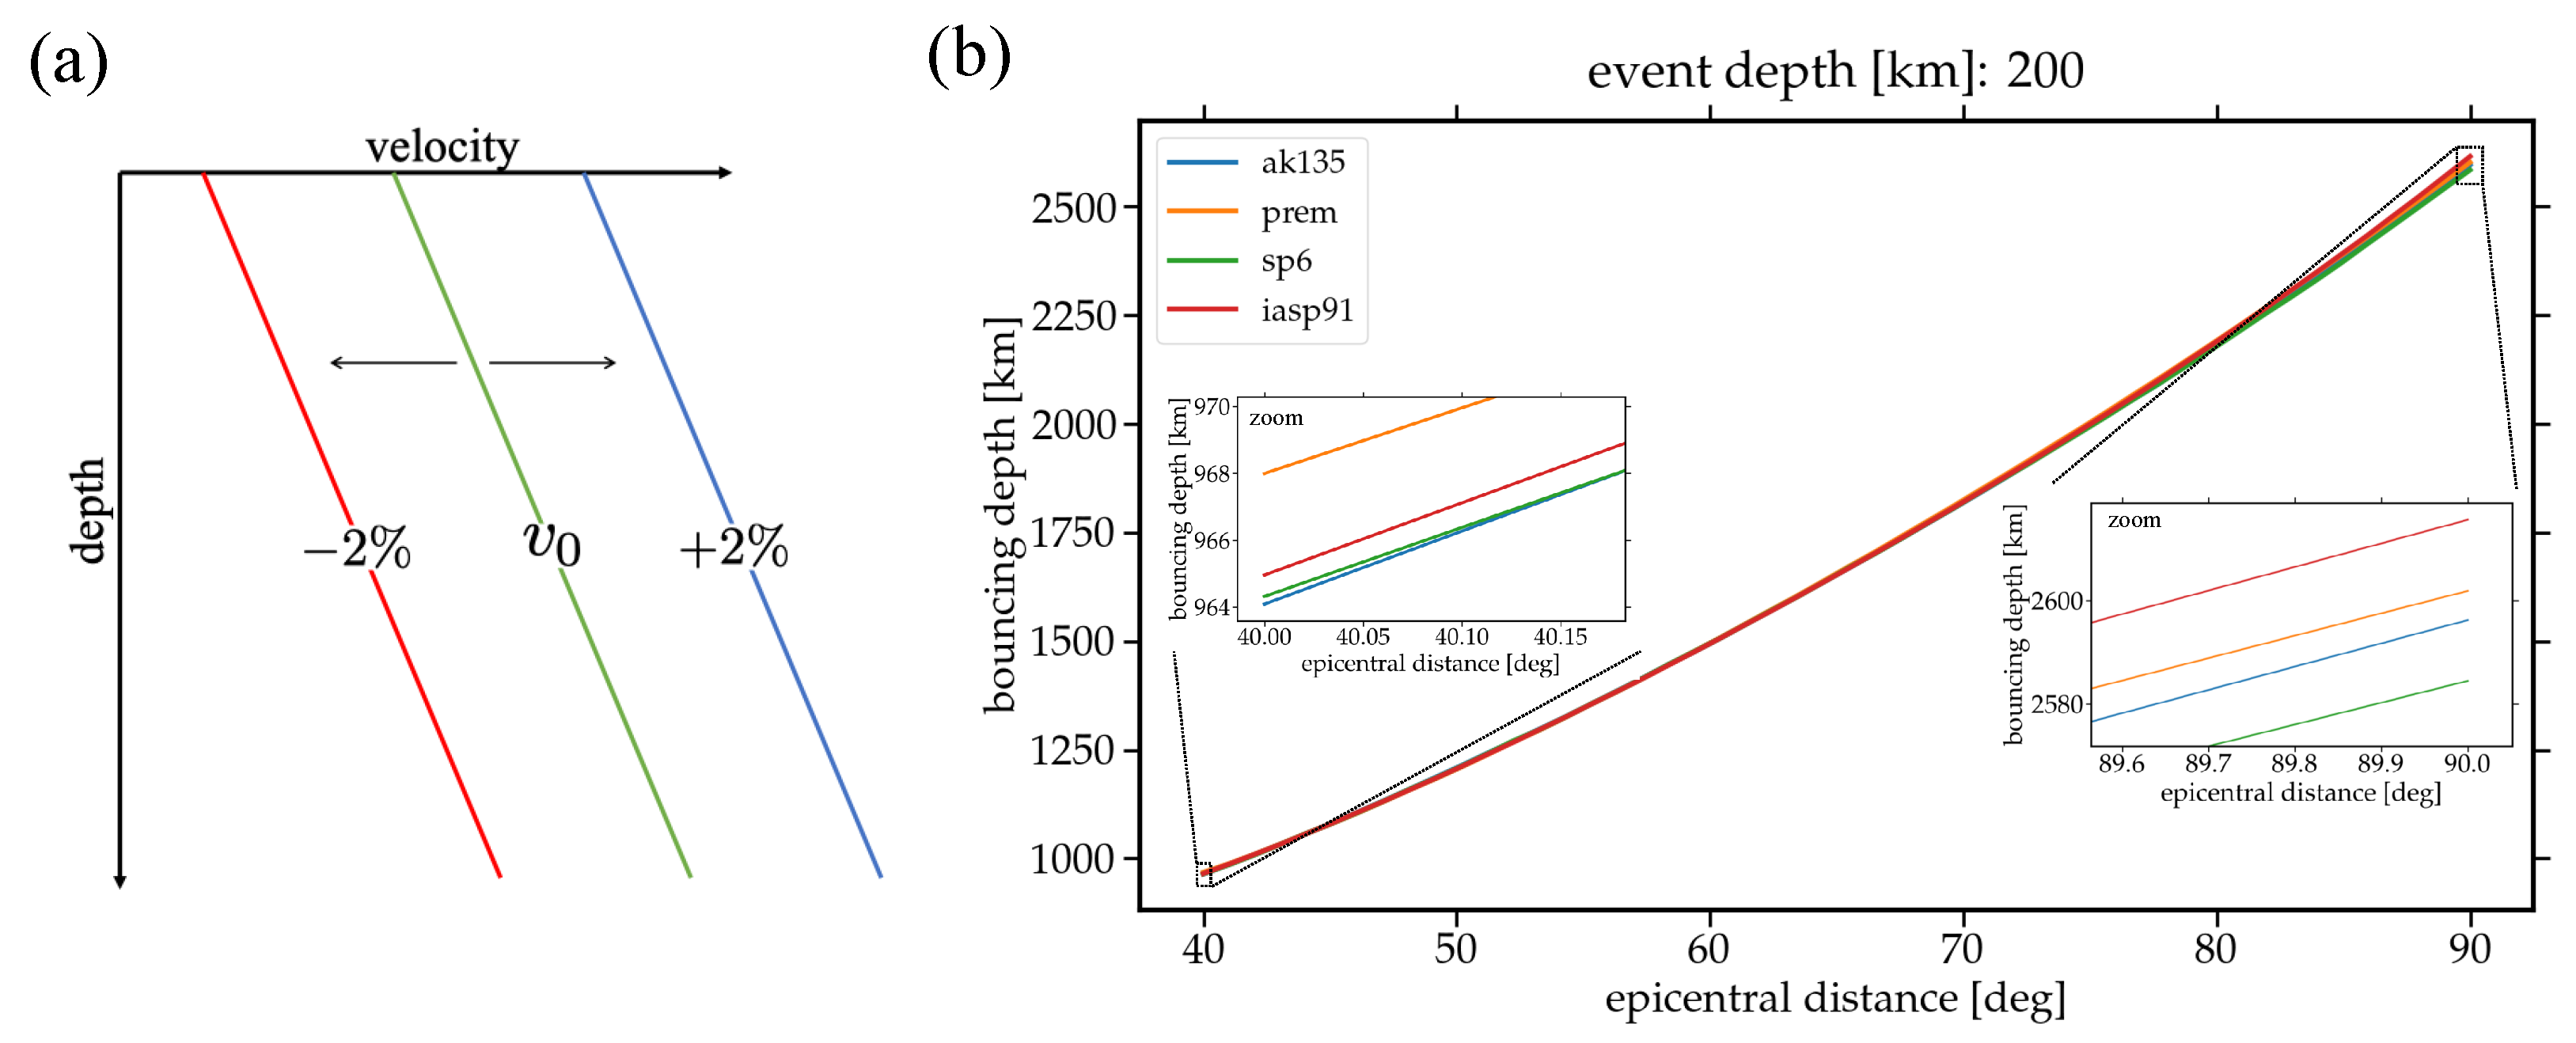
What does a velocity perturbation of X% mean? The slowness approximation given by Equation (4) suggests that we are able to directly measure the slowness of a body wave that does not reflect at any interface, and that value corresponds to the medium velocity at the lowest/turning point of the ray. This velocity value is independent of any tomographic model; however, we do need to assume a certain Earth model in order to locate the lowest/turning point of the ray. We can next compare the velocity prediction using the VRA against any other Earth model. At this point, the interpretation can become confusing. Let us take the following example: assuming PREM as the Earth model and using the VRA, we find that the shear velocity perturbation is about ∼ 7 % at 2660 km depth. This does not mean that the model that reproduces our observations is a PREM model with an ultra-low-velocity zone. What this means is that the model that best reproduces our observations is a PREM model with a ∼ 7 % of velocity perturbation in its total. In simpler words, any relative velocity perturbation that we find using the VRA refers to a perturbation of the assumed model in its total (see Figure 2a) for an illustration).
Depth predictions: Absolute velocity predictions obtained using Equation (4) are independent of the Earth model assumed. However, to locate/assign the deepest point of the ray (bounding location), we need to assume an Earth model. Different 1D tomographic models can be used for this purpose. To develop intuition on the different depths obtained, we assume a 200 km deep event and four different Earth reference models: PREM [63], AK135 [64], SP6 [65] and IASP91 [66]. In general terms, PREM gives a broad view of Earth’s structure, while AK135 and IASP91 provide accurate travel time predictions for global phases (critical for understanding mantle-scale processes) and SP6 has a more refined shear wave velocity structure essential for studying LLSVP dynamics. Different bouncing points for S waves are presented in Figure 2b, where we can observe that at short distances ( 40 ) the maximum differences between the depth predictions is ∼4 km, and at larger distances ( 90 ) the maximum differences between the depth predictions is ∼30 km.
For the rest of the calculations, we assume the Earth model PREM [63]. Assuming any other Earth model will lead to the same analysis presented next.
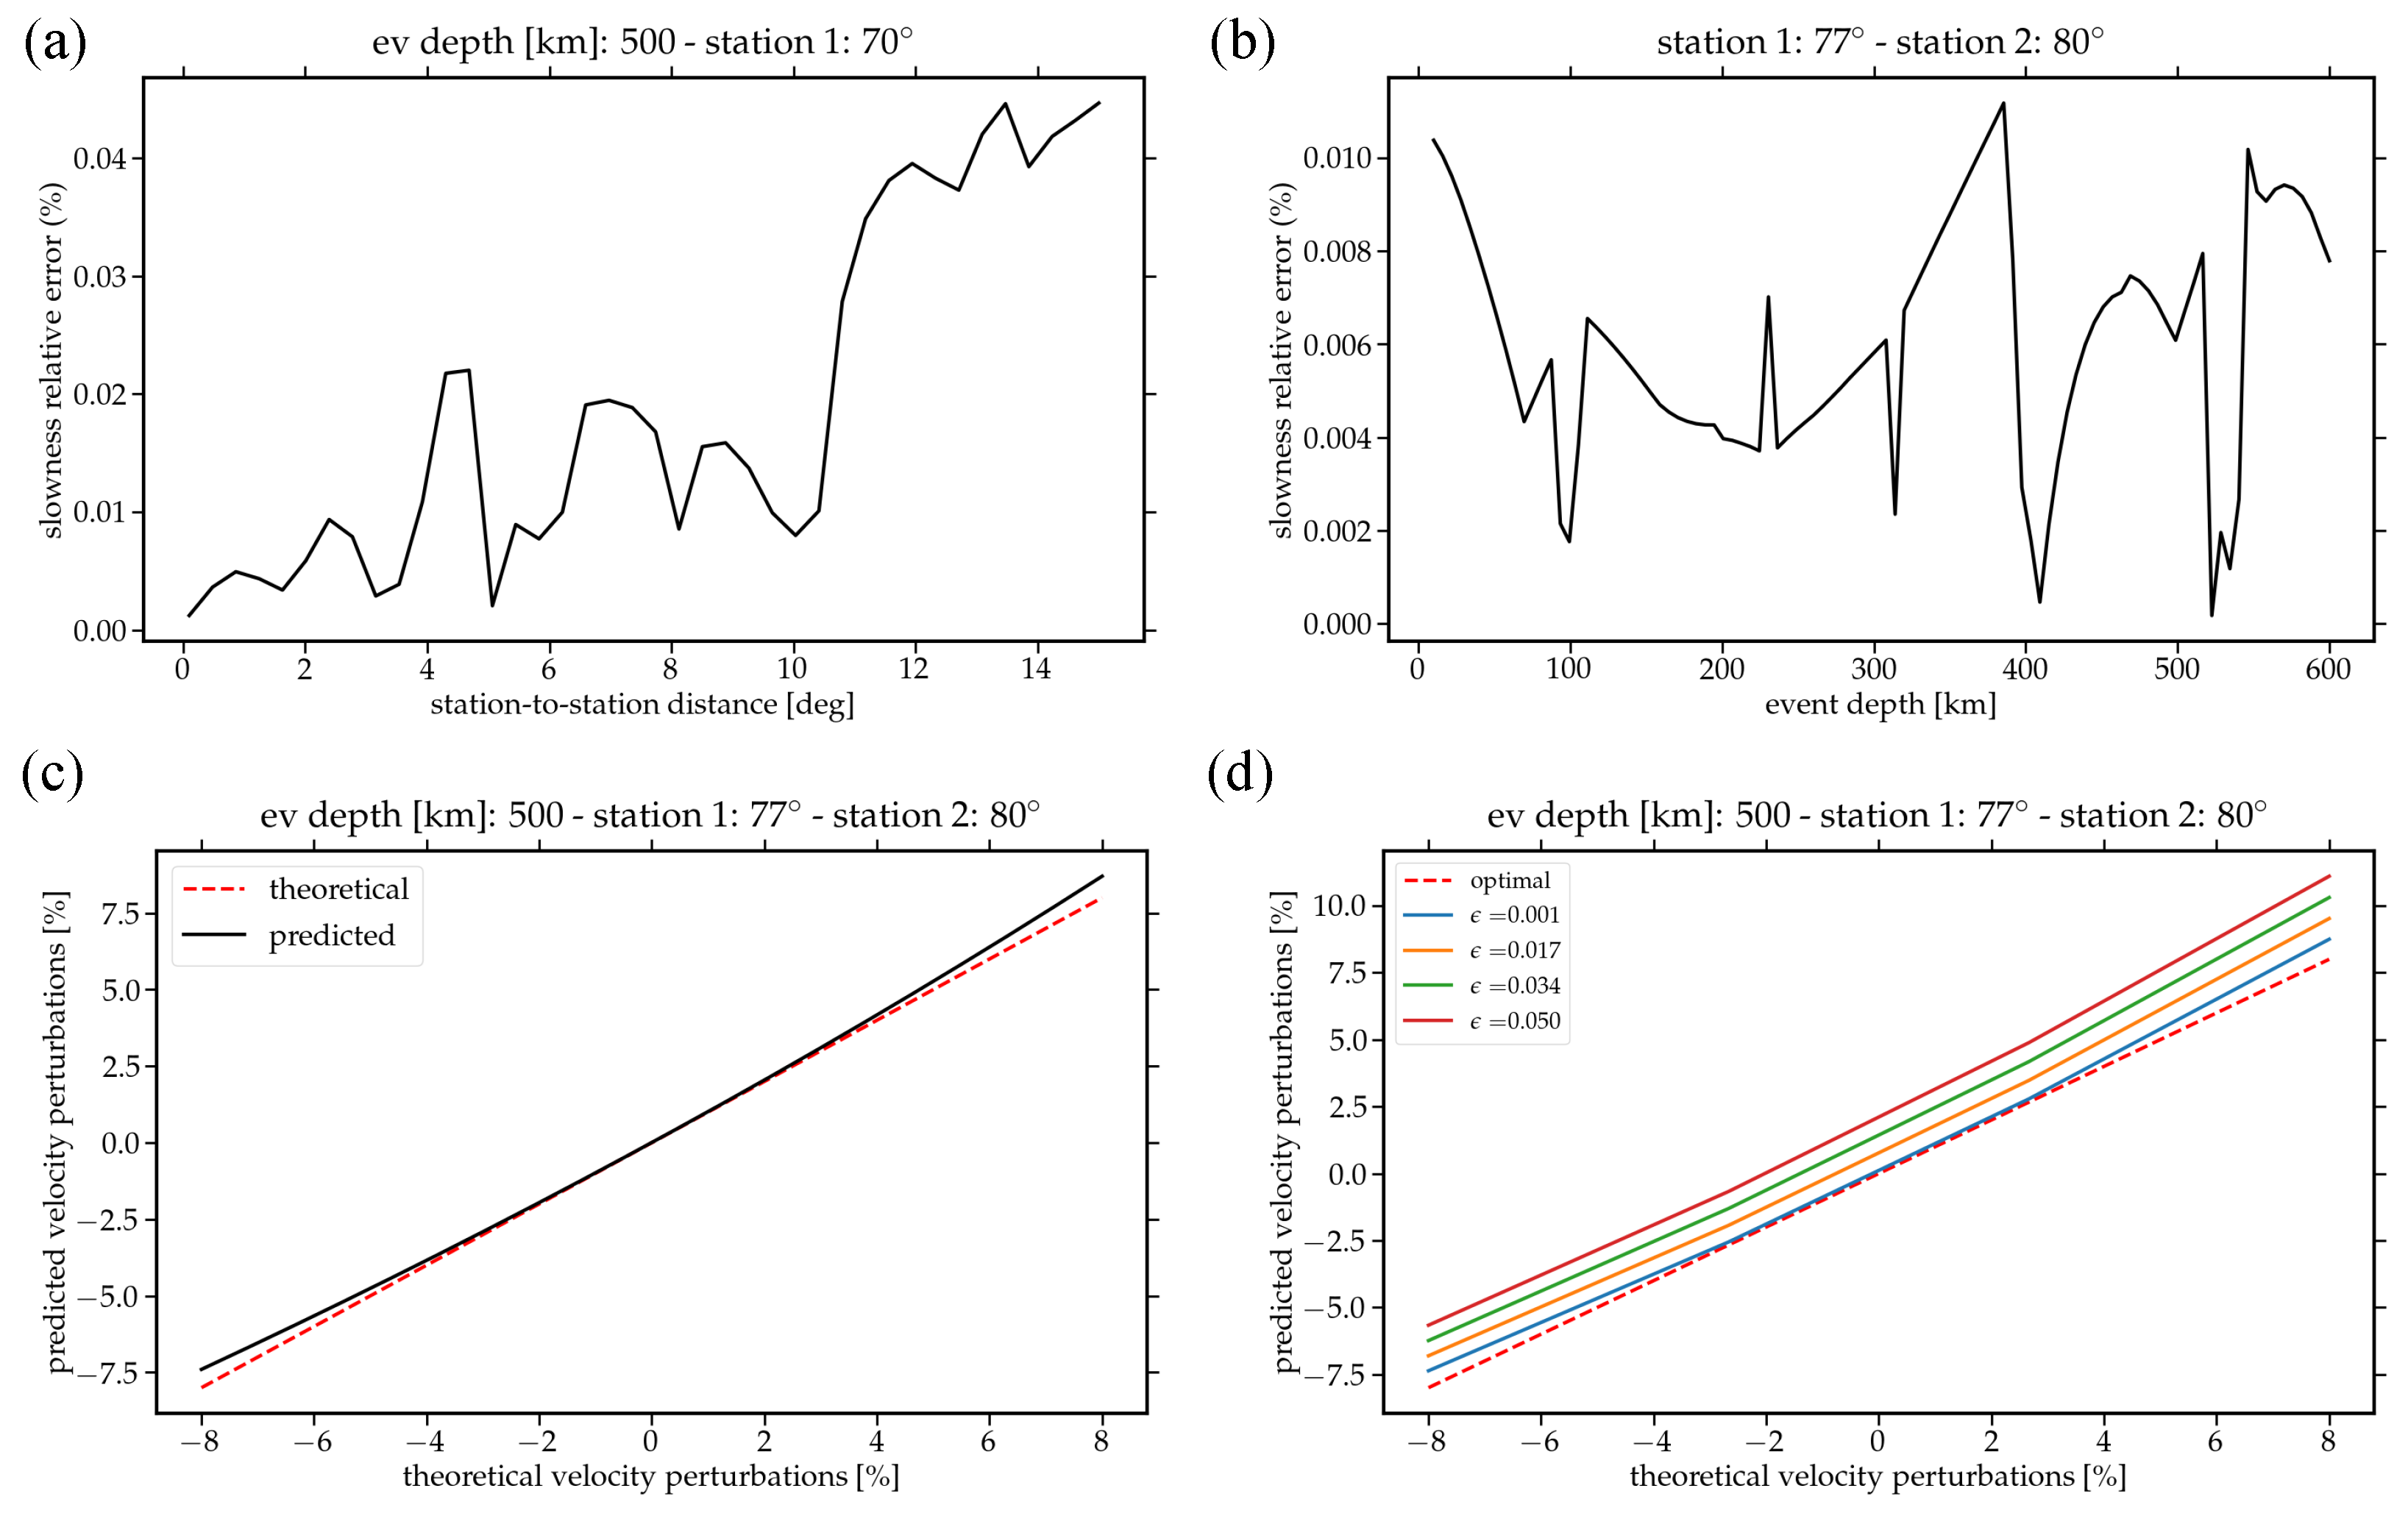
The sensitivity to station-to-station distance: To evaluate the influence of station-to-station distance in slowness calculations using Equation (4), we first assume an event at 500 km depth and a first station located at 70 epicentral distance. We next vary the epicentral distance of the second station in the range 0 . 001 , 15 . Results are presented in Figure 3a, where we can observe that the relative error (in terms of slowness) is smaller than 0.04% for station-to-station distance smaller than twelve degrees. These are unexpected results since at distances larger than two degrees one can, intuitively, expect the approximation to break down. When considering other models, typical errors occur in the range of ∼(0.3–1)% depending on the parameter being modeled (e.g., travel times, shear wave velocities). Therefore, the VRA method maintains high accuracy even for large inter-station distances, where one might expect the approximation to break down. This precision ensures that the described method is robust enough to resolve the fine-scale of the lower mantle structure.
The sensitivity to the event depth: Having validated the sensitivity to station-to-station distance, we now evaluate the sensitivity to the event depth. We select two stations at 77 and 80, i.e., separated by three degrees. We select three degrees as the largest distance that one can intuitively apply, Equation (4). Results are presented in Figure 3b, where we can observe that the relative errors are always smaller than 0.0001. It thus seems that the approximation made in Equation (4) is also insensitive to the event depth.
The sensitivity to velocity perturbations: We can evaluate a velocity perturbation as seen by the slowness by simply adding travel time perturbations to Equation (9) using a single α parameter. This means that we are assuming that both recorded travel times ( t 1 , t 2 ) see exactly the same anomaly perturbation. Results are presented in Figure 3c, where we can observe that predictions are accurate up to ∼ ± 3 % . This result is consistent and expected due to limitations of the approximations made by ray theory. We thus cannot expect to realistically obtain/interpret velocity perturbations larger than ∼ ± 3 % .
The sensitivity to ϵ (Equation (10)): In realistic scenarios, when evaluating Equation (10), we should expect that α 1 α 2 . These parameters give information about the heterogeneities that both rays are crossing: If α 1 = α 2 = α , then it is guaranteed that both rays see the same structure. In realistic scenarios, in contrast, we must allow some error ϵ (see Equation (10)). In simpler words, this means that if we, for example, observe a 2 % velocity perturbation with respect to PREM in station A, then we should observe the same 2 % velocity perturbation in station B (see Equation (8)). However, what happens if we observe 2 % in station A and 1.9 % in station B?, i.e., what happens if the magnitude of the difference in percentages ϵ (Equation (10)) is ϵ = 0.1 % ?
To answer these questions, we next evaluate the magnitude of the error ϵ in Equation (10) for different velocity perturbations. Results are presented in Figure 3d, where we can observe that predictions are highly sensitive to small perturbations of ϵ . These results suggest that in order to have consistent predictions δ v ± 3 % , we should set ϵ 0.001 % .

4. Application to Seismological Observations

4.1. Data Set

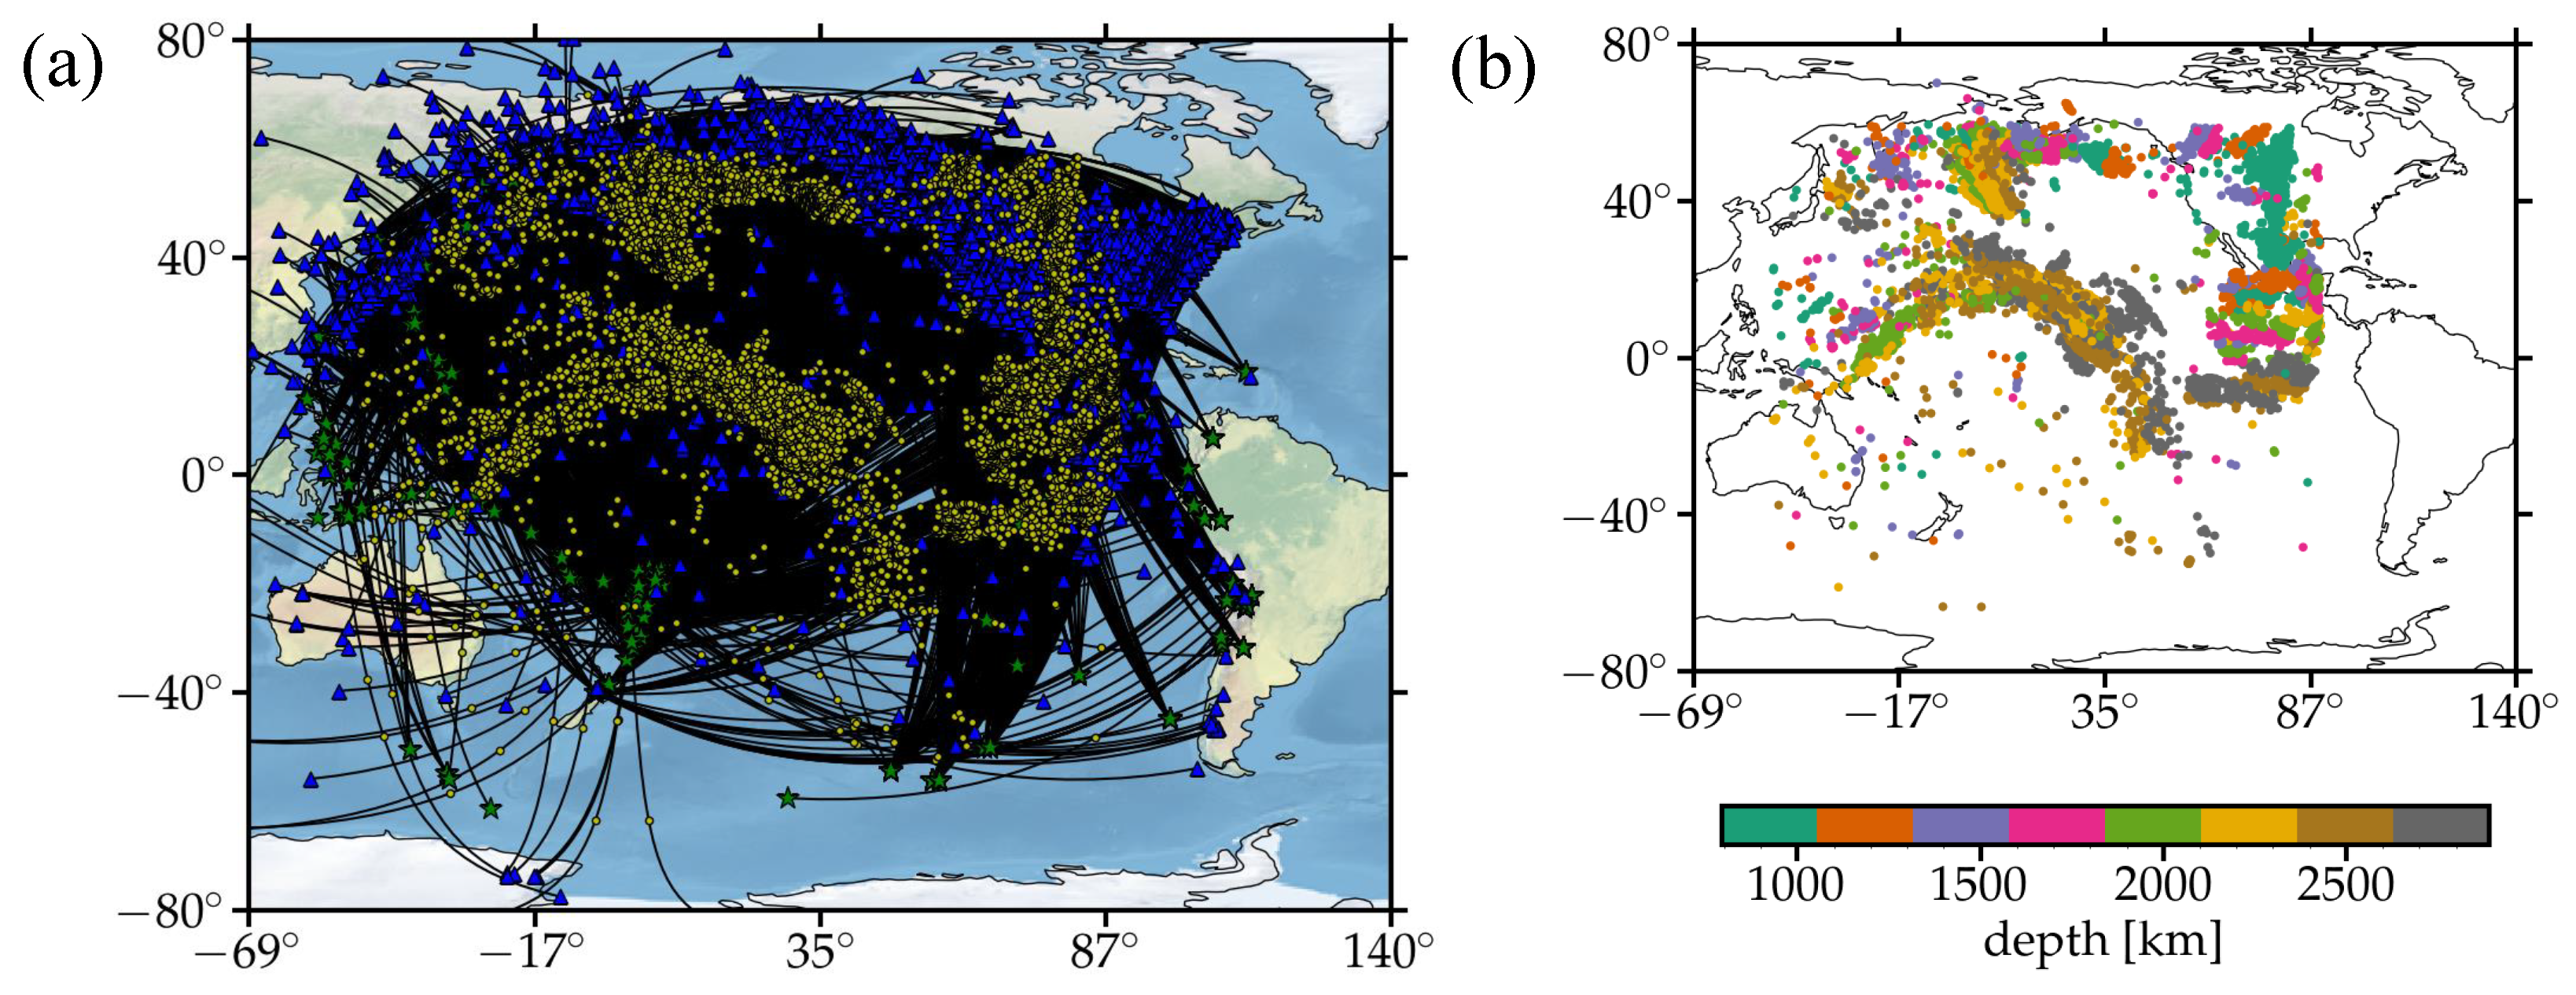
We use the travel time database provided by [67], which provides travel times of transversely polarized SH waves on a global scale obtained from an adaptive empirical wavelet-construction technique. We, however, focus on events for which the deepest point of the S wave is located in the circum-Pacific region. Figure 4a shows the ray paths that sample the area of interest.
From the selected sub-dataset we apply the virtual receiver methodology previously presented.
Errors: We allow a maximum distance between stations of ∼1.5 degree ( 160 km), and an error ϵ < 0.00005 (see Equation (10)) which guarantees that the velocity anomalies that both stations see have the same magnitude (which we interpret as the same structure). Travel time measurement errors from [67] do not significantly affect our results, since travel time errors are around ∼1 s. To gain some intuition on how an error of ± 1 s affects our results, consider an event of 500 km depth and recorded at a distance of 78. The predicted S travel time obtained using the Obspy TauP toolkit [61,62] and assuming PREM as the background Earth model is 1217.8 s. Thus, an error of ± 1 s represents approximately ± 0.08 % of the final slowness/velocity prediction (see Equation (9)).

4.2. Results

We obtained a total of 14,686 local velocity measurements, spanning depths from 792.6 km to 2888.8 km, sampling the entire lower mantle from top to bottom (see Figure 4b). We emphasize that the spatial distribution of the results depends on the locations of the events and stations. The results obtained are not intended to produce an image but rather to sample the data points directly, which we chose not to interpolate. While transforming these points into an image might seem useful, doing so would compromise the integrity of the discrete data. Hence, we refer to the map view at different locations.
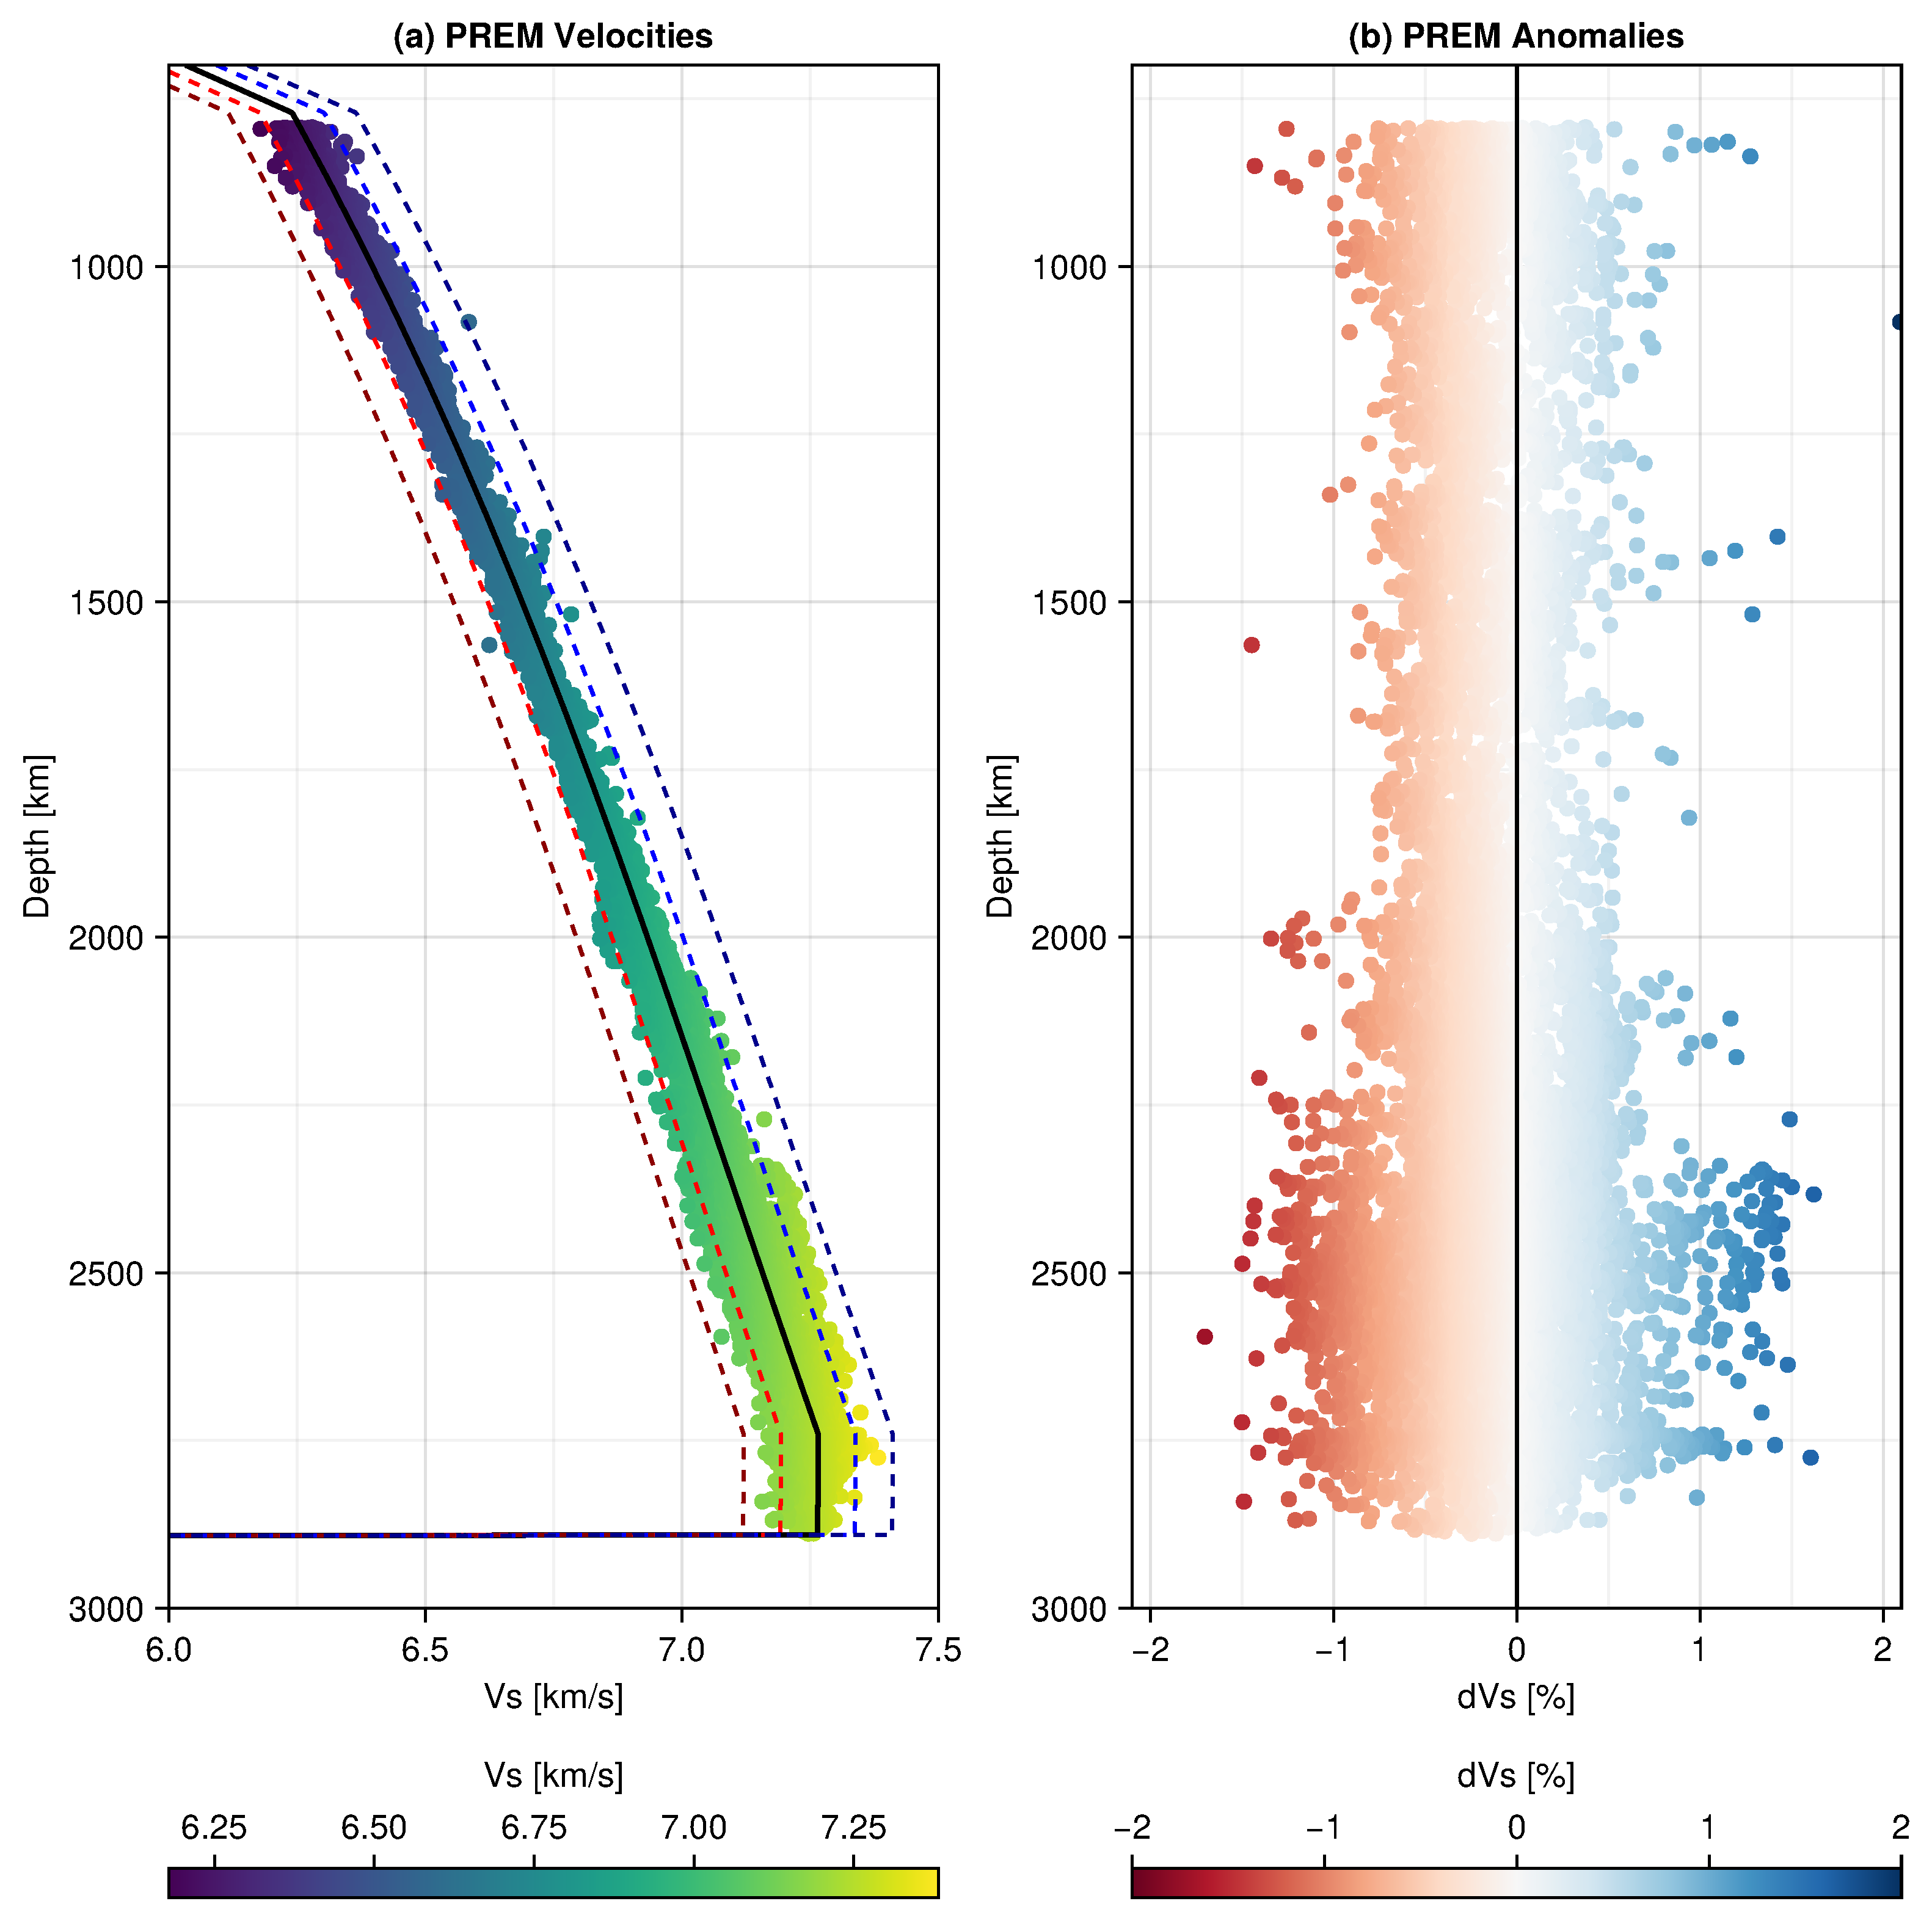
Statistics: The shear wave velocity values were in an estimated range of from 6.178 km/s to 7.382 km/s with a mean value of 6.951 km/s and a median of 7.052 km/s (see Figure 5).The distribution is slightly skewed to the left (skewness = −1.018) and exhibits a kurtosis of −0.121, indicating a relatively flat distribution. Overall, these align well with the velocity gradients predicted by PREM [63], as shown in Figure 5.
We next normalize all velocity values obtained with respect to PREM. As a result, most of our sampled points exhibit velocity anomalies between −1.70% and +1.62% with a mean anomaly of −0.16%, a median of −0.19%, and a standard deviation of 0.42% (see Figure 5). The distribution is slightly skewed to the right (skewness = 0.449) and has a kurtosis of 1.016, indicating a relatively normal but slightly peaked distribution.
Larger anomalies (>|1%|) are predominantly found below 2250 km depth. Out of our dataset, 7693 sample points lie between this depth and the CMB, with anomalies ranging from −1.702% to 1.621%. The mean and median values for this range are −0.187% and −0.197%, respectively, again highlighting the prevalence of negative anomalies in the dataset and, consequently, in the lower mantle beneath the Pacific Ocean, which is largely related to the Pacific LLSVP [8,68,69]. At this depth range, 2233 sampling points show positive anomalies, while 5460 exhibit negative ones. Positive anomalies, which are a statistical minority in the dataset (2233 out of 7693 points), stand out within the predominantly well-known negative anomaly environment of the LLSVP. The negative anomalies exhibit a mean value of −0.388% and a median value of −0.339%, indicating that the data are clustered around the central tendency, a behavior characteristic of a normal or near-Gaussian distribution. This statistical stability reflects the dominance of low-velocity anomalies within the LLSVP. In contrast, the positive anomalies deviate from this pattern, with a mean of 0.306% and a median of 0.213%, showing a noticeable gap between them. This suggests a more skewed distribution or irregular behavior.
Comparisons against tomographic models: We next compare velocity predictions against two different tomographic models built with different techniques and datasets: (i) SEMUCB-WM1 [45], built with full-waveform inversion techniques, and (ii) SEISGLOB2 [70], built using ray theory and normal modes.
We analyze three different depths: 2600 km, 2700 km and 2800 km. For each depth, we gather our predictions within a depth range of 100 km. This means, for example, that we compare the tomographic image at 2600 km against our observations that lay between 2550–2650 km depth range. This depth range seems good enough to cover the depth uncertainty of our predictions close to the CMB (see Figure 2b). Results are presented in Figure 6, where we can observe three main features: (i) the Galapagos plume, (ii) the LLSVP boundary and (iii) high-velocity anomalies inside the LLSVP.
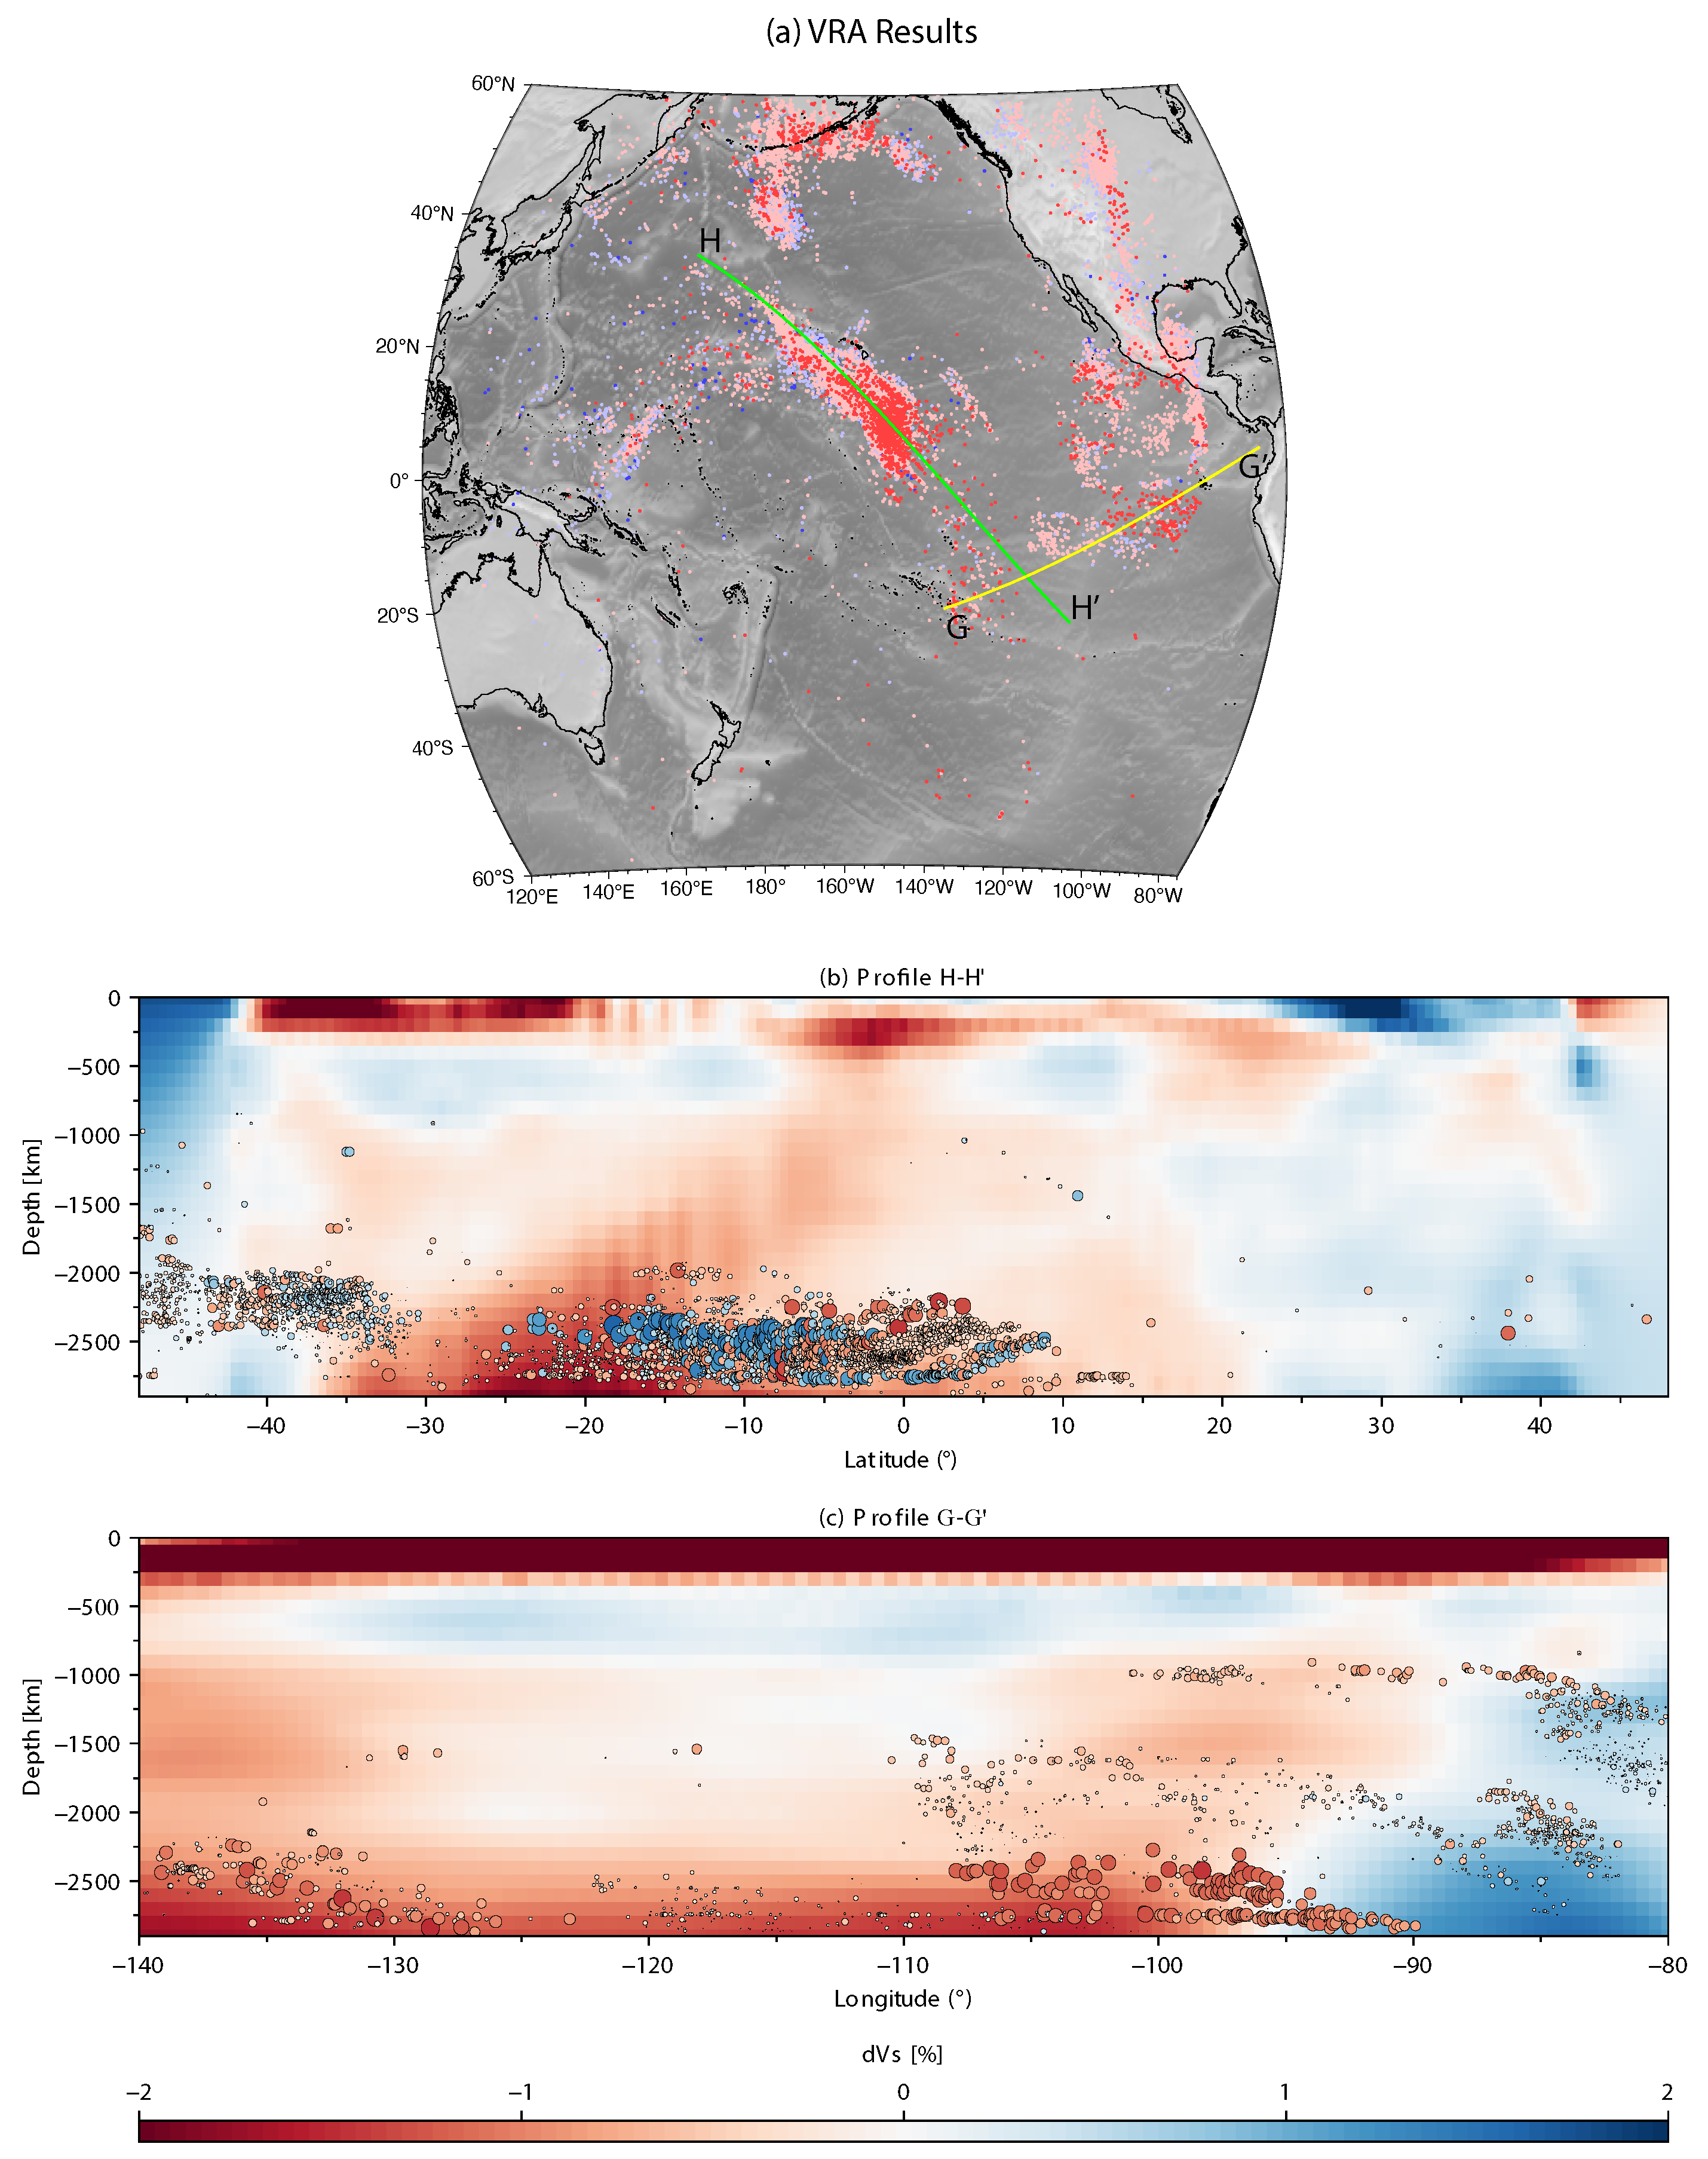
We further project the data close to the Hawaiian and Galapagos archipelagos into two profiles: profile H-H′ and profile G-G′, respectively (see Figure 7). The VRA samples in a 10° corridor are projected into each profile and we plot them on top of an average tomography model (see Figure 7a,b). Six S wave tomography models, downloaded from the SubMachine database [71], are averaged [45,72,73,74,75,76]. These are selected as the present good resolving power around the target profile. In the profiles, the signature low-velocity anomalies of the Pacific LLSVP/Hawaiian plume (see Figure 7a) and the Galapagos plume (see Figure 7b) are clearly imaged by tomographic techniques. The location of the low-velocity VRA samples clearly correlates with both structures. High-velocity points in the H-H′ profile are fairly abundant and clustered, while they tend to be sparser and less in number in the G-G′ profile.

5. Discussion

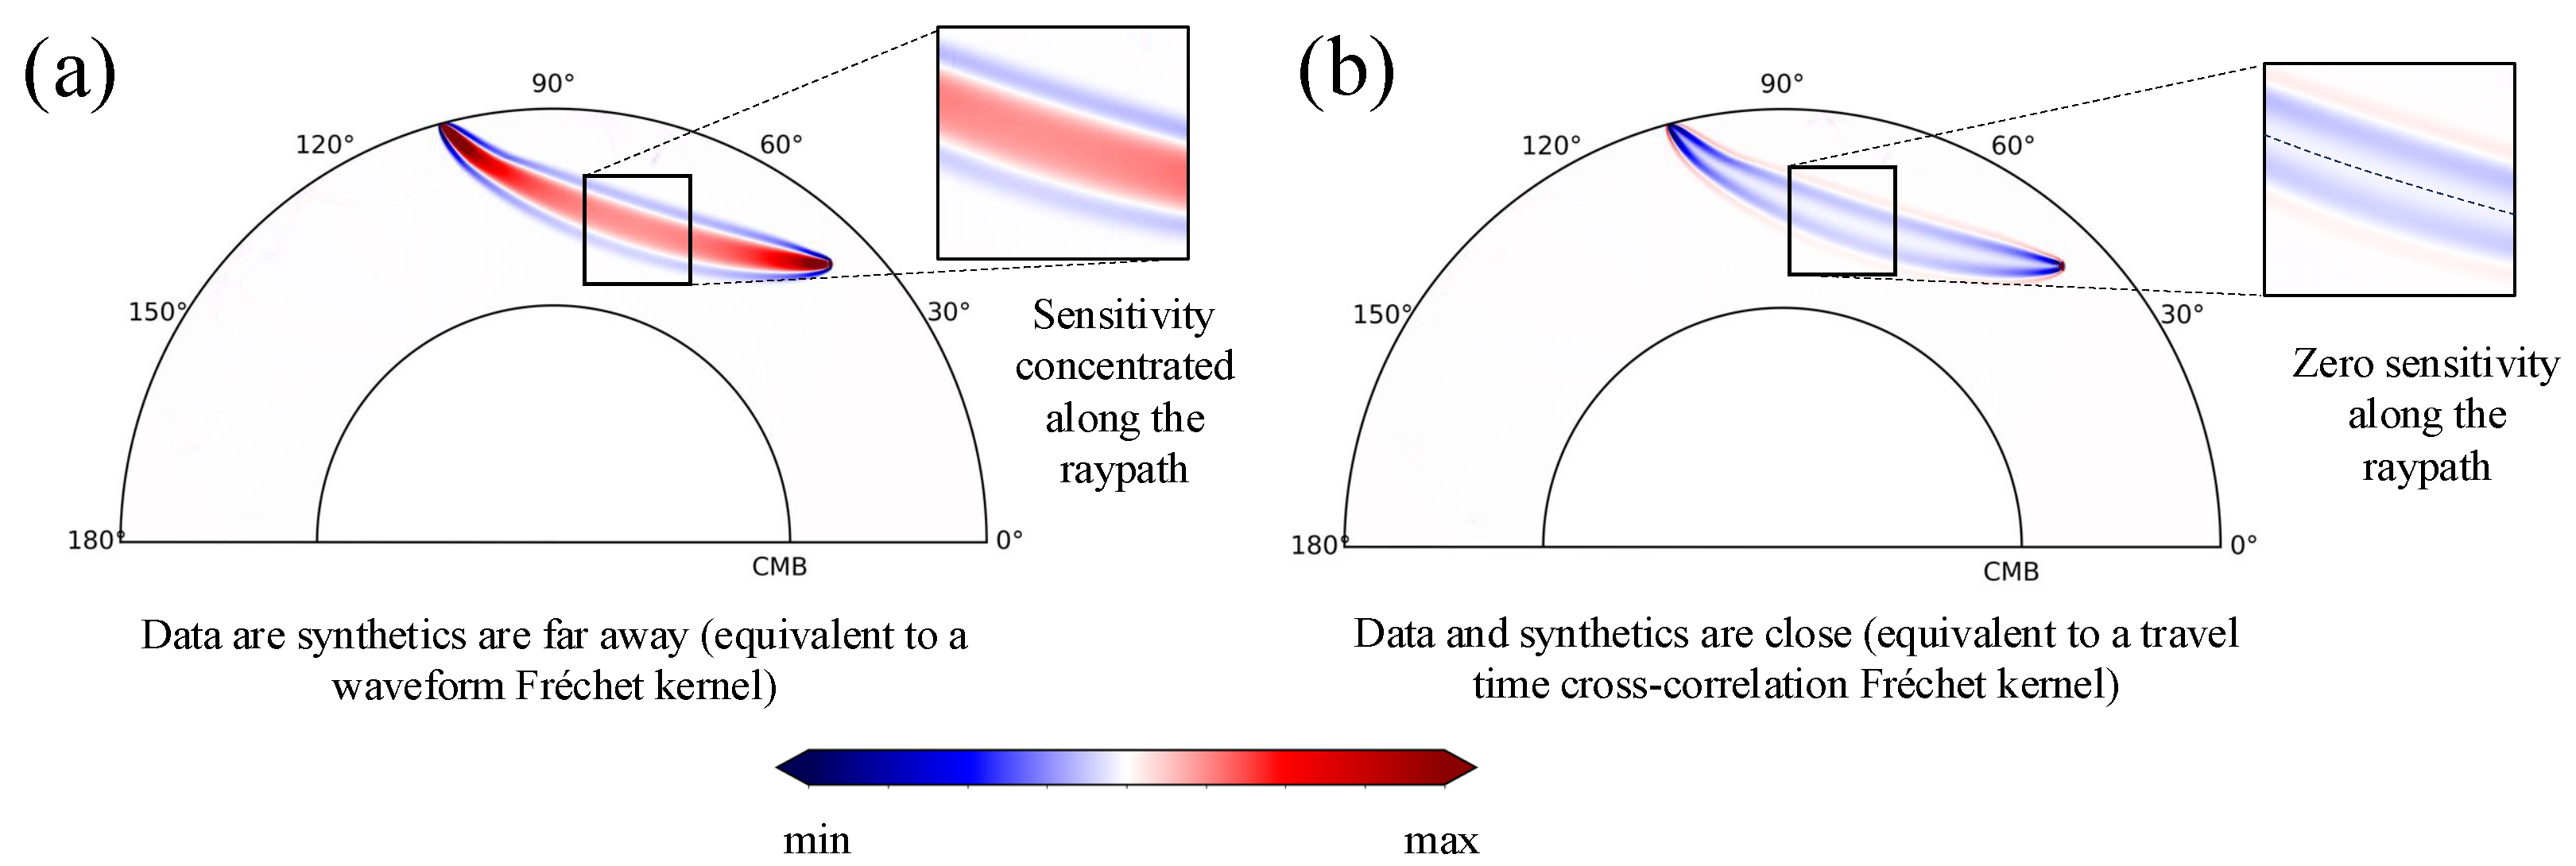
Do we (really) have travel time sensitivity at the deepest point of the ray? We have proposed the VRA as a simple method for imaging the internal structure of the Earth. The method relies on the ray theoretical predictions that state that the slowness computed at the surface is equivalent to the inverse of the velocity of the medium at the turning point of the ray (for rays that do not bounce at any discontinuity). There can exist, however, a misunderstanding related to the zero sensitivity along the ray that banana doughnut sensitivity kernels show, also known as the banana doughnut paradox [77,78,79,80,81,82].
If one closely follows the fact that cross-correlation travel time sensitivity (Fréchet) kernels show a zero sensitivity along the ray path [77], one remains with serious confusion on how to properly infer the structure of the Earth with certainty at a location where the (travel time) measurement has no sensitivity whatsoever. In principle, if this is correct, then the proposed VRA is rather useless.
Fortunately, this is not the case. While it is true that cross-correlation travel time sensitivity kernels show zero sensitivity along the ray path, this is only because the travel time was measured with cross-correlation. It has been shown by [83] that when we use a different methodology to measure travel times, the sensitivity to the measurement changes. In particular, when we choose to measure travel times using envelopes, we obtain the maximum sensitivity along the ray path as one naturally will expect (see Figure 8a). It is only when data and synthetics are close enough that we obtain a zero sensitivity along the ray path (see Figure 8b). We can understand this from an inversion perspective: when the assumed earth model significantly differs from the real earth, the maximum sensitivity to travel time should be concentrated along the ray path, as one would naturally expect. In contrast, when the assumed Earth model closely matches the real Earth, the ray path exhibits zero sensitivity, since the structural information is already well-resolved.
We do understand that this is an interpretation. However, it has been theoretically proven by [83] that travel time measurements (using envelopes) have sensitivity along the ray path. The important implications of this are related to how we should (physically) interpret the sensitivity of travel time measurements. Independently of the technique used by [67] to measure travel times, the physical implications are that travel times do have sensitivity along the ray path (as we should expect) and, specially, at the turning point of the ray. As a consequence, we validate the sensitivity of the proposed VRA to image the structure of the Earth.
We can further understand the situation in simpler words. Let us assume that the research group A measures a cross-correlation travel time difference of X seconds for a body wave of a certain event and a certain station location. Another research group B measures an envelope travel time difference of (X-0.1) seconds for the same event at the same location and for the same wave. Does this mean that research group A cannot see the sensitivity along the ray path and research group B can? This statement is absurd, and if it were true, Earth models built with ray theory should be completely wrong, which is not the case. Travel time measurements do have information (coming) along the ray path (see [83] for further details).
The deep roots of the Galapagos plume: The Galapagos plume is located above the eastern margin of the Pacific LLSVP and its seismic signature has been reported in the literature [84,85,86,87]. Our observations show that the slowest velocity areas are located beneath the Galapagos, which is in agreement with the presence of the plume in the lower-most mantle. However, we are not able to detect the previously reported mega-ULVZ [84,88]. This may be explained by two reasons: (i) due to the location of the bounce points and/or (ii) due to the limitations in out methodology presented in Figure 3c, we are able to properly image up to ± 3 % of velocity perturbations. Different than those values, the ray theory approximations break down, leading to an underestimation of the velocity values. As a consequence, extreme velocity reductions produced by ULVZs may be misinterpreted as simple low-velocity zones as represented in the profile G-G′ in Figure 7.
In general, high-velocity VRA samples near and around the Galapagos plume show shear wave anomalies close to zero (0.0% < dVs < 0.25%). These values do not necessarily indicate, as we will show later, large variations in the chemical or thermal structure of the plume. We propose they are related to the complexity of the convection system around the plume in which the mantle can be trapped/dragged/mixed in the spreading and upwelling of the plume’s material.
High-velocity anomalies inside LLSVP? Compositional interpretation: Silicate perovskite ((Mg,Fe)SiO3) is one of the most abundant materials in the planet, and it is primarily found in the lower mantle, between approximately 660 km and the CMB [9,13]. It undergoes a phase transition (structural rearrangement) to post-perovskite at pressures greater than ∼125 GPa, which corresponds to depths between 2700 km and the CMB and it is usually correlated with the D″ layer [13,14,16,89,90,91,92,93,94].
The perovskite-to-post-perovskite transition is critical for understanding the seismic discontinuity observed in the D″ layer. Theoretical and observational studies report that the phase transition to post-perovskite produces a positive jump in shear wave velocity (+dVs) [8,13,14,89,94,95,96,97,98,99].
Our observations reveal high-velocity anomalies inside the Pacific LLSVP (see Figure 6). High-velocity regions in the lower mantle have been previously reported [4,100], with most of these associated with long-lived subduction slabs [101]. It has been proposed [102] that D″ in the LLSVP beneath the Pacific is chemically distinct from D″ in other regions due to the dense debris of subducted oceanic slabs, possibly dating back to the formation of the Rodinia supercontinent [49]. Additionally, remnants of Mid-Ocean Ridge Basalt (MORB) crust are expected to have accumulated in D″ beneath the Pacific [103].
It is possible to interpret the shear wave velocity values recovered from the VRA below 2250 km depth in petrochemical terms to a certain extent. One effective approach involves estimating Vs for a range of petrological compositions ( C ) while accounting for in situ temperature ( T ) and pressure ( P ) conditions at large depths. Similar methodologies have been employed to investigate compositional and thermal variations within the crust and mantle [104,105,106].
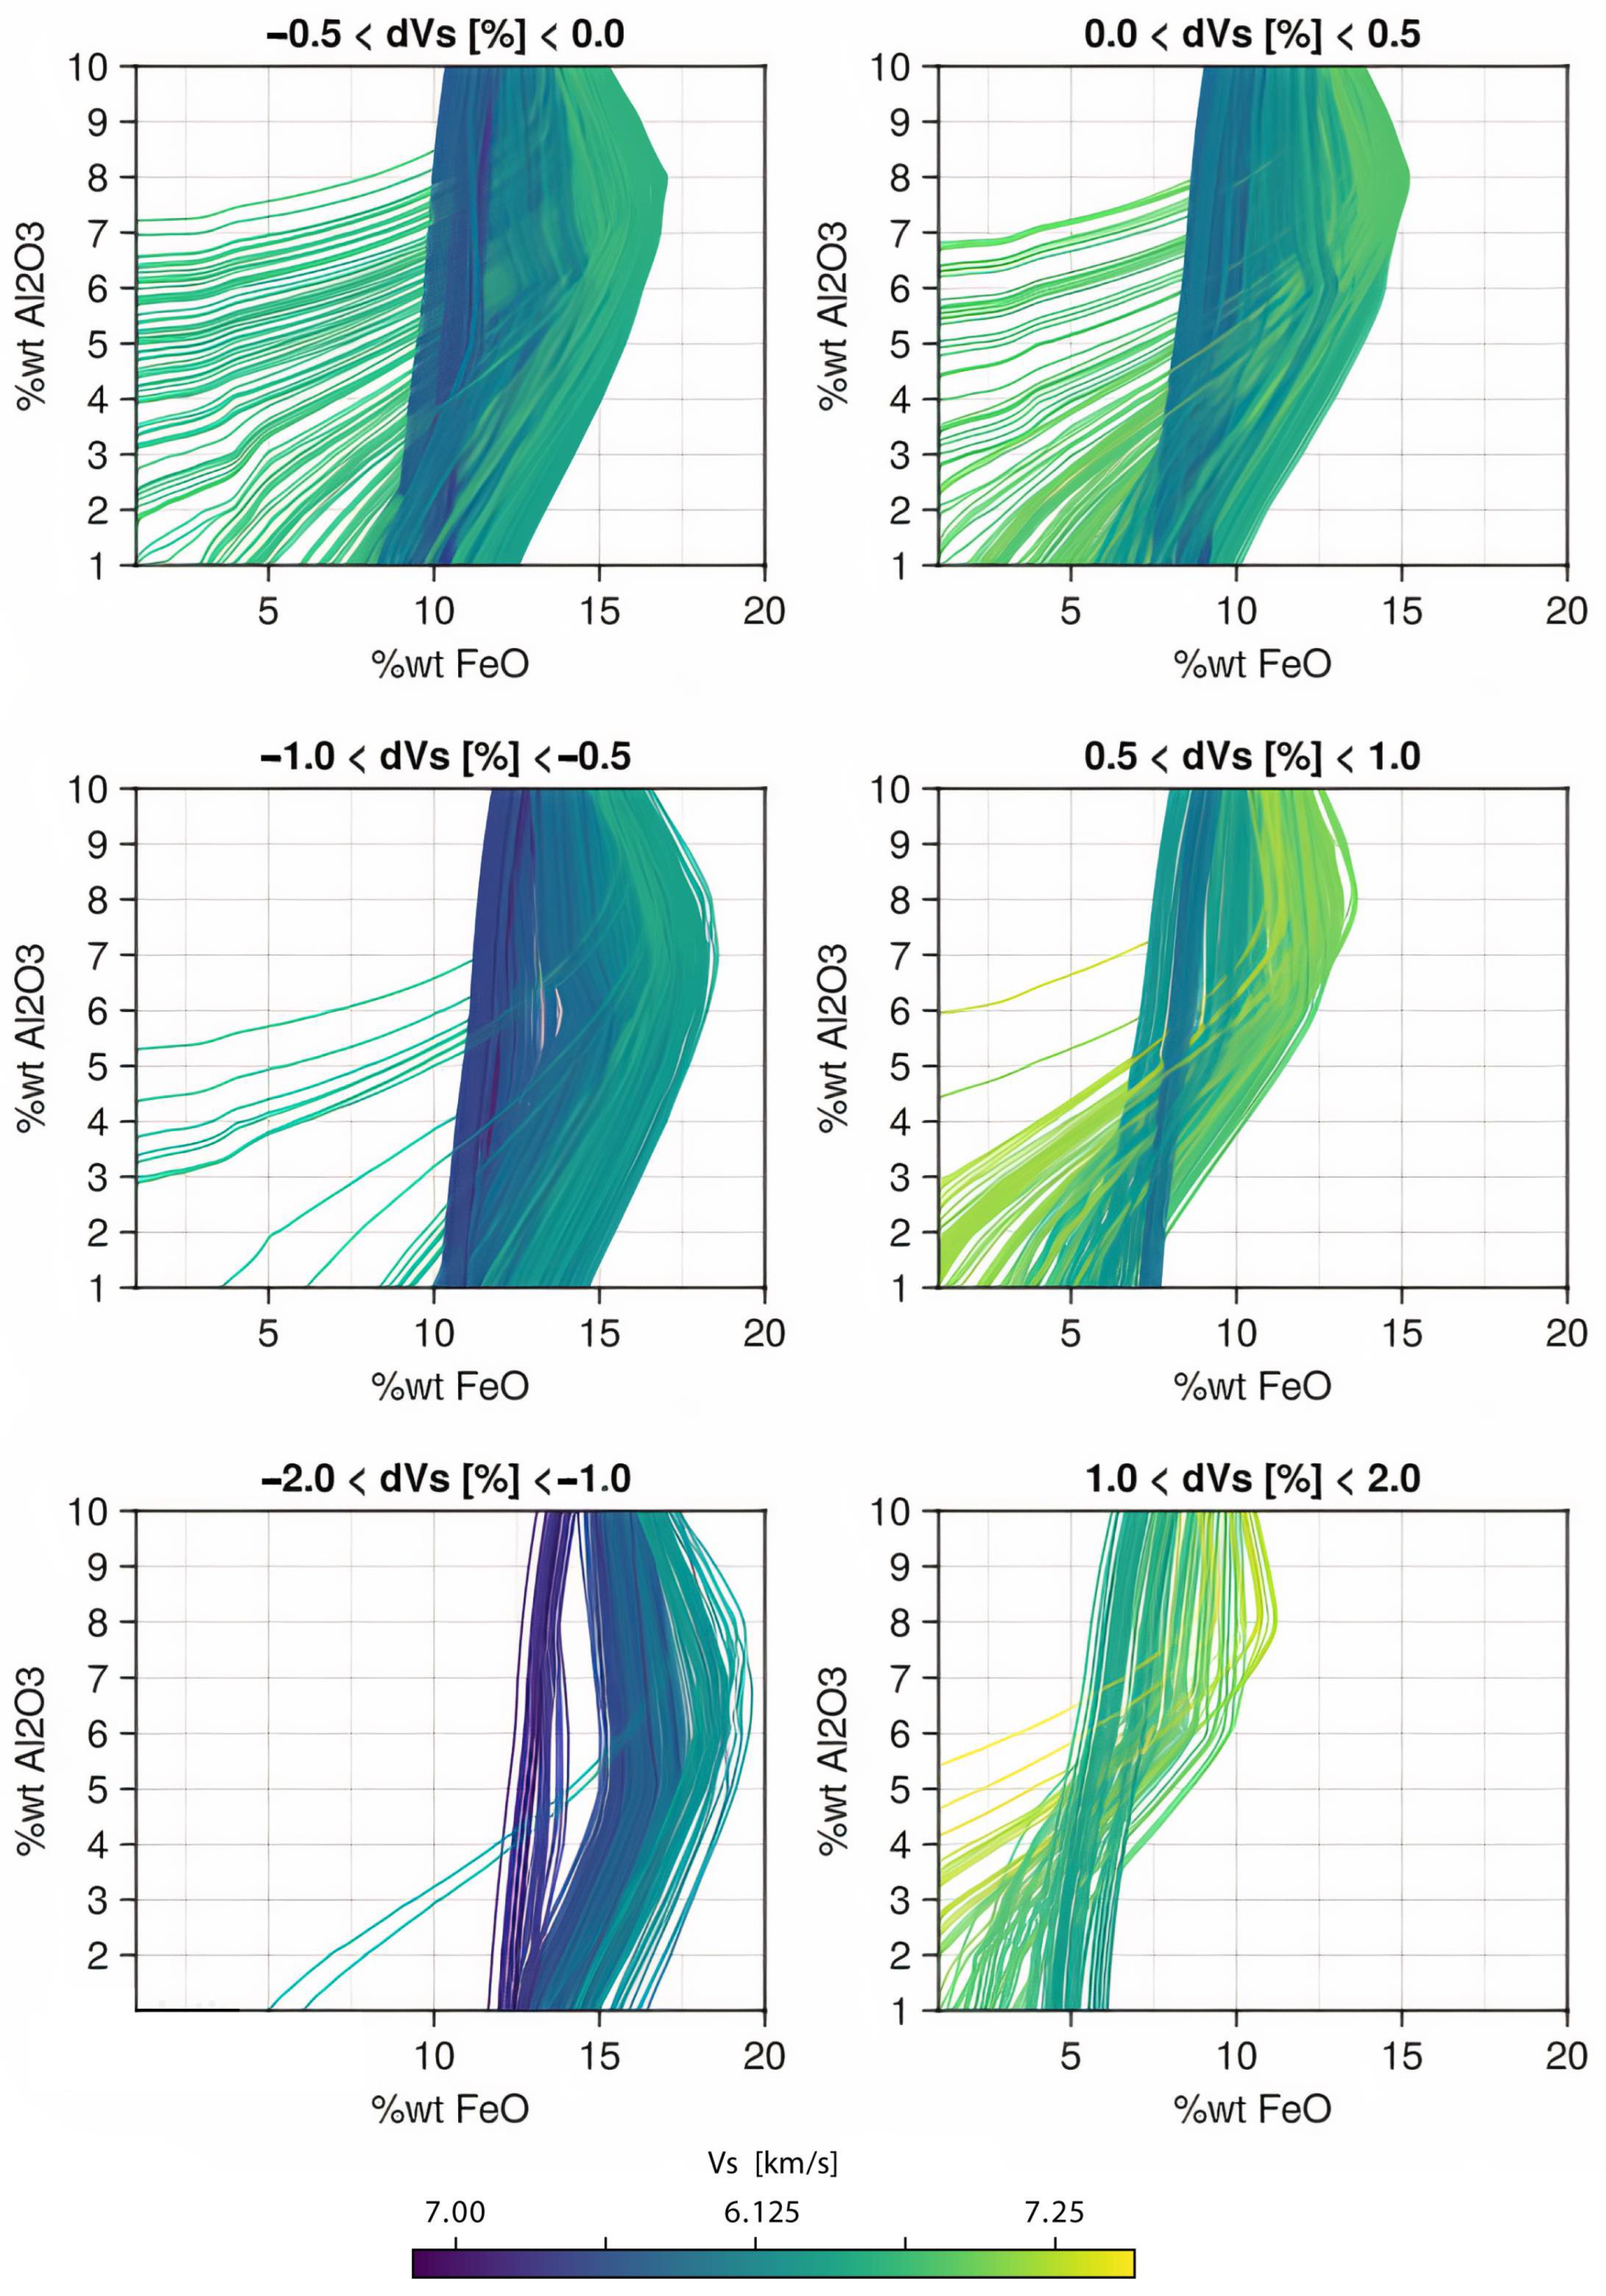
We here use the SEITCOMP V1.0 code (Arnaiz-Rodriguez and Fullea, in preparation). In general terms, T is derived by solving the heat equation in 1D from the CMB to the surface, considering depth-dependent variations in density (automatically derived from a reference composition C 0 ), heat capacity, thermal conductivity, and radiogenic heat production. The in situ pressure ( P ) values are calculated based on the density model and align closely with those reported in PREM. The mantle composition ( C ) is parameterized using stable mantle mineral assemblages, modeled through Gibbs free energy minimization schemes assuming thermodynamic equilibrium ( T > 500 C ) [107]. A standard characterization of mantle composition is based on the main major oxides in the CFMAS system (CaO–FeO–MgO-Al2O3–SiO2) [108,109,110]. To simplify the composition C , SEITCOMP adopts the discretization of [106] where the wt% amounts Al2O3 and FeO oxides in the mantle layers are free variables, and CaO–MgO amounts are statistically correlated with Al2O3 [111].
Therefore, at each VRA sample, we use the estimated values of temperature ( T ) and pressure ( P ) and define the composition ( C ) as a combination of Al2O3 and FeO values. In general terms, Al2O3 concentration is expected to range from 1.0 wt% to 6.0 wt%, while FeO typically ranges between 7.0 wt% and 10 wt%. As reference values, the original or primitive mantle composition is assumed to contain approximately 3.6 wt% Al2O3 and 8.0 wt% FeO [112], while the theoretical rock pyrolite has a composition of 3.98 wt% Al2O3 and 8.18 wt% FeO [113].
It is worth noting that in LLSVPs, larger compositional ranges may be necessary to explain the observed rock properties [99]. For this study, we set Al2O3 to vary from 1 wt% to 11 wt%, while FeO varies from 1 wt% to 20 wt%. Then, for each sample, we calculate the Vs value across all possible combinations of Al2O3 and FeO at 0.1 wt% intervals, considering pressure and temperature at the corresponding depth. This method produces an iso-Vs line or contour (see Figure 9).
In Figure 9, all iso-Vs lines are plotted together to interpret the reported shear-wave velocities. We divide the data into six ranges:
  • 0.0 % < | dVs | < 0.5 %
  • 0.5 % < | dVs | < 1.0 %
  • 1.0 % < | dVs | < 2.0 %
At a first glance, the wt% of FeO clearly dominates the shear-wave velocity variations in the lower mantle. Higher FeO concentrations correlate with negative share-wave velocity anomalies, while lower concentrations correlate with positive ones. This trend is consistent for samples at the top of the section (lower Vs, represented by purple lines) and for values closer to the CMB (higher Vs, represented by green and yellow lines).
Small velocity anomalies ( 0.0 % < | dVs | < 0.5 % ) at the top of the section ( z < 2500 km) can be relatively well linked to moderate variations in FeO content. We observe that these anomalies are well explained by FeO concentrations ranging between 8.0 and 10.7 wt%, which fall within the expected ranges for typical primordial or fertile mantles with a perovskite-dominated composition (∼8–10 wt%) [114,115]. At this depth range, intermediate anomalies ( 0.5 % < | dVs | < 1.0 % ) require larger variations in FeO. Negative anomalies are consistent with FeO concentrations of approximately 12 wt%, possibly indicating the existence of some basaltic material, that is, a fine-scale mélange predominantly composed of mafic mantle rocks, such as high-pressure polymorphs of Mid-Ocean Ridge Basalt (MORB), with some contribution from FeO rich ultramafic rocks, like lherzolite or harzburgite [53]. Positive anomalies align with lower FeO concentrations around 7.5 wt%, which could be associated with depleted mantle—potentially residues of melting processes [113].
Larger velocity anomalies ( 1.0 % < | dVs | < 2.0 % ) require significantly anomalous FeO content to be explained. Negative anomalies suggest FeO concentrations around 13 wt%, while positive anomalies correspond to FeO levels of about 5.1 wt%. These extreme positive anomalies might indicate the presence of post-perovskite-type material in the lower mantle, as FeO content in post-perovskite is expected to be lower (5–8 wt%) compared to perovskite (6–10 wt%) [116,117,118].
Finally, at the bottom of our study region, i.e., depths larger then 2500 km up to the CMB, there is no clear FeO value to account for small velocity anomalies ( 0.0 % < | dVs | < 0.5 % ) . While the trend connecting shear wave velocity (Vs) with FeO wt% observed earlier persists, no large variations are observed around a mean value of 12.5 wt%. Larger variations are found in mid-range ( 0.5 % < | dVs | < 1.0 % ) and large 1.0 % < | dVs | < 2.0 % ) anomalies, with an average FeO content of 15 wt% for positive anomalies and 5 wt% for negative anomalies.
It is evident, assuming that temperature variations due to internal convection within the LLSVP system do not contribute significantly to Vs variations, that we are likely dealing with two distinct mantle phases: one characterized by negative Vs anomalies and high FeO content, and the other by positive Vs anomalies and lower FeO content. For the first phase, previous studies [99] have suggested that LLSVPs might have a high density (consistent with large FeO content), which could stabilize them against the more vigorous mantle convection, thereby giving them their characteristic low Vs. Our observed values align with this interpretation. Additionally, negative anomalies are statistically dominant in our sampled points, which reflects the general composition of the Pacific LLSVP.
As for the second phase, the high-velocity, low-FeO content post-perovskite material abundant in the lowermost mantle is a likely candidate to explain the positive anomalies within the LLSVP. The exact geographical location and nature (thermal or thermochemical) of the Pacific LLSVP edges are not well constrained or understood (see [69] for a recent review). If the Pacific LLSVP represents hotter regions of the mantle, perovskite is expected to dominate the mineralogical composition, depending on pressure and the amount of iron and alumina, due to the positive Clapeyron slope of the perovskite-post-perovskite system [9,14,99,119,120,121].
Because the positive and negative anomaly samples are at a close distance (sometimes smaller than one degree; see Figure 6), there must be a lateral transition from perovskite to postperovskite inside the LLSVP. This phenomenon may occur somewhere close to the border of the LLSVP, across a zone a few hundred km (<200 km) wide (see Figure 10). These high-velocity observations inside the LLSVP seem to be compatible with previous studies [98,99], supporting the idea that the Pacific LLSVP may have a different mantle composition that perturbs the phase boundary depth. Therefore, during the formation and ongoing convective evolution of the LLSVPs, some post-perovskite material may have been incorporated into the LLSVPs. This could potentially mix with the surrounding material, creating small regions with moderate to high positive anomalies within a larger negative-anomaly region. This interpretation is consistent with convective models of LLSVP evolution, in which LLSVP material mixes with lower mantle material [53]. These small and sparse regions would be hard to detect when averaging the travel time information (like in tomography studies) but easily detected when sampling the lower mantle with more delicacy. Hence, we propose that they can be better assessed by accounting for the shear wave variations here reported.
High-velocity anomalies inside LLSVP? The Presence of Anisotropy: Our observations of high-velocity anomalies inside LLSVP may be explained by anisotropy created by lattice preferred orientation (LPO) of a mixture of (Mg,Fe)O and MgSiO3-post-perovskite, through horizontal layering in the direction of the northeastern Pacific Ocean [122,123,124,125,126,127,128,129,130,131]. Ref. [132] argue that shape preferred orientation (SPO) of melt inclusions oriented vertically may also be an explanation.
We, however, cannot differentiate between a mixture of (Mg,Fe)O and MgSiO3-post-perovskite and basaltic mantle that may accumulate in the lower mantle from ancient subductions [103,133] (see Figure 11) that may create the complex positive anomalies inside the LLSVP. Generally speaking, one would not expect this kind of structure in the middle of the Pacific Ocean, away from subduction zones, but recently a stagnant slab has been discovered on the Southern Pacific beneath the East Pacific Rise [134] opening a different explanation to our results. However, a proper investigation of seismic anisotropy using the VRA is left for future studies.
The Virtual Receiver Methodology: Further Developments: We have developed a new imaging technique based on the calculation of slowness using a pair of stations. Based in this result, and the fact that the phase velocity is equal to the medium velocity at the turning point of waves that do not reflect at any boundary, we are able to image any (slowly varying in velocity) structure.
For slowness calculations, we assumed an isotropic medium, allowing us to place any pair of receivers in any direction. Anisotropic imaging, like, for instance, transverse isotropy, can in principle be achieved by simply analyzing SH and SV travel times independently, and taking the directional dependence of the station into account as well.
Slowness calculations can, additionally, be performed in several ways: (i) using seismic arrays [57,135] and, more recently, (ii) using a pair of translational and rotational stations [136,137,138,139,140,141,142,143,144].

6. Conclusions

In this study we present novel results that provide new insights into the internal composition/dynamics of the Pacific LLSVP. We developed and employed the Virtual Receiver Approach (VRA) to directly estimate shear-wave velocities in the lower mantle. Our findings reveal a more complex internal structure than previously reported, characterized by zones of high-velocity anomalies within the Pacific LLSVP. These challenge the traditional conscript of LLSVPs as homogeneous low-velocity regions and suggest significant lateral thermo-chemical heterogeneity.
The observed high-velocity anomalies are consistent with low FeO compositions, indicating the potential presence of post-perovskite (or other dense Fe-depleted phases) possibly resulting from the interaction of the LLSVP and the mantle convection. Another possible explanation is the incorporation of subducted basaltic material into the Pacific LLSVP by a hypothetical ancient subducting slab. Conversely, low-velocity anomalies align with FeO-rich compositions, supporting the hypothesis of LLSVPs as thermo-chemical dynamic structures composed of dense primordial mantle components.
These observations advance our understanding of LLSVPs as dynamic, thermo-chemically diverse structures, with implications for mantle convection, plume generation, and core–mantle heat transfer. Future work integrating high-resolution imaging techniques and petrological modeling is essential to refine our understanding of the role of LLSVPs in Earth’s geodynamic processes.

Author Contributions

Conceptualization, R.A., M.S.A.-R. and C.N.; methodology, R.A., M.S.A.-R. and C.N.; software, R.A. and M.S.A.-R.; validation, R.A., M.S.A.-R. and C.N.; formal analysis, R.A., M.S.A.-R. and C.N.; investigation, R.A., M.S.A.-R. and C.N.; data curation, R.A.; writing—original draft preparation, R.A., M.S.A.-R. and C.N.; writing—review and editing, R.A., M.S.A.-R. and C.N.; visualization, R.A., M.S.A.-R. and C.N. All authors have read and agreed to the published version of the manuscript.

Funding

This research was partially funded by the DFG (Deutsche Forschungsgemeinschaft) grant number EARLY AB887/1-1.

Data Availability Statement

Data are available upon reasonable request to the corresponding author.

Acknowledgments

R.A. acknowledges constructive conversations with Jean-Paul Montagner, Stephanie Durand, Saksham Rohilla and the seismology group of the University of Münster. SEITCOMP can be downloaded here (https://github.com/marianoarnaiz/SeitComp.jl) (accessed on 1 March 2025). The authors acknowledge the constructive comments of three anonymous reviewers and would like to extend a sincere gratitude to the Geosciences Editorial office for generously waiving the publication fees, which has greatly supported the dissemination of our research. Numerical computations were performed on the S-CAPAD/DANTE platform, IPGP, France.

Conflicts of Interest

The authors declare no conflict of interest.

References

  1. Parsons, B.; McKenzie, D. Mantle convection and the thermal structure of the plates. J. Geophys. Res. Solid Earth 1978, 83, 4485–4496. [Google Scholar] [CrossRef]
  2. Turcotte, D.L.; Schubert, G. Geodynamics; Cambridge University Press: Cambridge, UK, 2002. [Google Scholar]
  3. Lay, T.; Hernlund, J.; Buffett, B.A. Core–mantle boundary heat flow. Nat. Geosci. 2008, 1, 25–32. [Google Scholar] [CrossRef]
  4. Dziewonski, A.M.; Hager, B.H.; O’Connell, R.J. Large-scale heterogeneities in the lower mantle. J. Geophys. Res. 1977, 82, 239–255. [Google Scholar] [CrossRef]
  5. Frost, D.J.; Liebske, C.; Langenhorst, F.; McCammon, C.A.; Trønnes, R.G.; Rubie, D.C. Experimental evidence for the existence of iron-rich metal in the Earth’s lower mantle. Nature 2004, 428, 409–412. [Google Scholar] [CrossRef]
  6. Kesson, S.; Fitz Gerald, J.; Shelley, J. Mineralogy and dynamics of a pyrolite lower mantle. Nature 1998, 393, 252–255. [Google Scholar] [CrossRef]
  7. Helffrich, G.R.; Wood, B.J. The Earth’s mantle. Nature 2001, 412, 501–507. [Google Scholar] [CrossRef]
  8. Garnero, E.J.; McNamara, A.K. Structure and Dynamics of Earth’s Lower Mantle. Science 2008, 320, 626–628. [Google Scholar] [CrossRef]
  9. Tsuchiya, T.; Tsuchiya, J.; Umemoto, K.; Wentzcovitch, R.M. Phase transition in MgSiO3 perovskite in the Earth’s lower mantle. Earth Planet. Sci. Lett. 2004, 224, 241–248. [Google Scholar] [CrossRef]
  10. Hirose, K.; Fei, Y.; Ma, Y.; Mao, H.K. The fate of subducted basaltic crust in the Earth’s lower mantle. Nature 1999, 397, 53–56. [Google Scholar] [CrossRef]
  11. Davies, G.; Dziewonski, A. Homogeneity and constitution of the Earth’s lower mantle and outer core. Phys. Earth Planet. Inter. 1975, 10, 336–343. [Google Scholar] [CrossRef]
  12. Kaminsky, F. Mineralogy of the lower mantle: A review of ‘super-deep’ mineral inclusions in diamond. Earth-Sci. Rev. 2012, 110, 127–147. [Google Scholar] [CrossRef]
  13. Murakami, M.; Ohishi, Y.; Hirao, N.; Hirose, K. A perovskitic lower mantle inferred from high-pressure, high-temperature sound velocity data. Nature 2012, 485, 90–94. [Google Scholar] [CrossRef] [PubMed]
  14. Oganov, A.R.; Ono, S. Theoretical and experimental evidence for a post-perovskite phase of MgSiO3 in Earth’s D" layer. Nature 2004, 430, 445–448. [Google Scholar] [CrossRef]
  15. Iitaka, T.; Hirose, K.; Kawamura, K.; Murakami, M. The elasticity of the MgSiO3 post-perovskite phase in the Earth’s lowermost mantle. Nature 2004, 430, 442–445. [Google Scholar] [CrossRef]
  16. Murakami, M.; Hirose, K.; Kawamura, K.; Sata, N.; Ohishi, Y. Post-perovskite phase transition in MgSiO3. Science 2004, 304, 855–858. [Google Scholar] [CrossRef] [PubMed]
  17. Garnero, E.J.; Helmberger, D.V. A very slow basal layer underlying large-scale low-velocity anomalies in the lower mantle beneath the Pacific: Evidence from core phases. Phys. Earth Planet. Inter. 1995, 91, 161–176. [Google Scholar] [CrossRef]
  18. Ritsema, J.; van Heijst, H.J.; Woodhouse, J.H. Complex shear wave velocity structure imaged beneath Africa and Iceland. Science 1999, 286, 1925–1928. [Google Scholar] [CrossRef]
  19. Lay, T.; Hernlund, J.; Garnero, E.J.; Thorne, M.S. A post-perovskite lens and D" heat flux beneath the central Pacific. Science 2006, 314, 1272–1276. [Google Scholar] [CrossRef]
  20. Sun, D.; Miller, M.S. Study of the western edge of the African large low shear velocity province. Geochem. Geophys. Geosyst. 2013, 14, 3109–3125. [Google Scholar] [CrossRef]
  21. He, Y.; Wen, L. Structural features and shear-velocity structure of the “Pacific Anomaly”. J. Geophys. Res. Solid Earth 2009, 114. [Google Scholar] [CrossRef]
  22. McNamara, A.K.; Garnero, E.J.; Rost, S. Tracking deep mantle reservoirs with ultra-low velocity zones. Earth Planet. Sci. Lett. 2010, 299, 1–9. [Google Scholar] [CrossRef]
  23. Avants, M.; Lay, T.; Russell, S.A.; Garnero, E.J. Shear velocity variation within the D″ region beneath the central Pacific. J. Geophys. Res. Solid Earth 2006, 111, B05305. [Google Scholar] [CrossRef]
  24. Thorne, M.S.; Zhang, Y.; Ritsema, J. Evaluation of 1-D and 3-D seismic models of the Pacific lower mantle with S, SKS, and SKKS traveltimes and amplitudes. J. Geophys. Res. Solid Earth 2013, 118, 985–995. [Google Scholar] [CrossRef]
  25. Ni, S.; Tan, E.; Gurnis, M.; Helmberger, D. Sharp sides to the African superplume. Science 2002, 296, 1850–1852. [Google Scholar] [CrossRef] [PubMed]
  26. Wang, Y.; Wen, L. Mapping the geometry and geographic distribution of a very low velocity province at the base of the Earth’s mantle. J. Geophys. Res. Solid Earth 2004, 109. [Google Scholar] [CrossRef]
  27. King, S.D.; Anderson, D.L. Edge-driven convection. Earth Planet. Sci. Lett. 1998, 160, 289–296. [Google Scholar] [CrossRef]
  28. Frost, D.A.; Rost, S. The P-wave boundary of the large-low shear velocity province beneath the Pacific. Earth Planet. Sci. Lett. 2014, 403, 380–392. [Google Scholar] [CrossRef]
  29. Burke, K.; Steinberger, B.; Torsvik, T.H.; Smethurst, M.A. Plume generation zones at the margins of large low shear velocity provinces on the core–mantle boundary. Earth Planet. Sci. Lett. 2008, 265, 49–60. [Google Scholar] [CrossRef]
  30. Ford, S.R.; Garnero, E.J.; McNamara, A.K. A strong lateral shear velocity gradient and anisotropy heterogeneity in the lowermost mantle beneath the southern Pacific. J. Geophys. Res. Solid Earth 2006, 111, B0330. [Google Scholar] [CrossRef]
  31. He, Y.; Wen, L.; Zheng, T. Geographic boundary and shear wave velocity structure of the “Pacific anomaly” near the core–mantle boundary beneath western Pacific. Earth Planet. Sci. Lett. 2006, 244, 302–314. [Google Scholar] [CrossRef]
  32. Brown, S.P.; Thorne, M.S.; Miyagi, L.; Rost, S. A compositional origin to ultralow-velocity zones. Geophys. Res. Lett. 2015, 42, 1039–1045. [Google Scholar] [CrossRef]
  33. Jensen, K.J.; Thorne, M.S.; Rost, S. SPdKS analysis of ultralow-velocity zones beneath the western Pacific. Geophys. Res. Lett. 2013, 40, 4574–4578. [Google Scholar] [CrossRef]
  34. Rost, S.; Garnero, E.J.; Stefan, W. Thin and intermittent ultralow-velocity zones. J. Geophys. Res. Solid Earth 2010, 115, B06312. [Google Scholar] [CrossRef]
  35. Rost, S.; Garnero, E.J.; Williams, Q. Fine-scale ultralow-velocity zone structure from high-frequency seismic array data. J. Geophys. Res. Solid Earth 2006, 111, B09310. [Google Scholar] [CrossRef]
  36. Rost, S.; Garnero, E.J. Detection of an ultralow velocity zone at the core–mantle boundary using diffracted PKKPab waves. J. Geophys. Res. Solid Earth 2006, 111, B07309. [Google Scholar] [CrossRef]
  37. Rost, S.; Revenaugh, J. Small-scale ultralow-velocity zone structure imaged by ScP. J. Geophys. Res. Solid Earth 2003, 108, 2056. [Google Scholar] [CrossRef]
  38. Wen, L.; Helmberger, D.V. Ultra-low velocity zones near the core–mantle boundary from broadband PKP precursors. Science 1998, 279, 1701–1703. [Google Scholar] [CrossRef]
  39. Zhang, Y.; Ritsema, J.; Thorne, M.S. Modeling the ratios of SKKS and SKS amplitudes with ultra-low velocity zones at the core–mantle boundary. Geophys. Res. Lett. 2009, 36, L19303. [Google Scholar] [CrossRef]
  40. Vanacore, E.; Rost, S.; Thorne, M. Ultralow-velocity zone geometries resolved by multidimensional waveform modelling. Geophys. J. Int. 2016, 206, 659–674. [Google Scholar] [CrossRef]
  41. Mao, W.L.; Mao, H.k.; Sturhahn, W.; Zhao, J.; Prakapenka, V.B.; Meng, Y.; Shu, J.; Fei, Y.; Hemley, R.J. Iron-rich post-perovskite and the origin of ultralow-velocity zones. Science 2006, 312, 564–565. [Google Scholar] [CrossRef]
  42. Garnero, E.J.; Revenaugh, J.; Williams, Q.; Lay, T.; Kellogg, L.H. Ultralow velocity zone at the core–mantle boundary. In The Core–Mantle Boundary Region; Wiley Online Library: Hoboken, NJ, USA, 1998; Volume 28, pp. 319–334. [Google Scholar]
  43. Ritsema, J.; Deuss, A.; van Heijst, H.J.; Woodhouse, J.H. S40RTS: A degree-40 shear-velocity model for the mantle from new Rayleigh wave dispersion, teleseismic traveltime and normal-mode splitting function measurements. Geophys. J. Int. 2011, 184, 1223–1236. [Google Scholar] [CrossRef]
  44. Bozdağ, E.; Peter, D.; Lefebvre, M.; Komatitsch, D.; Tromp, J.; Hill, J.; Podhorszki, N.; Pugmire, D. Global adjoint tomography: First-generation model. Geophys. J. Int. 2016, 207, 1739–1766. [Google Scholar] [CrossRef]
  45. French, S.; Romanowicz, B. Whole-mantle radially anisotropic shear velocity structure from spectral-element waveform tomography. Geophys. J. Int. 2014, 199, 1303–1327. [Google Scholar] [CrossRef]
  46. Ishii, M.; Tromp, J. Constraining large-scale mantle heterogeneity using mantle and inner-core sensitive normal modes. Phys. Earth Planet. Inter. 2004, 146, 113–124. [Google Scholar] [CrossRef]
  47. Davaille, A.; Le Bars, M.; Carbonne, C. Thermal convection in a heterogeneous mantle. Comptes Rendus Geosci. 2003, 335, 141–156. [Google Scholar] [CrossRef]
  48. Hansen, U.; Yuen, D. Extended-Boussinesq thermal–chemical convection with moving heat sources and variable viscosity. Earth Planet. Sci. Lett. 2000, 176, 401–411. [Google Scholar] [CrossRef]
  49. Maruyama, S.; Santosh, M.; Zhao, D. Superplume, supercontinent, and post-perovskite: Mantle dynamics and anti-plate tectonics on the Core–Mantle Boundary. Gondwana Res. 2007, 11, 7–37. [Google Scholar] [CrossRef]
  50. Tanaka, S.; Suetsugu, D.; Shiobara, H.; Sugioka, H.; Kanazawa, T.; Fukao, Y.; Barruol, G.; Reymond, D. On the vertical extent of the large low shear velocity province beneath the South Pacific Superswell. Geophys. Res. Lett. 2009, 36, L07305. [Google Scholar] [CrossRef]
  51. McNamara, A.K.; Zhong, S. Thermochemical structures within a spherical mantle: Superplumes or piles? J. Geophys. Res. Solid Earth 2004, 109, B07402. [Google Scholar] [CrossRef]
  52. McNamara, A.K.; Zhong, S. Thermochemical structures beneath Africa and the Pacific Ocean. Nature 2005, 437, 1136–1139. [Google Scholar] [CrossRef]
  53. Ballmer, M.D.; Schumacher, L.; Lekic, V.; Thomas, C.; Ito, G. Compositional layering within the large low shear-wave velocity provinces in the lower mantle. Geochem. Geophys. Geosyst. 2016, 17, 5056–5077. [Google Scholar] [CrossRef]
  54. Thorne, M.S.; Garnero, E.J.; Jahnke, G.; Igel, H.; McNamara, A.K. Mega ultra low velocity zone and mantle flow. Earth Planet. Sci. Lett. 2013, 364, 59–67. [Google Scholar] [CrossRef]
  55. Aki, K.; Christoffersson, A.; Husebye, E.S. Determination of the three-dimensional seismic structure of the lithosphere. J. Geophys. Res. 1977, 82, 277–296. [Google Scholar] [CrossRef]
  56. Dziewonski, A.M. Mapping the lower mantle: Determination of lateral heterogeneity in P velocity up to degree and order 6. J. Geophys. Res. Solid Earth 1984, 89, 5929–5952. [Google Scholar] [CrossRef]
  57. Rost, S.; Thomas, C. Array seismology: Methods and applications. Rev. Geophys. 2002, 40, 2-1–2-27. [Google Scholar] [CrossRef]
  58. Stein, S.; Wysession, M. An Introduction to Seismology, Earthquakes, and Earth Structure; John Wiley & Sons: Hoboken, NJ, USA, 2009. [Google Scholar]
  59. Mula, A.H.; Müller, G. Ray parameters of diffracted long period P and S waves and the velocities at the base of the mantle. Pure Appl. Geophys. 1980, 118, 1272–1292. [Google Scholar] [CrossRef]
  60. Souriau, A.; Poupinet, G. Lateral variations in P velocity and attenuation in the D layer, from diffracted P waves. Phys. Earth Planet. Inter. 1994, 84, 227–234. [Google Scholar] [CrossRef]
  61. Crotwell, H.P.; Owens, T.J.; Ritsema, J. The TauP Toolkit: Flexible seismic travel time and ray path utilities. Seismol. Res. Lett. 1999, 70, 154–160. [Google Scholar] [CrossRef]
  62. Krischer, L.; Megies, T.; Barsch, R.; Beyreuther, M.; Lecocq, T.; Caudron, C.; Wassermann, J. ObsPy: A bridge for seismology into the scientific Python ecosystem. Comput. Sci. Discov. 2015, 8, 014003. [Google Scholar] [CrossRef]
  63. Dziewonski, A.M.; Anderson, D.L. Preliminary reference Earth model. Phys. Earth Planet. Inter. 1981, 25, 297–356. [Google Scholar] [CrossRef]
  64. Kennett, B.L.; Engdahl, E.; Buland, R. Constraints on seismic velocities in the Earth from traveltimes. Geophys. J. Int. 1995, 122, 108–124. [Google Scholar] [CrossRef]
  65. Morelli, A.; Dziewonski, A.M. Body wave traveltimes and a spherically symmetric P-and S-wave velocity model. Geophys. J. Int. 1993, 112, 178–194. [Google Scholar] [CrossRef]
  66. Kennett, B.; Engdahl, E. Traveltimes for global Earthquake location and phase identification. Geophys. J. Int. 1991, 105, 429–465. [Google Scholar] [CrossRef]
  67. Lai, H.; Garnero, E.J.; Grand, S.P.; Porritt, R.W.; Becker, T.W. Global travel time dataset from adaptive empirical wavelet construction. Geochem. Geophys. Geosyst. 2019, 20, 2175–2198. [Google Scholar] [CrossRef]
  68. Schubert, G.; Masters, G.; Olson, P.; Tackley, P. Superplumes or plume clusters? Phys. Earth Planet. Inter. 2004, 146, 147–162. [Google Scholar] [CrossRef]
  69. McNamara, A.K. A review of large low shear velocity provinces and ultra low velocity zones. Tectonophysics 2019, 760, 199–220. [Google Scholar] [CrossRef]
  70. Durand, S.; Debayle, E.; Ricard, Y.; Zaroli, C.; Lambotte, S. Confirmation of a change in the global shear velocity pattern at around 1000 km depth. Geophys. J. Int. 2017, 211, 1628–1639. [Google Scholar] [CrossRef]
  71. Hosseini, K.; Matthews, K.J.; Sigloch, K.; Shephard, G.E.; Domeier, M.; Tsekhmistrenko, M. SubMachine: Web-based tools for exploring seismic tomography and other models of Earth’s deep interior. Geochem. Geophys. Geosyst. 2018, 19, 1464–1483. [Google Scholar] [CrossRef]
  72. Moulik, P.; Ekström, G. An anisotropic shear velocity model of the Earth’s mantle using normal modes, body waves, surface waves and long-period waveforms. Geophys. J. Int. 2014, 199, 1713–1738. [Google Scholar] [CrossRef]
  73. Lu, C.; Grand, S.P. The effect of subducting slabs in global shear wave tomography. Geophys. J. Int. 2016, 205, 1074–1085. [Google Scholar]
  74. Koelemeijer, P.; Ritsema, J.; Deuss, A.; Van Heijst, H.J. SP12RTS: A degree-12 model of shear-and compressional-wave velocity for Earth’s mantle. Geophys. J. Int. 2016, 204, 1024–1039. [Google Scholar] [CrossRef]
  75. Lu, C.; Grand, S.P.; Lai, H.; Garnero, E.J. TX2019slab: A new P and S tomography model incorporating subducting slabs. J. Geophys. Res. Solid Earth 2019, 124, 11549–11567. [Google Scholar] [CrossRef]
  76. Tesoniero, A.; Auer, L.; Boschi, L.; Cammarano, F. Hydration of marginal basins and compositional variations within the continental lithospheric mantle inferred from a new global model of shear and compressional velocity. J. Geophys. Res. Solid Earth 2015, 120, 7789–7813. [Google Scholar] [CrossRef]
  77. Marquering, H.; Dahlen, F.; Nolet, G. Three-dimensional sensitivity kernels for finite-frequency traveltimes: The banana-doughnut paradox. Geophys. J. Int. 1999, 137, 805–815. [Google Scholar] [CrossRef]
  78. De Hoop, M.V.; van Der Hilst, R.D. On sensitivity kernels for “wave-equation” transmission tomography. Geophys. J. Int. 2005, 160, 621–633. [Google Scholar] [CrossRef]
  79. Van Der Hilst, R.D.; De Hoop, M.V. Banana-doughnut kernels and mantle tomography. Geophys. J. Int. 2005, 163, 956–961. [Google Scholar] [CrossRef]
  80. De Hoop, M.V.; Van Der Hilst, R.D. Reply to comment by FA Dahlen and G. Nolet on “On sensitivity kernels for “wave-equation” transmission tomography”. Geophys. J. Int. 2005, 163, 952–955. [Google Scholar] [CrossRef]
  81. Montelli, R.; Nolet, G.; Dahlen, F. Comment on “Banana–Doughnut kernels and mantle tomography" by van der Hilst and de Hoop. Geophys. J. Int. 2006, 167, 1204–1210. [Google Scholar] [CrossRef]
  82. van Der Hilst, R.D.; De Hoop, M.V. Reply to comment by R. Montelli, G. Nolet and FA Dahlen on “banana—doughnut kernels and mantle tomography”. Geophys. J. Int. 2006, 167, 1211–1214. [Google Scholar] [CrossRef]
  83. Abreu, R. Understanding the Adjoint Method in Seismology: Theory and Implementation in the Time Domain. Surv. Geophys. 2024, 45, 1363–1434. [Google Scholar] [CrossRef]
  84. Cottaar, S.; Martin, C.; Li, Z.; Parai, R. The root to the Galápagos mantle plume on the core–mantle boundary. Seismica 2022, 1. [Google Scholar] [CrossRef]
  85. Villagómez, D.R.; Toomey, D.R.; Geist, D.J.; Hooft, E.E.; Solomon, S.C. Mantle flow and multistage melting beneath the Galápagos hotspot revealed by seismic imaging. Nat. Geosci. 2014, 7, 151–156. [Google Scholar] [CrossRef]
  86. Nolet, G.; Hello, Y.; Lee, S.v.d.; Bonnieux, S.; Ruiz, M.C.; Pazmino, N.A.; Deschamps, A.; Regnier, M.M.; Font, Y.; Chen, Y.J.; et al. Imaging the Galápagos mantle plume with an unconventional application of floating seismometers. Sci. Rep. 2019, 9, 1326. [Google Scholar] [CrossRef]
  87. Harpp, K.S.; Weis, D. Insights into the origins and compositions of mantle plumes: A comparison of Galápagos and Hawai’i. Geochem. Geophys. Geosyst. 2020, 21, e2019GC008887. [Google Scholar] [CrossRef]
  88. Vanacore, E.; Niu, F. Characterization of the D beneath the Galapagos Islands using SKKS and SKS waveforms. Earthq. Sci. 2011, 24, 87–99. [Google Scholar]
  89. Hirose, K.; Brodholt, J.; Lay, T.; Yuen, D. Post-Perovskite: The Last Mantle Phase Transition; John Wiley & Sons: Hoboken, NJ, USA, 2013; Volume 174. [Google Scholar]
  90. Shim, S.H.; Kubo, A.; Duffy, T.S. Raman spectroscopy of perovskite and post-perovskite phases of MgGeO3 to 123 GPa. Earth Planet. Sci. Lett. 2007, 260, 166–178. [Google Scholar] [CrossRef]
  91. Williams, Q.; Jeanloz, R.; McMillan, P. Vibrational spectrum of MgSiO3 perovskite: Zero-pressure Raman and mid-infrared spectra to 27 GPa. J. Geophys. Res. Solid Earth 1987, 92, 8116–8128. [Google Scholar] [CrossRef]
  92. Shim, S.H. The postperovskite transition. Annu. Rev. Earth Planet. Sci. 2008, 36, 569–599. [Google Scholar] [CrossRef]
  93. Tateno, S.; Hirose, K.; Sata, N.; Ohishi, Y. Determination of post-perovskite phase transition boundary up to 4400 K and implications for thermal structure in D layer. Earth Planet. Sci. Lett. 2009, 277, 130–136. [Google Scholar] [CrossRef]
  94. Tsuchiya, T.; Tsuchiya, J. Effect of impurity on the elasticity of perovskite and postperovskite: Velocity contrast across the postperovskite transition in (Mg, Fe, Al)(Si, Al) O3. Geophys. Res. Lett. 2006, 33. [Google Scholar] [CrossRef]
  95. Wookey, J.; Stackhouse, S.; Kendall, J.M.; Brodholt, J.; Price, G.D. Efficacy of the post-perovskite phase as an explanation for lowermost-mantle seismic properties. Nature 2005, 438, 1004–1007. [Google Scholar] [CrossRef] [PubMed]
  96. Stackhouse, S.; Brodholt, J.P.; Dobson, D.P.; Price, G.D. Electronic spin transitions and the seismic properties of ferrous iron-bearing MgSiO3 post-perovskite. Geophys. Res. Lett. 2006, 33, L12S03. [Google Scholar] [CrossRef]
  97. Wentzcovitch, R.M.; Tsuchiya, T.; Tsuchiya, J. MgSiO3 postperovskite at Dconditions. Proc. Natl. Acad. Sci. USA 2006, 103, 543–546. [Google Scholar] [CrossRef] [PubMed]
  98. Deschamps, F.; Cobden, L.; Tackley, P.J. The primitive nature of large low shear-wave velocity provinces. Earth Planet. Sci. Lett. 2012, 349, 198–208. [Google Scholar] [CrossRef]
  99. Vilella, K.; Bodin, T.; Boukaré, C.E.; Deschamps, F.; Badro, J.; Ballmer, M.D.; Li, Y. Constraints on the composition and temperature of LLSVPs from seismic properties of lower mantle minerals. Earth Planet. Sci. Lett. 2021, 554, 116685. [Google Scholar] [CrossRef]
  100. Jordan, T.H.; Lynn, W.S. A velocity anomaly in the lower mantle. J. Geophys. Res. 1974, 79, 2679–2685. [Google Scholar] [CrossRef]
  101. Suzuki, Y.; Kawai, K.; Geller, R.J.; Tanaka, S.; Siripunvaraporn, W.; Boonchaisuk, S.; Noisagool, S.; Ishihara, Y.; Kim, T. High-resolution 3-D S-velocity structure in the D region at the western margin of the Pacific LLSVP: Evidence for small-scale plumes and paleoslabs. Phys. Earth Planet. Inter. 2020, 307, 106544. [Google Scholar] [CrossRef]
  102. Tackley, P.J. Three-Dimensional Simulations of Mantle Convection with a Thermo-Chemical Basal Boundary Layer: D″? In The Core-Mantle Boundary Region; American Geophysical Union (AGU): Washington, DC, USA, 1998; pp. 231–253. [Google Scholar]
  103. Christensen, U.R.; Hofmann, A.W. Segregation of subducted oceanic crust in the convecting mantle. J. Geophys. Res. Solid Earth 1994, 99, 19867–19884. [Google Scholar] [CrossRef]
  104. Khan, A.; Boschi, L.; Connolly, J. On mantle chemical and thermal heterogeneities and anisotropy as mapped by inversion of global surface wave data. J. Geophys. Res. Solid Earth 2009, 114, B09305. [Google Scholar] [CrossRef]
  105. Müntener, O.; Ulmer, P. Arc crust formation and differentiation constrained by experimental petrology. Am. J. Sci. 2018, 318, 64–89. [Google Scholar] [CrossRef]
  106. Fullea, J.; Lebedev, S.; Martinec, Z.; Celli, N.L. WINTERC-G: Mapping the upper mantle thermochemical heterogeneity from coupled geophysical–petrological inversion of seismic waveforms, heat flow, surface elevation and gravity satellite data. Geophys. J. Int. 2021, 226, 146–191. [Google Scholar] [CrossRef]
  107. Connolly, J.A. Computation of phase equilibria by linear programming: A tool for geodynamic modeling and its application to subduction zone decarbonation. Earth Planet. Sci. Lett. 2005, 236, 524–541. [Google Scholar] [CrossRef]
  108. Harley, S.L. An experimental study of the partitioning of Fe and Mg between garnet and orthopyroxene. Contrib. Mineral. Petrol. 1984, 86, 359–373. [Google Scholar] [CrossRef]
  109. Nakagawa, T.; Tackley, P.J.; Deschamps, F.; Connolly, J.A. The influence of MORB and harzburgite composition on thermo-chemical mantle convection in a 3-D spherical shell with self-consistently calculated mineral physics. Earth Planet. Sci. Lett. 2010, 296, 403–412. [Google Scholar] [CrossRef]
  110. Nakagawa, T.; Tackley, P.J.; Deschamps, F.; Connolly, J.A. Incorporating self-consistently calculated mineral physics into thermochemical mantle convection simulations in a 3-D spherical shell and its influence on seismic anomalies in Earth’s mantle. Geochem. Geophys. Geosyst. 2009, 10, Q03004. [Google Scholar] [CrossRef]
  111. Afonso, J.C.; Fullea, J.; Yang, Y.; Connolly, J.; Jones, A. 3-D multi-observable probabilistic inversion for the compositional and thermal structure of the lithosphere and upper mantle. II: General methodology and resolution analysis. J. Geophys. Res. Solid Earth 2013, 118, 1650–1676. [Google Scholar] [CrossRef]
  112. McDonough, W.F.; Sun, S.S. The composition of the Earth. Chem. Geol. 1995, 120, 223–253. [Google Scholar] [CrossRef]
  113. Workman, R.K.; Hart, S.R. Major and trace element composition of the depleted MORB mantle (DMM). Earth Planet. Sci. Lett. 2005, 231, 53–72. [Google Scholar] [CrossRef]
  114. Palme, H.; O’Neill, H. 2.01 - Cosmochemical Estimates of Mantle Composition. In Treatise on Geochemistry; Holland, H.D., Turekian, K.K., Eds.; Pergamon: Oxford, UK, 2007; pp. 1–38. [Google Scholar]
  115. Fei, Y.; Wang, Y.; Finger, L.W. Maximum solubility of FeO in (Mg, Fe) SiO3-perovskite as a function of temperature at 26 GPa: Implication for FeO content in the lower mantle. J. Geophys. Res. Solid Earth 1996, 101, 11525–11530. [Google Scholar] [CrossRef]
  116. Sinmyo, R.; Ozawa, H.; Hirose, K.; Yasuhara, A.; Endo, N.; Sata, N.; Ohishi, Y. Ferric iron content in (Mg, Fe) SiO3 perovskite and post-perovskite at deep lower mantle conditions. Am. Mineral. 2008, 93, 1899–1902. [Google Scholar] [CrossRef]
  117. Dorfman, S.M.; Duffy, T.S. Effect of Fe-enrichment on seismic properties of perovskite and post-perovskite in the deep lower mantle. Geophys. J. Int. 2014, 197, 910–919. [Google Scholar] [CrossRef]
  118. Tateno, S.; Hirose, K.; Sata, N.; Ohishi, Y. Solubility of FeO in (Mg, Fe) SiO3 perovskite and the post-perovskite phase transition. Phys. Earth Planet. Inter. 2007, 160, 319–325. [Google Scholar] [CrossRef]
  119. Catalli, K.; Shim, S.H.; Prakapenka, V. Thickness and Clapeyron slope of the post-perovskite boundary. Nature 2009, 462, 782–785. [Google Scholar] [CrossRef]
  120. Hernlund, J.; Thomas, C.; Tackley, P. A doubling of the post-perovskite phase boundary and structure of the Earth’s lowermost mantle. Nature 2005, 434, 882–886. [Google Scholar] [CrossRef] [PubMed]
  121. Sun, N.; Wei, W.; Han, S.; Song, J.; Li, X.; Duan, Y.; Prakapenka, V.B.; Mao, Z. Phase transition and thermal equations of state of (Fe, Al)-bridgmanite and post-perovskite: Implication for the chemical heterogeneity at the lowermost mantle. Earth Planet. Sci. Lett. 2018, 490, 161–169. [Google Scholar] [CrossRef]
  122. Nowacki, A.; Wookey, J.; Kendall, J.M. New advances in using seismic anisotropy, mineral physics and geodynamics to understand deformation in the lowermost mantle. J. Geodyn. 2011, 52, 205–228. [Google Scholar] [CrossRef]
  123. Fouch, M.J.; Fischer, K.M.; Wysession, M.E. Lowermost mantle anisotropy beneath the Pacific: Imaging the source of the Hawaiian plume. Earth Planet. Sci. Lett. 2001, 190, 167–180. [Google Scholar] [CrossRef]
  124. Russell, S.A.; Lay, T.; Garnero, E.J. Seismic evidence for small-scale dynamics in the lowermost mantle at the root of the Hawaiian hotspot. Nature 1998, 396, 255–258. [Google Scholar] [CrossRef]
  125. Russell, S.A.; Lay, T.; Garnero, E.J. Small-scale lateral shear velocity and anisotropy heterogeneity near the core–mantle boundary beneath the central Pacific imaged using broadband ScS waves. J. Geophys. Res. Solid Earth 1999, 104, 13183–13199. [Google Scholar] [CrossRef]
  126. Vinnik, L.; Romanowicz, B.; Le Stunff, Y.; Makeyeva, L. Seismic anisotropy in the D layer. Geophys. Res. Lett. 1995, 22, 1657–1660. [Google Scholar] [CrossRef]
  127. Vinnik, L.; Breger, L.; Romanowicz, B. Anisotropic structures at the base of the Earth’s mantle. Nature 1998, 393, 564–567. [Google Scholar] [CrossRef]
  128. Pulliam, J.; Sen, M.K. Seismic anisotropy in the core—Mantle transition zone. Geophys. J. Int. 1998, 135, 113–128. [Google Scholar] [CrossRef]
  129. Ritsema, J.; Lay, T.; Garnero, E.J.; Benz, H. Seismic anisotropy in the lowermost mantle beneath the Pacific. Geophys. Res. Lett. 1998, 25, 1229–1232. [Google Scholar] [CrossRef]
  130. Kendall, J.M.; Silver, P.G. Investigating Causes of D″ Anistropy. In The Core-Mantle Boundary Region; American Geophysical Union (AGU): Washington, DC, USA, 1998; pp. 97–118. [Google Scholar]
  131. Kawai, K.; Geller, R.J. The vertical flow in the lowermost mantle beneath the Pacific from inversion of seismic waveforms for anisotropic structure. Earth Planet. Sci. Lett. 2010, 297, 190–198. [Google Scholar] [CrossRef]
  132. Yamazaki, D.; Karato, S.I. Lattice-Preferred Orientation of Lower Mantle Materials and Seismic Anisotropy in the D″ Layer. In Post-Perovskite: The Last Mantle Phase Transition; American Geophysical Union (AGU): Washington, DC, USA, 2007; pp. 69–78. [Google Scholar]
  133. Wolf, J.; Long, M.D. Slab-driven flow at the base of the mantle beneath the northeastern Pacific Ocean. Earth Planet. Sci. Lett. 2022, 594, 117758. [Google Scholar] [CrossRef]
  134. Wang, J.; Lekić, V.; Schmerr, N.C.; Gu, Y.J.; Guo, Y.; Lin, R. Mesozoic intraoceanic subduction shaped the lower mantle beneath the East Pacific Rise. Sci. Adv. 2024, 10, eado1219. [Google Scholar] [CrossRef] [PubMed]
  135. Métaxian, J.P.; Lesage, P.; Valette, B. Locating sources of volcanic tremor and emergent events by seismic triangulation: Application to Arenal volcano, Costa Rica. J. Geophys. Res. Solid Earth 2002, 107, ECV–10. [Google Scholar] [CrossRef]
  136. Igel, H.; Schreiber, K.U.; Gebauer, A.; Bernauer, F.; Egdorf, S.; Simonelli, A.; Liny, C.J.; Wassermann, J.; Donner, S.; Hadziioannou, C.; et al. Romy: A multi-component ring laser for geodesy and geophysics. Geophys. J. Int. 2021, 225, 684–698. [Google Scholar] [CrossRef]
  137. Fichtner, A.; Igel, H. Sensitivity densities for rotational ground-motion measurements. Bull. Seismol. Soc. Am. 2009, 99, 1302–1314. [Google Scholar] [CrossRef]
  138. Bernauer, F.; Wassermann, J.; Igel, H. Dynamic tilt correction using direct rotational motion measurements. Seismol. Soc. Am. 2020, 91, 2872–2880. [Google Scholar] [CrossRef]
  139. Bernauer, M.; Fichtner, A.; Igel, H. Measurements of translation, rotation and strain: New approaches to seismic processing and inversion. J. Seismol. 2012, 16, 669–681. [Google Scholar] [CrossRef]
  140. Trifunac, M.D. Effects of torsional and rocking excitations on the response of structures. In Earthquake Source Asymmetry, Structural Media and Rotation Effects; Springer: Berlin/Heidelberg, Germany, 2006; pp. 569–582. [Google Scholar]
  141. Bernauer, M.; Fichtner, A.; Igel, H. Inferring Earth structure from combined measurements of rotational and translational ground motions. Geophysics 2009, 74, WCD41–WCD47. [Google Scholar] [CrossRef]
  142. Bernauer, M.; Fichtner, A.; Igel, H. Reducing nonuniqueness in finite source inversion using rotational ground motions. J. Geophys. Res. Solid Earth 2014, 119, 4860–4875. [Google Scholar] [CrossRef]
  143. Reinwald, M.; Bernauer, M.; Igel, H.; Donner, S. Improved finite-source inversion through joint measurements of rotational and translational ground motions: A numerical study. Solid Earth 2016, 7, 1467–1477. [Google Scholar] [CrossRef]
  144. Abreu, R.; Durand, S.; Rost, S.; Thomas, C. Deep Earth rotational seismology. Geophys. J. Int. 2023, 234, 2365–2374. [Google Scholar] [CrossRef]
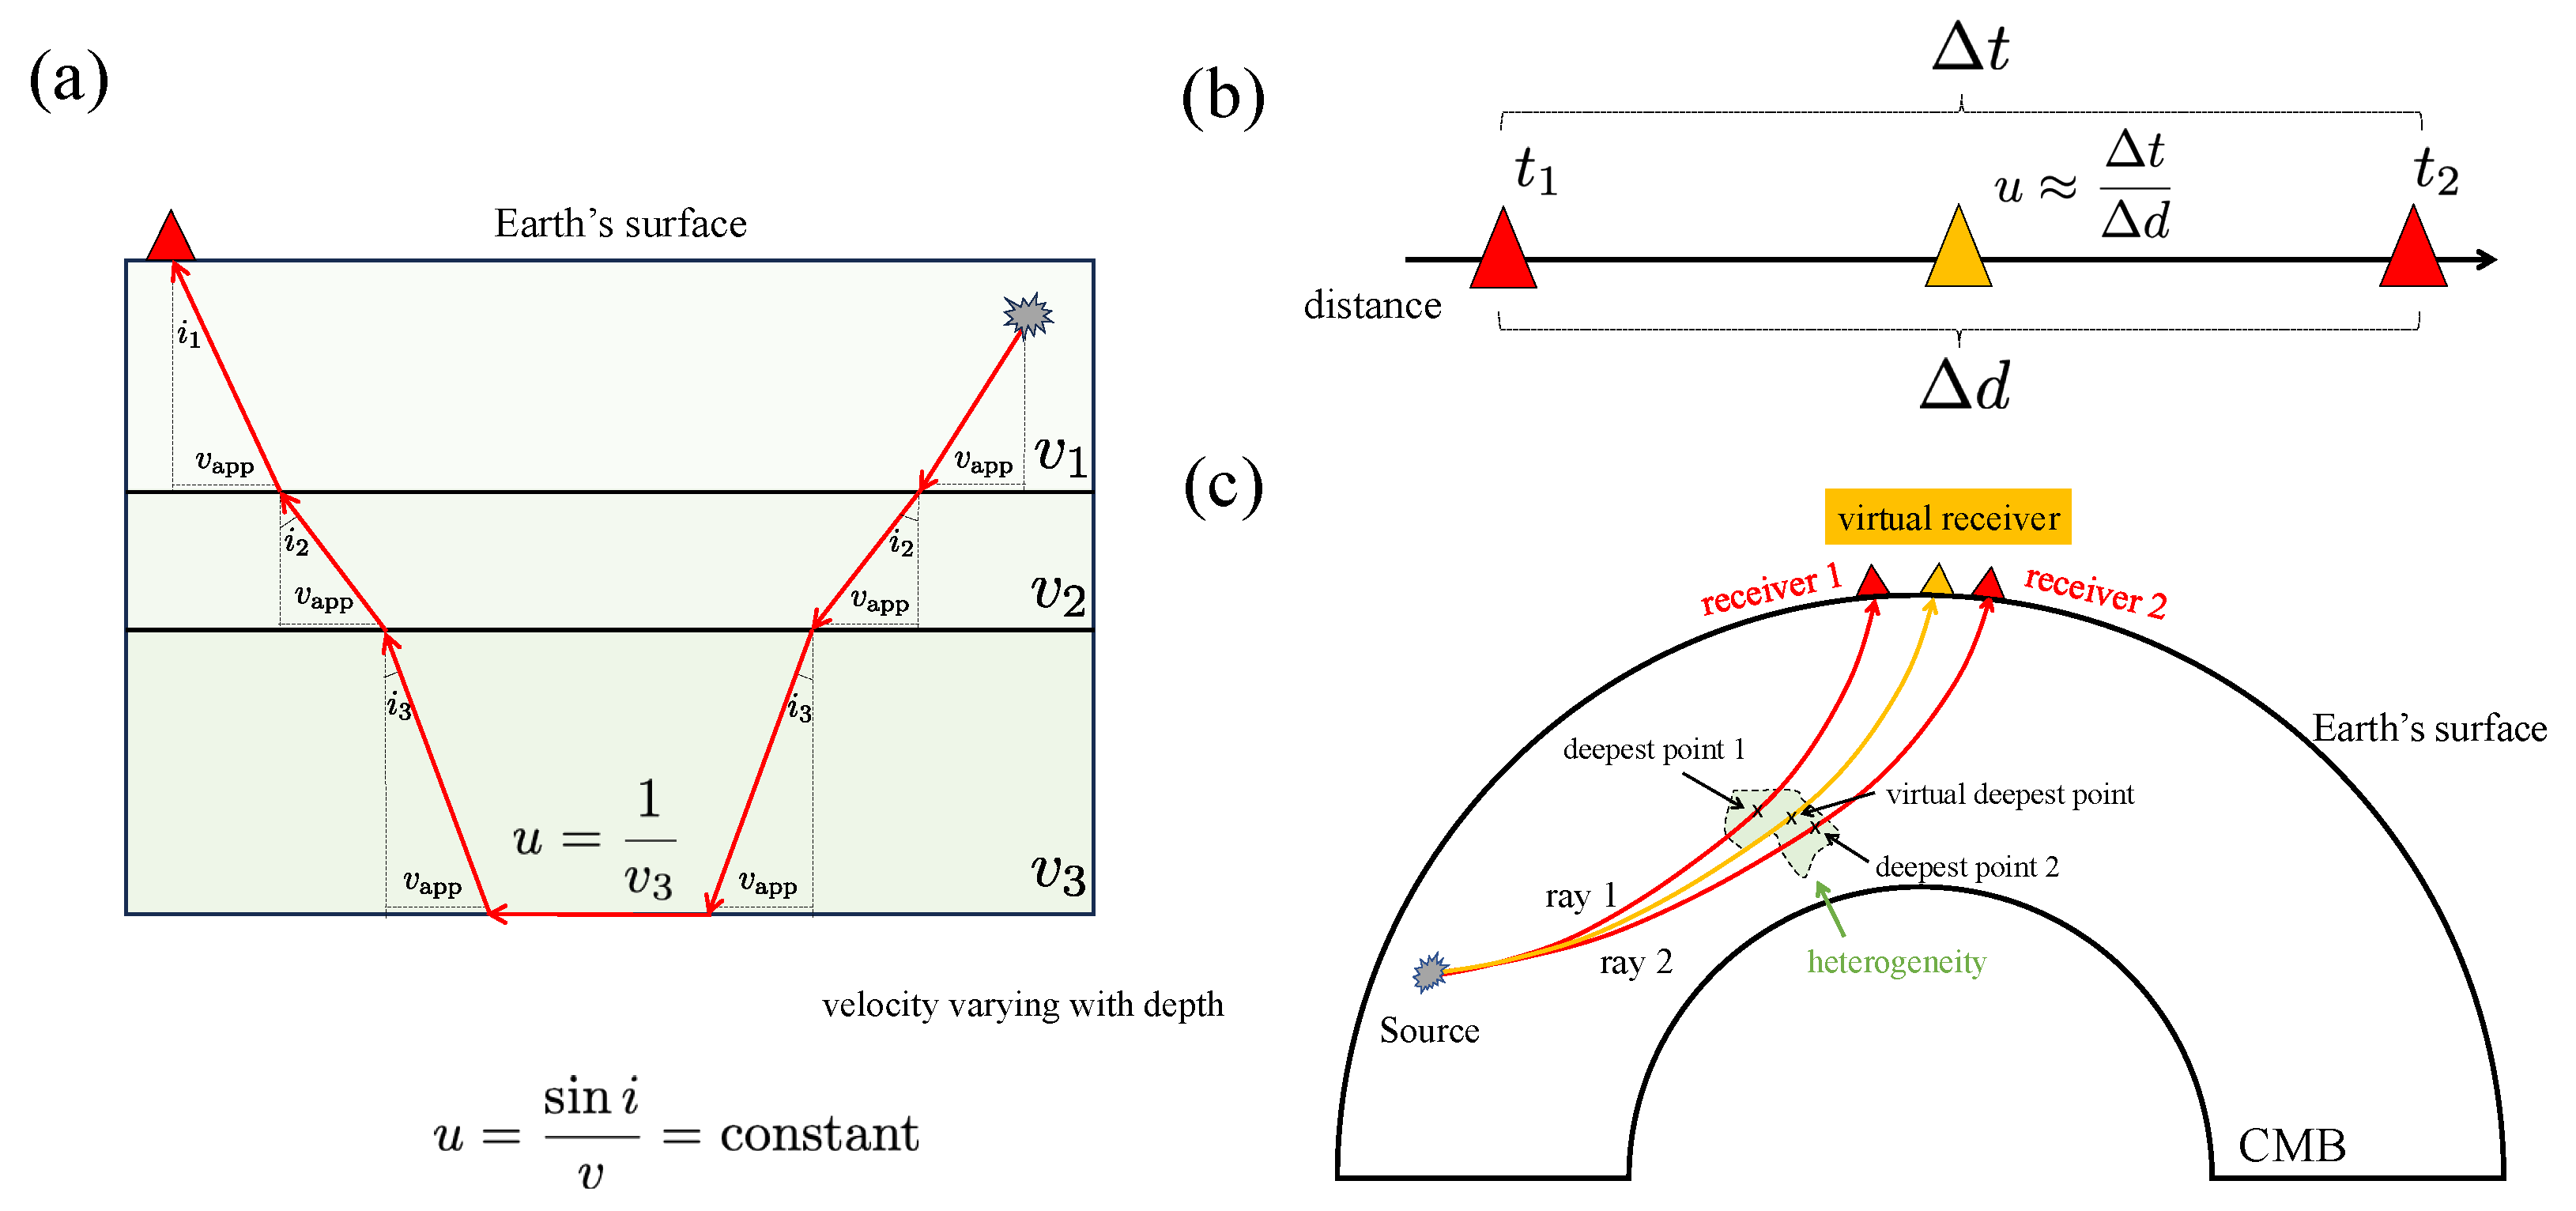
Figure 1. (a) Ray theory in a layered medium. (b) Second-order finite-difference slowness approximation. (c) The Virtual Receiver Approach methodology proposed in this study.
Geosciences 15 00102 g001
Figure 2. (a) Illustration of a 1D model v 0 and its corresponding predicted models for relative slowness calculations of ± 2 % predicted using Equation (4). (b) Predicted bouncing depth (i.e., deepest point or turning point of the ray) vs epicentral distance for S-wave phase as per different reference models (PREM [63], AK135 [64], SP6 [65] and IASP91 [66]). There are large differences in the prediction close to the base of the lower mantle, which affects the depth predictions retrieved from the application of the VRA.
Geosciences 15 00102 g002
Figure 3. Validation of the method. (a) Variation of the slowness relative error vs the interstation distance. (b) Variation of the slowness relative error vs the event depth. (c) Comparison between the theoretical vs predicted velocity perturbations. (d) Comparison between the theoretical vs predicted velocity perturbations for different ϵ parameters.
Geosciences 15 00102 g003
Figure 4. (a) Ray paths; stations in blue triangles, events in green stars, and the turning point of the ray in yellow circles. (b) Depth of the turning point of the rays.
Geosciences 15 00102 g004
Figure 5. (a) Shear wave velocity values estimated using the VRA and compared to PREM. (b) Normalized shear wave velocity values (with respect to PREM) estimated using the VRA.
Geosciences 15 00102 g005
Figure 6. Results obtained using the virtual receiver methodology compared against tomographic models at different depths. For clarity, the size of the velocity anomalies computed (circles) are scaled to their magnitudes.
Geosciences 15 00102 g006
Figure 7. (a) Location of the depth of the turning point of the rays and their corresponding velocity perturbations obtained using the VRA. (b) Vertical profile crossing the Pacific LLSVP and (c) vertical profile crossing the Galapagos plume. For clarity, the sizes of the velocity anomalies computed (circles) are scaled to their magnitudes.
Geosciences 15 00102 g007
Figure 8. Normalized travel time envelope density ρ kernels for the S wave when considering the presence of data at different time locations away from the observations (after [83]). (a) The case when the data travel time is far from the observations, which means that our Earth model is far from the real Earth. (b) The case when we have an accurate Earth model that closely (enough) represents the real Earth.
Geosciences 15 00102 g008
Figure 9. Compositional results obtained using the SEITCOMP code. The data is divided into three ranges and positive and negative anomalies are plotted in different columns.
Geosciences 15 00102 g009
Figure 10. Schematic representation of the presence of post-perovskite inside the Pacific LLSVP.
Geosciences 15 00102 g010
Figure 11. Schematic representation of the presence of anisotropy inside the Pacific LLSVP. (a) Stage 1: subducting slab. (b) Stage 2: Broken (stagnant?) slab. (c) Stage 3: Slab within the LLSVP (current state). Arrows show the direction of deformation.
Geosciences 15 00102 g011
Disclaimer/Publisher’s Note: The statements, opinions and data contained in all publications are solely those of the individual author(s) and contributor(s) and not of MDPI and/or the editor(s). MDPI and/or the editor(s) disclaim responsibility for any injury to people or property resulting from any ideas, methods, instructions or products referred to in the content.