Article

Records of Ground Deformation in Northern Kefalonia Inferred from Cosmogenic 36Cl Geochronology

by
Constantin D. Athanassas
1,*,
Regis Braucher
2,
Ioannis Vakalas
1 and
George Apostolopoulos
1
1
School of Mining and Metallurgical Engineering, National Technical University of Athens (NTUA), 15780 Athens, Greece
2
CEREGE, Aix Marseille Université, CNRS, IRD, INRAE, Collège de France, Europôle de l’Arbois BP 80, 13545 Aix-en-Provence, CEDEX 04, France
*
Author to whom correspondence should be addressed.
Geosciences 2025, 15(3), 94; https://doi.org/10.3390/geosciences15030094
Submission received: 30 October 2024 / Revised: 23 February 2025 / Accepted: 25 February 2025 / Published: 7 March 2025

Abstract

:
This study presents the first direct cosmogenic 36Cl-based chronology of landscape evolution and ground deformation in the Ionian Islands, focusing on the Thinia Valley in northern Kefalonia, western Greece. At the Zola site, exposure ages indicate that the eastern limb of the associated anticline has undergone intermittent deformation since at least 34 ka, with ongoing exhumation still occurring today. Variability in erosion rates suggests a complex deformation history, with lower-elevation samples exhuming faster than those at higher elevations. The findings highlight the role of progressive landslide activity rather than a single catastrophic failure. The compression-induced asymmetry of the Zola anticline, along with regional seismicity, appears to control slope instability. The exposure ages at the SK site reveal a surface that reached steady-state long before 20 ka, with a uniform erosion rate of 47.72 ± 0.82 m·Ma−1, consistent with regional estimates. Additionally, a prehistoric earthquake—dated at 4.8 ± 0.14 ka—has been identified, with a planar surface exhumed in a single slip event. These findings emphasize the tectonic mobility of the region, with deformation processes persisting since the Middle Pleistocene. The results contribute to a broader understanding of fault-controlled slope instability and have direct implications for seismic hazard assessment in actively deforming terrains.

Graphical Abstract

1. Introduction

Off the Ionian coasts of Greece, the active boundary of the Hellenic Arc involves the subduction of the oceanic lithosphere of the Eastern Mediterranean under both the continental Apulian (or Adriatic) and Aegean microplates as well as the continental collision of the Adriatic microplate onto Eurasia [1,2,3,4,5,6]. Around Kefalonia (Figure 1), convergence is expressed by the Kefalonia Transform Fault (KFT) which accommodates dextral strike-slip motion [5,7]. The KTF exhibits the highest crustal deformation rates in the Aegean area (s.l.), with slip rates of up to 25–30 mm∙yr−1 [8,9,10,11,12]. Therefore, Kefalonia is located on a seismically active, broad and right-lateral strike-slip crustal shear zone [3,5,12,13,14,15]. Additionally, slip rates of 14.3 mm∙yr−1 occur in the southern Paliki Peninsula (Figure 1). These high deformation rates result in frequent earthquakes with Mw > 6.0 [16] with a cyclicity ranging from 34 to nearly 300 years [12]. This temporal pattern is explained by stress transfer among adjacent fault segments [12,15]. Seismic activity has been ongoing, with the August 1953 seismic sequence of KFT (Mw = 6.8) being the most destructive event in the recent history of Greece [16,17,18,19,20,21,22,23,24].
Onshore Kefalonia, compressional tectonics dominates. A major thrust fault, the Ionian Thrust (Figure 1) marks the outermost Hellenide (Alpine) nappe, the Ionian nappe. The nappe exhibits notable northwest–southeast trending folds and thrust faults [25,26] within the Lower Jurassic carbonates of the Ionian Zone and is emplaced onto the relatively stable Apulian autochthon of the Paxoi (or Pre-Apulian) Zone on the eastern periphery of the Apulian plate [3]. While the precise age of all thrusts in the external regions of the Ionian nappe may not always be determined, they are evidently post-Miocene [3]. Several thrust faults have been identified as Plio-Quaternary in age, as Mesozoic carbonates overthrust not only Miocene but Pliocene and Quaternary strata [3,26]. These are partially explained by the ongoing westward Hellenide deformation [3] and partially by the rollback of the Hellenic slab [3,6,27,28,29,30,31,32,33].
Tectonic strain has been steadily accumulating in the topography of Kefalonia, as documented before [17,18,21,23]. Reverse faulting and subsequent folding are responsible for the generation of important relief in mountain ranges. Hermanns et al. [33,34] and Strecker and Marrett [35] showed that the frequency and location of landslides shifts in tandem with the motion of reverse faults. Slope failure then begins to operate [34,35,36,37,38,39]. Most topographic relief on Kefalonia associated with thrust faults is located in the uplifting hanging walls, creating sharply dipping topographic slopes. In northern Kefalonia, a pair of such extensive hanging walls are drawing near to each other forming a NNE–SSW trending isthmus, stretching between the Gulf of Argostoli to the SW and the Ionian Sea to the NE, known as the Thinia Valley (Figure 1). The Thinia Valley is bordered to the east by the western flanks of Mount Aenos (Figure 1 and Figure 2).
In tectonic regimes such as Kefalonia, several hundreds of smaller seismic events may occur each year (with major ones every few decades or centuries). Consequently, the stability of the bedrock becomes crucial, and in the event of a subsequent tectonic pulse, the structure becomes susceptible to gravitational collapse. North Kefalonia has experienced such co-seismic slope failure, observable in both contemporary times [24] and in the past [40,41]. The hillslopes of the Thinia valley are notably unstable, often experiencing periodic landslips due to failures along bedding planes [24,40,41] and that has led to the valley becoming infilled [40,41]. Consequently, the present valley configuration appears to be controlled not only by the bedrock geology and tectonics but also by recent processes of mass-wasting [40,41].
Numerical dating is crucial for characterizing the nature and the frequency of slope failure on Kefalonia. Cosmogenic 36Cl accumulated on bedrock surfaces has been found to be most suitable for dating landforms shaped on carbonate rocks [42,43,44,45]. Specifically, cosmogenic nuclides produced in bedrock surfaces in situ (also known as terrestrial cosmogenic nuclides) are the technique of choice for numerical dating of fault escarpments [42,43,44,45,46,47,48,49,50,51]. As of now, there have been relatively few attempts to exposure-date ancient landslides (e.g., [51,52,53,54,55,56,57,58,59,60,61]). Therefore, exposure dating of landforms across the Thinia Valley associated with slope failure using cosmogenic 36Cl holds a motivating challenge and opens up the possibility of exploring the frequency and origin of ground deformation in northern Kefalonia.

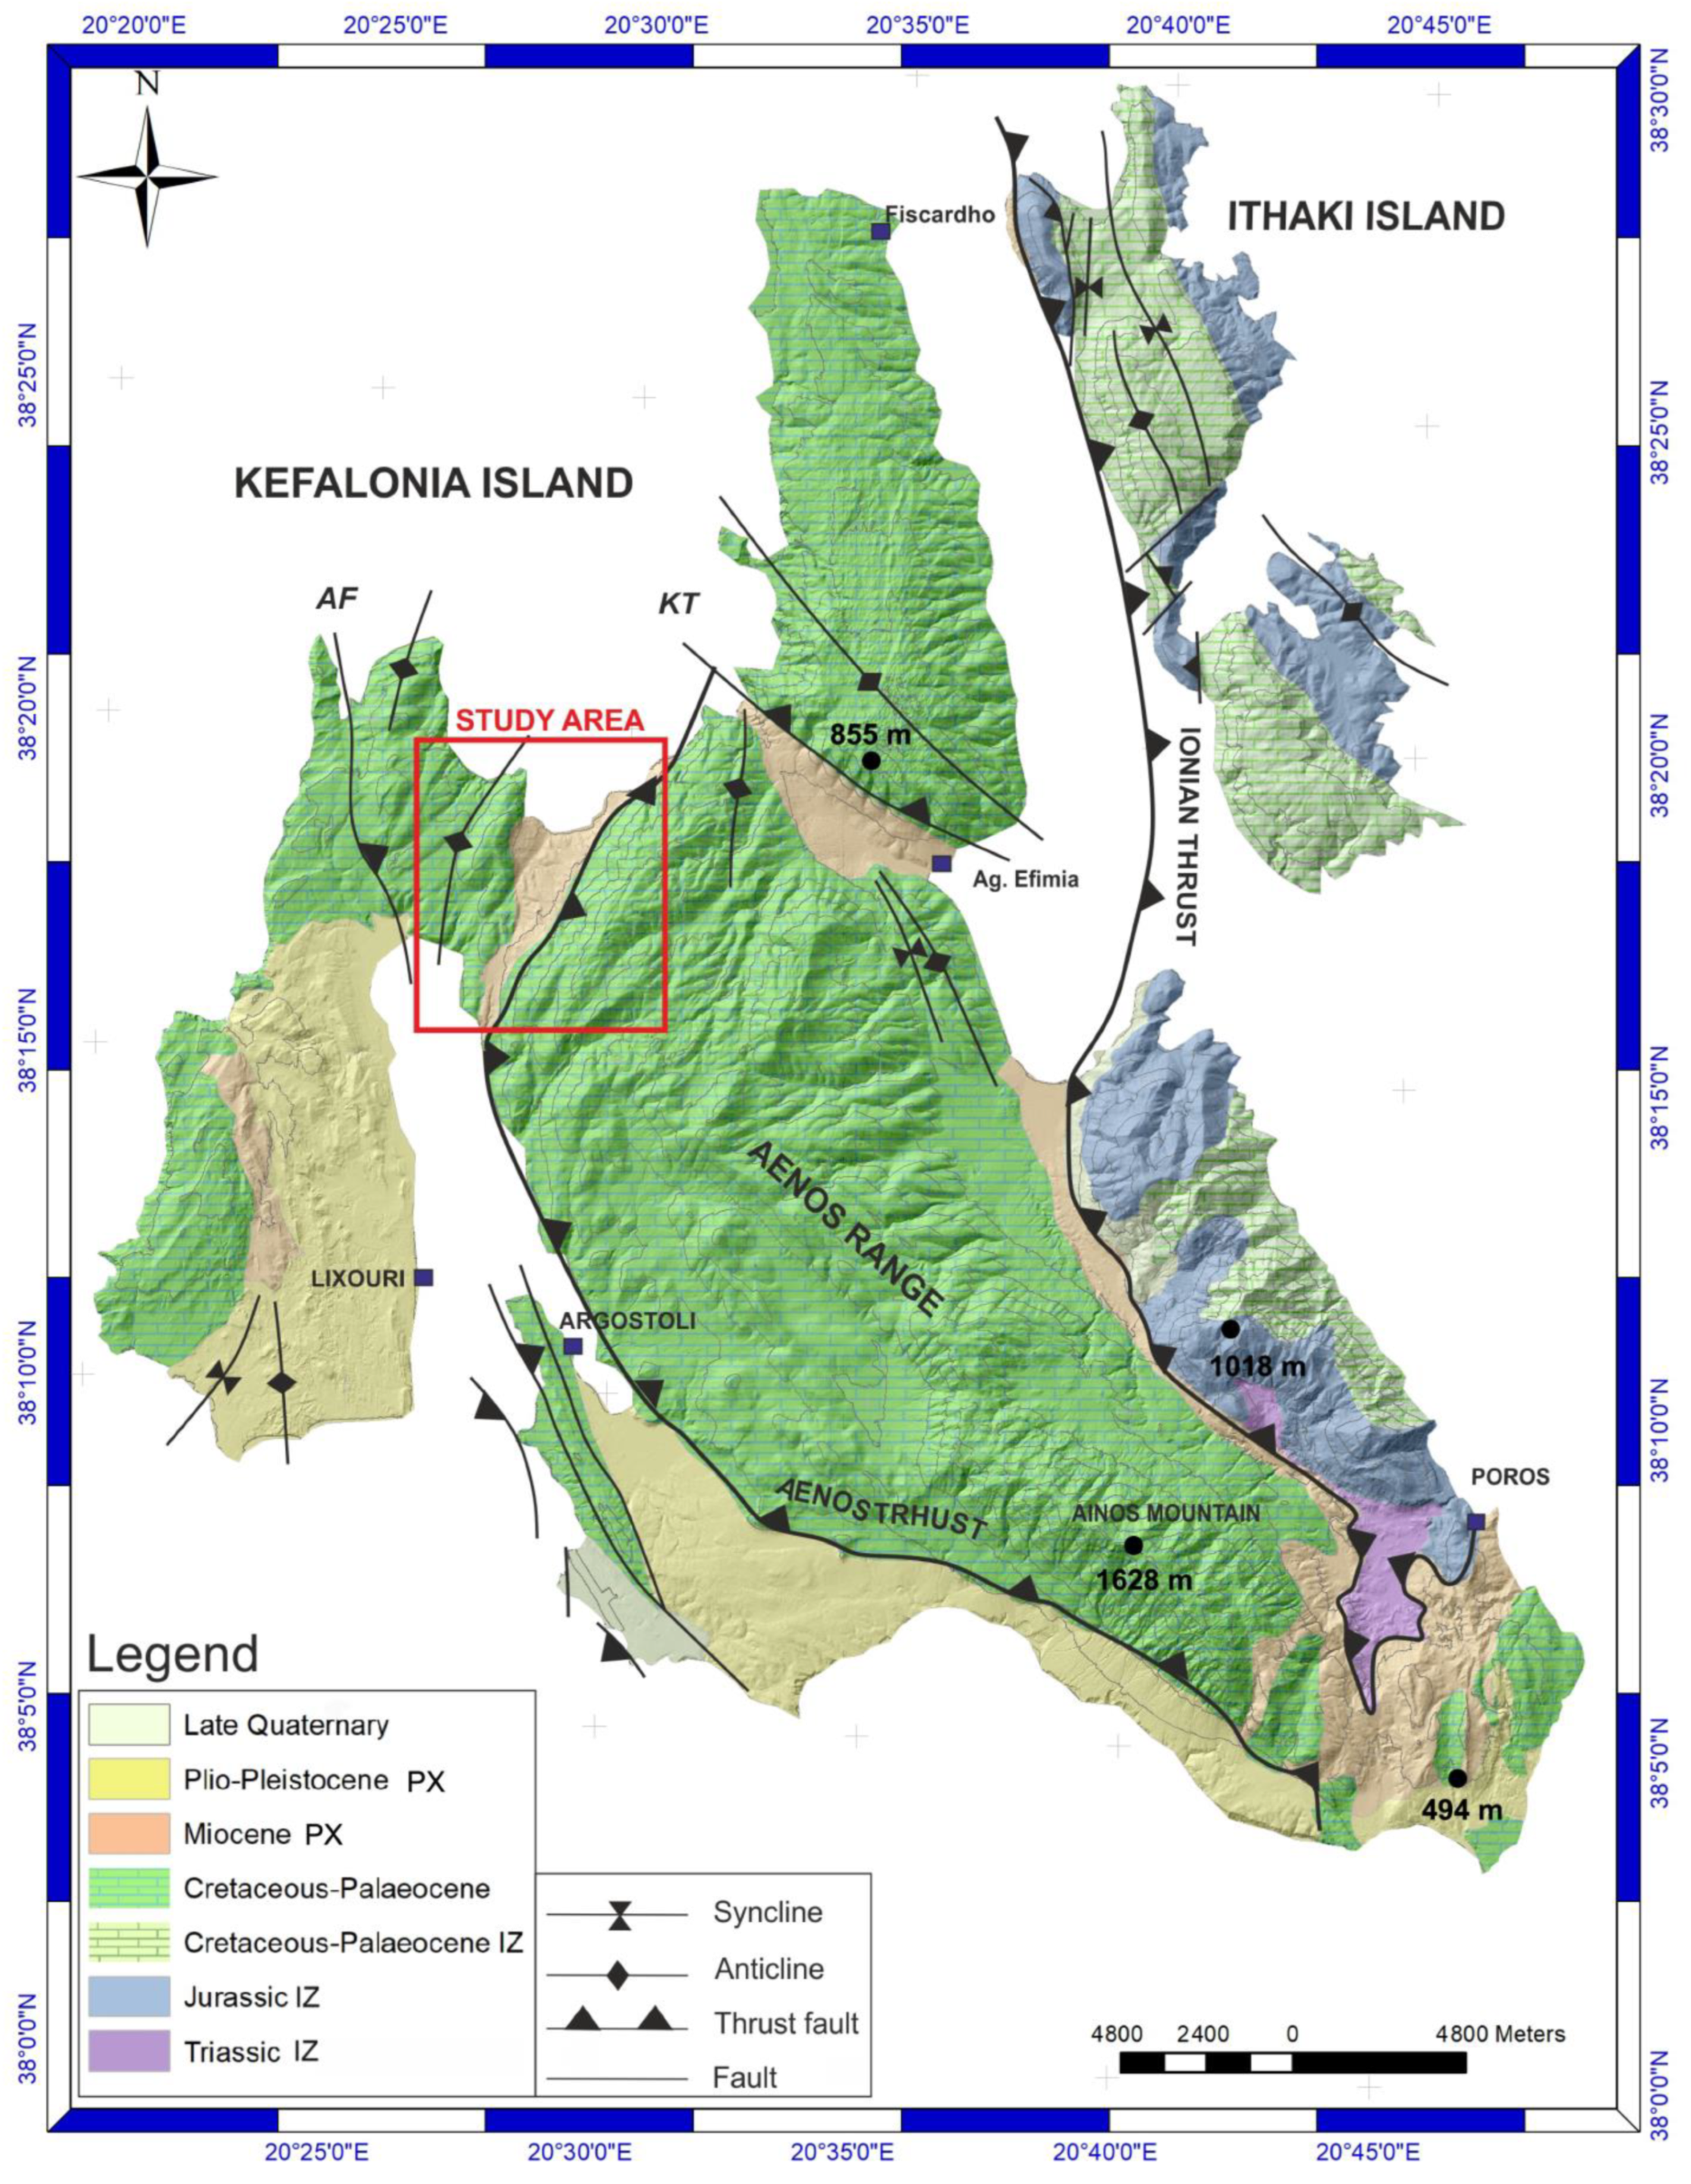
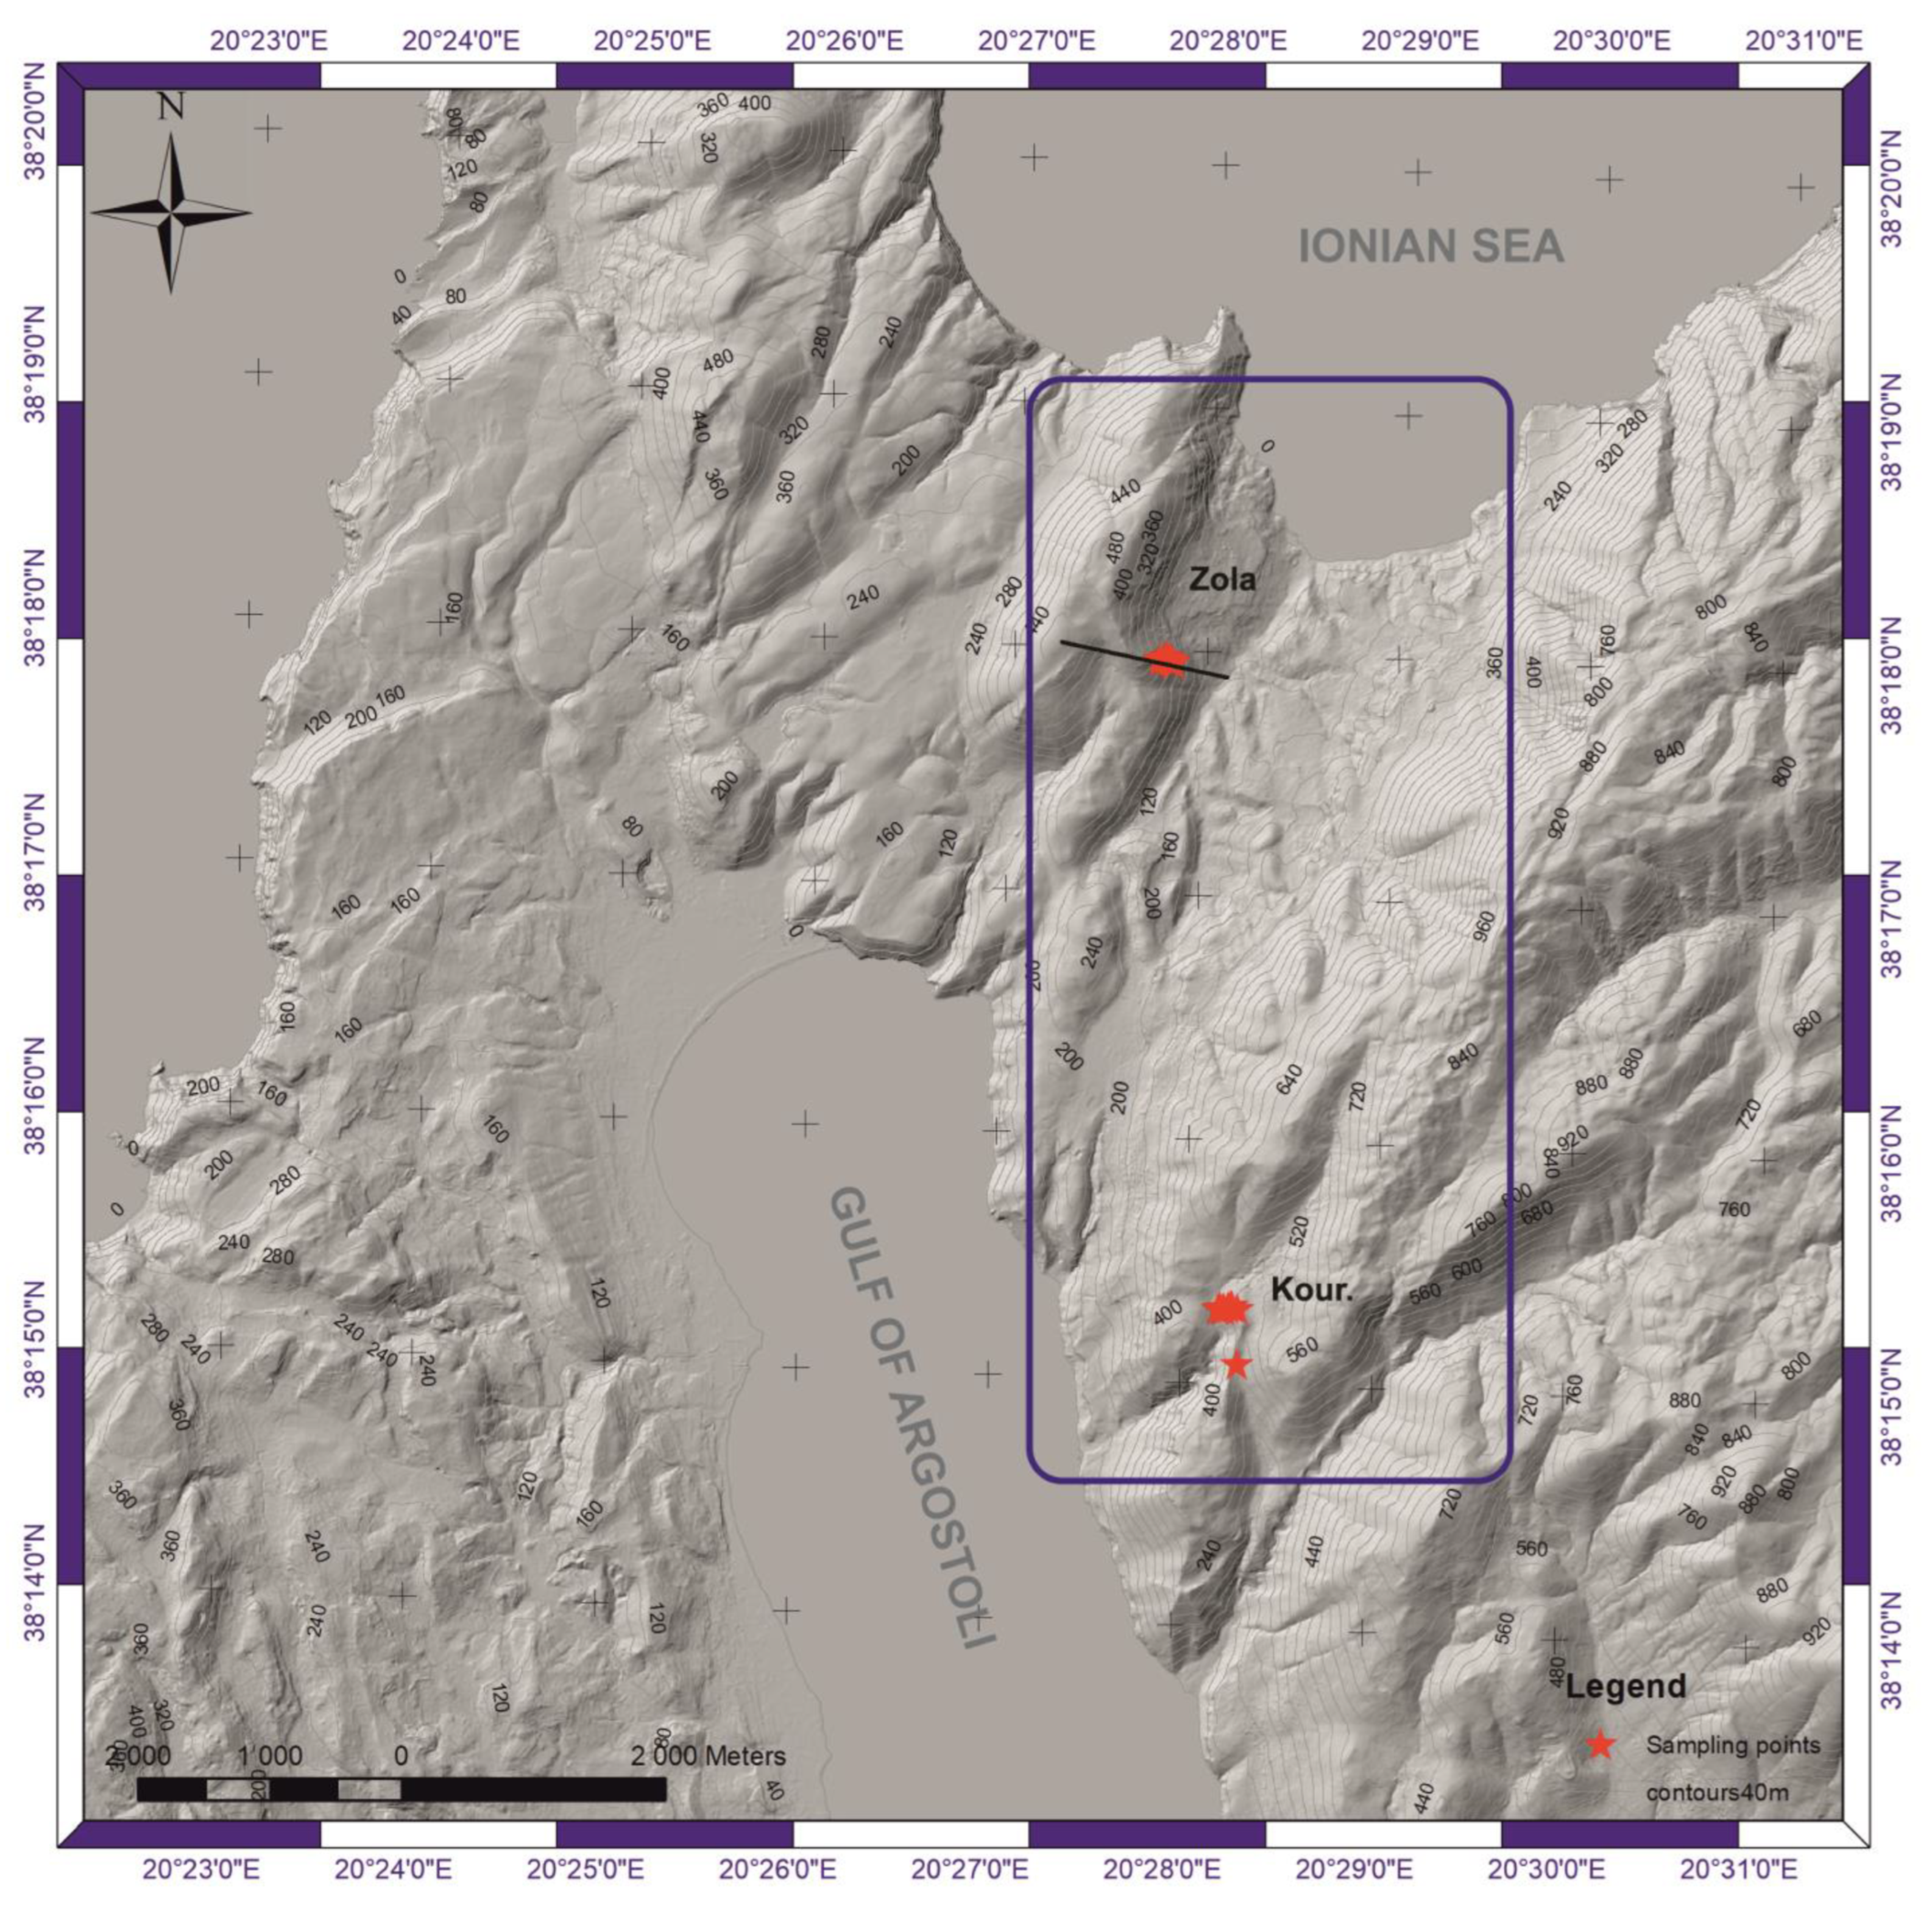
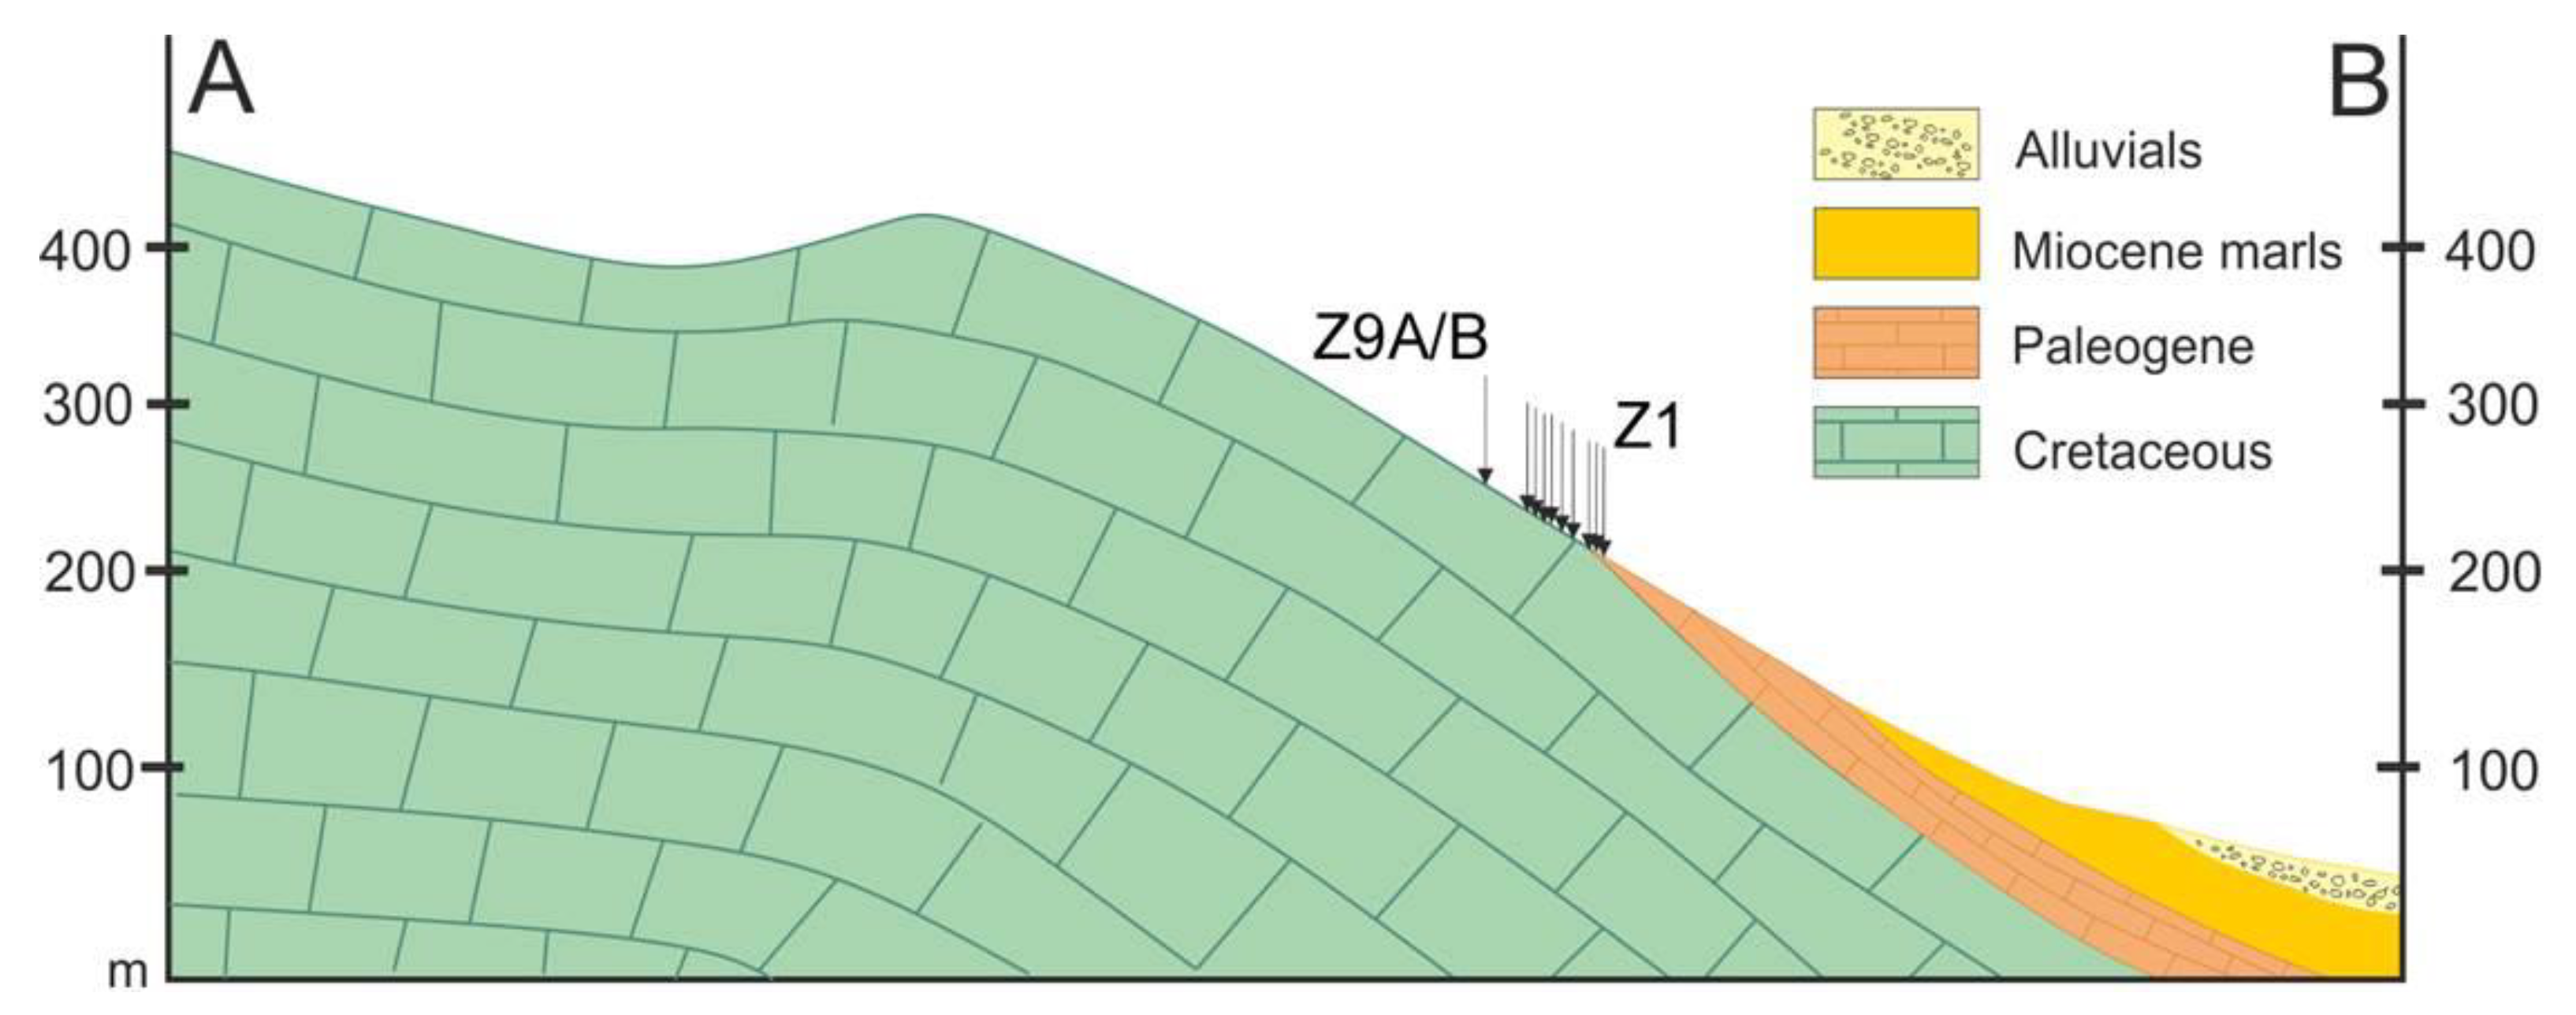
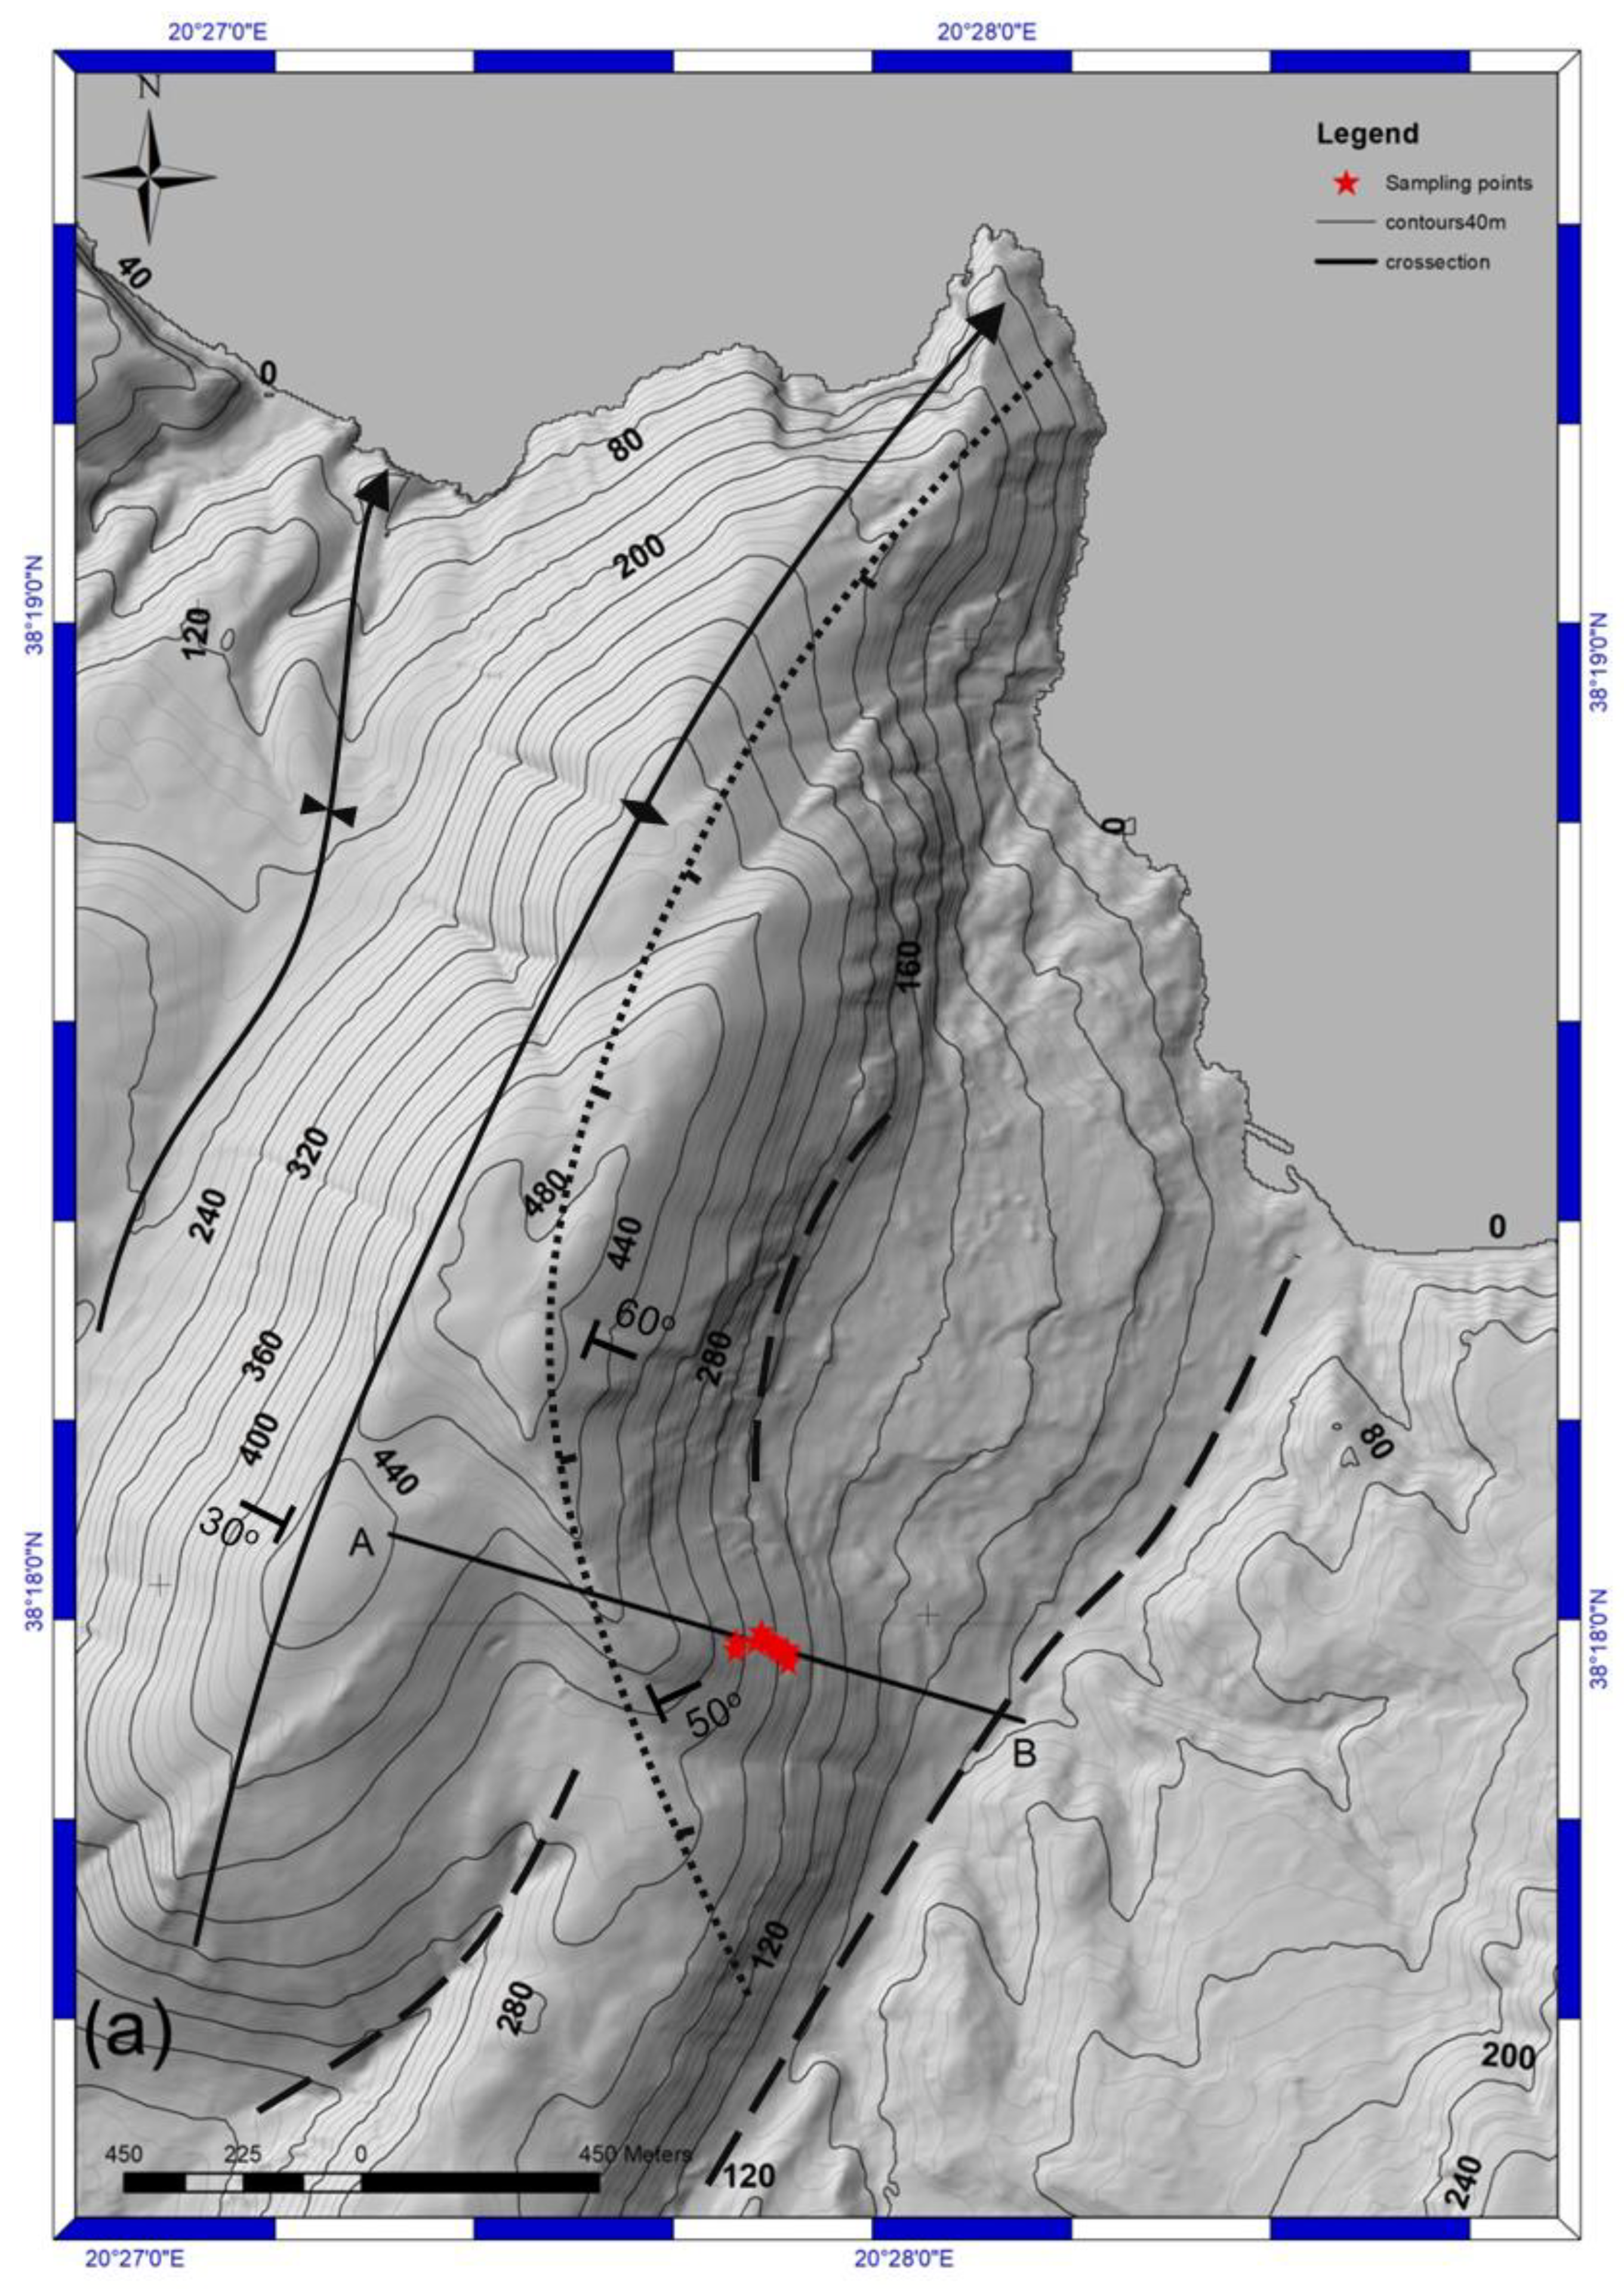
2. Geological Setting and Samples

Kefalonia, in common with the rest of the southern Ionian Islands (Ithaca and Zakynthos), mainly consists (Figure 1) of the alpine geotectonic zones of the Paxoi (also known as Pre-Apulian as it represents the transition to the Apulian platform [3]) and the Ionian Zone. The latter is the lithological content of the Ionian Nappe (Figure 1). The Upper Triassic–Upper Cretaceous carbonate sequence of the Ionian Zone (relatively allochthonous) is thrust on the Cretaceous carbonates and the Middle Miocene–Early Pliocene clastic sequence (consisting of marls, clays and limestones) of the Paxoi Zone (relatively autochthonous via the subhorizontal Ionian thrust [3]. The Ionian Nappe is emplaced through the thrust onto Miocene rocks of the Paxoi Zone [3,26]. Post-alpine deposits of Pliocene–Quaternary age lie unconformably on the alpine basement [3,26].
Shortening in the Ionian zone is evident throughout the island [3] as the available geological studies reveal [3,25]. A series of approximately north–south trending folds and at least one major thrust fault can be traced: the Aenos Thrust (Figure 1) is a major geological boundary that places the Mesozoic carbonates on the Miocene marls, marked by a prominent scarp (Figure 2 and Figure 3).
The Thinia Valley lies between the Gulf of Argostoli to the south and the Ionian Sea to the north (Figure 2). It spans a distance of 6 km with a maximum width of 2 km and an elevation at its center of approximately 180 m.a.s.l. The valley is enclosed by steep ranges on both sides, with the eastern flank reaching heights of nearly 1 km. The Paxoi carbonate rocks are overlain unconformably by Miocene marls (Figure 1 and Figure 3) and clastic sediments which dip gently eastward on the west slopes of the valley (Figure 3). The easterly dip increases towards the north and reaches their highest values near Zola.
According to field studies [40,41] around Zola, folding is expressed by two distinct bedding dips of the Cretaceous and Paleogene limestones, ~30° WNW and ~60° ENE, respectively, implying an asymmetric, inclined, east-verging anticline structure (Figure 4a). The anticline hinge is tentatively delineated in Figure 4. There is a significant dichotomy in the amount of ground deformation between the eastern and western limbs of the anticline (Figure 4). The western slopes exhibit a nearly homogenous slope in the NW direction with no visible signs of failure. In contrast, the ground on the eastern slopes of the anticline (western walls of the Thinia Valley) appear greatly deformed, with the Zola landslide being the most prominent natural terrain feature. The Zola landslide is well-defined by a ~300 m deep head scarp encircled by a ~3 km long crown on the perimeter. The landslide is interpreted as having formed through rotational sliding with local translational sliding (block slide). The ENE dips constrain the strata on the east limb of the structure to descend into the valley and this sets things up for failure. The toe of the landslide may be controlled by a thrust that has been deformed into a normal structure by long-term creep [40,41].
A close-up of the digital terrain model (Figure 4b) reveals several topographic breaks that are difficult to identify from ground level. Blink comparison of Google Earth imagery highlights these terrain features through temporal changes in reflectance and color. Notably, the 2013 imagery revealed several ruptures on the eastern limb, indicating a listric normal sense of motion (Figure 4b), with likely many more slip surfaces (of either rotational or translational movement) either obscured by vegetation or detectable with higher resolution imagery. In essence, folding induces slope collapse and sliding, rendering the western slopes of the Thinia Valley a polygenetic terrain, shaped by the blending of various endogenic and exogenic processes.
The eastern slopes of the Thinia Valley (Figure 5) constitute the western limb of a large hanging-wall anticline, which is a direct outcome of the Aenos Thrust emplacement. The Aenos Thrust has displaced the westward-dipping Cretaceous–Paleocene limestones onto the eastward-dipping Miocene sediments, although the precise location of the thrust is often obscured by rockfall debris [3,23,40,41]. The steep westerly dips of the Cretaceous and Paleogene limestones range from 45° to greater than 60°. The valley walls have experienced periodic landslips from both mountainsides [40,41].
Most available geological maps, such as those by the British Petroleum Company [62] or the Geological Map of Greece (Sheet: Island of Kefalonia Northern and Southern Section, scale 1:50,000, Institute of Geological and Mineral Research—IGME), illustrate faults without specifying the sense of motion. Jenkins [25] identifies normal, NE–SW trending faults cutting through the Aenos sheet near the western fringes of the Aenos Thrust (towards the Thinia Valley), which could be interpreted as the result of accommodation to the progressive thickening of the thrust sheet [3].
East of the Thinia Valley, the Aenos thrust sheet is characterized by sub-parallel, NE–SW trending elongated basins, divided by similarly trending ridges (Figure 5). The remaining open question is whether westerly dipping slopes have acted as slip surfaces along which volumes of rock within the NE–SW ridges slid westwards, with the currently exposed slopes representing the backscarps of the landslides (Prof. J. Underhill, pers. comm.). However, in a landscape aged by physical erosion and ongoing cliff-line evolution, evidence of sliding may have become indiscernible. A slope on one of the ridges within the Aenos Thrust in the Kourouklata area (Figure 2), located at the southwestern end of the valley (Figure 5), whose toe causes the streambed to deflect sinusoidally (Figure 5 and Figure 6), was selected for this type of investigation in an area.
Generally, the carbonate rocks around this site are affected by joints and short normal faults. South of the landform under study at this site a 1.20 m high, dip-slip planar surface was noticed (Figure 6 and Figure 7), vertically offsetting the ground surface by several decimeters. Planar surfaces with this sense of motion are not unusual in an overall compressive regime but they do not seem to form any systematic patterns. Such structures form where compressive strain drops [63].
There are two approaches for carrying out exposure dating in the context of land-slipped escarpments [54]: dating the faces of scarps or dating blocks found within debris lobes.
These methods both hold the potential to provide the age at which the landslide detached from its source area. However, various factors can introduce biases into exposure ages within these environments. When dating scarp faces, there is a risk of overestimating the landslide’s age if the sampled surface is shallow (see the issue of inheritance addressed later). Conversely, if the sampled rock surface has weathered substantially, the estimated deposition age would again be underestimated. On the other hand, exposure ages for blocks originating from the surface may also appear older than they actually are. Blocks within or atop of debris lobes may have undergone post-deposition movement, or they might have been unearthed from beneath the original surface of the debris.
At the first site, Zola, there is convincing evidence of in situ rock slip surfaces. Surfaces associated with secondary ruptures (traced as certain or probable in Figure 4) within the principal landslide escarpment, occasionally embed secondary translational surfaces formed by superficial block sliding (mass wasting). At the scale of the entire landslide, this pattern is most evident at the highest sampling point (Figure 8), where the escarpment exhumed by the large rotational landslide (where sample Z09A comes from) is notched by a localized translational block detachment (where sample Z09B points to). The distribution of localized block sliding (mass wasting) appears random and unsystematic when sampling along the predefined traverse. The distinction between the secondary rupture surfaces (Figure 4) and rockslide surfaces is not always discernible at ground level. Apart from the well-constrained site Z09, we acknowledge that we are sampling with an ambiguous geomorphological signal below this point. While the volume of rock exhumed by the major landslide can be relatively well estimated—by assessing the “depth” of each sample below the ground surface before the occurrence of the principal landslide—it is nearly impossible to quantify the thickness of local mass wasting that has occurred around each sample spot. This issue is discussed in relation to the inheritance of cosmogenic 3⁶Cl.
Bedrock samples (Z1—Z09A/B, Table 1) were collected at increasing heights along a traverse on the eastern limb of the anticline (Figure 4), which marks the western boundary of the Thinia Valley. All samples come from an exhumed face scarp flanking the Zola landslide to the south and formed in the Cretaceous carbonate bedrock (Figure 3).
Age determination might help slope characterization at the southern site as well. If the movements were gradual, different exposure-age dates would be expected along the supposed landslide surface. This would help determine whether the displacement occurred in a single event, with uniform ages, or whether it was incremental over time (Prof. J. Underhill, pers. comm.). The gently dipping surface illustrated in Figure 5 and Figure 6 was sampled (SK01–SK08) along a more-or-less E–W traverse. Regarding the fracture plain south of the traverse (Figure 6 and Figure 7), each time it (seismically) slips the lower segment of the plane becomes exposed to cosmic radiation and starts to accumulate cosmogenic 36Cl. Therefore, the concentration of cosmogenic 36Cl increases with exposure time, and therefore height, serving as a proxy of the rate of tectonic slip [43,44,45,46,47,48,49,50,51] and, by implication, of the upward growth of the local topography. Absence of pits and gullies on the planar surface suggests insignificant erosion. Eight (FK01–FK08) rectangular (5 cm high × 15 cm long × 2.5 cm thick) tiles were cut out along a single, continuous, base-to-top, profile parallel to the fault dip direction (Figure 7) using a cutting wheel. Spatial information of the collected samples is provided in Table 1.

3. Methodology

The accumulation of terrestrial cosmogenic nuclides on eroding rock surfaces can be described by the following generalized equation adapted from Lal [64]:
C t = C i n e λ t + 1 i P i λ + ρ ε / Λ ι 1 e ( λ + ρ ε Λ ι ) t
In this equation C ( t ) represents the concentration of a specific cosmogenic nuclide (here 36Cl) at time t in years. i denotes the type of production pathway (e.g., spallation, thermal and epithermal neutron capture, fast muons, slow muon capture). In surface rocks, the production of cosmogenic 36Cl occurs through spallation caused by high-energy neutrons (10–103 MeV) interacting with target elements such as Ca, K, Ti and Fe, along with the capture of low-energy (thermal and epithermal) neutrons (0.025–100 MeV) by 35Cl. Additionally, the capture of slow negative muons by Ca and K contributes a smaller fraction of 36Cl compared to that generated by the neutron flux at the Earth’s surface.
Furthermore, high-energy (relativistic) muons generate energetic bremsstrahlung gamma radiation as they decelerate in matter, which can lead to the disintegration of nuclei and the release of neutrons. If these neutrons undergo thermalization, they can be captured by atoms to produce 36Cl [65]. C i n is the concentration of any inherited amount of the nuclide resulting from previous exposures. P i stands for the surface production rate through pathway i (measured in atoms g−1a−1).   λ represents the decay constant (a−1) if the nuclide is radioactive ((2.303 ± 0.016).10−6 a−1 corresponding to a 36Cl half-life ( T 1 / 2 ) of 3.014.105 a). Λ i represents the characteristic attenuation length (g·cm−2) of production pathway i , i.e., the depth at which cosmic-ray flux intensity is reduced by a factor of e 1 . ε denotes the erosion rate (mm·a−1), which affects the long-term nuclide concentration at the surface.
If erosion is zero and the rock surface has reached a steady state (meaning that in situ production of cosmogenic 36Cl is balanced by its loss through radioactive decay), then solving Equation (1) for t yields only the minimum age, since the exposure duration beyond the time required for steady state cannot be determined from the measured concentration. In the given equation, the erosion rate ( ε ), is implicitly dependent on both concentration and time. In the long run, several erosion rates can result in steady state and the asymptotic condition only provides the maximum permissible erosion rate compatible with the observed concentration. At a higher erosion rate, the predicted concentration in steady-state would be lower than the observed value, which is physically impossible. Therefore, setting the limit t   and solving the equation for ε yields only an upper bound on the erosion rate. A serious issue which should not be overlooked while estimating cosmogenic ages is inheritance [51,52,53,54,55,56,57,58,59,60,61].
Prior to bedrock exhumation, the topography is constantly showered by cosmic rays, which penetrate several meters into the bedrock. Therefore, the production of cosmogenic nuclide persists to some depth while diminishing exponentially along the way. After a new surface cuts through the topography (e.g., a landslide escarpment or a fault plane), the isotopes previously accumulated at depth remain in the freshly exposed surface (this is known as inheritance), and are supplemented by the newly accumulating 36Cl isotopes at the surface.
A simplistic exposure model could have been employed, accounting only for the current topographic shielding and the latitudinal scaling of the cosmic ray flux. Nevertheless, when accounting for the relationship between the initial topographic surface (i.e., before landsliding) and the present landslide escarpment, it becomes necessary to adjust nuclide production rates at depth prior to exhumation. Neglecting inherited 36Cl will lead to inaccurate exposure ages. The inheritance factor is theoretically influenced by three main variables: (1) the long-term surface erosion rate, (2) the depth beneath the surface, and (3) the material density [66]. Despite numerous studies on slip rate determination on fault scarps [47,67,68,69,70,71], most assume a long planar fault scarp that has been gradually exhumed from the bottom up by multiple events. Additionally, these approaches typically require a large number of samples for dating. Thus, the pre-exposure depth of the samples was estimated relative to the initial surface.
In this research, we follow a simpler approach as applied in similar studies [61,72,73,74,75] allowing for the determination of exposure ages corrected for inheritance using locally derived long-term erosion rates. This model is illustrated in Figure 9. We illustrate this model with two samples, a and b (Figure 9, left). Sample a (the reference sample) is assumed to have remained exposed at the surface both before and after the landslide, maintaining a constant production rate with unchanged topographic shielding conditions. Since sample a is assumed to be in steady state, it is used to determine the local long-term erosion rate. Sample b, on the other hand, represents any sample that was buried at depth before the landslide, experiencing a production rate P ( x b ). After exhumation on the scarp (depth = 0), it becomes exposed to a new production rate ( P ) which is adjusted to reflect the new topographic shielding conditions. To determine the exposure age of sample b, one must first estimate the inherited 36Cl concentration accumulated at depth x b ( C b , Figure 9) using the long-term local denudation rate derived from sample a. To accurately date landsliding events, the exposure age of the scarp is then determined to match the measured concentration ( C b , Figure 9).
In practice, implementing this approach for modeling inheritance requires reconstructing the former landscape by making an educated guess about the original topography, before the sliding event. This can be achieved by extending the pre-failure topography from the reference point to the toe of the landslide and calculating the sample depths relative to this inferred surface. For the FK site (Figure 9), the pre-exposure geometry is straightforward, as the offset can be directly measured along the clearly defined planar surface in the field. All these depths are presented in Table 1. The inherited nuclide concentrations have been modeled for each sample spot (accounting for nuclide production at depth and using Equation (1)) based on the erosion rate of a reference sample assumed to have been in a steady state (usually the highest sample, Z09A).
The carbonate samples were chemically processed following standard procedures [42,56,57,61]. The 36Cl and 35Cl concentrations were measured by isotope dilution Accelerator Mass Spectrometry at the French AMS national facility ASTER, CEREGE, Aix-en-Provence [76], and normalized to the 36Cl standard (SM-CL12, prepared by S. Merchel) with a 36Cl/35Cl ratio of (1.428 ± 0.02) ×10−12 [77]. Analytical uncertainties account for counting statistics, machine stability, and blank correction (36Cl/35Cl blank ratio is 2.2408.10−15 ± 23%). The blank correction represents 0.3% to 2.38% of the sample concentrations (Table 1). Calcium content was determined via ICP-OES (ICAP 6500, Thermo). All concentrations are presented in Table 1. Age determination followed the approach of Schimmelpfennig et al. [78], allowing for the calculation of 36Cl production rates at sea-level and high latitude spallation production rates updated as follows: 42.2 ± 4.8 at·g−1 for Ca [79]; 148.1 ± 7.8 at·g−1 for K [80]; 13 ± 3 at·g−1 for Ti [81] and 1.9 ± 0.2 at·g−1 for Fe [82]. The production rate of epithermal neutrons from fast neutrons at the land–atmosphere interface was taken as 696 ± 185 at·g−1 from Marrero et al. [83]. All production rates were scaled following Stone’s polynomial [66] and corrected for topographic shielding, which was measured in the field using a compass and clinometer.

4. Results

Table 1 provides the AMS-measured concentrations of 36Cl and 35Cl. The approach for correcting inheritance was inconclusive in a few cases, as the estimated inherited content exceeded the measured concentration (Table 2). This discrepancy implies that the adopted model for inheritance calculation was ineffective for some samples rendering their age estimates uncertain.
Erosion rates, determined using the actual topographic shielding, are presented in Table 2 and range from 33.83 ± 1.54 to 134.87 ± 8.78 m·Ma−1 (Figure 10). Nevertheless, the higher values exceed those typically considered average for uniformly exhuming ground surfaces in Mediterranean contexts [84,85,86,87]. The higher values likely indicate complex exhumation processes rather than uniform erosion, suggesting localized variations in ground deformation, such as translational rockfall or secondary rupturing, within the broader landslide scarp. A prominent peak in the erosion-rate distribution (Figure 10) at 50.69 ± 0.94 m·Ma−1 can be identified as the representative erosion rate, which aligns with the average documented regional erosion rate [84,85,86,87]. At this erosion rate, some samples appear far from steady state, allowing for the calculation of an apparent exposure age. Conversely, others seem to have reached a steady state. In Zola, notably large exposure ages for samples Z04,06,07,08 suggest steady state, while ages ranging between 20 and 34 ka, along with an isolate age at 1.3 ka, highlight distinct phases within the landslide’s history. Similar observations hold for the other site to the south (SK samples). The FK site exhibits ages clustered around 4.8 ka, except for one outlier (Figure 11).
Table 1. Sample location, topographic shielding (measured in the field), pre-exposure sample depth, 36Cl & 35Cl concentrations and %Ca content. For FK samples, the topographic shielding before the slip event was estimated as 0.85.
SampleLat.Long.ElevationShieldingDepth36Cl35Cl%Ca
(m a.s.l.) (m)(at/g)(ppm)
SK0138.2577720.473034040.860735,717 ± 33,685239.359
SK0238.2579720.472553890.860715,670 ± 32,5151040.090
SK0338.2579720.472433860.860549,114 ± 25,545840.139
SK0438.2578820.47223780.860741,515 ± 81,6274440.784
SK0538.2577620.47193710.860738,992 ± 335172940.022
SK0638.2578120.471813670.860576,172 ± 26,0054239.722
SK0738.2578620.471543580.860513,814 ± 22,7572239.825
SK0838.2577220.471333510.860658,402 ± 29,9332040.013
FK0138.2577220.471333660.430.50306,710 ± 18,08610325.111
FK0238.2540920.47323660.430.55295,629 ± 16,1598926.075
FK0338.2540920.47323660.430.65265,267 ± 15,6069424.765
FK0438.2540920.47323660.430.75268,455 ± 16,3969425.808
FK0538.2540920.47323660.430.85262,391 ± 14,7339225.833
FK0638.2540920.47323660.430.95260,559 ± 18,79310125.257
FK0738.2540920.47323660.431.05222,756 ± 14,5048126.201
FK0838.2540920.47323660.431.15238,940 ± 13,3277727.776
Z0138.3019820.465232160.90363,183 ± 16,1721139.757
Z0238.3019620.465132180.982355,935 ± 16,6803239.818
Z0338.3019820.465042330.967293,212 ± 13,2391439.934
Z0438.3020320.46502370.963630,575 ± 28,3452839.774
Z0538.3020620.464942380.962341,582 ± 15,2982439.791
Z0638.3020920.464832440.956628,376 ± 28,3532739.911
Z0738.3022520.464682520.948522,870 ± 23,5152639.034
Z0838.3020820.464562550.945535,861 ± 25,7081539.508
Z09A38.3020720.464142820.90775,022 ± 35,3482739.855
Z09B38.3019320.464132810.51428,512 ± 19,1421340.040
Table 2. Samples, sample numbers used in Figure 10 and Figure 11, minimum exposure ages (assuming no erosion), long-term erosion rates, inheritance content (when applicable) and exposure ages calculated with and erosion rate of 51 m·Ma−1.
SampleΝοMin. Age Max . ε InheritanceAgeComment
(ka)(m/Ma)(at/g)
SK01128.94 ± 1.3339 ± 1.79663,9031.43 ± 0.07
SK02224.19 ± 1.145.48 ± 2.07737,006N.A.Exces. inher.
SK03318.76 ± 0.8760.45 ± 2.81727,097N.A.Exces. inher.
SK04428.11 ± 3.0943.98 ± 4.84741,515N.A.Ref. sample
SK05525.89 ± 1.1744.4 ± 2.01745,148N.A.Exces. inher.
SK06622.75 ± 1.0356.01 ± 2.53711,452N.A.Exces. inher.
SK07721.05 ± 0.9359.67 ± 2.64670,693N.A.Exces. inher.
SK08825.93 ± 1.1845.97 ± 2.09684,125N.A.Exces. inher.
FK01923.91 ± 1.4196.41 ± 5.68212,8785.06 ± 0.3-
FK021025.19 ± 1.3898.5 ± 5.38203,2195.26 ± 0.29-
FK031126.47 ± 1.56107.22 ± 6.31186,1264.41 ± 0.26-
FK041228.94 ± 1.77110.89 ± 6.77182,6084.71 ± 0.29-
FK051329.74 ± 1.67112.97 ± 6.34169,8565.46 ± 0.31-
FK061432.65 ± 2.35116.03 ± 8.37162,8795.62 ± 0.41-
FK071534.04 ± 2.22134.87 ± 8.78155,1703.6 ± 0.23-
FK081637.81 ± 2.11129.48 ± 7.22150,5905.06 ± 0.28-
Z011713.21 ± 0.5988.04 ± 3.92616,190N.A.Exces. inher.
Z021815.1 ± 0.7186.3 ± 4.04033.51 ± 1.57-
Z031911.65 ± 0.53106.46 ± 4.81520.63 ± 0.93-
Z042022.89 ± 1.0350.06 ± 2.2591930.71 ± 86.79Steady state
Z052114.4 ± 0.6589.48 ± 4.011130.84 ± 1.38-
Z062224.84 ± 1.1247.8 ± 2.16292540.84 ± 114.64Steady state
Z072325.13 ± 1.1351.31 ± 2.31106194.9 ± 8.76Steady state
Z082425.84 ± 1.2449.00 ± 2.351732367.83 ± 113.6Ref. sample
Z09A2536.07 ± 1.6533.83 ± 1.54775,025N.A.Ref for Z09B
Z09B2632.18 ± 1.4451.21 ± 2.29412,8711.26 ± 0.061.26 ± 0.06

5. Discussion

The exposure ages reported here provide the first direct estimates of the timing of landscape evolution and ground deformation in the Ionian Islands. At the Zola site, variability in erosion rates implies a more complex ground deformation history of the Zola landslide. Samples from lower elevations appear to be exhuming faster than those situated higher up. The exposure ages indicate that ground deformation on the eastern limb of the associated anticline has occurred intermittently since at least the Late Quaternary to historical times, as ages ranging between 34 and 1.3 ka suggest. This deformation is recorded within the older landslide escarpment, crowned by the high cliff at the upper part of the escarpment (Figure 2, Figure 4 and Figure 8), whose ages exceed the dating range of the here used cosmogenic isotope (36Cl). The presence of distinctly younger segments of mass wasting within the principal surface, distributed over tens of thousands of years rather than caused by a single catastrophic event, represents a pattern of progressive exhumation, a pattern also observed in other similar studies benefited from cosmogenic nuclides [56,89,90]. All evidence points to a landslide that was triggered long before 30 ka (perhaps in the Middle Pleistocene) and has continued to experience slow deformation almost to this day.
This raises an important question: why the eastern limb of the anticline has been collapsing since at least the Late Quaternary, while no comparable deformation is documented on the western limb which, in essence, is equivalent to understanding why the ENE dips (50–60°) are steeper than the westerly ones (~30°), as shown in Figure 4, creating more favorable conditions for slope failure in the Thinia Valley. Rises in temperature and precipitation are considered crucial in triggering slope failure. Therefore, it is not surprising that many recent large-scale landslides, particularly in the Alpine belt, coincide with the onset of the Holocene (see above references). Indeed, the Holocene is characterized by significant warming and increased precipitation following deglaciation. These climatic shifts played a key role in initiating and exacerbating slope failures. However, in tectonically active regions like the Ionian Islands [91], seismic activity is a major contributor to bedrock weakening, likely exceeding the impact of climatic influences. Failure mechanisms are initiated along planes of weakness, primarily bedding planes. Regional earthquakes appear powerful enough to trigger landslides. Careful observation of the available aerial imagery (Figure 4b) also reveals longitudinal ruptures seated deeper into the bedrock, displaying a normal sense of motion. This pattern of ground deformation is unlikely to result solely from climatic factors or co-seismic superficial mass wasting. Instead, it more plausibly reflects a structural response to the progressive growth of the fold [3].
Hermanns et al. [33,34] and Strecker and Marrett [35] demonstrated that the frequency and location of landslides associated with reverse faults in mountain ranges (Andes) shift in tandem with the locus of compression. Explicit landsliding events in the Andes occurred 400 ka ago and repeated with a 30 ka cyclicity until 150 ka, when it is assumed that the locus of tectonic deformation migrated farther into the Andean foreland. Similarly, folding in northern Kefalonia appears to be primarily driven by thrust-fault bend folding [3,25]. This process has induced an asymmetric dip in the Zola anticline, making its eastern limb more susceptible to landsliding.
Additional evidence comes from the Copernicus European Ground Motion Service (EGMS). Velocity markers on the thrust sheet east of the Thinia Valley (Figure 12) indicate an almost uniform westerly displacement of 7-8 mm·y−1. However, on the eastern limb of the anticline, near the Zola landslide, the westward velocity decreases over a distance of 2 km, with multiple markers on this limb registering velocities less than 3 mm·y−1. This apparent deceleration—nearly halved within such a short distance—raises the question of whether it represents a resultant motion, where the relative velocity of the faster-moving foreland combines with that of an eastern limb deforming eastward, thereby reducing its net forward movement in the foreland’s direction. In this scenario, the eastern limb of the anticline may represent the forelimb, meaning it serves as the active limb of the anticline making it, thus, susceptible to ongoing ground deformation due to the redistribution of its rock mass through deep-seated breakdown. Should these hypotheses hold, they suggest that we may be observing a tectonically mobile mountain which had been evolving before the Middle Pleistocene, as indicated by the current cosmogenic 36Cl dating, and may still be undergoing deformation today. Nonetheless, additional structural data are required to confirm these interpretations.
However, at the secondary site to the south (SK), most cosmogenic 36Cl dates reflect a surface that reached steady state well before 20 ka ago (Table 2) and has, since then, been eroding almost uniformly at an average rate of 47.72 ± 0.82 m·Ma−1, consistent with the documented regional erosion rate [84,85,86,87]. Previous drilling campaigns north of the site at 107 m a.s.l. recovered loose rockfall deposits extending down to 15 m below sea level, oriented north to south [40,41]. Notably, the marine microfossil Emiliania huxleyi was found intermixed with older loose rockfall sediments within the top 40 m of the borehole [40,41]. Additionally, gravity surveys conducted across the eastern side of the valley revealed negative Bouguer anomalies, indeed suggesting the presence of buried rockfall deposits. Therefore, although the eastern slopes of the Thinia Valley indeed experience rockfall [40], the uniform erosion rates across this topographic surface do not indicate a complex exhumation history characteristic of a major slip surface.
Regarding the planar surface south of the SK site (Figure 8 and Figure 9), all samples—except for one outlier—cluster around an age of 4.8 ± 0.14 ka. This suggests that the fault was exhumed in a single event. This provides evidence for a prehistoric earthquake that displaced the ground surface by 1.20 m.

6. Conclusions

The cosmogenic 36Cl analysis conducted in this research provides the first direct chronological framework for landscape evolution and ground deformation in the Ionian Islands, with a particular focus on the Thinia Valley, northern Kefalonia. The findings contribute significantly to the understanding of regional tectonic and geomorphic processes: (1) This research confirms the long-term activity of the Zola landslide, establishing a terminus ante quem of approximately 34 ka, indicating a history of protracted and episodic slope instability rather than a singular catastrophic event. (2) A reassessment of a previously hypothesized landslide reveals that the surface in question has undergone uniform exhumation through gradual erosion rather than discrete slip events. (3) A prehistoric earthquake has been identified and dated, with evidence of a 1.20 m ground displacement, providing new constraints on active faulting and regional deformation. These findings underscore the dynamic nature of landscape evolution in this tectonically active setting and highlight the value of integrating cosmogenic nuclide dating into geohazard assessments. By differentiating recent deformation events from relict structures, this approach enables the identification of unstable slopes, refines hazard recurrence intervals, and quantifies erosion rates and rock mass redistribution in regions experiencing ongoing uplift and erosion.

Author Contributions

Conceptualization, C.D.A.; methodology, R.B. and C.D.A.; fieldwork, C.D.A.; Software, I.V.; investigation, C.D.A.; data curation, C.D.A., R.B. and I.V.; writing—original draft preparation, C.D.A.; writing—review and editing, C.D.A. and R.B.; project administration, G.A.; funding acquisition, G.A. All authors have read and agreed to the published version of the manuscript.

Funding

Fieldwork and dating of the samples was funded by the Odysseus Unbound Foundation (OUF).

Data Availability Statement

The raw data supporting the conclusions of this article will be made available by the authors on request.

Acknowledgments

J. R. Underhill (Aberdeen University, Scotland, UK) and P. Styles (Keele University, England, UK) are gratefully thanked for introducing the authors to the Thinia Valley and Zola landslide and an exchange of valuable ideas in the field and when conceiving the paper. ASTER AMS, national facility (CEREGE, Aix en Provence), is supported by the INSU/CNRS and IRD and member of AIX MARSEILLE PLATFORMS and REGEF networks. Aster Team (G. Aumaître, K. Keddadouche, F. Zaïdi) is acknowledged for the AMS measurements. We thank three anonymous reviewers for their constructive comments which improved the manuscript overall.

Conflicts of Interest

The authors declare no conflicts of interest.

References

  1. McKenzie, D.P. Active tectonics of the Alpine-Himalayan belt: The Aegean Sea and surrounding regions. Geophys. J. R. Astr. Soc. 1978, 55, 217–254. [Google Scholar] [CrossRef]
  2. Le Pichon, X.; Lyberis, N.; Angelier, J.; Renards, V. Tectonics of the hellenic trench: A synthesis of sea-beam and submersible observations. Tectonophysics 1982, 86, 243–274. [Google Scholar] [CrossRef]
  3. Underhill, J.R. Late Cenozoic Deformation of the Hellenic Foreland 1982, Western Greece. Geol. Soc. Am. Bull. 1989, 101, 613–634. [Google Scholar] [CrossRef]
  4. Royden, L.H. The tectonic expression slab pull at continental convergent boundaries. Tectonics 1993, 12, 303–325. [Google Scholar] [CrossRef]
  5. Louvari, E.; Kiratzi, A.A.; Papazachos, B.C. The Cephalonia transform fault and its extension to western Lefkada Island (Greece). Tectonophysics 1999, 308, 223–236. [Google Scholar] [CrossRef]
  6. Özbakir, A.D.; Govers, R.; Fichtner, A. The Kefalonia Transform Fault: A STEP fault in the making. Tectonophysics 2020, 787, 228471. [Google Scholar] [CrossRef]
  7. Baker, C.; Hatzfeld, D.; Lyon-Caen, H.; Papadimitriou, E.; Rigo, A. Earthquake mechanisms of the Adriatic Sea and Western Greece: Implications for the oceanic subduction-continental collision transition. Geophys. J. Int. 1997, 131, 559–594. [Google Scholar] [CrossRef]
  8. Papadimitriou, E.E. Mode of strong earthquake recurrence in the central Ionian Islands (Greece): Possible triggering due to Coulomb stress changes generated by the occurrence of previous strong shocks. Bull. Seismol. Soc. Am. 2002, 92, 3293–3308. [Google Scholar] [CrossRef]
  9. Papazachos, C.B.; Kiratzi, A.A. A detailed study of the active crustal deformation in the Aegean and surrounding area. Tectonophysics 1996, 253, 129–153. [Google Scholar] [CrossRef]
  10. Kahle, H.G.; Müller, M.V.; Geiger, A.; Danuser, G.; Mueller, S.; Veis, G.; Billiris, H.; Paradissis, D. The strain field in northwestern Greece and the Ionian Islands: Results inferred from GPS measurements. Tectonophysics 1995, 249, 41–52. [Google Scholar] [CrossRef]
  11. Cocard, M.; Kahle, H.G.; Peter, Y.; Geiger, A.; Veis, G.; Felekis, S.; Paradissis, D.; Billiris, H. New constraints on the rapid crustal motion of the Aegean region: Recent results inferred from GPS measurements (1993–1998) across the West Hellenic Arc, Greece. Earth Planet. Sci. Lett. 1999, 172, 39–47. [Google Scholar] [CrossRef]
  12. Kourouklas, C.; Papadimitriou, E.; Karakostas, V. Long-Term Recurrence Pattern and Stress Transfer along the Kefalonia Transform Fault Zone (KTFZ), Greece: Implications in Seismic Hazard Evaluation. Geosciences 2023, 13, 295. [Google Scholar] [CrossRef]
  13. Scordilis, E.; Karakaisis, G.F.; Karakostas, V.; Panagiotopoulos, D.G.; Comninakis, P.E.; Papazachos, B.C. Evidence for Transform Faulting in the Ionian Sea: The Cephalonia Island earthquake sequence of 1983. Pure Appl. Geophys. 1985, 123, 388–397. [Google Scholar] [CrossRef]
  14. Kiratzi, A.; Langston, C. Moment tensor inversion of the 1983 January 17 Kefallinia event of Ionian Island (Greece). Geophys. J. Int. 1991, 105, 529–538. [Google Scholar] [CrossRef]
  15. Papadimitriou, E. Focal mechanisms along the convex side of the Hellenic Arc. Boll. Geof. Teor. Appl. 1993, 140, 401–426. [Google Scholar]
  16. Triantafyllou, I.; Papadopoulos, G.A. Earthquakes in the Ionian Sea, Greece, Documented from Little-Known Historical Sources: AD 1513–1900. Geosciences 2023, 13, 285. [Google Scholar] [CrossRef]
  17. Pirazzoli, P.; Stiros, S.; Laborel, J.; Laborel-Deguen, F.; Arnold, M.; Papageorgiou, S.; Morhangel, C. Late-Holocene shoreline changes related to palaeoseismic events in the Ionian Islands, Greece. Holocene 1994, 4, 397–405. [Google Scholar] [CrossRef]
  18. Stiros, S.; Pirazzoli, P.A.; Laborel, J.; Laborel-Doguen, F. The 1953 earthquake in Cephalonia (Western Hellenic Arc): Coastal uplift and halotectonic faulting. Geophys. J. Int. 1994, 117, 834–849. [Google Scholar] [CrossRef]
  19. Rondoyianni, T.; Sakellariou, M.; Baskoutas, J.; Christodoulou, N. Evaluation of active faulting and earthquake secondary effects in Lefkada Island, Ionian Sea, Greece: An overview. Nat. Hazards 1994, 61, 843–850. [Google Scholar] [CrossRef]
  20. Papadopoulos, G.A.; Karastathis, V.K.; Koukouvelas, I.; Sachpazi, M.; Baskoutas, G.; Agalos, A.; Daskalaki, E.; Minadakis, G.; Moshou, A.; Mouzakiotis, A.; et al. The Cephalonia, Ionian Sea (Greece), sequence of strong earthquakes of January–February 2014: A first report. Res. Geophys. 2014, 4, 5441. [Google Scholar] [CrossRef]
  21. Lekkas, E.L.; Mavroulis, S.D. Earthquake environmental effects and ESI 2007 seismic intensities of the early 2014 Cephalonia (Ionian Sea, Western Greece) earthquakes (January 26 and February 3, Mw 6.0). Nat. Hazards 2014, 78, 1517–1544. [Google Scholar] [CrossRef]
  22. Valkaniotis, S.; Ganas, A.; Papathanasiou, G.; Papanikolaou, M. Field observations of geological effects triggered by the January–February 2014 Cephalonia (Ionian Sea, Greece) earthquakes. Tectonophysics 2014, 630, 150–157. [Google Scholar] [CrossRef]
  23. Mavroulis, S.; Lekkas, E. Revisiting the Most Destructive Earthquake Sequence in the Recent History of Greece: Environmental Effects Induced by the 9, 11 and 12 August 1953 Ionian Sea Earthquakes. Appl. Sci. 2021, 11, 8429. [Google Scholar] [CrossRef]
  24. Mavroulis, S.; Diakakis, M.; Kranis, H.; Vassilakis, E.; Kapetanidis, V.; Spingos, I.; Kaviris, G.; Skourtsos, E.; Voulgaris, N.; Lekkas, E. Inventory of Historical and Recent Earthquake-Triggered Landslides and Assessment of Related Susceptibility by GIS-Based Analytic Hierarchy Process: The Case of Cephalonia (Ionian Islands, Western Greece). Appl. Sci. 2022, 12, 2895. [Google Scholar] [CrossRef]
  25. Jenkins, D.A.L. Structural development of Western Greece. AAPG Bull. 1972, 56, 128–149. [Google Scholar]
  26. Underhill, J.R. Triassic Evaporites and Plio-Quaternary Diapirism in Western Greece. J. Geol. Soc. Lond. 1988, 145, 209–282. [Google Scholar] [CrossRef]
  27. Le Pichon, X.; Angelier, J. The hellenic arc and trench system: A key to the neotectonic evolution of the eastern mediterranean area. Tectonophysics 1979, 60, 1–42. [Google Scholar] [CrossRef]
  28. Karakostas, V.G.; Papadimitriou, E.E.; Papazachos, C.B. Properties of the 2003 Lefkada, Ionian Islands, Greece, earthquake seismic sequence and seismicity triggering. Bull. Seismol. Soc. Am. 2004, 94, 1976–1981. [Google Scholar] [CrossRef]
  29. Ganas, A.; Elias, P.; Bozionelos, G.; Papathanassiou, G.; Avallone, A.; Papastergios, A.; Valkaniotis, S.; Parcharidis, I.; Briole, P. Coseismic deformation, field observations and seismic fault of the 17 November 2015 M = 6.5, Lefkada Island, Greece earthquake. Tectonophysics 2016, 687, 210–222. [Google Scholar] [CrossRef]
  30. Saltogianni, V.; Moschas, F.; Stiros, S. The 2014 Cephalonia Earthquakes: Finite Fault Modeling, Fault Segmentation, Shear and Thrusting at the NW Aegean Arc (Greece). Pure Appl. Geophys. 2018, 175, 4145–4164. [Google Scholar] [CrossRef]
  31. Svigkas, N.; Atzori, S.; Kiratzi, A.; Tolomei, C.; Antonioli, A.; Papoutsis, I.; Salvi, S.; Kontoes, C. On the Segmentation of the Cephalonia–Lefkada Transform Fault Zone (Greece) from an InSAR Multi-Mode Dataset of the Lefkada 2015 Sequence. Remote Sens. 2019, 11, 1848. [Google Scholar] [CrossRef]
  32. Royden, L.H.; Papanikolaou, D.J. Slab segmentation and late Cenozoic disruption of the Hellenic arc. Geochem. Geophys. Geosystems 2011, 12, Q03010. [Google Scholar] [CrossRef]
  33. Hermanns, R.L.; Niedermann, S.; Villanueva Garcia, A.; Sosa Gomez, J.; Strecker, M.R. Neotectonics and catastrophic failure of mountain fronts in the southern intra-Andean Puna Plateau, Argentina. Geology 2001, 29, 619–623. [Google Scholar] [CrossRef]
  34. Hermanns, R.L.; Strecker, M.R. Structural and lithological controls on large Quaternary rock avalanches (sturzstroms) in arid northwestern Argentina. Geol. Soc. Am. Bull. 1999, 111, 934–948. [Google Scholar] [CrossRef]
  35. Strecker, M.R.; Marrett, R. Kinematic evolution of fault ramps and its role in development of landslides and lakes in the northwestern Argentine Andes. Geology 1999, 27, 307–310. [Google Scholar] [CrossRef]
  36. Jackson, L.E., Jr. Landslides and landscape evolution in the Rocky Mountains and adjacent foothills area, southwestern Alberta, Canada. In Catastrophic Landslides: Effects, Occurrence, and Mechanisms; Evans, S.G., Degraff, J.V., Eds.; Reviews in Engineering Geology; Geological Society of America: Boulder, CO, USA, 2002; Volume 15, pp. 325–344. [Google Scholar]
  37. Agliardi, F.; Zanchi, A.; Crosta, G.B. Tectonic vs. gravitational morphostructures in the central Eastern Alps (Italy): Constraints on the recent evolution of the mountain range. Tectonophysics 2009, 474, 250–270. [Google Scholar] [CrossRef]
  38. Agliardi, F.; Crosta, G.B.; Zanchi, A.; Ravazzi, C. Onset and timing of deep-seated gravitational slope deformations in the eastern Alps, Italy. Geomorphology 2009, 103, 113–129. [Google Scholar] [CrossRef]
  39. Penna, I.; Hermanns, R.L.; Folguera, A.; Niedermann, S. Multiple slope failures associated with neotectonic activity in the southern central Andes (37°–37°30′ S). Patagonia, Argentina. Geol. Soc. Am. Bull. 2011, 123, 1880–1895. [Google Scholar] [CrossRef]
  40. Underhill, J.R. Quest for Ithaca. Geoscientist 2006, 16, 4–29. [Google Scholar]
  41. Underhill, J. Relocating Odysseus’ Homeland. Nat. Geosci. 2009, 2, 455–458. [Google Scholar] [CrossRef]
  42. Pérouse, E.; Sébrier, M.; Braucher, R.; Chamot-Rooke, N.; Bourles, D.; Briole, P.; Sorel, D.; Dimitrov, D.; Arsenikos, S. Transition from collision to subduction in Western Greece: The Katouna–Stamna active fault system and regional kinematics. Int. J. Earth Sci. 2017, 106, 967–989. [Google Scholar] [CrossRef]
  43. Mechernich, S.; Schneiderwind, S.; Mason, J.; Papanikolaou, I.D.; Deligiannakis, G.; Pallikarakis, A.; Binnie, A.S.; Dunai, T.J.; Reicherter, K. The Seismic History of the Pisia Fault (Eastern Corinth Rift, Greece) from Fault Plane Weathering Features and Cosmogenic 36Cl Dating. J. Geophys. Res. Solid Earth 2018, 123, 4266–4284. [Google Scholar] [CrossRef]
  44. Iezzi, F.; Roberts, G.; Faure Walker, J.; Papanikolaou, I.; Ganas, A.; Deligiannakis, G.; Beck, J.; Wolfers, S.; Gheorghiu, D. Temporal and spatial earthquake clustering revealed through comparison of millennial strain-rates from 36Cl cosmogenic exposure dating and decadal GPS strain-rate. Sci. Rep. 2021, 11, 23320. [Google Scholar] [CrossRef]
  45. Mechernich, S.; Reicherter, K.; Deligiannakis, G.; Papanikolaou, I. Tectonic geomorphology of active faults in Eastern Crete (Greece) with slip rates and earthquake history from cosmogenic 36Cl dating of the Lastros and Orno faults. Quat. Int. 2023, 30, 77–91. [Google Scholar] [CrossRef]
  46. Zreda, M.G.; Noller, F.M. Ages of prehistoric earthquakes revealed by cosmogenic chlorine-36 in a bedrock fault scarp at Hebgen Lake. Science 1998, 282, 1097–1099. [Google Scholar] [CrossRef]
  47. Schlagenhauf, A.; Gaudemer, Y.; Benedetti, L.; Manighetti, I.; Palumbo, L.; Schimmelpfennig, I.; Finkel, R.; Pou, K. Using in situ chlorine-36 cosmonuclide to recover past earthquake histories on limestone normal fault scarps: A reappraisal of methodology and interpretations. Geophys. J. Int. 2010, 182, 36–72. [Google Scholar] [CrossRef]
  48. Mouslopoulou, V.; Moraetis, D.; Benedetti, L.; Guillou, V.; Bellier, O.; Hristopulos, D. Normal faulting in the forearc of the Hellenic subduction margin: Paleoearthquake history and kinematics of the Spili Fault, Crete, Greece. J. Struct. Geol. 2014, 66, 298–308. [Google Scholar] [CrossRef]
  49. Benedetti, L.; Finkel, R.; King, G.; Armijo, R.; Papanastasiou, D.; Ryerson, F.J.; Flerit, F.; Farber, D.; Stavrakakis, G. Motion on the Kaparelli fault (Greece) prior to the 1981 earthquake sequence determined from 36Cl cosmogenic dating. Terra Nova 2001, 15, 118–124. [Google Scholar] [CrossRef]
  50. Benedetti, L.; Finkel, R.; Papanastasiou, D.; King, G.; Armijo, R.; Ryerson, F.J.; Farber, D.; Flerit, F. Post-glacial slip history of the Sparta fault (Greece) determined by 36Cl cosmogenic dating: Evidence for non-periodic earthquakes. Geophys. Res. Lett. 2002, 29, 1246. [Google Scholar] [CrossRef]
  51. Benavente, C.; Zerathe, S.; Audin, L.; Hall, S.R.; Robert, X.; Delgado, F.; Carcaillet, J.; ASTER Team. Active transpressional tectonics in the Andean forearc of southern Peru quantified by 10Be surface exposure dating of an active fault scarp. Tectonics 2017, 36, 1662–1678. [Google Scholar]
  52. Bierman, P.R.; Gillespie, A.R.; Caffee, M.W. Cosmogenic ages for earthquake recurrence intervals and debris flow fan deposition, Owens Valley. Science 1995, 270, 447–450. [Google Scholar] [CrossRef]
  53. Ballantyne, C.K.; Stone, J.O.; Fifield, L.K. Cosmogenic Cl-36 dating of post-glacial landsliding at The Storr 1995, Isle of Skye, Scotland. Holocene 1998, 8, 347–351. [Google Scholar] [CrossRef]
  54. Sewell, R.J.; Barrows, T.T.; Campbell, S.D.; Fifield, L.K. Exposure dating (10Be, 26Al) of natural terrain landslides in Hong Kong, China. Geol. Soc. Am. Spec. Pap. 2006, 415, 131–146. [Google Scholar]
  55. Le Roux, O.; Schwartz, S.; Gamond, J.F.; Jongmans, D.; Bourles, D.; Braucher, R.; Mahaney, W.; Carcaillet, J.; Leanni, L. CRE dating on the head scarp of a major landslide (Séchilienne, French Alps), age constraints on Holocene kinematics. Earth Planet. Sci. Lett. 2009, 280, 236–245. [Google Scholar] [CrossRef]
  56. Merchel, S.; Braucher, R.; Alfimov, V.; Bichler, M.; Bourles, D.L.; Reitner, J. The potential of historic rock avalanches and man-made structures as chlorine-36 production rate calibration sites. Quat. Geochronol. 2013, 18, 54–62. [Google Scholar] [CrossRef]
  57. Zerathe, S.; Braucher, R.; Lebourg, T.; Bourlès, D.; Manetti, M.; Leanni, L. Dating chert (diagenetic silica) using in-situ produced 10Be: Possible complications revealed through the comparison with 36Cl applied on coexisting limestone. Quat. Geochronol. 2013, 17, 81–93. [Google Scholar] [CrossRef]
  58. Pánek, T. Recent progress in landslide dating: A global overview. Prog. Phys. Geogr. 2015, 39, 168–198. [Google Scholar] [CrossRef]
  59. Athanassas, C.D.; Bourlès, D.L.; Bracucher, R.; Druitt, T.H.; Nomikou, P.; Leanni, L. Evidence from cosmic ray exposure (CRE) dating for the existence of a pre-Minoan caldera on Santorini, Greece. Bull. Volcanol. 2016, 78, 35. [Google Scholar] [CrossRef]
  60. Schwartz, S.; Zerathe, S.; Jongmans, D.; Baillet, L.; Carcailet, J.; Audin, L.; Dumont, T.; Bourlès, D.; Braucher, R.; Lebrouc, V. Cosmic ray exposure dating on the large landslide of Séchilienne (Western Alps): A synthesis to constrain slope evolution. Geomorphology 2017, 278, 329–344. [Google Scholar] [CrossRef]
  61. Zerathe, S.; Lebourg, T.; Braucher, R.; Bourlès, D. Mid-Holocene cluster of large-scale landslides revealed in the Southwestern Alps by 36Cl dating. Insight on an Alpine-scale landslide activity. Quat. Sci. Rev. 2014, 90, 106–127. [Google Scholar] [CrossRef]
  62. British Petroleum Company. The Geological Results of Petroleum Exploration in Western Greece: Institute of Geology Subsurface Research. Athens 1971, 10, 73. [Google Scholar]
  63. Gosgrove, J.W. The association of folds and fractures and the link between folding, fracturing and fluid flow during the evolution of a fold–thrust belt: A brief review. In Industrial Structural Geology: Principles, Techniques and Integration; Richards, F.L., Richardson, N.J., Rippington, S.J., Wilson, R.W., Bond, C.E., Eds.; Geological Society of London, Special Publications: Bath, UK, 2015; Volume 421. [Google Scholar]
  64. Lal, D. Cosmic ray labeling of erosion surfaces: In situ nuclide production rates and erosion models. Earth Planet. Sci. Lett. 1991, 104, 424–439. [Google Scholar] [CrossRef]
  65. Stone JO, H.; Evans, J.M.; Fifield, L.K.; Allan, G.L.; Cresswell, R.G. Cosmogenic Chlorine-36 Production in Calcite by Muons. Geochim. Cosmochim. Acta 1998, 62, 433–454. [Google Scholar] [CrossRef]
  66. Stone, J.O. Air pressure and cosmogenic isotope production. J. Geophys. Res. 2000, 105, 23753–23759. [Google Scholar] [CrossRef]
  67. Cowie, P.A.; Phillips, R.J.; Roberts, G.P.; McCaffrey, K.; Zijerveld, L.J.J.; Gregory, L.C.; Faure Walker, J.; Wedmore, L.N.J.; Dunai, T.J.; Binnie, S.A.; et al. Orogen-scale uplift in the central Italian Apennines drives episodic behaviour of earthquake faults. Sci. Rep. 2017, 7, 44858. [Google Scholar] [CrossRef]
  68. Beck, J.; Wolfers, S.; Roberts, G.P. Bayesian earthquake dating and seismic hazard assessment using chlorine-36 measurements (BED v1). Geosci. Model. Dev. 2018, 11, 4383–4387. [Google Scholar] [CrossRef]
  69. Tesson, J.; Benedetti, L. Seismic history from in situ 36Cl cosmogenic nuclide data on limestone fault scarps using Bayesian reversible jump Markov chain Monte Carlo. Quat. Geochronol. 2019, 52, 1–20. [Google Scholar] [CrossRef]
  70. Tikhomirov, D.; Amiri, N.M.; Ivy-Ochs, S.; Alfimov, V.; Vockenhuber, C.; Akçar, N. Fault Scarp Dating Tool—A MATLAB code for fault scarp dating using in-situ chlorine-36 supplemented with datasets of Yavansu and Kalafat faults. Data Brief 2019, 26, 104476. [Google Scholar] [CrossRef]
  71. Goodall, H.J.; Gregory, L.C.; Wedmore, L.N.J.; McCaffrey, K.J.W.; Amey, R.M.J.; Roberts, G.P.; Shanks, R.P.; Phillips, R.J.; Hooper, A. Determining Histories of Slip on Normal Faults With Bedrock Scarps Using Cosmogenic Nuclide Exposure Data. Tectonics 2021, 40, e2020TC006457. [Google Scholar] [CrossRef]
  72. Sanchez, G.; Rolland, Y.; Corsini, M.; Braucher, R.; Bourlès, D.; Arnold, M.; Aumaître, G. Relationships between tectonics, slope instability and climate change: Cosmic ray exposure dating of active faults, landslides and glacial surfaces in the SW Alps. Geomorphology 2010, 117, 1–13. [Google Scholar] [CrossRef]
  73. Hippolyte, J.C.; Bourlès, D.; Léanni, L.; Braucher, R.; Chauvet, F.; Lebatard, A.E. 10Be ages reveal >12 ka of gravitational movement in a major sackung of the Western Alps (France). Geomorphology 2012, 171–172, 139–153. [Google Scholar] [CrossRef]
  74. Cardinal, T.; Audin, L.; Rolland, Y.; Schwartz, S.; Petit, C.; Zerathe, S.; Borgniet, L.; Braucher, R.; Nomade, J.; Dumont, T.; et al. Interplay of fluvial incision and rockfalls in shaping periglacial mountain gorges. Geomorphology 2021, 381, 107665. [Google Scholar] [CrossRef]
  75. Cardinal, T.; Rolland, Y.; Petit, C.; Audin, L.; Zerathe, S.; Schwartz, S.; ASTER Team. Fluvial bedrock gorges as markers for Late-Quaternary tectonic and climatic forcing in the French Southwestern Alps. Geomorphology 2022, 418, 108476. [Google Scholar] [CrossRef]
  76. Arnold, M.; Merchel, S.; Bourlès, D.L.; Braucher, R.; Benedetti, L.; Finkel, R.C.; Aumaître, G.; Gottdang, A.; Klein, M. The French accelerator mass spectrometry facility ASTER: Improved performance and developments. Nucl. Instrum. Methods Phys. Res. B 2010, 268, 1954–1959. [Google Scholar] [CrossRef]
  77. Merchel, S.; Bremser, W.; Alfimov, V.; Arnold, M.; Aumaître, G.; Benedetti, L.; Bourlès, D.L.; Caffee, M.; Fifield, L.K.; Finkel, R.C.; et al. Ultra-trace analysis of 36Cl by accelerator mass spectrometry: An interlaboratory study. Anal. Bioanal. Chem. 2011, 400, 3125–3132. [Google Scholar] [CrossRef]
  78. Schimmelpfennig, I.; Benedetti, L.; Finkel, R.; Pik, R.; Blard, P.H.; Bourlès, D.; Burnard, P.; Williams, A. Sources of in situ 36Cl in basaltic rocks. Implications for calibration of production rates. Quat Geochronol. 2009, 4, 441–461. [Google Scholar] [CrossRef]
  79. Schimmelpfenning, I.; Benedetti, L.; Garreta, V.; Pik, R.; Blard, H.P.; Burnard, P.; Bourlès, D.; Ammon, K.; Dunai, T. Calibration of cosmogenic 36Cl production rates from Ca and K spallation in lava flows from Mt. Etna (38° N 2011, Italy) and Payun Matru (36° S, Argentina). Geochim. Cosmochim. Acta 2011, 75, 2611–2632. [Google Scholar] [CrossRef]
  80. Schimmelpfenning, I.; Schaefer, J.M.; Akçar, N.; Koffman, T.; Ivy-Ochs, S.; Schwartz, R.; Finkel, R.C.; Zimmerman, S.; Schlüchter, C. A chronology of Holocene and Little Ice Age glacier culminations of the Steingletscher, Central Alps, Switzerland, based on high-sensitivity beryllium-10 moraine dating. Earth Planet. Sci. Lett. 2014, 393, 220–230. [Google Scholar] [CrossRef]
  81. Fink, D.; Voght, S.; Hotchkis, M. Cross-sections for 36Cl from Ti at Ep = 35–150 MeV: Applications to in-situ exposure dating. Nucl. Instrum. Methods Phys. Res. Sect. B Beam Interact. Mater. Atoms. 2000, 172, 861–866. [Google Scholar] [CrossRef]
  82. Stone, J.O.; Fifield, K.; Vasconcelos, P. Terrestrial chlorine-36 production from spallation of iron. In Proceedings of the 10th International Conference on Accelerator Mass Spectrometry, Berkeley, CA, USA, 3–9 September 2005. [Google Scholar]
  83. Marrero, S.M.; Phillips, F.M.; Brochers, B.; Lifton, N.; Aumer, R.; Balco, G. Cosmogenic nuclide systematics and the CRONUScalc program. Quarter. Geochronol. 2016, 31, 160–187. [Google Scholar] [CrossRef]
  84. Hashemi, A.; Sarıkaya, M.A.; Wilcken, K.M.; Öztürk, M.Z. Controls on long-term denudation rate of carbonate terrains in the Eastern Mediterranean. Quat. Sci. Rev. 2023, 321, 108351. [Google Scholar] [CrossRef]
  85. Krklec, K. Long-term denudation rate of karstic North Dalmatian Plain (Croatia) calculated from 36Cl cosmogenic nuclides. Geomorphology 2022, 413, 108358. [Google Scholar] [CrossRef]
  86. Krklec KDomínguez-Villar, D.; Perica, D. Use of rock tablet method to measure rock weathering and landscape denudation. Earth Sci. Rev. 2021, 212, 103449. [Google Scholar] [CrossRef]
  87. Desormeaux, C.; Godard, V.; Lague, D.; Duclaux, G.; Fleury, J.; Benedetti, L.; Bellier, O.; ASTER Team. Investigation of stochastic-threshold incision models across a climatic and morphological gradient. Earth Surf. Dynam. 2022, 10, 473–492. [Google Scholar] [CrossRef]
  88. Spencer, C.J.; Yakymchuk, C.; Ghaznavi, M. Visualising data distributions with kernel density estimation and reduced chi-squared statistic. Geosci. Front. 2017, 8, 1247–1252. [Google Scholar] [CrossRef]
  89. Hilger, P.; Hermanns, R.L.; Gosse, J.C.; Jacobs, B.; Etzelmüller, B.; Krautblatter, M. Multiple rock-slope failures from Mannen in Romsdal Valley, western Norway, revealed from Quaternary geological mapping and 10Be exposure dating. Holocene 2018, 28, 1841–1854. [Google Scholar] [CrossRef]
  90. Lenart, J.; Kašing, M.; Pánek, T.; Braucher, R.; Kuda, F. Rare, slow but impressive: >43 ka of rockslide in river canyon incising crystalline rocks of the eastern Bohemian Massif. Landslides 2023, 20, 1705–1718. [Google Scholar] [CrossRef]
  91. Lekkas, E.; Mavroulis, S. Fault zones ruptured during the early 2014 Cephalonia Island (Ionian Sea, Western Greece) earthquakes (January 26 and February 23, Mw 6.0) based on the associated co-seismic surface ruptures. J. Seismol. 2016, 20, 63–78. [Google Scholar] [CrossRef]
Figure 1. Geological map of Kefalonia compiled with information from the Geological Map of Greece (Sheet: Island of Kefalonia Northern and Southern Section, scale 1:50,000, Institute of Geological and Mineral Research—IGME) as well as from Jenkins [25] and Underhill [3]. PX: Paxoi Zone, IZ: Ionian Zone. The red square encloses the Thinia Valley and the study area and the bold dots within it are the study sites.
Geosciences 15 00094 g001
Figure 2. Relief (topographic aspect) map of northern Kefalonia and the study area. The blue rectangle marks the NE–SW trending Thinia Valley, stretching between the Gulf of Argostoli and the Ionian Sea, while the two clusters of red points mark the sample/study locations, Zola and Kourouklata (Kour.), respectively. The black line intersecting the sample sites indicates the location and the direction of the geological cross-section shown in Figure 3. (source: Hellenic Cadastre).
Geosciences 15 00094 g002
Figure 3. Generalized geological cross-section (compiled from field data and from Underhill [40], Figure 10 therein) of the western part of the Thinia Valley which features Cretaceous and Paleogene limestones overlain by Miocene sediments, both dipping gently eastward. Sample positions are also indicated. The length corresponds to the linear segment AB in Figure 4a.
Geosciences 15 00094 g003
Figure 4. (a) Topography of the NE–SW trending anticline ridge that bounds the Thinia Valley to the east. Ground deformation on the eastern slopes of the anticline ridge is more frequent than on the western slopes. The contours (20-m spacing) of the hinge deflect to the NW, possibly implying a deflected antincline axis as well. This is a common feature in fold-thrust belts, where the hinge line may curve due to strike/oblique-slip faults altering the geometry of the fold. Thick dashed lines trace possible fault segments while the thin dashed line traces the crown of the landslide (b) Close-up of the rectangular area shown in Figure 2, largely corresponding to the Zola landslide. Contours (10-m spacing) are overlaid on a digital terrain model. Deformation features (traced using blink comparison of historical imagery on Google Earth) are shown with solid lines (while their probable extension is shown with dashed lines). Ticks point to the direction of subsidence. The topographic map of the Zola area shows red stars representing sample locations. DEM sourced from the Hellenic Cadastre.
Geosciences 15 00094 g004aGeosciences 15 00094 g004b
Figure 5. General view from above (looking north) showing the main tectonic lines and the Thinia Valley. The second sample site is located in the central-east part of the image. Sample positions (SK01–SK08) are marked with red pins, while a separate pin south of the studied landform marks the sampled fault plane (FK01-08). Basemap: Google Earth. The Zola landslide is situated at the northwest tip of the valley. Base map: Google Earth.
Geosciences 15 00094 g005
Figure 6. Topographic map of the Kourouklata area. The cluster of red stars in the middle represents the sample locations (starting with SK01 on the right and progressing sequentially to SK08 on the left), while the isolated star to the south represents the sampled fault plane (FK samples). DEM sourced from the Hellenic Cadastre.
Geosciences 15 00094 g006
Figure 7. (a) The fracture planar surface in the vicinity of the landform described in Figure 8 and the samples, extracted by tile-cutting wheel in 5 cm intervals. The surface is about 1 m high. (b) The planar surface after the samples were cut out.
Geosciences 15 00094 g007
Figure 8. Sampling at position Z09 (below the crown of the Zola landslide). Z09A comes from the original surface while Z09B comes from an exhumed surface. Surfaces associated with deeper-seated secondary ruptures within the principal escarpment (Figure 5), occasionally embed secondary translational surfaces formed by shallower block sliding (mass wasting). This combination represents the fundamental morphological pattern of the Zola landslide.
Geosciences 15 00094 g008
Figure 9. This graph illustrates the assumptions underlying the calculation of exposure ages for landslides. The zero (0) level represents the ground surface that is slipping downwards. Prior to exhumation (left), we assume that the reference sample, a (at depth 0) is eroding under steady state conditions established over a very long timescale (time → ) and has a stabilized concentration of 36Cl at a constant value C a . The same assumption applies to sample b, but its production rate is adjusted according to its depth. After exhumation (right), the reference sample retains its initial state, while the newly exhumed sample b experiences a new production rate ( P ) , which contributes to the additional accumulation of 36Cl over the exposure duration. The total concentration of 36Cl in sample b after exhumation is therefore given by C b = C b + f ( 0 , T b , ε ), where f ( 0 ,   T b ,   ε ) accounts for the post-exhumation nuclide production under the new surface exposure conditions.
Geosciences 15 00094 g009
Figure 10. Scatter plot (left) and kernel probability density plot (right) of the maximum erosion rates. The red data points form a distinct peak, indicating a statistically similar population. The dashed black line represents the mean of this population. Density plot calculated with KDredX2 [88].
Geosciences 15 00094 g010
Figure 11. Scatter plot (left) and kernel probability density plot (right) of the FK exposure ages. The red data points form a distinct peak, including a statistically similar population. The dashed black line represents the mean of this population. Density plot calculated with KDredX2 [88].
Geosciences 15 00094 g011
Figure 12. The components of westward displacement from InSAR data for northern Kefalonia. Colors within the red spectrum indicate displacement velocities higher than those represented by colors in the green spectrum (source: EGSM, Copernicus).
Geosciences 15 00094 g012
Disclaimer/Publisher’s Note: The statements, opinions and data contained in all publications are solely those of the individual author(s) and contributor(s) and not of MDPI and/or the editor(s). MDPI and/or the editor(s) disclaim responsibility for any injury to people or property resulting from any ideas, methods, instructions or products referred to in the content.

