
The Afghanistan Earthquake of 21 June 2022: The Role of Compressional Step-Overs in Seismogenesis


 ,
,  ,
,  and
and
Abstract
:1. Introduction
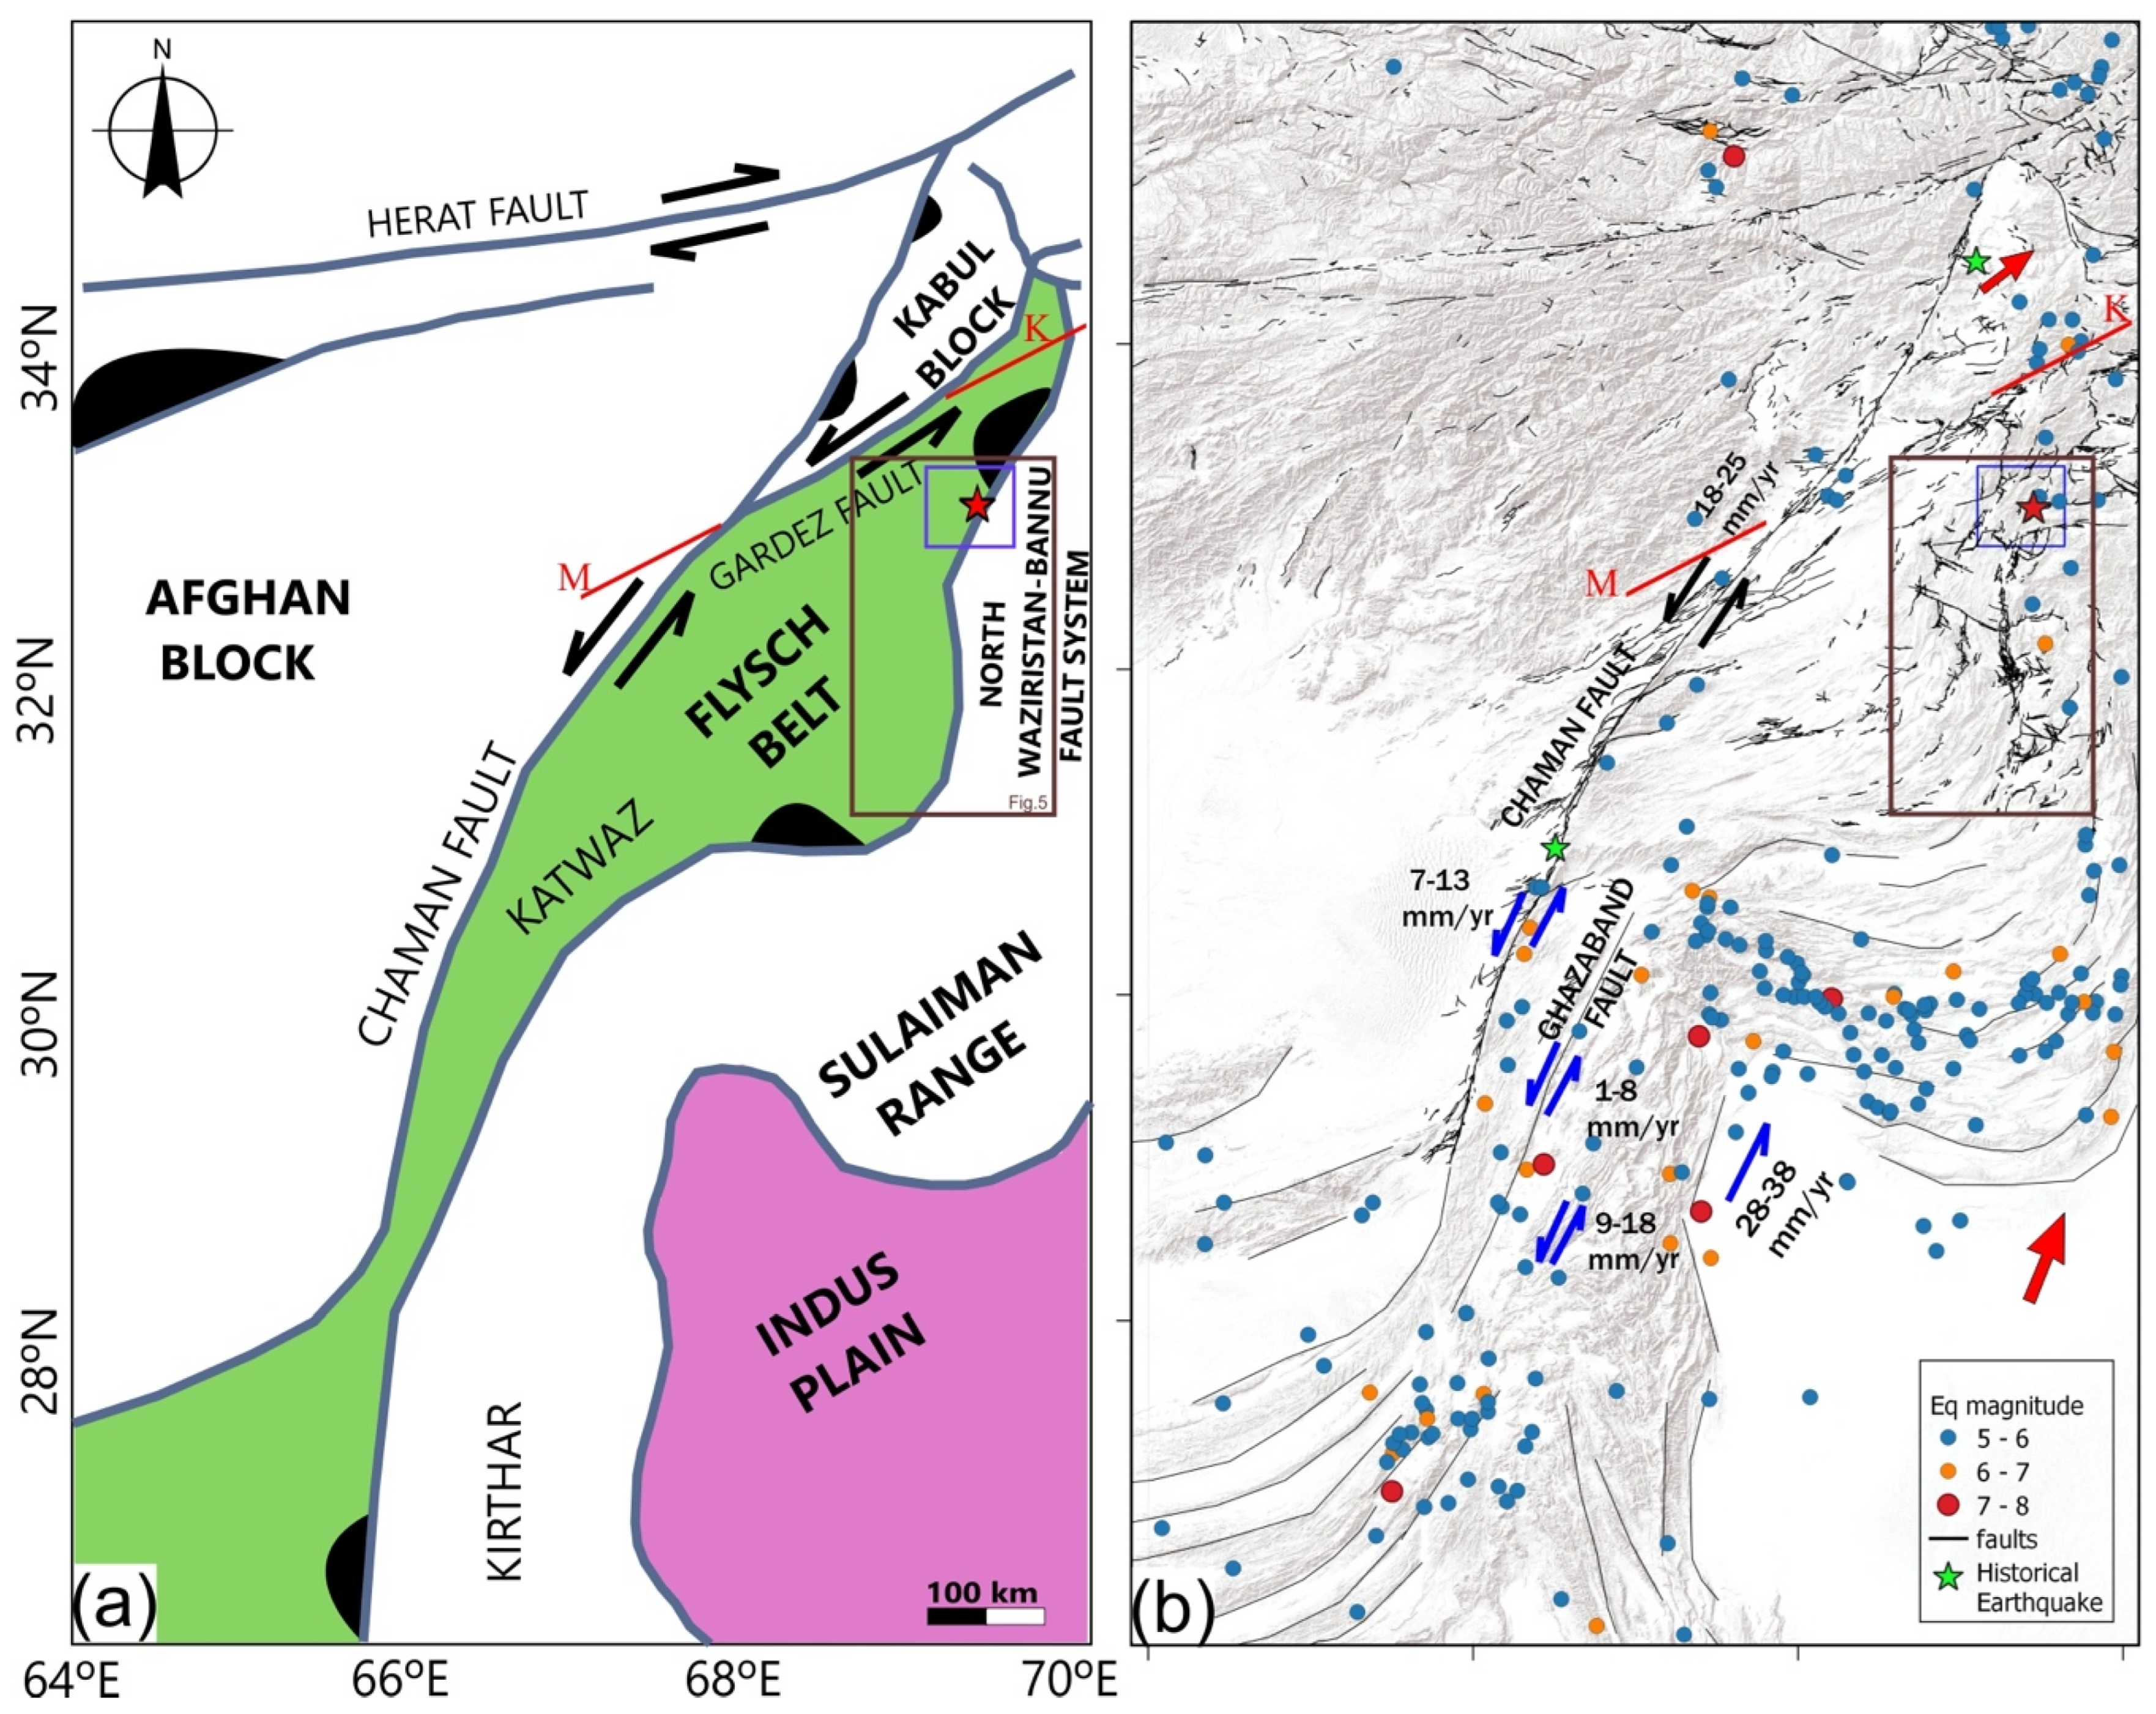
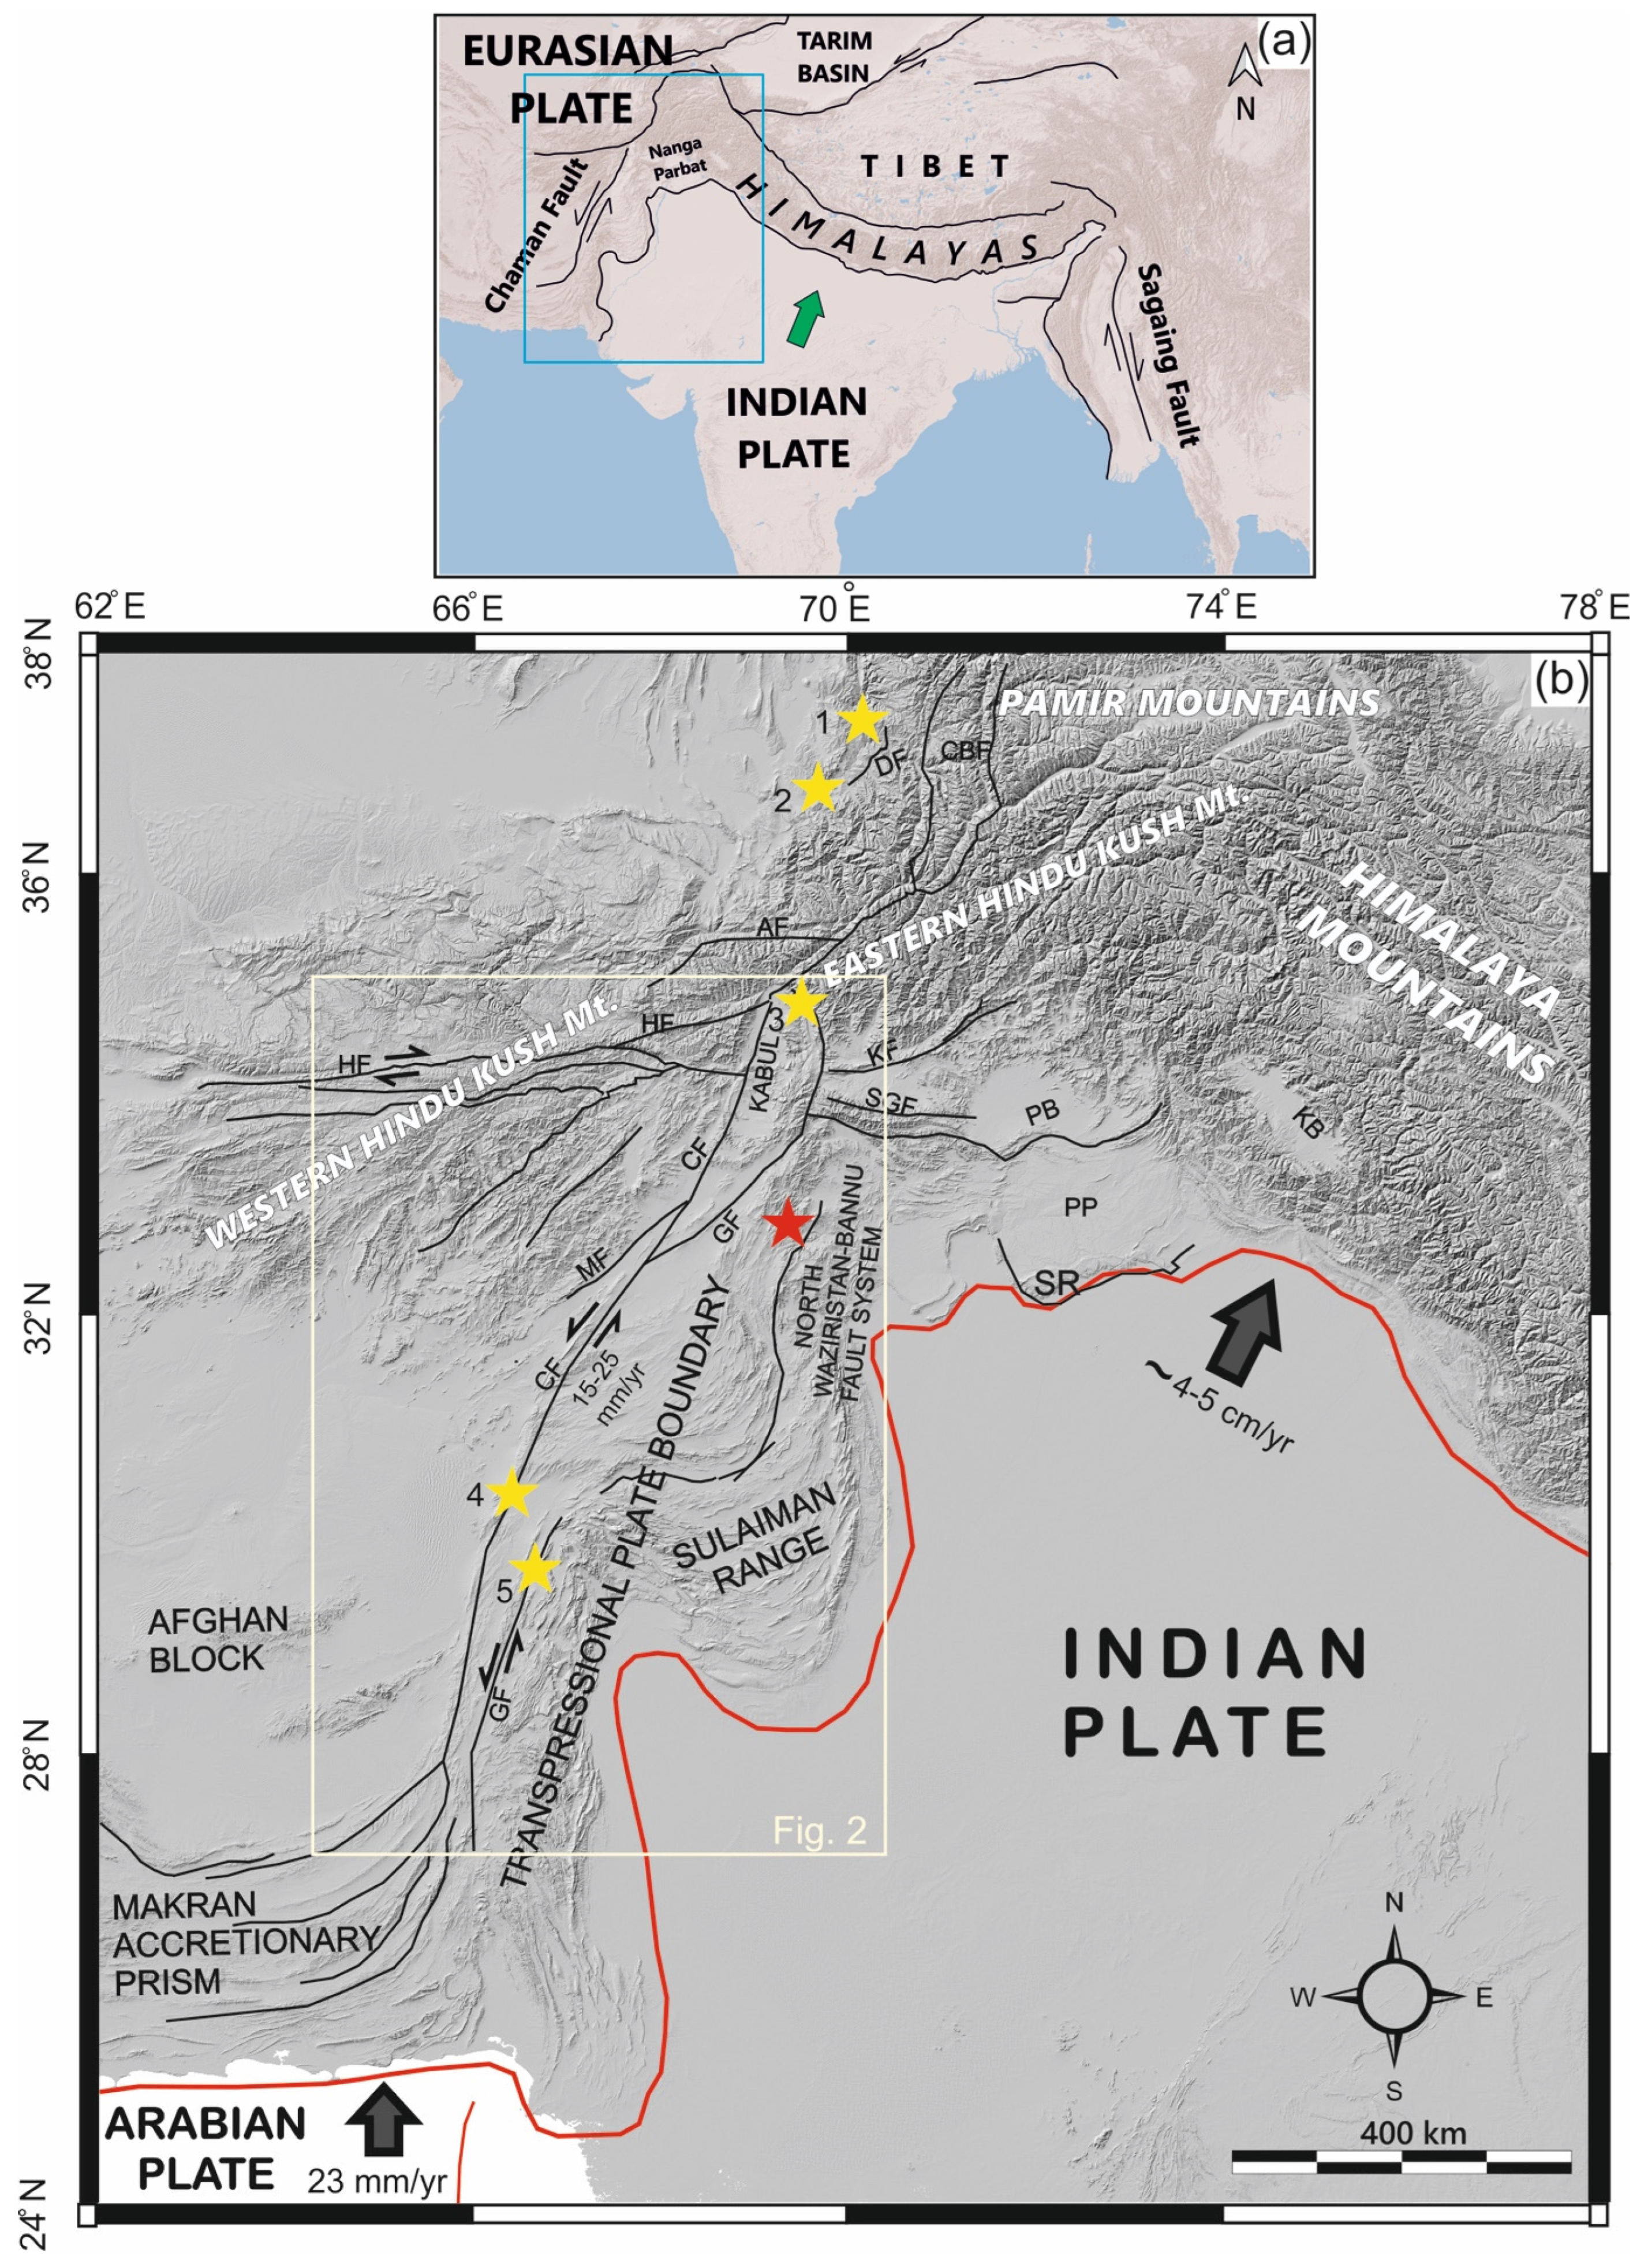
2. Tectonic Setting
3. Data and Methods
4. Results
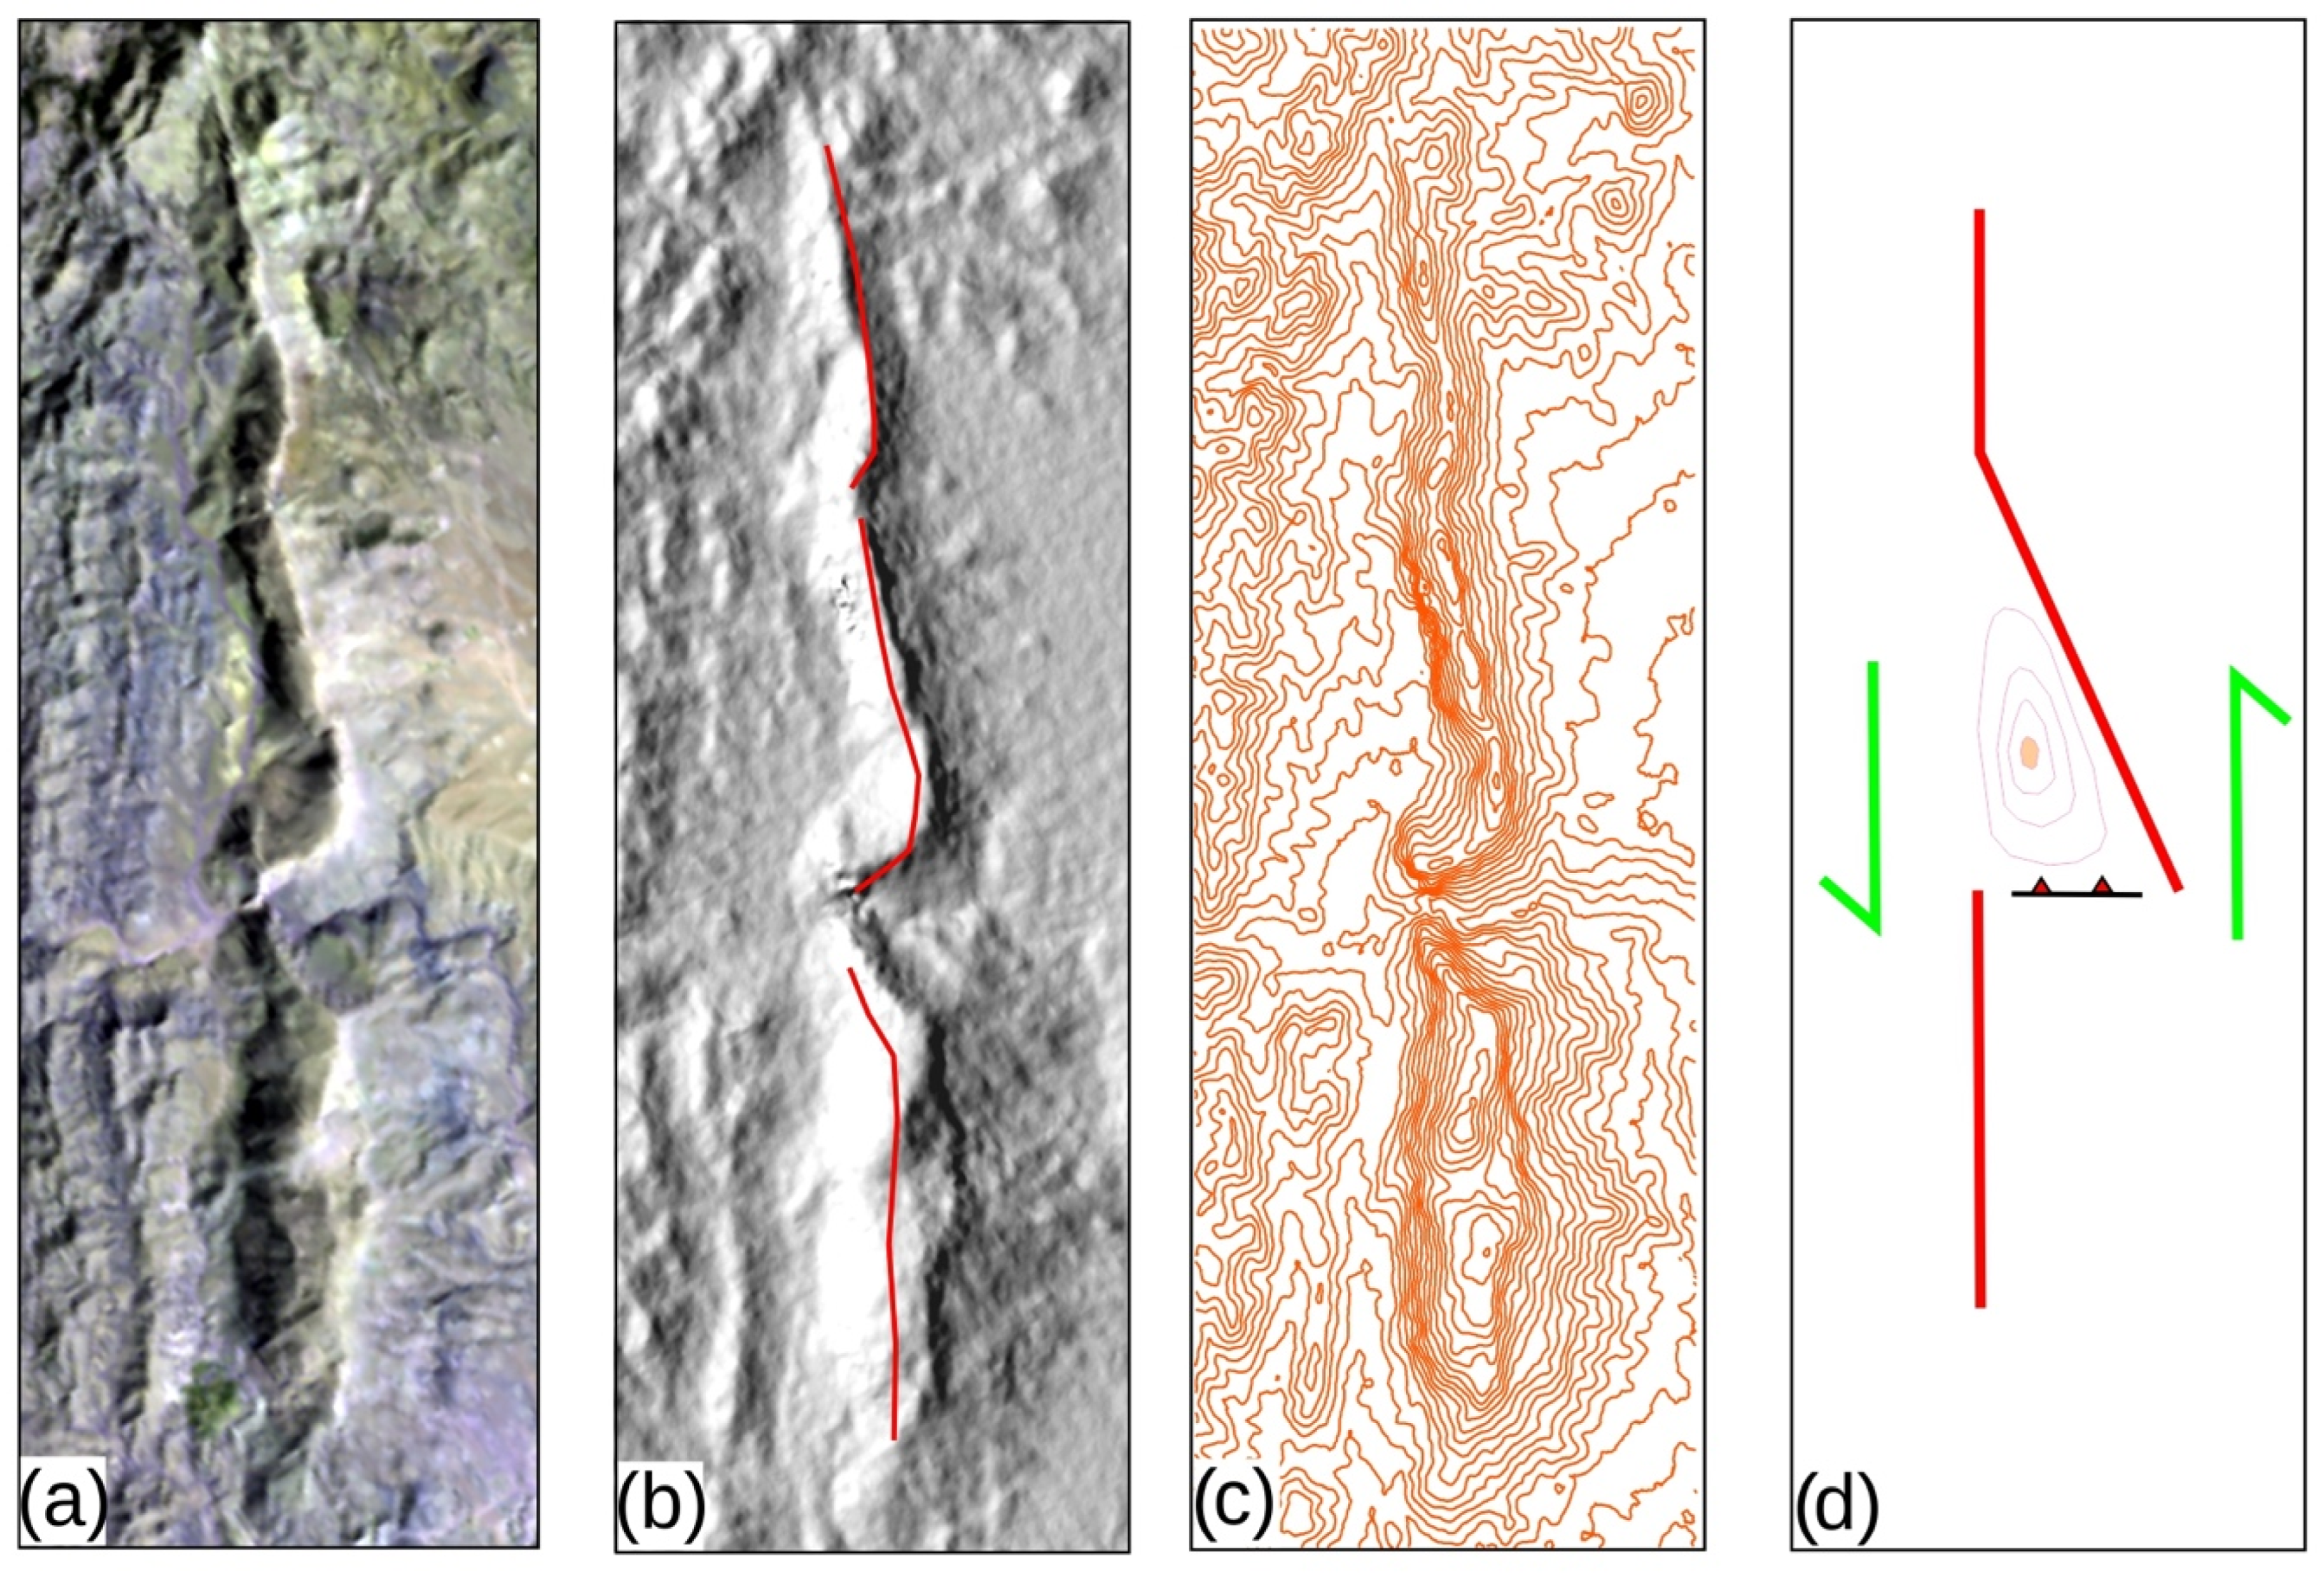
4.1. Geology/Geomorphology
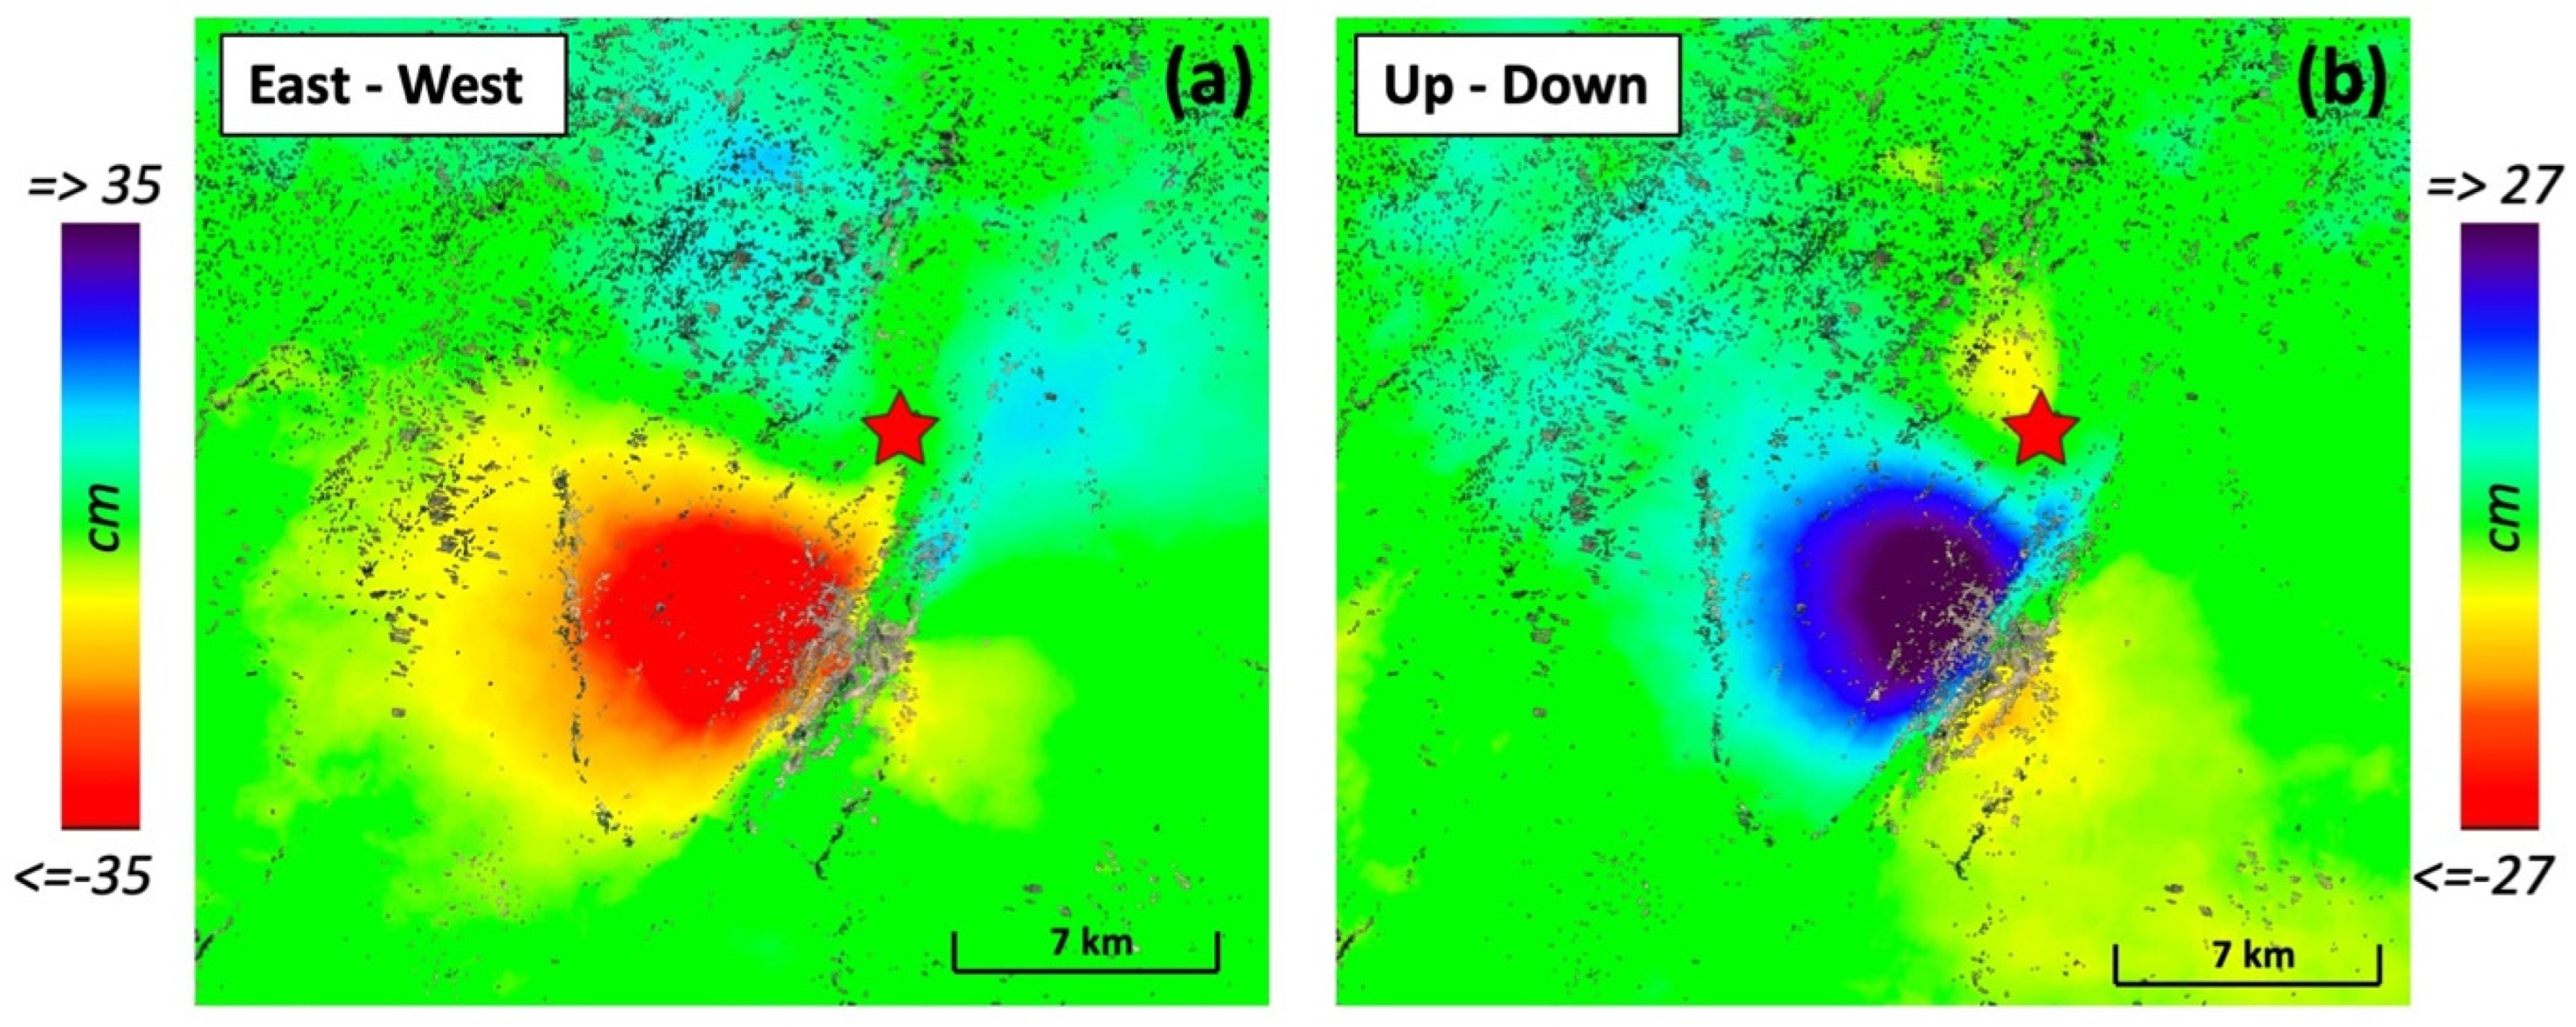
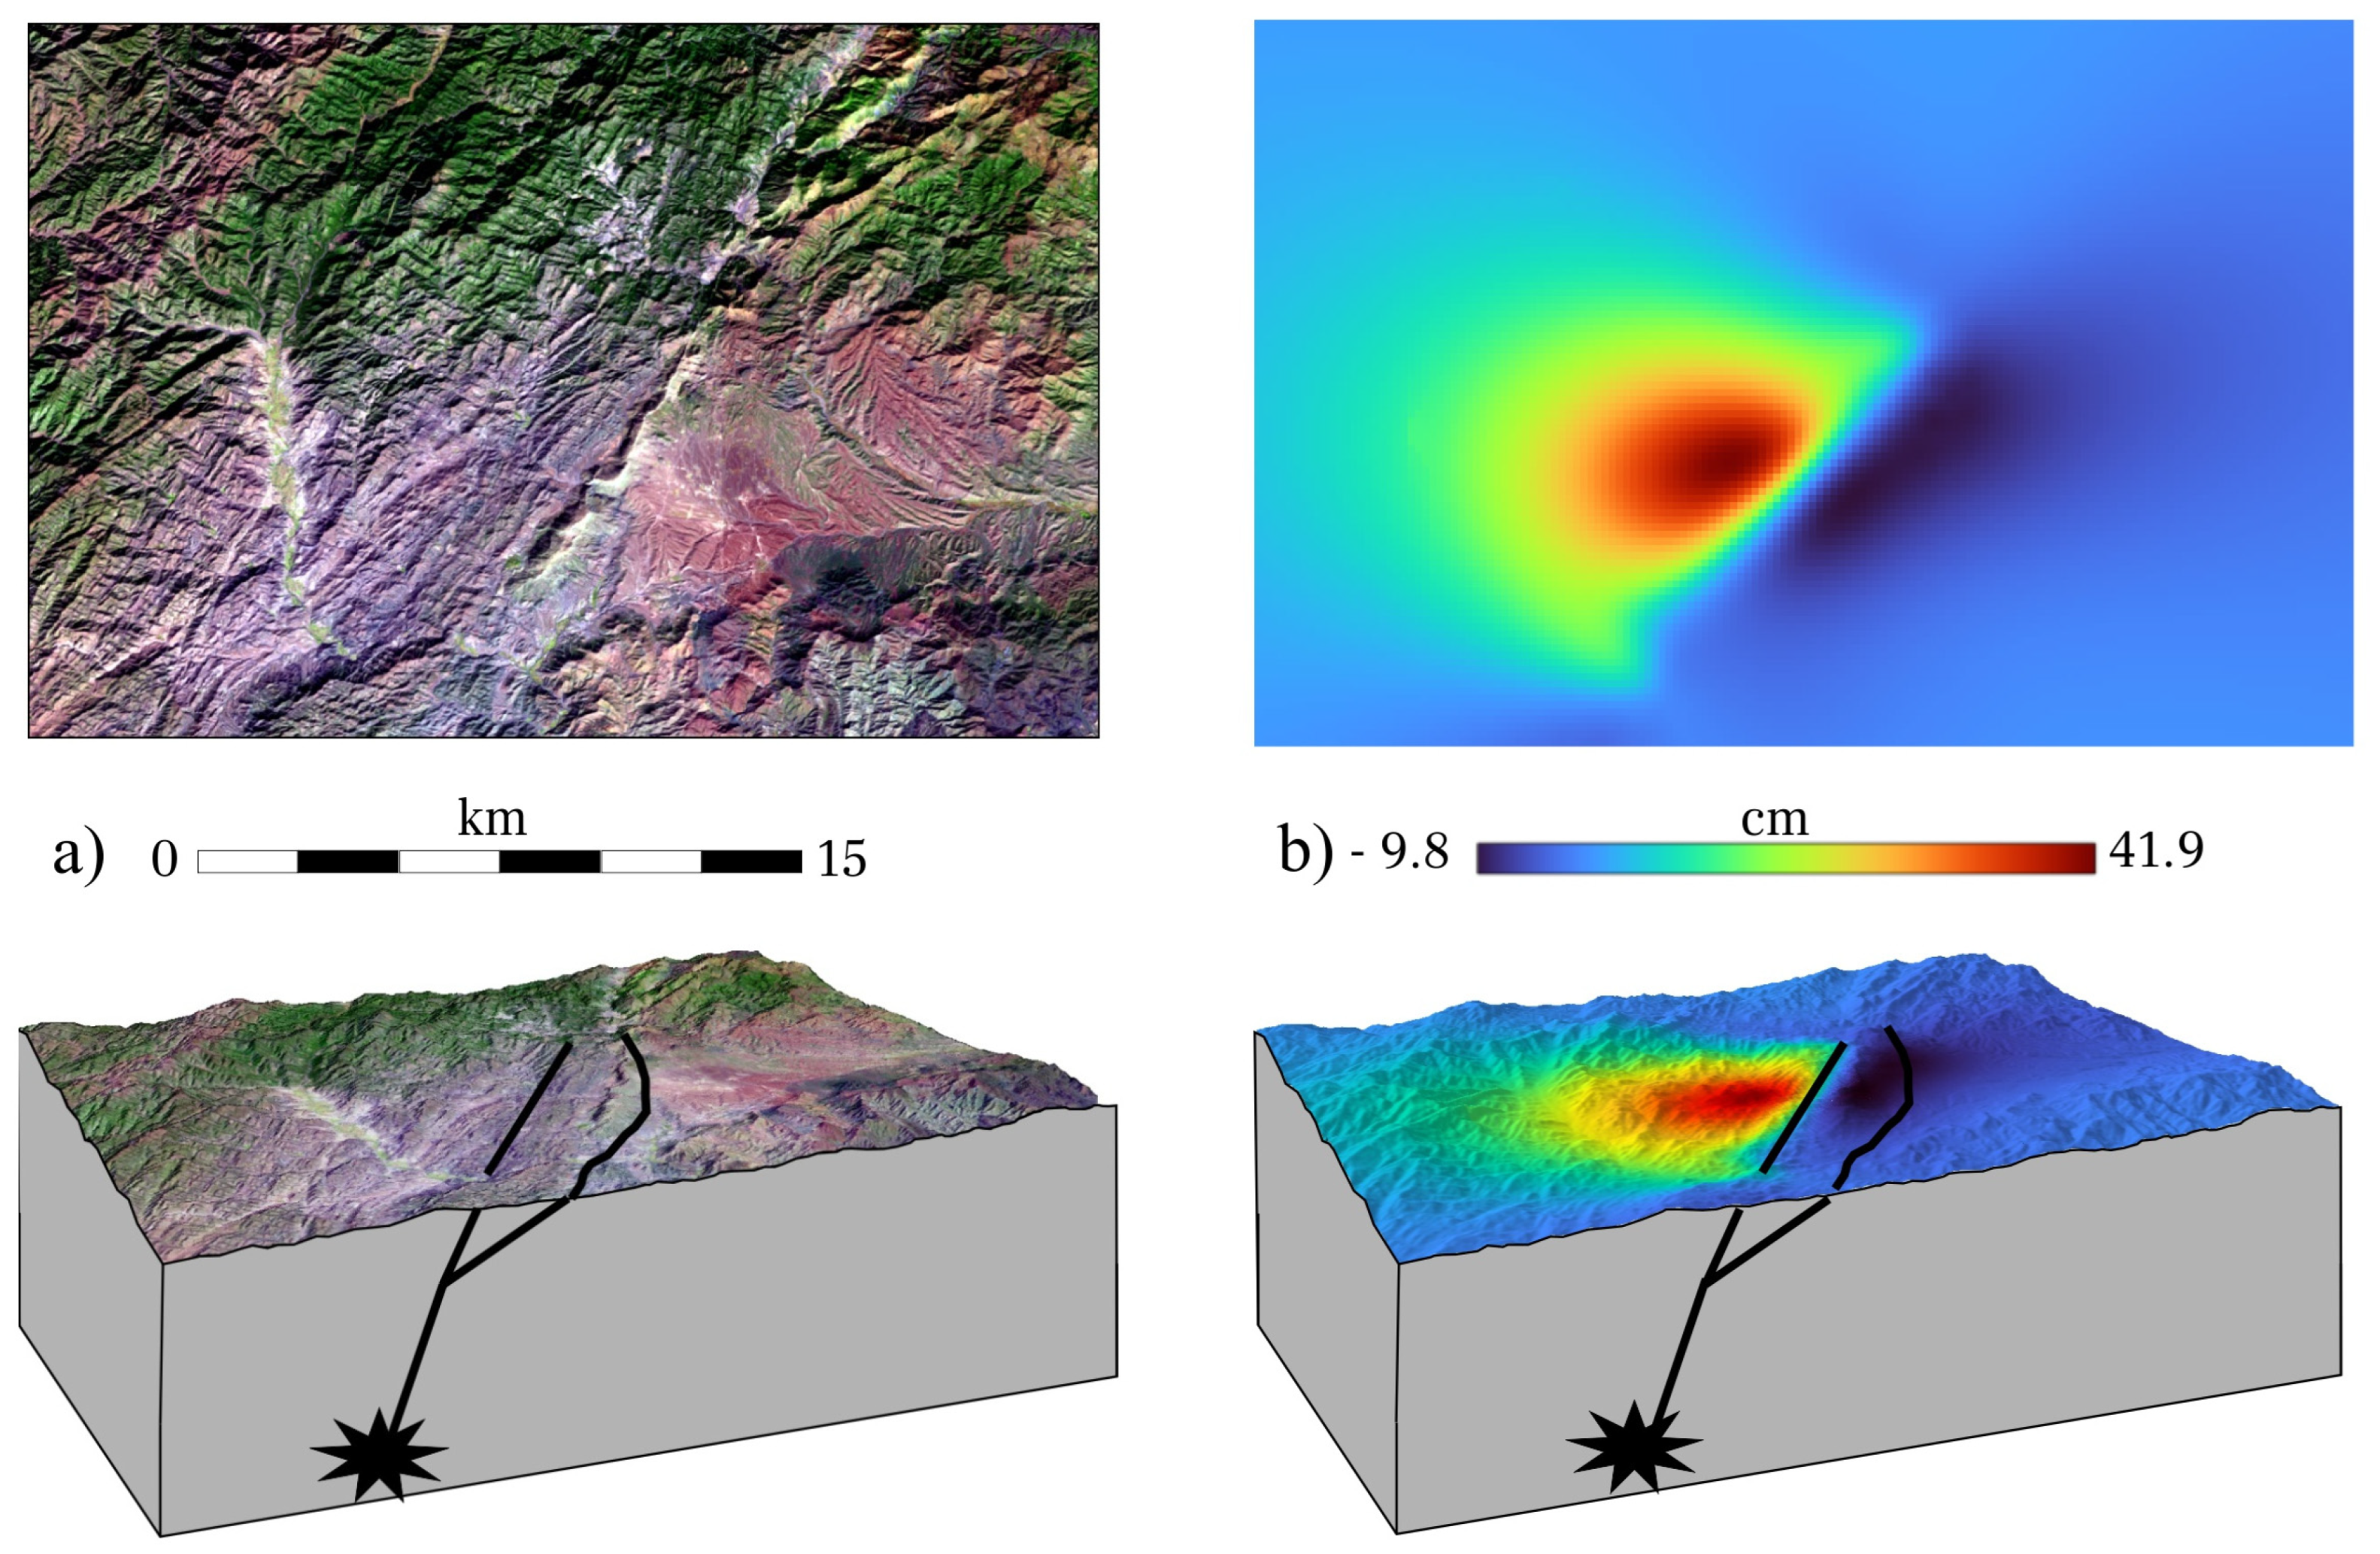
4.2. InSAR Analysis
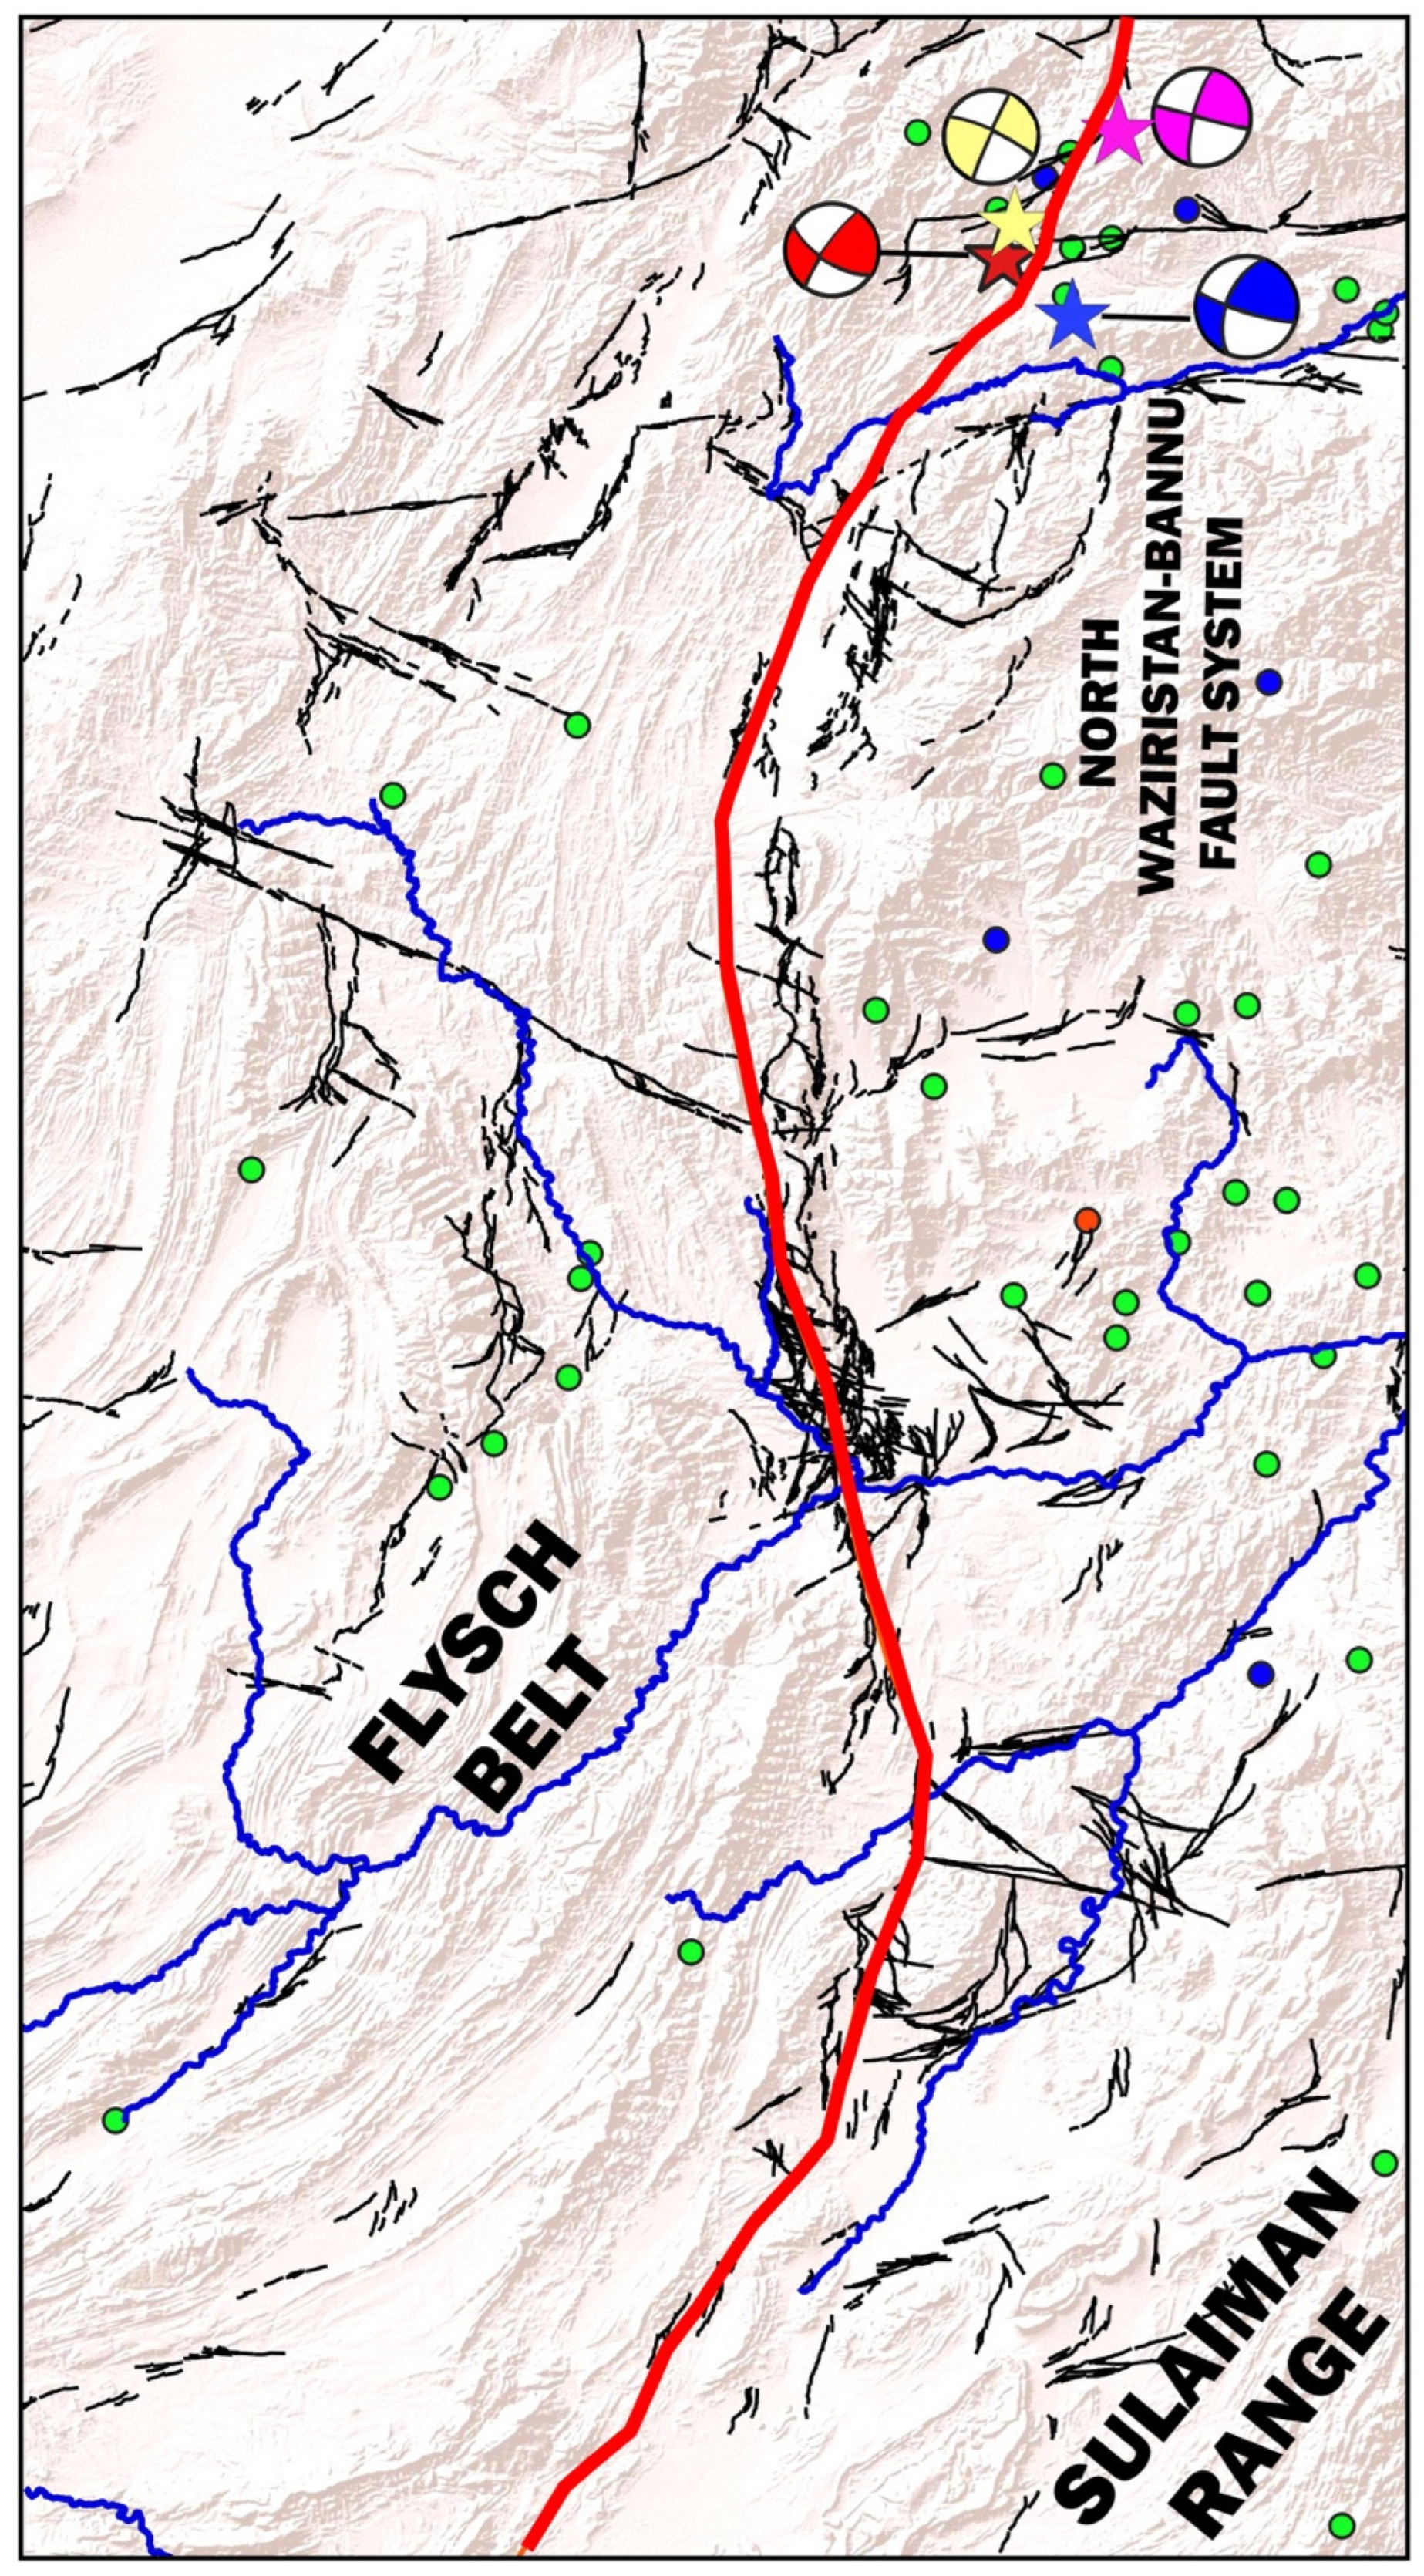
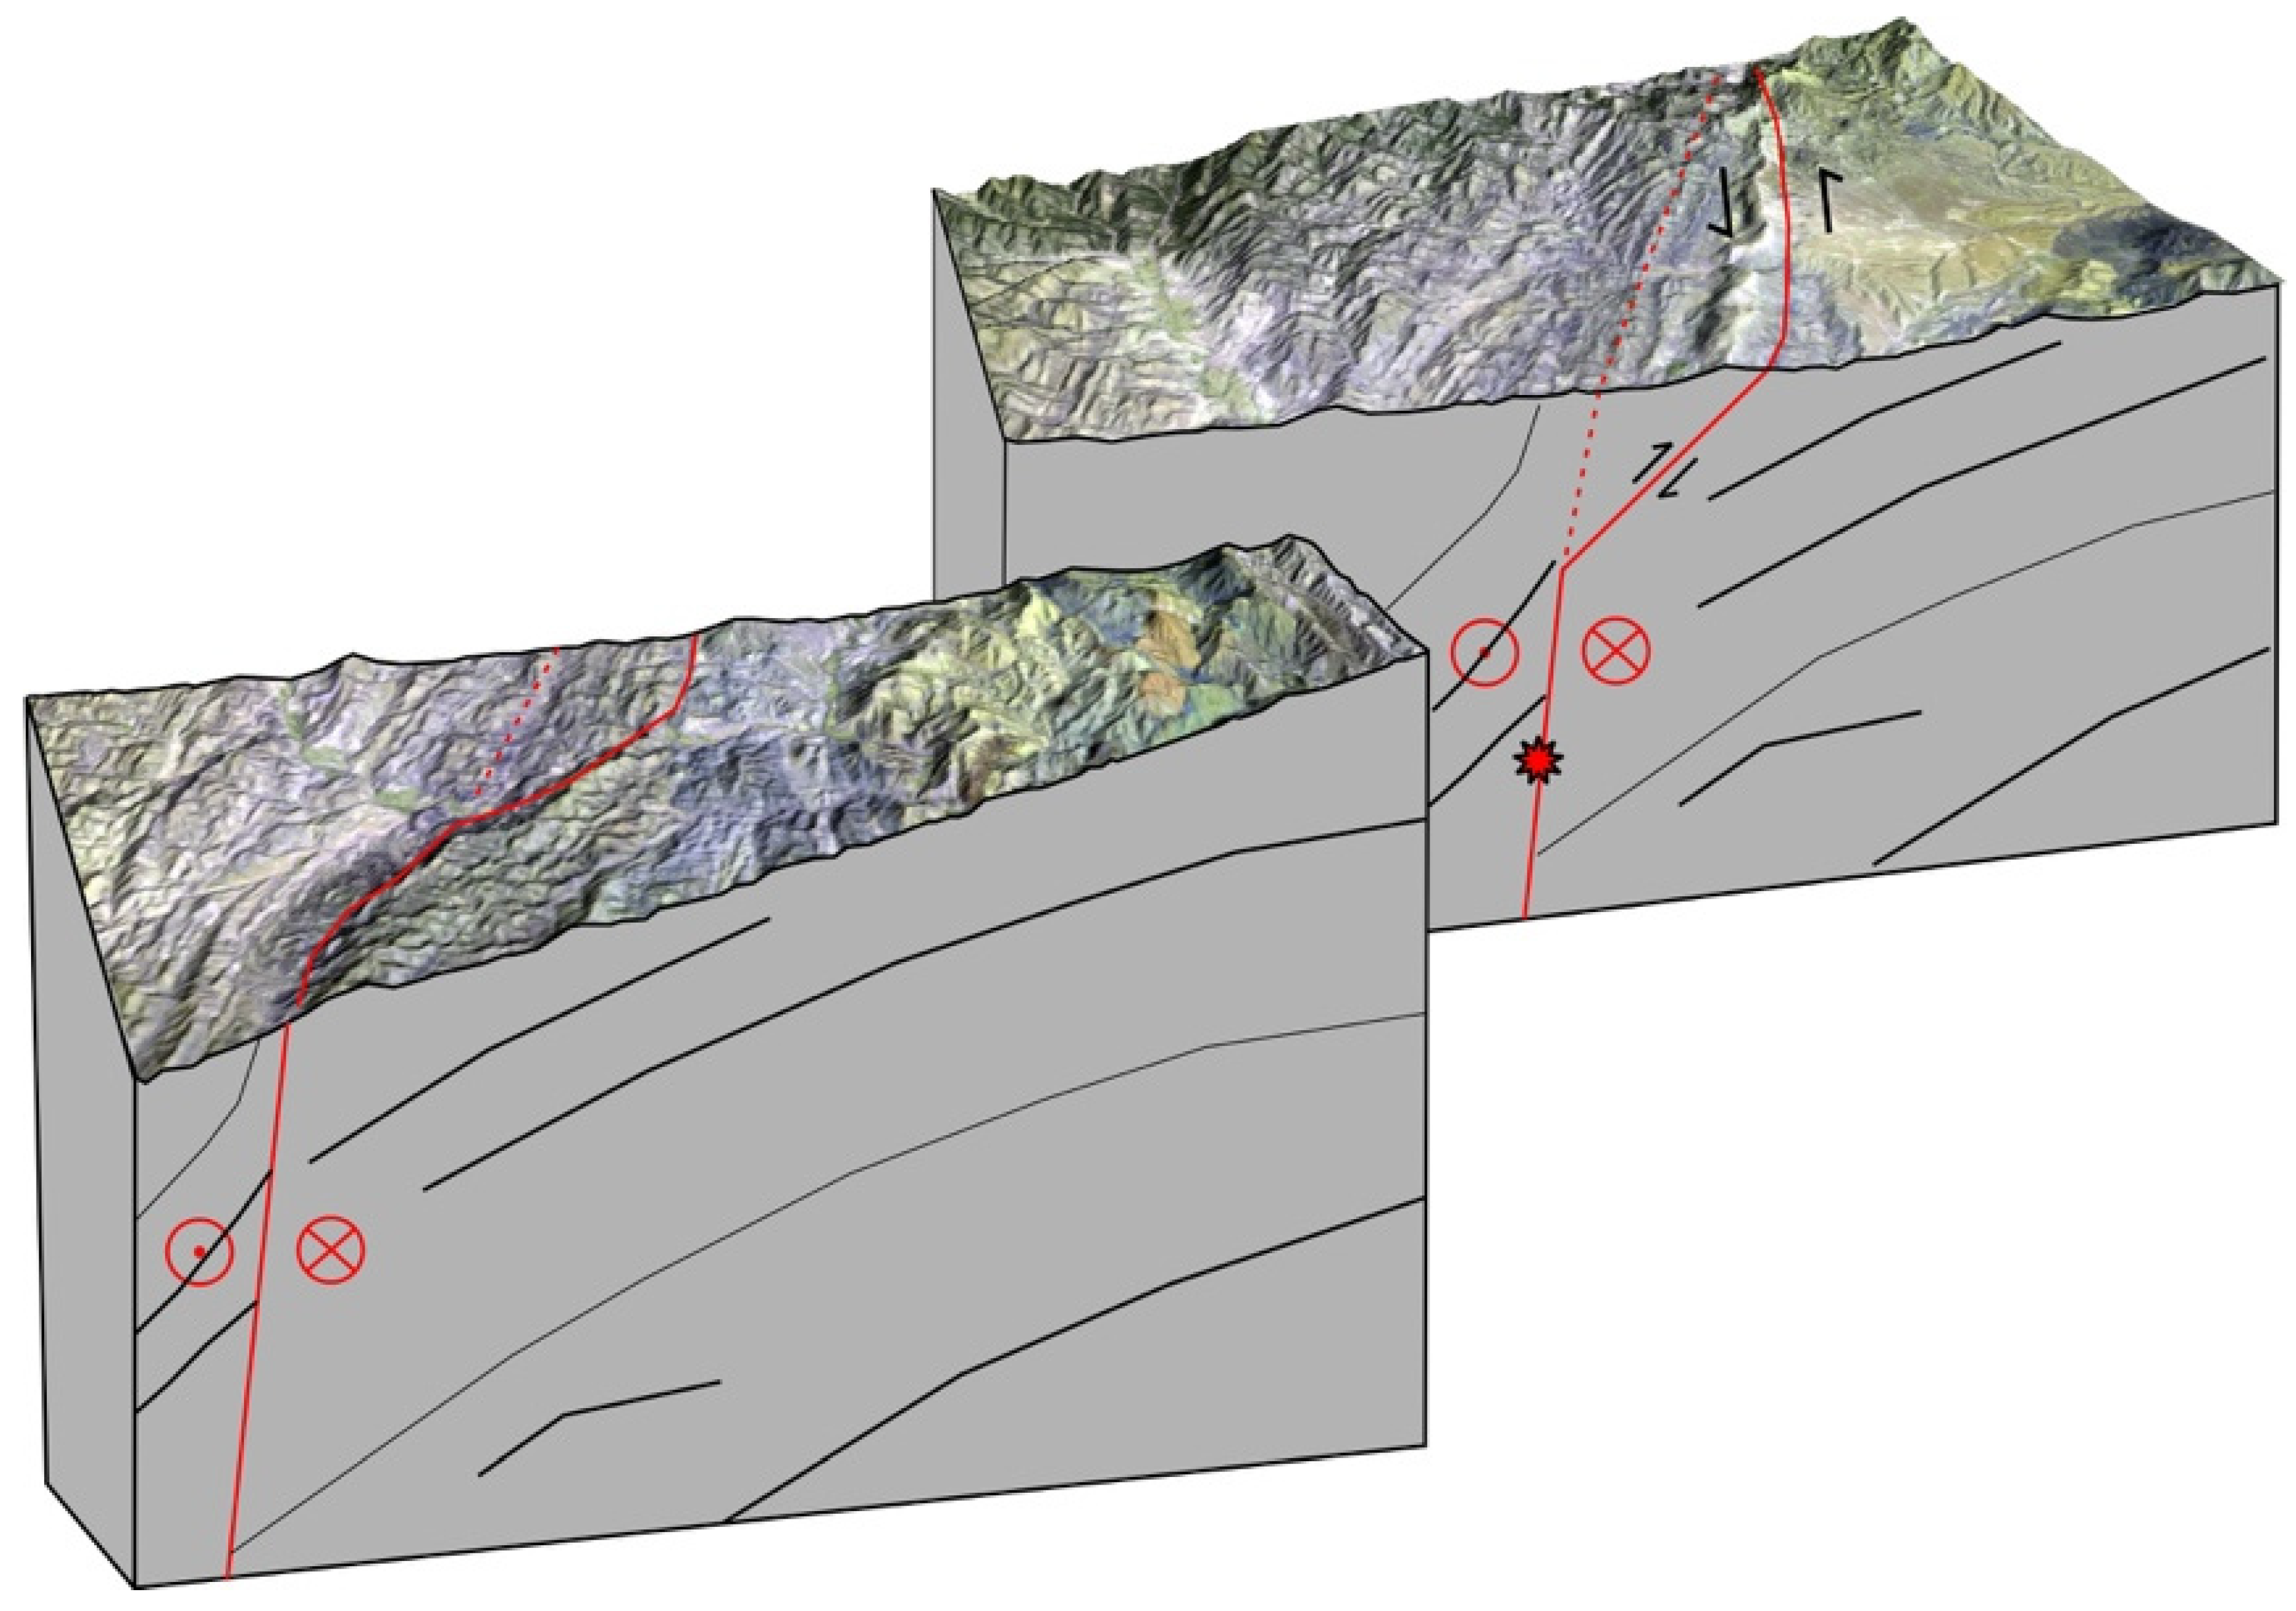
5. Discussion
6. Conclusions
Author Contributions
Funding
Data Availability Statement
Acknowledgments
Conflicts of Interest
List of Acronyms
| InSAR | Interferometric Synthetic Aperture Radar |
| LoS | Line-of-sight |
| AMF | Alburz Marmul fault |
| AF | Andrab fault |
| BTF | Bande Turkestan fault |
| CBF | Central Badakhshan fault |
| CF | Chaman fault |
| DMF | Dosi Mirzavalang fault |
| GF | Gardiz fault |
| HF | Herat fault |
| KF | Konar fault |
| MF | Mokur fault |
| SGF | Spin Ghar fault |
| SR | Salt Range |
| KB | Kashmir basin |
| PB | Peshawar basin |
| PP | Potwar plateau |
| SF | Sagaing fault |
| USGS | United States Geological Survey |
| GCMT | Global Centroid Moment Tensor |
| GFZ | GeoForschungsZentrum (Geo-Research Centre) |
| IPGP | Institut de Physique du Globe de Paris |
References
- Reynolds, K.; Copley, A.; Hussain, E. Evolution and dynamics of a fold-thrust belt: The Sulaiman Range of Pakistan. Geophys. J. Int. 2015, 201, 683–710. [Google Scholar] [CrossRef]
- Jouanne, F.; Pousse-Beltraltn, L.; Doin, M.P.; Bascou, P.; Thollard, F.; Ahmed, A. Current tectonic deformation of the Sulaiman range (Pakistan) with InSAR. Geophys. J. Int. 2025, 240, 2060–2075. [Google Scholar] [CrossRef]
- Ruleman, C.A.; Crone, A.J.; Machette, M.N.; Haller, K.M.; Rukstales, K.S. Map and Database of Probable and Possible Quaternary Faults of Afghanistan. U.S. Geological Survey Open-File Report 2007-1103. 2007. Available online: https://pubs.usgs.gov/of/2007/1103/downloads/pdf/of07-1103_508.pdf (accessed on 22 February 2024).
- Treloar, P.J.; Izatt, C.N. Tectonics of the Himalayan collision between the Indian plate and the Afghan block: A synthesis. Geol. Soc. Lond. Spec. Publ. 1993, 74, 69–87. [Google Scholar] [CrossRef]
- Mallapaty, S. Deadly Afghanistan quake challenges scientists trying to study it. Nature 2022, 607, 433. [Google Scholar] [CrossRef]
- Kufner, S.; Bie, L.; Gao, Y.; Lindner, M.; Waizy, H.; Kakar, N.; Rietbrock, A. The Devastating 2022 M6.2 Afghanistan Earthquake: Challenges, Processes, and Implications. Geophys. Res. Lett. 2023, 50, e2022GL102176. [Google Scholar] [CrossRef]
- Roy, P.; Martha, T.R.; Kumar, K.V.; Chauhan, P. Coseismic deformation and source characterisation of the 21 June 2022 Afghanistan earthquake using dual-pass DInSAR. Nat. Hazards 2023, 118, 843–857. [Google Scholar] [CrossRef]
- Lawrence, R.D.; Khan, S.H.; Nakata, T. Chaman Fault, Pakistan-Afghanistan. Ann. Tectonicae Spec. Issue Suppl. 1992, VI, 196–223. [Google Scholar]
- McCaffrey, R. Oblique plate convergence, slip vectors, and forearc deformation. J. Geophys. Res. 1992, 97, 8905–8915. [Google Scholar] [CrossRef]
- Yu, G.; Wesnousky, S.G.; Ekström, G. Slip partitioning along major convergent plate boundaries. Pure Appl. Geophys. 1993, 140, 183–210. [Google Scholar] [CrossRef]
- Bowman, D.; King, G.; Tapponnier, P. Slip Partitioning by Elastoplastic Propagation of Oblique Slip at Depth. Science 2003, 300, 1121–1123. [Google Scholar] [CrossRef]
- Crupa, W.E.; Khan, S.D.; Huang, J.; Khan, A.S.; Kasi, A. Active tectonic deformation of the western Indian plate boundary: A case study from the Chaman Fault System. J. Asian Earth Sci. 2017, 147, 452–468. [Google Scholar] [CrossRef]
- Szeliga, W.; Bilham, R.; Kakar, D.M.; Lodi, S.H. Interseismic strain accumulation along the western boundary of the Indian subcontinent. J. Geophys. Res. 2012, 117, B08404. [Google Scholar] [CrossRef]
- Dalaison, M.; Jolivet, R.; van Rijsingen, E.M.; Michel, S. The Interplay Between Seismic and Aseismic Slip Along the Chaman Fault Illuminated by InSAR. J. Geophys. Res. Solid Earth 2021, 126, e2021JB021935. [Google Scholar] [CrossRef]
- DeMets, C. Plate motions and crustal deformation. Rev. Geophys. 1995, 33, 365–369. [Google Scholar] [CrossRef]
- Bilham, R.; Gaur, V.K.; Molnar, P. Himalayan Seismic Hazard. Science 2001, 293, 1442–1444. [Google Scholar] [CrossRef]
- Banerjee, P.; Bürgmann, R.; Nagarajan, B.; Apel, E. Intraplate deformation of the Indian subcontinent. Geophys. Res. Lett. 2008, 35, L18301. [Google Scholar] [CrossRef]
- Dalaison, M.; Jolivet, R.; Le Pourhiet, L. A snapshot of the long-term evolution of a distributed tectonic plate boundary. Sci. Adv. 2023, 9, eadd7235. [Google Scholar] [CrossRef]
- Tapponnier, P.; Mattauer, M.; Proust, F.; Cassaigneau, C. Mesozoic ophiolites, sutures, and arge-scale tectonic movements in Afghanistan. Earth Planet. Sci. Lett. 1981, 52, 355–371. [Google Scholar] [CrossRef]
- Shnizai, Z. Active Tectonics and Seismic Hazard Assessment of Afghanistan and Slip-Rate Estimation of the Chaman Fault Based on Cosmogonic 10Be Dating. Ph.D. Thesis, Doshisha University, Kyoto, Japan, 2020; p. 126. [Google Scholar]
- Shnizai, Z.; Walker, R. Detailed Active Fault Map of the Spin Ghar Fault System and Related Seismicity in Eastern Afghanistan. Tektonika 2024, 2, 132–156. [Google Scholar] [CrossRef]
- Burbank, D.W.; Anderson, R.S. Tectonic Geomorphology; Blackwell: Kay County, OK, USA, 2011. [Google Scholar]
- Duvall, A.R.; Tucker, G.E. Dynamic Ridges and Valleys in a Strike-Slip Environment. J. Geophys. Res. Earth Surf. 2015, 120, 2016–2026. [Google Scholar] [CrossRef]
- Gill, H.S.; Singh, T.; Singh, S.; Kim, J.-R.; Caputo, R.; Kaur, G.; Singh, S.; Khosla, A. Active transfer faulting in the NW Sub-Himalaya (India) observed by space-borne topographic analyses. Quat. Int. 2021, 585, 15–26. [Google Scholar] [CrossRef]
- Massonnet, D.; Rossi, M.; Carmona, C.; Adragna, F.; Peltzer, G.; Feigl, K.; Rabaute, T. The displacement field of the Landers earthquake mapped by radar interferometry. Nature 1993, 364, 138–142. [Google Scholar] [CrossRef]
- Bürgmann, R.; Rosen, P.A.; Fielding, E.J. Synthetic Aperture Radar Interferometry to Measure Earth’s Surface Topography and Its Deformation. Annu. Rev. Earth Planet. Sci. 2000, 28, 169–209. [Google Scholar] [CrossRef]
- Costantini, M. A novel phase unwrapping method based on network programming. IEEE Trans. Geosci. Remote Sens. 1998, 36, 813–821. [Google Scholar] [CrossRef]
- Costantini, M.; Rosen, P.A. A generalized phase unwrapping approach for sparse data. In Proceedings of the IEEE 1999 International Geoscience and Remote Sensing Symposium. IGARSS’99 (Cat. No.99CH36293), Hamburg, Germany, 28 June–2 July 1999; pp. 267–269. [Google Scholar] [CrossRef]
- Monterroso, F.; Bonano, M.; De Luca, C.; Lanari, R.; Manunta, M.; Manzo, M.; Onorato, G.; Zinno, I.; Casu, F. A Global Archive of Coseismic DInSAR Products Obtained Through Unsupervised Sentinel-1 Data Processing. Remote Sens. 2020, 12, 3189. [Google Scholar] [CrossRef]
- Manzo, M.; Ricciardi, G.; Casu, F.; Ventura, G.; Zeni, G.; Borgström, S.; Berardino, P.; Del Gaudio, C.; Lanari, R. Surface deformation analysis in the Ischia Island (Italy) based on spaceborne radar interferometry. J. Volcanol. Geotherm. Res. 2006, 151, 399–416. [Google Scholar] [CrossRef]
- Casu, F.; Manconi, A. Four-dimensional surface evolution of active rifting from spaceborne SAR data. Geosphere 2016, 12, 697–705. [Google Scholar] [CrossRef]
- De Luca, C.; Zinno, I.; Manunta, M.; Lanari, R.; Casu, F. Large areas surface deformation analysis through a cloud computing P-SBAS approach for massive processing of DInSAR time series. Remote Sens. Environ. 2017, 202, 3–17. [Google Scholar] [CrossRef]
- Panchal, H.; Bahuguna, A.; Saraf, A.K.; Das, J. Thermal Anomaly, Co-Seismic Deformation and Seismic Source Pa-rameters Estimation of June 21 2022, Afghanistan Earthquake Employing InSAR Observations. Pure Appl. Geophys. 2023, 180, 2007–2022. [Google Scholar] [CrossRef]
- Qi, Y.; Feng, W.; Zhang, Y.; Wang, D.; Du, Y.; Samsonov, S.V.; Zhang, P.-Z.; Zaray, A.H.; Ansari, A. Fault Geometry, Slip Distribution, and Potential Triggering of the 2022 M w 6.2 Deadly Afghanistan Earthquake Revealed from Geodetic and Weather Data. Seismol. Res. Lett. 2023, 94, 2154–2166. [Google Scholar] [CrossRef]
- Dalal, P.; Senapati, B.; Kundu, B. Co-seismic surface displacement of the June 21, 2022 MW6 Khōst, Afghanistan earthquake from InSAR observations. Geod. Geodyn. 2024, 15, 201–208. [Google Scholar] [CrossRef]
- Wang, R.; Diao, F.; Hoechner, A. SDM-A geodetic inversion code incorporating with layered crust structure and curved fault geometry. EGU Gen. Assem. Conf. Abstr. 2013, 15, EGU2013-2411-1. [Google Scholar]
- Shnizai, Z.; Talebian, M.; Valkanotis, S.; Walker, R. Multiple Factors Make Afghan Communities Vulnerable to Earthquakes. Temblor. 2022. Available online: https://temblor.net/earthquake-insights/multiple-factors-make-afghan-communities-vulnerable-to-earthquakes-14301/ (accessed on 8 August 2024).
- Wang, H.; Liu, M.; Ye, J.; Cao, J.; Jing, Y. Strain partitioning and stress perturbation around stepovers and bends of strike-slip faults: Numerical results. Tectonophysics 2017, 721, 211–226. [Google Scholar] [CrossRef]
- Cowgill, E.; Yin, A.; Arrowsmith, J.R.; Feng, W.X.; Shuanhong, Z. The Akato Tagh bend along the Altyn Tagh fault, northwest Tibet 1: Smoothing by vertical-axis rotation and the effect of topographic stresses on bend-flanking faults. GSA Bull. 2004, 116, 1423–1442. [Google Scholar] [CrossRef]
- Garvue, M.M.; Spotila, J.A.; Cooke, M.L.; Curtiss, E.R. What Controls Early Restraining Bend Growth? Structural, Morphometric, and Numerical Modeling Analyses From the Eastern California Shear Zone. Tectonics 2024, 43, e2023TC008148. [Google Scholar] [CrossRef]
- Ye, J.; Liu, M.; Wang, H. A numerical study of strike-slip bend formation with application to the Salton Sea pull-apart basin. Geophys. Res. Lett. 2015, 42, 1368–1374. [Google Scholar] [CrossRef]
- Gabrielsen, R.H.; Giannenas, P.A.; Sokoutis, D.; Willingshofer, E.; Hassaan, M.; Faleide, J.I. Analogue experiments on releasing and restraining bends and their application to the study of the Barents Shear Margin. Solid Earth 2023, 14, 961–983. [Google Scholar] [CrossRef]
- Wang, D.; Elliott, J.R.; Zheng, G.; Wright, T.J.; Watson, A.R.; McGrath, J.D. Deciphering interseismic strain accumulation and its termination on the central-eastern Altyn Tagh fault from high-resolution velocity fields. Earth Planet. Sci. Lett. 2024, 644, 118919. [Google Scholar] [CrossRef]
- King, G.; Nábělek, J. Role of Fault Bends in the Initiation and Termination of Earthquake Rupture. Science 1985, 228, 984–987. [Google Scholar] [CrossRef]
- Avouac, J.-P.; Ayoub, F.; Wei, S.; Ampuero, J.-P.; Meng, L.; Leprince, S.; Jolivet, R.; Duputel, Z.; Helmberger, D. The 2013, Mw 7.7 Balochistan earthquake, energetic strike-slip reactivation of a thrust fault. Earth Planet. Sci. Lett. 2014, 391, 128–134. [Google Scholar] [CrossRef]


| Sensor | Primary-Secondary | Orbit | Track | Perpendicular Baseline [m] |
|---|---|---|---|---|
| Sentinel-1A | 6 June 2022–30 June 2022 18 June 2022–30 June 2022 | Ascending | 71 | −15.1934 −165.464 |
| 19 June 2022–1 July 2022 7 June 2022–1 July 2022 | Descending | 78 | −76.3265 −7.78262 |
| Parameters | USGS | GCMT | GFZ | IPGP | [33] | [34] | [35] | [6] | This Study |
| Epicentre | 33.02° N 69.46° E | 32.94° N 69.51° E | 33.10° N 69.5° E | 33.11° N 69.53° E | - | 69.46° N 32.99° E | - | 33.0° N 69.5° E | 33.01° N 69.46° E |
| Magnitude (Mw) | 6.02 | 6.2 | 6.1 | 6.2 | 5.99 | 6.32 | 6.18 | 6.18 | 6.2 |
| Strike | 204° | 202° | 104° | 220° | 218° | 203.7° | 216° | 212.75° | 214.41° |
| Dip | 87° | 57° | 89° | 70° | 72.8° | 68° | 61.9° | 72.04° | 80° |
| Rake | −11° | 10° | 165° | −3° | - | 6.9° | - | 14.08° | 24.9° |
| Depth (Km) | 11.5 | 15.5 | 10 | 6 | 7.1 | 2.5 | - | 4.92 | 3.56 |
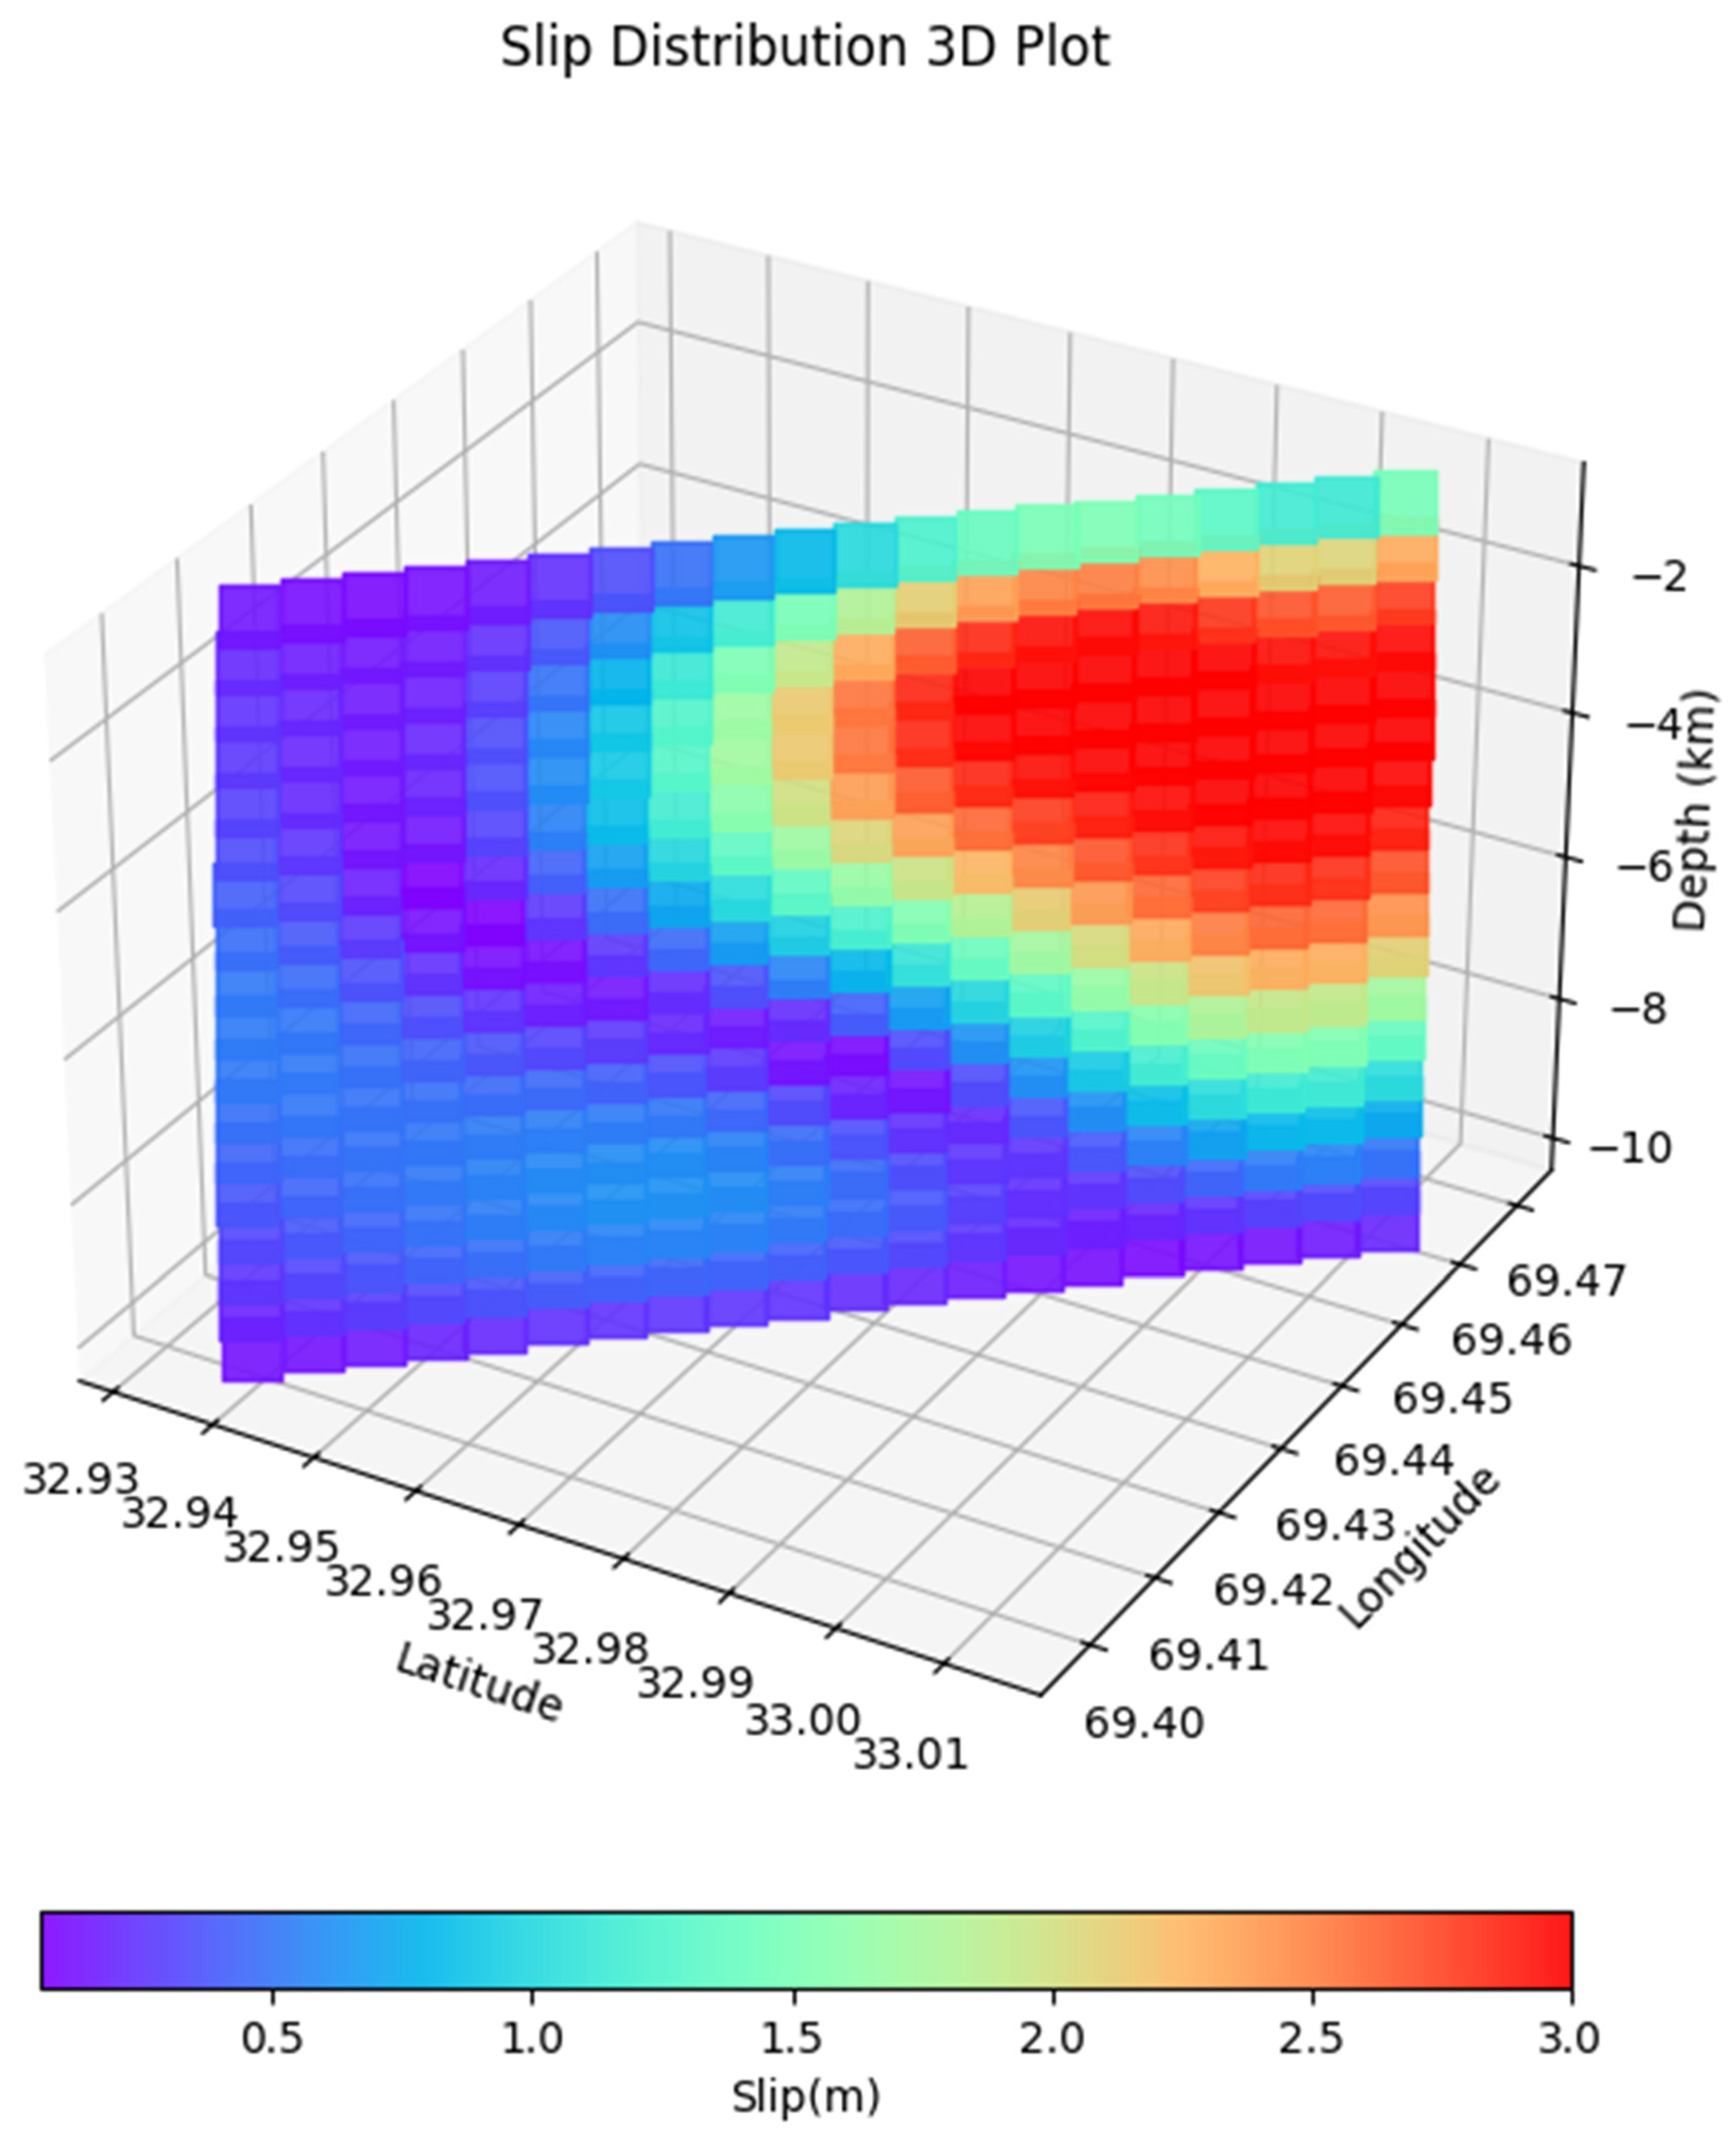
| Slip (m) | 0–1.5 | - | - | - | 1.05 | 0–3 | 0–2.26 | 1.91 | 0–3 |
| Length (Km) | - | - | - | - | 7.5 | 20 | - | 5.91 | 10.33 |
| Width (Km) | - | - | - | - | 6.0 | 12 | - | - | 9 |
| Latitude (degree) | 33.01 |
| Longitude (degree) | 69.46 |
| Magnitude | 6.2 |
| Depth (Km) | 3.56 |
| Length (Km) | 10.33 |
| Width (Km) | 9 |
| Strike (degree) | 214.41 |
| Dip (degree) | 80 |
| Mean slip (metre) | 1.08 |
| Max slip (metre) | 3 |
| Rake (degree) | 25 |
| Data–model correlation | 0.87 |
Disclaimer/Publisher’s Note: The statements, opinions and data contained in all publications are solely those of the individual author(s) and contributor(s) and not of MDPI and/or the editor(s). MDPI and/or the editor(s) disclaim responsibility for any injury to people or property resulting from any ideas, methods, instructions or products referred to in the content. |
© 2025 by the authors. Licensee MDPI, Basel, Switzerland. This article is an open access article distributed under the terms and conditions of the Creative Commons Attribution (CC BY) license (https://creativecommons.org/licenses/by/4.0/).
Share and Cite
Singh, T.; Nain, N.; Monterroso, F.; Caputo, R.; Striano, P.; Yadav, R.B.S.; Rajendran, C.P.; Sonkusare, A.G.; De Luca, C.; Lanari, R. The Afghanistan Earthquake of 21 June 2022: The Role of Compressional Step-Overs in Seismogenesis. Geosciences 2025, 15, 156. https://doi.org/10.3390/geosciences15040156
Singh T, Nain N, Monterroso F, Caputo R, Striano P, Yadav RBS, Rajendran CP, Sonkusare AG, De Luca C, Lanari R. The Afghanistan Earthquake of 21 June 2022: The Role of Compressional Step-Overs in Seismogenesis. Geosciences. 2025; 15(4):156. https://doi.org/10.3390/geosciences15040156
Chicago/Turabian StyleSingh, Tejpal, Nardeep Nain, Fernando Monterroso, Riccardo Caputo, Pasquale Striano, R. B. S. Yadav, Chittenipattu Puthenveettil Rajendran, Anil G. Sonkusare, Claudio De Luca, and Riccardo Lanari. 2025. "The Afghanistan Earthquake of 21 June 2022: The Role of Compressional Step-Overs in Seismogenesis" Geosciences 15, no. 4: 156. https://doi.org/10.3390/geosciences15040156
APA StyleSingh, T., Nain, N., Monterroso, F., Caputo, R., Striano, P., Yadav, R. B. S., Rajendran, C. P., Sonkusare, A. G., De Luca, C., & Lanari, R. (2025). The Afghanistan Earthquake of 21 June 2022: The Role of Compressional Step-Overs in Seismogenesis. Geosciences, 15(4), 156. https://doi.org/10.3390/geosciences15040156